Analysis of Mycotoxins in Peruvian Evaporated Cow Milk


Department of Organic and Pharmaceutical Chemistry, School of Pharmacy and Nutrition, University of Navarra, C/Irunlarrea 1, 31008 Pamplona, Navarra, Spain
*
Author to whom correspondence should be addressed.
Beverages 2018, 4(2), 34; https://doi.org/10.3390/beverages4020034
Submission received: 26 February 2018
/
Revised: 9 March 2018
/
Accepted: 4 April 2018
/
Published: 21 April 2018
(This article belongs to the Special Issue Mycotoxins in Beverages)
Abstract
:Mycotoxins—toxic secondary fungi metabolites—reach humans through food, producing several effects on their health and economic losses. Mycotoxin co-occurrence is common in food due to the co-presence of different fungi species, each of which may produce different toxins. A survey regarding the presence of 22 mycotoxins (aflatoxins M1, B1, B2, G1, G2; ochratoxins A and B; fumonisins B1, B2 and B3; HT-2 and T-2 toxins; nivalenol; deoxynivalenol; deepoxy-deoxynivalenol; 3 and 15 acetyl-deoxynivalenol; diacetoxyscirpenol; fusarenon X; neosolaniol; sterigmatocystin; and zearalenone) in 30 Peruvian evaporated cow milk samples is presented for the first time. Analysis was carried out by liquid chromatography coupled to tandem mass spectrometry, which was based on two previously validated methods for quantification of these toxic compounds in liquid cow milk, and further validated for the new matrix. The only detected mycotoxin was ochratoxin A, which was found in four samples, although at levels below its limit of quantification (0.2 ng/mL). This initial study indicates that the presence of mycotoxins in evaporated milk is low in Peru. However, we recommend the analysis of more samples and more milk types obtained from urban and rural areas, in order to obtain more data that will allow further risk assessments to be carried out.
Keywords:
mycotoxins; ochratoxin A; evaporated milk; Peru; LC–MS/MS; validation; food analysis; beverages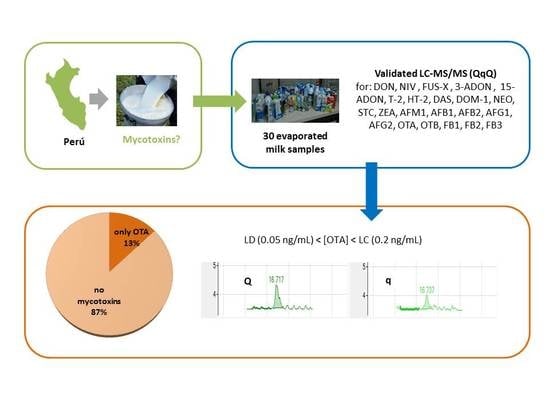
1. Introduction
Mycotoxins are toxic secondary fungi metabolites—produced mainly by Aspergillus, Penicillium and Fusarium genera—that contaminate crops and animal feed worldwide before and during harvest, and when the storing conditions are inadequate in terms of temperature and humidity [1].
Aflatoxins, mainly produced by Aspergillus parasiticus and A. flavus, are found in hot and humid climates. Fusarium species grow in a wide range of temperatures but only where there is relatively high water activity (aw > 0.9). In temperate climates, these species produce trichothecenes, and in moist cool conditions, they produce zearalenone [2,3]. Several Aspergillus and Penicillium species can produce ochratoxin A (OTA) in both animal feed and foodstuffs in different ecological niches [4]. The most likely scenario is co-contamination due to the simultaneous presence of different fungi species in a single raw material. Additionally, one type of fungi can produce different toxins.
Mycotoxins reach human and animals through food and animal feed, producing several effects on their health, along with economic losses [5,6,7,8]. Liquid cow milk can be contaminated if animals are fed with contaminated animal feed. The ruminal metabolism protects ruminants against mycotoxins; however, some toxins can pass through this barrier unchanged. In addition, with high mycotoxin contamination in animal feed or alterations in the ruminal metabolism, this barrier can be surpassed [6]. Aflatoxin M1 (AFM1) is one of the mycotoxins found in milk. A regulated maximum level for this mycotoxin has already been established, and this may be the reason why it is the most studied mycotoxin in milk. In the case of the American continent, at least 8.65% of the analyzed samples [9] failed to comply with US regulations regarding the presence of this mycotoxin in milk (0.5 µg/kg) [10]. This percentage would be higher if the European regulation was used as the reference (0.05 µg/kg) [11]. In addition, the occurrence of OTA; zearalenone (ZEA) and its metabolites; fumonisin B1 and B2 (FB1, FB2); deepoxy-deoxynivalenol (DOM-1); cyclopiazonic acid; and aflatoxins G1, G2, B1, B2, and M2 (AFG1, AFG2, AFB1, AFB2, AFM2) have also been detected in animal milk samples worldwide [9].
Peru has a great diversity of climates (28 out of the 32 existing climate types in the world), largely due to its tropical latitude, the presence of the Andes, and the presence of two ocean currents (Humboldt and El Niño). In addition, different heights and topography influence the generation of microclimates and precipitation variations, depending on the region [12]. The great Peruvian climatic diversity is conducive to a variety of fauna and flora, and consequently, to the development and growth of a broad spectrum of fungi. In fact, some problems with mycotoxin contamination in animal feeds and cereals have been described in some South American countries, including Peru [13,14]. Evaporated milk has become the preferred type of milk for consumers in Peru, having tripled its per capita consumption over the last 24 years [15]. In order to assure food safety, it is important to study the presence of toxic contaminants in milk samples; however, to the best of our knowledge, the presence of mycotoxins in milk has not been studied in this country. Only milk samples from the Arequipa region have been analyzed for AFM1 contamination [16]. This region accounts for 17.7% of the total Peruvian milk production [17].
This paper presents the results obtained from screening 22 mycotoxins in 30 Peruvian evaporated cow milk samples using liquid chromatography coupled to tandem mass spectrometry. Previously developed methods for the analysis of mycotoxins in cow milk were adapted and validated for the new matrix. This initial study indicates that the presence of mycotoxins in evaporated milk is low in Peru.
2. Materials and Methods
2.1. Reagents
Acetonitrile (ACN, HPLC grade) was provided by Merck (Darmstadt, Germany). Methanol (MeOH, LC–MS grade), formic acid (mass spectrometry grade, purity > 98%), ammonium formate (analytical grade), sodium acetate (anhydrous, HPLC grade > 99.0%), and mycotoxins (purity ≥ 98%) were purchased from Sigma-Aldrich (St. Louis, MO, USA). OTA was purchased in powder form; FB1, FB2, and fumonisin B3 (FB3) were dissolved in ACN:H2O (50:50) solution and all other mycotoxins were dissolved in ACN. Water (>18 MΩ/cm resistivity) was obtained from an Ultramatic Type I system Wasserlab (Navarra, Spain).
2.2. Mycotoxin Stock Solutions
All mycotoxins were handled in solution, using gloves and a face shield. To prevent photo-instability, low-light conditions were established when working with the mycotoxin solutions and samples. OTA was dissolved at concentration 1 mg/mL in MeOH, and the exact concentration was determined by UV spectrophotometry at 333 nm (UVIKON 922, Kontron Instruments SA, Madrid, Spain). All other mycotoxins were used directly from standard solutions. Three stock solutions were prepared by diluting selected volumes of each of the mycotoxin standard solutions in 10 mL of acetonitrile. Seven trichothecenes were included in stock solution 1: nivalenol (NIV), deoxynivalenol (DON), fusarenon X (FUS-X), neosolaniol (NEO), 3-acetyldeoxynivalenol (3-ADON), 15-acetyldeoxynivalenol (15-ADON), and diacetoxyscirpenol (DAS). AFB1, AFB2, AFG1, AFG2, AFM1, OTA, ochratoxin B (OTB), ZEA, sterigmatocystin (STC), DOM-1, HT-2 toxin (HT-2), and T-2 toxin (T-2) were included in stock solution 2. Finally, a third stock solution was prepared with FB1, FB2, and FB3. Two versions of stock solution 1 were prepared independently and injected the same day. The peak areas obtained for each mycotoxin in both solutions were compared in order to assure that they were correctly prepared. The same procedure was carried out in order to assure the adequate preparation of stock solutions 2 and 3. Stock solutions 1 and 2 were stored at −20 °C. Mycotoxin stability was previously determined in these same conditions [18,19]. Fumonisins were unstable in acetonitrile and therefore, stock solution 3 was prepared before use. Henceforth, mycotoxins in stock solution 1 will be referred to as mycotoxin group A, and those from stock solutions 2 and 3 will be referred to as mycotoxin group B. Table 1 shows the concentration of the mycotoxins in each stock solution.
2.3. Sample Collection
Thirty evaporated cow milk packages were purchased from supermarkets in Lima, Peru between 2013 and 2015. Table 2 shows the description of the sampling. At least one package was obtained from each one of the eight most popular brands available in Peru. Fifteen packages were from whole milk, fourteen were from semi-skimmed milk, and one was from skimmed milk. They were all kept at room temperature and protected from sunlight. No subsampling was carried out.
2.4. Instrumentation and Analytical Conditions
An Agilent Technologies (Waldbronn, Germany) 1200 LC system coupled to a 6410 Triple Quad (QqQ) LC-MS/MS system equipped with an electrospray ionization interface was used. The LC system consisted of a degasser (G1379B), a binary pump (G1312B), and an autosampler (G1367C) with a thermostat (G1330B) and a thermostatic column compartment (G1316B). An Ascentis Express C18 column (2.7 µm particle size, 150 × 2.1 mm) from Supelco Analytical (Bellefonte, PA, USA), maintained at 45 °C was used for separation purposes. The mobile phase consisted of 5 mM ammonium formate and 0.1% formic acid in water (solution A) and 5 mM ammonium formate and 0.1% formic acid in MeOH:H2O 95:5 (solution B) at 0.4 mL/min. Mycotoxin group A was eluted using a gradient program starting with 5% of B solution, in accordance with work carried out by Flores-Flores and González-Peñas [19], and the injection volume was 15 µL. Mycotoxins group B was analyzed in a different run, using a gradient program starting at 40% of B solution, in accordance with work carried out by Flores-Flores and González-Peñas [18], and the injection volume was 20 µL. In both cases, the chromatographic separation was carried out with gradient conditions, although with differences in terms of the rate for increasing the organic phase (B) percentage. MS conditions were as follows: a capillary voltage of 4000 V, nitrogen (high purity, 350 °C, 9 L/min, 40 psi) as drying gas, and the collision cell atmosphere was maintained with ultrahigh purity nitrogen 99.999% (Praxair, Spain). Data was collected by means of selected reaction monitoring (SRM). The MS parameters for identifying each mycotoxin were those previously used by our group [18,19].
2.5. Sample Preparation
Each package was analyzed once. Evaporated cow milk was diluted following the manufacturer’s recommendations for human consumption: (1:1). Five milliliters of evaporated cow milk were diluted with 5 mL of water. This solution was shaken for 15 min. Next, two aliquots of 1 mL of diluted milk were separated. Each aliquot was used for analyzing a group of mycotoxins (A or B). The extraction procedures were those previously reported by Flores-Flores and González-Peñas [18,19]. In both cases, the extraction was performed with ACN acidified with HCOOH. After agitation and centrifugation, the supernatant was transferred to another tube containing sodium acetate. After stirring and centrifuging, the upper phase was evaporated at 65 ºC to dryness. Finally, 200 µL of mobile phase was added: 5% B for mycotoxin group A and 40% B for mycotoxin group B; the residues were dissolved using vortex. Before LC–MS/MS analysis, the samples were filtered through polyvinylidene fluoride (PVDF) filters (0.45 µm) (Millipore Corporation, Burlington, MA, USA).
2.6. Calibration and Control Samples Preparation
Semi-skimmed evaporated cow milk (diluted with H2O 1:1) in which mycotoxins were not detected was spiked with mycotoxins and used as calibration or control samples. Appropriate volumes of the corresponding stock solutions were poured into polypropylene centrifuge tubes and dried (in the case of mycotoxin group A) or reduced to approximately 25 µL (in the case of mycotoxin group B). The solvent was evaporated under vacuum, at 65 °C (GeneVac evaporator, SP Scientific, England, UK). Next, 1 mL of reconstituted milk was added to each residue and mixed. The mixture was then set aside for 10 min before continuing with the procedure for sample preparation.
2.7. Method Validation for Mycotoxin Group B
Selectivity, limit of detection (LOD) and quantification (LOQ), linearity, precision, accuracy, recovery, and matrix effects were studied for method validation.
For selectivity, the intensity ratio in percentage (q/Q %), where q and Q correspond to the qualification and quantification product ions respectively, was calculated in standard samples (mycotoxins in mobile phase) and in calibration samples (mycotoxins in milk). In addition, the retention times of each mycotoxin in both sample types were compared (standard and calibration). The presence of these two products ions, with a difference of less than 15% in their intensity ratio and a difference of less than 0.5% in chromatographic retention times in standard and calibration samples, was chosen as the criterion for selectivity.
The LOD and LOQ for each mycotoxin of group B were determined by spiking reconstituted milk at different low concentration levels (three independent samples for each concentration level). LOQ was defined as the lowest concentration level with precision, as relative standard deviation (RSD) in % and accuracy (as relative error) values ≤20%; and LOD was defined as the lowest concentration level for which both product ions gave peaks with a signal-to-noise (S/N) ratio of at least 3.
To determine linearity, a matrix-matched calibration curve (with six calibration points) was prepared for each one of the mycotoxins on three different days (independent samples for each day). Evaluation criteria consisted of a slope value statistically different from 0 (p = 95%), a determination coefficient (R2) >0.99 and a relative error <15% (20% for the LOQ) for all the calibrators. The range of concentration in the determination of linearity for each mycotoxin was from LOQ to 10 × LOQ concentration levels.
Precision was calculated as RSD (%); accuracy was calculated as the percentage of relative error (%RE) between the nominal concentration value in the calibration sample and the concentration obtained using the calibration curve. Both parameters were studied in within-run and between-run conditions. Control milk samples at LOQ, 5 × LOQ and 10 × LOQ levels per triplicate (three independent samples) were prepared on one day (within-run conditions) and on three days (between-run conditions).
Recovery and matrix effect for mycotoxins group B were studied at LOQ, 5 × LOQ and 10 × LOQ concentration levels (three independent samples for each concentration level) in one day (within-run), following the methodology described in our previous work [18].
For assessing recovery, the ratio of the mycotoxin mean peak area obtained from milk samples spiked with mycotoxins to the mycotoxin mean peak area obtained in the spiked final acetonitrile extract (both at the same concentration) was calculated (in %). The acceptance criteria were those established in the Commission Regulation (EC) N° 401/2006 which establishes the methods of analysis for the official control of mycotoxin levels in foodstuffs [20].
Matrix effect (ME) was defined as the ratio (in percentage) of the mean mycotoxin peak area obtained when milk was spiked at the end of the sample treatment (final acetonitrile extract) to that obtained from mycotoxin diluted in mobile phase at 40% B (gradient initial composition), both at the same concentration. No matrix effect was considered if ME (%) was 100%; a signal was considered to be enhanced or suppressed if the values were higher or lower than 100%, respectively.
Mycotoxin stability was previously assessed in the injector tray and in freezing conditions. In the validation process for this new matrix, the stability of the mycotoxins in the injector tray for a period of 48 h was confirmed by comparing the mycotoxin concentration obtained at three levels (LOQ, 5 × LOQ, and 10 × LOQ) in control samples injected at 0 and 48 h. A relative error (%RE) <15% between the initial concentration value and the concentration value after 48 h in the injector tray for control samples was considered indicative of stability.
2.8. Statistical Analysis
For the comparison of matrix effect and recovery values when using different matrixes (Ultra-high temperature processing (UHT) cow milk and semi-skimmed evaporated cow milk), Levene’s test was used to study the equality of variances and Student’s t-test was used for independent samples in order to study the equality of means. A statistically significant difference was considered when the p-value was less than 0.05.
3. Results and Discussion
Initially, we performed a qualitative screening of the 22 mycotoxins in the 30 samples. We prepared control samples for mycotoxin groups A and B in diluted evaporated semi-skimmed evaporated cow milk at levels corresponding to LOQ and 10 × LOQ for each one of the mycotoxins. We analyzed the samples along with control samples every ten samples. No mycotoxins from group A were detected in any of the samples. With regard to mycotoxin group B, only OTA was detected in four semi-skimmed milk samples. To confirm the presence of OTA and quantify it in semi-skimmed evaporated cow milk, we carried out a validation in the new matrix of our previously validated method [18]. This procedure allowed quantification of mycotoxin group B in whole UHT cow milk, but a different composition of the matrix can cause different detector responses.
Table 3 shows the LOD and LOQ (the lowest value in the range) obtained, the validated range, the determination coefficient, and the slope and intercept values corresponding to one of the three prepared matrix-matched calibration curves for each mycotoxin in group B. In each case, the validated ranges were from LOQ to 10 × LOQ, R2 > 0.99 and the slopes were significantly different from 0. In addition, all the calibrators presented an RE <15% (20% LOQ). Moreover, the RE (%) of the q/Q ratio in both types of samples (calibration and standard) were <8% for all the mycotoxins.
We can expect low levels of mycotoxins in milk. Peruvian regulations regarding mycotoxins follow the Codex Alimentarius guideline limits [21] which state a maximum AFM1 content of 0.5 µg/kg in milk. There is no maximum permitted level established for other mycotoxins in this matrix. The European Union stated a more demanding legislation for AFM1 content in milk, establishing a maximum permitted level of 0.05 µg/kg. The validated method is capable of detecting AFM1 at this level. It is also capable of detecting other mycotoxins that have been found in milk worldwide, such as aflatoxins G1, G2, B1, B2 [22], ZEA [23,24,25], DOM-1 [26], FB1 [27,28] and OTA [24,29,30,31]; and others that have not been previously studied in milk such as OTB.
Precision and accuracy were less than 15%, except for LOQ, which was less than 20%. With respect to recovery, the RSDs (%) between levels were less than 12% for all mycotoxins. Recovery values for aflatoxins M1, G1, G2, B1 and B2, OTA, ZEA, T-2, HT-2, FB1 and FB2 concur with the performance criteria stated by the Commission Regulation (EC) N° 401/2006, which established the methods of analysis for the official control of mycotoxin levels in foodstuffs [20]. No regulation has been established for the other mycotoxins (DOM-1, OTB, FB3 and STC). However, all recovery values were between 61.2% and 83.9% (RSD < 12%), similar to the recovery values stated for the regulated mycotoxins.
With regard to matrix effects, a signal suppression was observed for all mycotoxins, with DOM-1, STC, and FB1 being the most affected. Matrix effects for each mycotoxin at different levels were very reproducible (%RSD was less than 9%) (Table 4).
After the analytical method validation for mycotoxin group B in semi-skimmed evaporated cow milk, a comparison can be made by applying the same sample preparation and analytical methodology to two types of milk, semi-skimmed evaporated cow milk (this study) and whole UHT milk [18], in order to study the effect of the matrix composition on validation results. We observed different behaviors for the mycotoxins in terms of their recoveries and matrix effects. While recovery values for almost all studied mycotoxins were significantly lower when they were extracted from semi-skimmed evaporated milk, the recovery values for fumonisins were significantly higher in this type of milk (p < 0.05) (Figure 1).
In terms of the matrix effects, no significant differences were observed when we extracted AFG2, T-2, ZEA, STC, and OTA from semi-skimmed evaporated cow milk compared to when these same mycotoxins were extracted from whole UHT cow milk. However, for the remaining 10 mycotoxins, the matrix effect values were significantly lower (p < 0.05) (Figure 2) [18].
Based on these results, it is clear that both the fat content and the composition of the different types of milk generate important differences in mycotoxin recoveries and matrix effects for each studied matrix, even if they are very similar to each other.
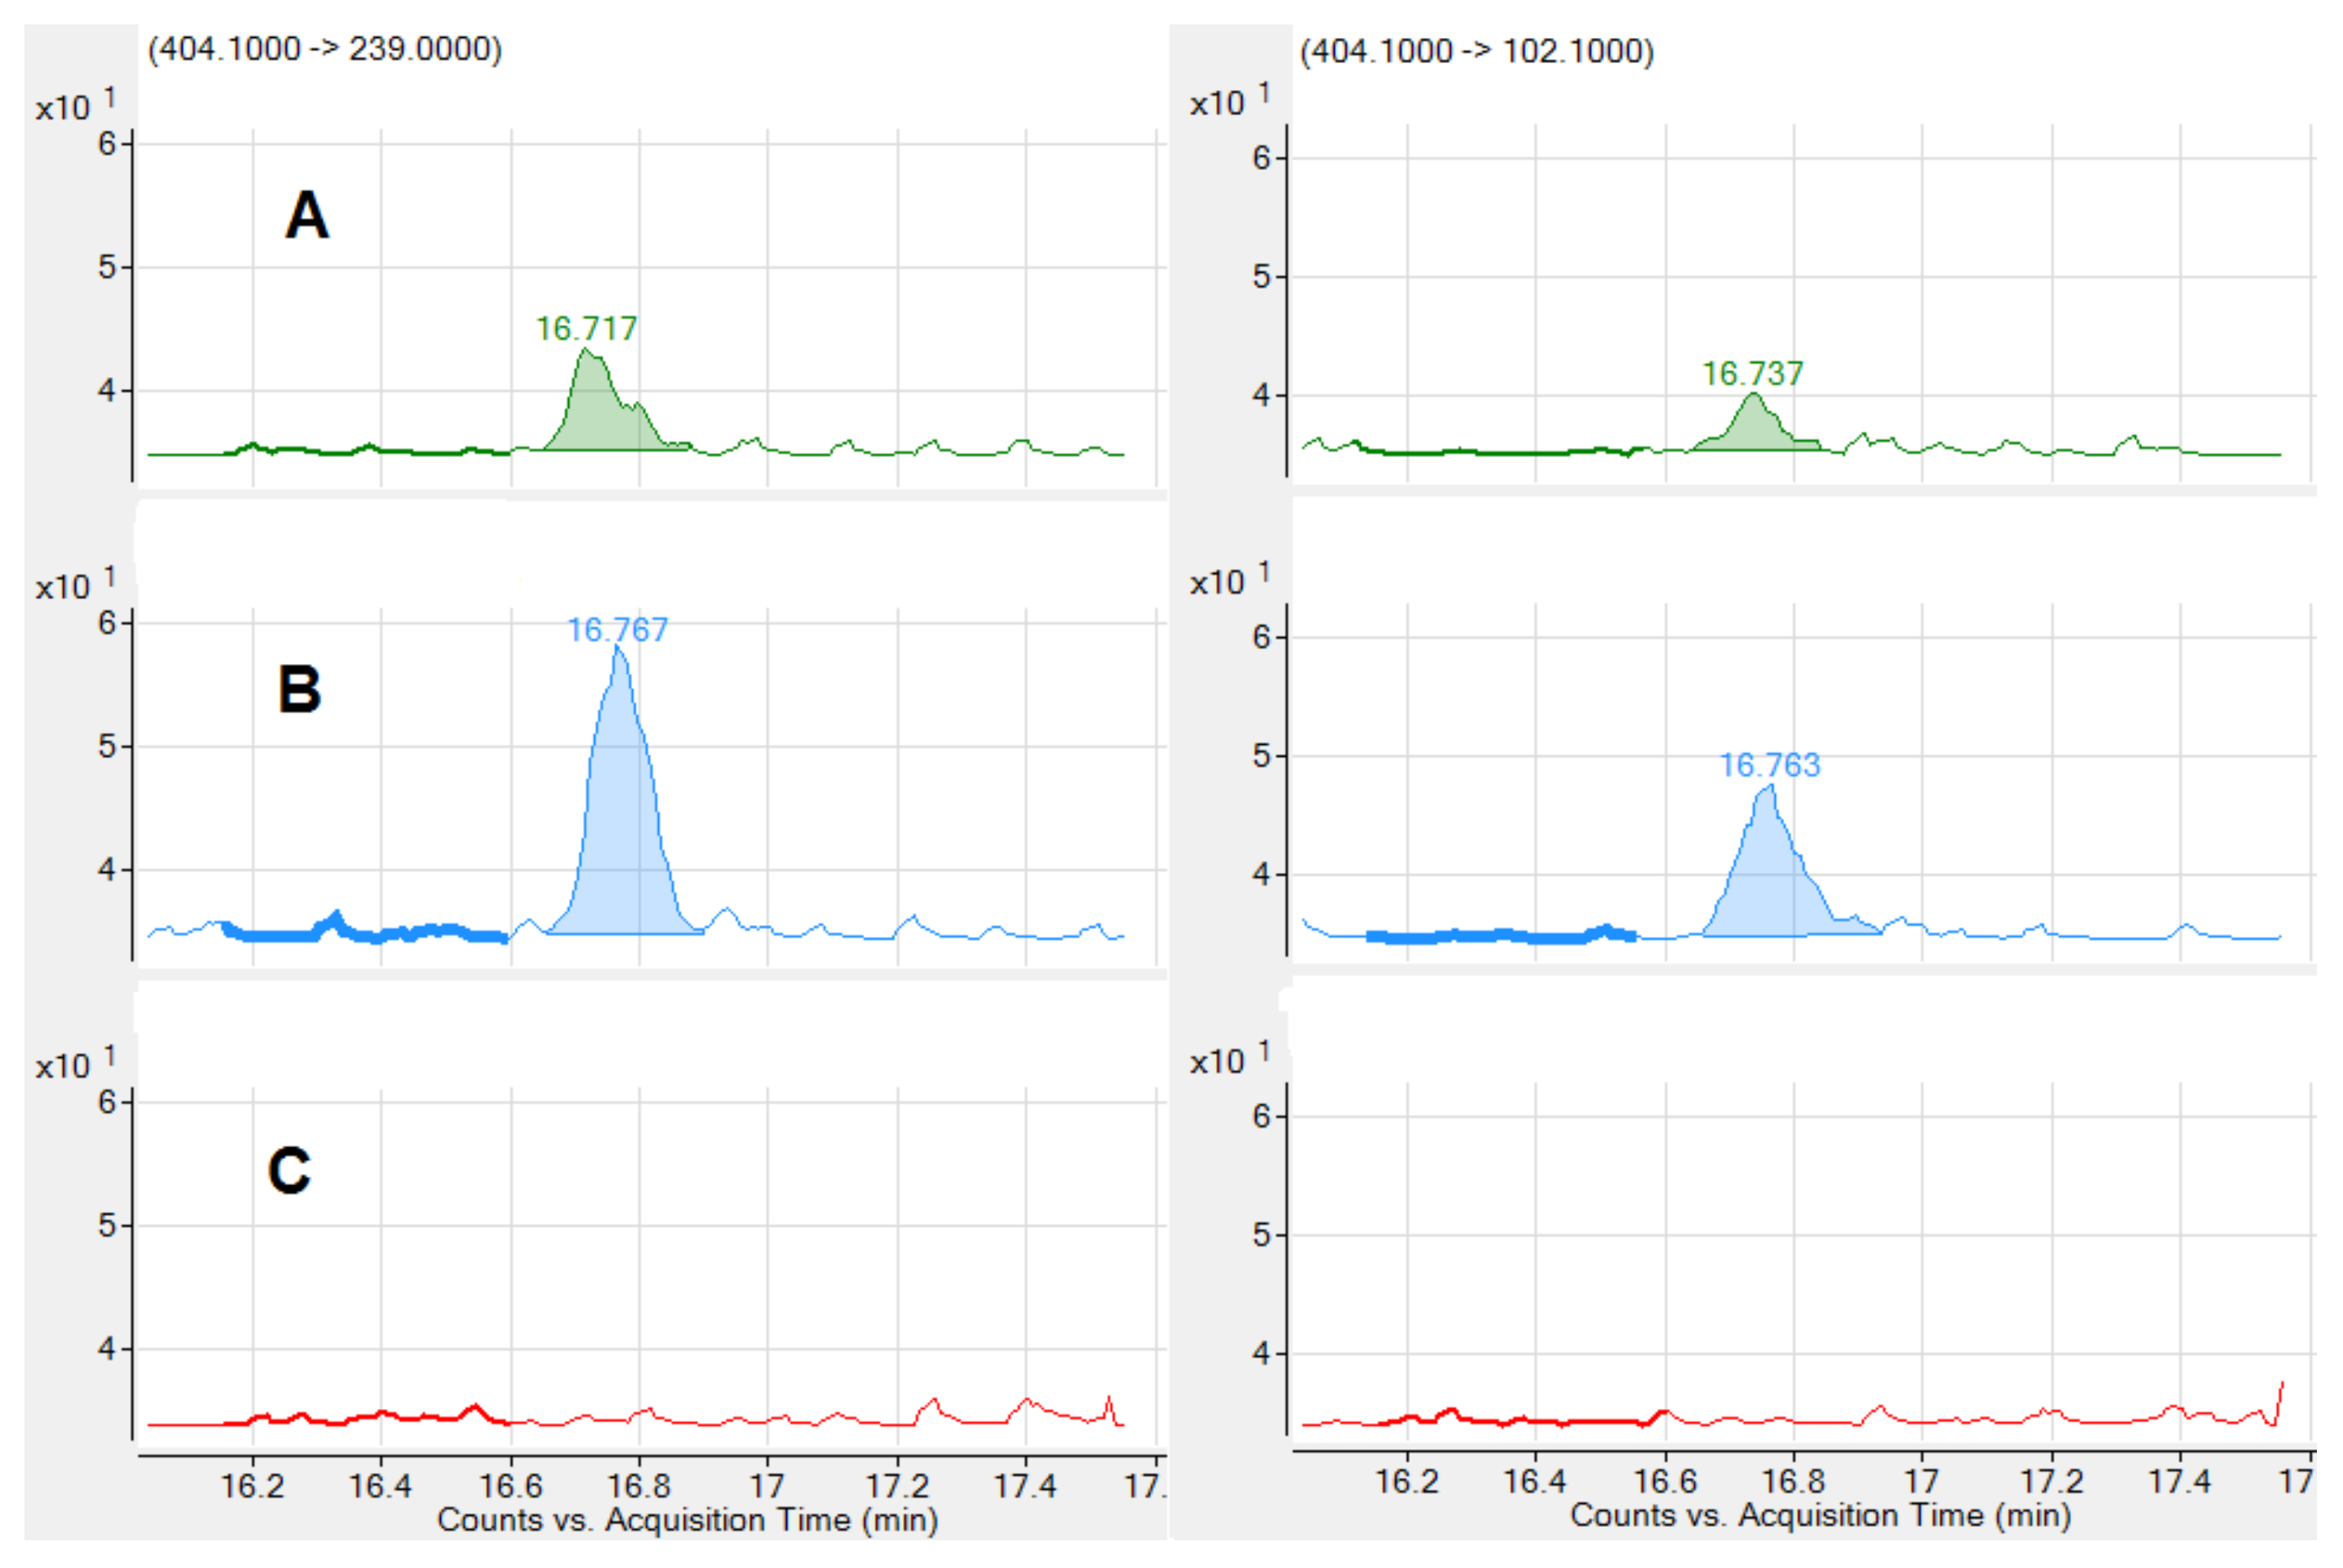
OTA presence was confirmed in the four samples when re-analyzed with the validated method. Qualification and quantification product ions were present in both real and control samples and the retention times of the mycotoxin peaks did not differ by more than 0.5%. OTA was present at levels between the LOD (0.05 ng/mL) and LOQ (0.2 ng/mL). Three of the positive samples corresponded to the same brand. Figure 3 shows examples of the chromatograms obtained for OTA in a naturally contaminated sample, a milk sample spiked at LOQ level, and a non-contaminated milk sample.
4. Conclusions
In this paper, we study the presence of 22 mycotoxins in 30 Peruvian evaporated cow milk samples. The applied method, validated for the matrix under study, is capable of quantifying AFM1 at levels established by the FDA and the European Union. Among all the analyzed mycotoxins (aflatoxins M1, B1, B2, G1, G2; ochratoxins A and B; fumonisins B1, B2 and B3; HT-2 and T-2 toxins; nivaleno; deoxynivalenol; deepoxy-deoxynivalenol; 3 and 15 acetyl-deoxynivalenol; diacetoxyscirpenol; fusarenon X; neosolaniol; sterigmatocystin; and zearalenone), OTA was detected in four milk samples but at low levels. Our study did not find other mycotoxins at levels above their LOD value. This initial study indicates that the presence of mycotoxins in evaporated milk is low in Peru; however, we recommend the analysis of more samples and more milk types obtained from urban and rural areas, in order to obtain more data that will allow further risk assessments to be carried out.
In addition, we have demonstrated the need for validated analytical methodologies for each one of the studied matrixes because composition changes, which depend on the type of milk, affect recoveries and matrix effects.
Acknowledgments
We thank the “Programa de Investigación Universidad de Navarra” (PIUNA) and “Gobierno de Navarra” (Project number 0011-1383-2016-000013 PC007 DOTCO) for financial support. M. Flores-Flores wishes to express her gratitude to the “Asociación de Amigos de la Universidad de Navarra” (ADA) for the grant funding.
Author Contributions
Elena González-Peñas conceived and designed the experiments; Myra Evelyn Flores-Flores performed the experiments; Elena González-Peñas and Myra Evelyn Flores-Flores analyzed the data and wrote the paper.
Conflicts of Interest
The authors declare no conflict of interest.
Abbreviations
15-ADON (15-acetyldeoxynivalenol), 3-ADON (3-acetyldeoxynivalenol), ACN (acetonitrile), AFM1 (aflatoxin M1), AFG1 (aflatoxin G1), AFG2 (aflatoxin G2), AFB1 (aflatoxin B1), AFB2 (aflatoxin B2) and AFM2 (aflatoxin M2), DOM-1 (deepoxy-deoxynivalenol), DON (deoxynivalenol), DAS (diacetoxyscirpenol), FB1 (fumonisin B1) FB2 (fumonisin B2), FB3 (fumonisin B3), FUS-X (fusarenon X), HT-2 (toxin HT-2), LOD (limit of detection), LOQ (limit of quantification), ME (matrix effect), MeOH (methanol), NEO (neosolaniol), NIV (nivalenol), OTA (ochratoxin A), OTB (ochratoxin B), STC (sterigmatocystin), T-2 (toxin T-2), QqQ (triple quadrupole), ZEA (zearalenone).
References
- Binder, E.M. Managing the risk of mycotoxins in modern feed production. Anim. Feed Sci. Technol. 2007, 133, 149–166. [Google Scholar] [CrossRef]
- EFSA. Opinion of the Scientific Panel on Contaminants in the Food Chain on a request from the Commission related to Aflatoxin B1 as undesirable substance in animal feed. EFSA J. 2004, 39, 1–27. [Google Scholar] [CrossRef]
- Marin, S.; Ramos, A.J.; Cano-Sancho, G.; Sanchis, V. Mycotoxins: Occurrence, toxicology, and exposure assessment. Food Chem. Toxicol. 2013, 60, 218–237. [Google Scholar] [CrossRef] [PubMed]
- Malir, F.; Ostry, V.; Pfohl-Leszkowicz, A.; Malir, J.; Toman, J. Ochratoxin A: 50 Years of Research. Toxins 2016, 8, 191. [Google Scholar] [CrossRef] [PubMed]
- Capriotti, A.L.; Caruso, G.; Cavaliere, C.; Foglia, P.; Samperi, R.; Laganà, A. Multiclass mycotoxin analysis in food, environmental and biological matrices with chromatography/mass spectrometry. Mass Spectrom. Rev. 2012, 31, 466–503. [Google Scholar] [CrossRef] [PubMed]
- Fink-Gremmels, J. Mycotoxins in cattle feeds and carry-over to dairy milk: A review. Food Addit. Contam. A 2008, 25, 172–180. [Google Scholar] [CrossRef] [PubMed]
- Hussein, H.S.; Brasel, J.M. Toxicity, metabolism, and impact of mycotoxins on humans and animals. Toxicology 2001, 167, 101–134. [Google Scholar] [CrossRef]
- Wu, F.; Groopman, J.D.; Pestka, J.J. Public health impacts of foodborne mycotoxins. Annu. Rev. Food Sci. Technol. 2014, 5, 351–372. [Google Scholar] [CrossRef] [PubMed]
- Flores-Flores, M.E.; Lizarraga, E.; López de Cerain, A.; González-Peñas, E. Presence of mycotoxins in animal milk: A review. Food Control 2015, 53, 163–176. [Google Scholar] [CrossRef]
- FDA Compliance Policy Guide, CPG Sec. 527.400 Whole Milk, Lowfat Milk, Skim Milk—Aflatoxin M1, U.S. Food and Drug Administration, 2015. Available online: http://www.fda.gov/ICECI/ComplianceManuals/CompliancePolicyGuidanceManual/ucm074482.htm (accessed on 22 February 2018).
- European Commission. Commission Regulation (EU) N° 165/2010 of 26 February 2010 Amending Regulation (EC) No 1881/2006 Setting Maximum Levels for Certain Contaminants in Foodstuffs as Regards Aflatoxins. OJL 2010, 50, 8–12. Available online: https://www.fsai.ie/uploadedFiles/Reg165_2010.pdf (accessed on 26 February 2018).
- Instituto Nacional de Innovación Agraria (INIA). Perú: National Report on the Status of Plant Genetic Resources for Agriculture and Food [Informe Nacional Sobre el Estado de los Recursos Fitogenéticos Para la Agricultura y la Alimentación]. Instituto Nacional de Innovación Agraria—INIA. Subdirección de Recursos Genéticos y Biotecnología (SUDIRGEB) 2009. Available online: http://www.fao.org/docrep/013/i1500e/Peru.pdf (accessed on 26 February 2018).
- Resnik, S.; Costarrica, M.L.; Pacin, A. Mycotoxins in Latin America and the Caribbean. Food Control 1995, 6, 19–28. [Google Scholar] [CrossRef]
- Rodrigues, I.; Naehrer, K. A three-year survey on the worldwide occurrence of mycotoxins in feedstuffs and feed. Toxins 2012, 4, 663–675. [Google Scholar] [CrossRef] [PubMed]
- MINAGRI. Livestock and Industrial Poultry Production 2013 [Producción Pecuaria e Industrial Avícola 2013]. Oficina de Estudios Económicos y Estadísticos. Ministerio de Agricultura y Riego (MINAGRI) 2014. Available online: http://siea.minag.gob.pe/siea/?q=produccion-pecuaria-e-industria-avicola (accessed on 26 February 2018).
- Ortiz, C. Analysis of Aflatoxin M1 in Fresh Milk from Dairy Farms in Arequipa. Rev. Investig. Vet. Perú 2009, 20, 139–141. Available online: http://dev.scielo.org.pe/scielo.php?script=sci_arttext&pid=S1609-91172009000100021&lng=en (accessed on 22 February 2018).
- MINAGRI. Livestock and Industrial Poultry Production 2014 [Producción Pecuaria y Avícola 2014]. Dirección General de Seguimiento y Evaluación de Políticas. Ministerio de Agricultura y Riego (MINAGRI), 2015. Available online: http://siea.Minag.gob.pe/siea/?q=produccion-pecuaria-e-industria-avicola (accessed on 26 February 2018).
- Flores-Flores, M.E.; González-Peñas, E. An LC–MS/MS method for multi-mycotoxin quantification in cow milk. Food Chem. 2017, 218, 378–385. [Google Scholar] [CrossRef] [PubMed]
- Flores-Flores, M.E.; González-Peñas, E. Development and validation of a high performance liquid chromatographic–mass spectrometry method for the simultaneous quantification of 10 trichothecenes in ultra-high temperature processed cow milk. J. Chromatogr. A 2015, 1419, 37–44. [Google Scholar] [CrossRef] [PubMed]
- European Commision. Commission Regulation (EC) No 401/2006 of 23 February 2006 Laying down the Methods of Sampling and Analysis for the Official Control of the Levels of Mycotoxins in Foodstuffs. Amended by Commission Regulations N° 178/2010 and 519/2014, 2006. Available online: https://www.fsvps.ru/fsvps-docs/ru/usefulinf/files/es401-2006.pdf (accessed on 26 February 2018).
- Food and Agriculture Organization of the United Nations (FAO). Worldwide Regulations for Mycotoxins in Food and Feed in 2003. FAO Food and Nutrition Paper 81. 2004. Available online: http://www.fao.org/docrep/007/y5499e/y5499e00.htm (accessed on 26 February 2018).
- Herzallah, S.M. Determination of aflatoxins in eggs, milk, meat and meat products using HPLC fluorescent and UV detectors. Food Chem. 2009, 114, 1141–1146. [Google Scholar] [CrossRef]
- El-Hoshy, S.M. Occurrence of zearalenone in milk, meat and their products with emphasis on influence of heat treatments on its level. Arch. Lebensmittelhyg. 1999, 50, 140–143. [Google Scholar]
- Huang, L.C.; Zheng, N.; Zheng, B.Q.; Wen, F.; Chen, J.B.; Han, R.W.; Xu, X.M.; Li, S.L.; Wang, J.Q. Simultaneous determination of aflatoxin M1, ochratoxin A, zearalenone and α-zearalenol in milk by UHPLC–MS/MS. Food Chem. 2014, 146, 242–249. [Google Scholar] [CrossRef]
- Scientific Co-operation on Questions relating to Food (SCOOP). Task 3.2.10 Collection of Occurrence Data of Fusarium Toxins in Food and Assessment of Dietary Intake by the Population of EU Member States. Subtask II: Zearalenone, 2003. Available online: https://ec.europa.eu/food/sites/food/files/safety/docs/cs_contaminants_catalogue_fusarium_task3210.pdf (accessed on 26 February 2018).
- Sørensen, L.K.; Elbæk, T.H. Determination of mycotoxins in bovine milk by liquid chromatography tandem mass spectrometry. J. Chromatogr. B 2005, 820, 183–196. [Google Scholar] [CrossRef] [PubMed]
- Gazzotti, T.; Lugoboni, B.; Zironi, E.; Barbarossa, A.; Serraino, A.; Pagliuca, G. Determination of fumonisin B1 in bovine milk by LC–MS/MS. Food Control 2009, 20, 1171–1174. [Google Scholar] [CrossRef]
- Maragos, C.M.; Richard, J.L. Quantitation and stability of fumonisins B1 and B2 in milk. J. AOAC Int. 1994, 77, 1162–1167. [Google Scholar] [PubMed]
- Boudra, H.; Barnouin, J.; Dragacci, S.; Morgavi, D.P. Aflatoxin M1 and ochratoxin A in raw bulk milk from French dairy herds. J. Dairy Sci. 2007, 90, 3197–3201. [Google Scholar] [CrossRef] [PubMed]
- Elzupir, A.O.; Makawi, S.Z.A.; Elhussein, A.M. Determination of aflatoxins and ochratoxin A in dairy cattle feed and milk in Wad Medani, Sudan. J. Anim. Vet. Adv. 2009, 8, 2508–2511. [Google Scholar]
- Pattono, D.; Gallo, P.F.; Civera, T. Detection and quantification of Ochratoxin A in milk produced in organic farms. Food Chem. 2011, 127, 374–377. [Google Scholar] [CrossRef]
Figure 1.
Mean recovery values (with standard deviation) for mycotoxins when extracted from whole ( ![Beverages 04 00034 i001]() ) [18] and semi-skimmed evaporated milk (
) [18] and semi-skimmed evaporated milk ( ![Beverages 04 00034 i002]() ).
).
 ) [18] and semi-skimmed evaporated milk (
  ).
).
Figure 1.
Mean recovery values (with standard deviation) for mycotoxins when extracted from whole ( ![Beverages 04 00034 i001]() ) [18] and semi-skimmed evaporated milk (
) [18] and semi-skimmed evaporated milk ( ![Beverages 04 00034 i002]() ).
).
) [18] and semi-skimmed evaporated milk ( ).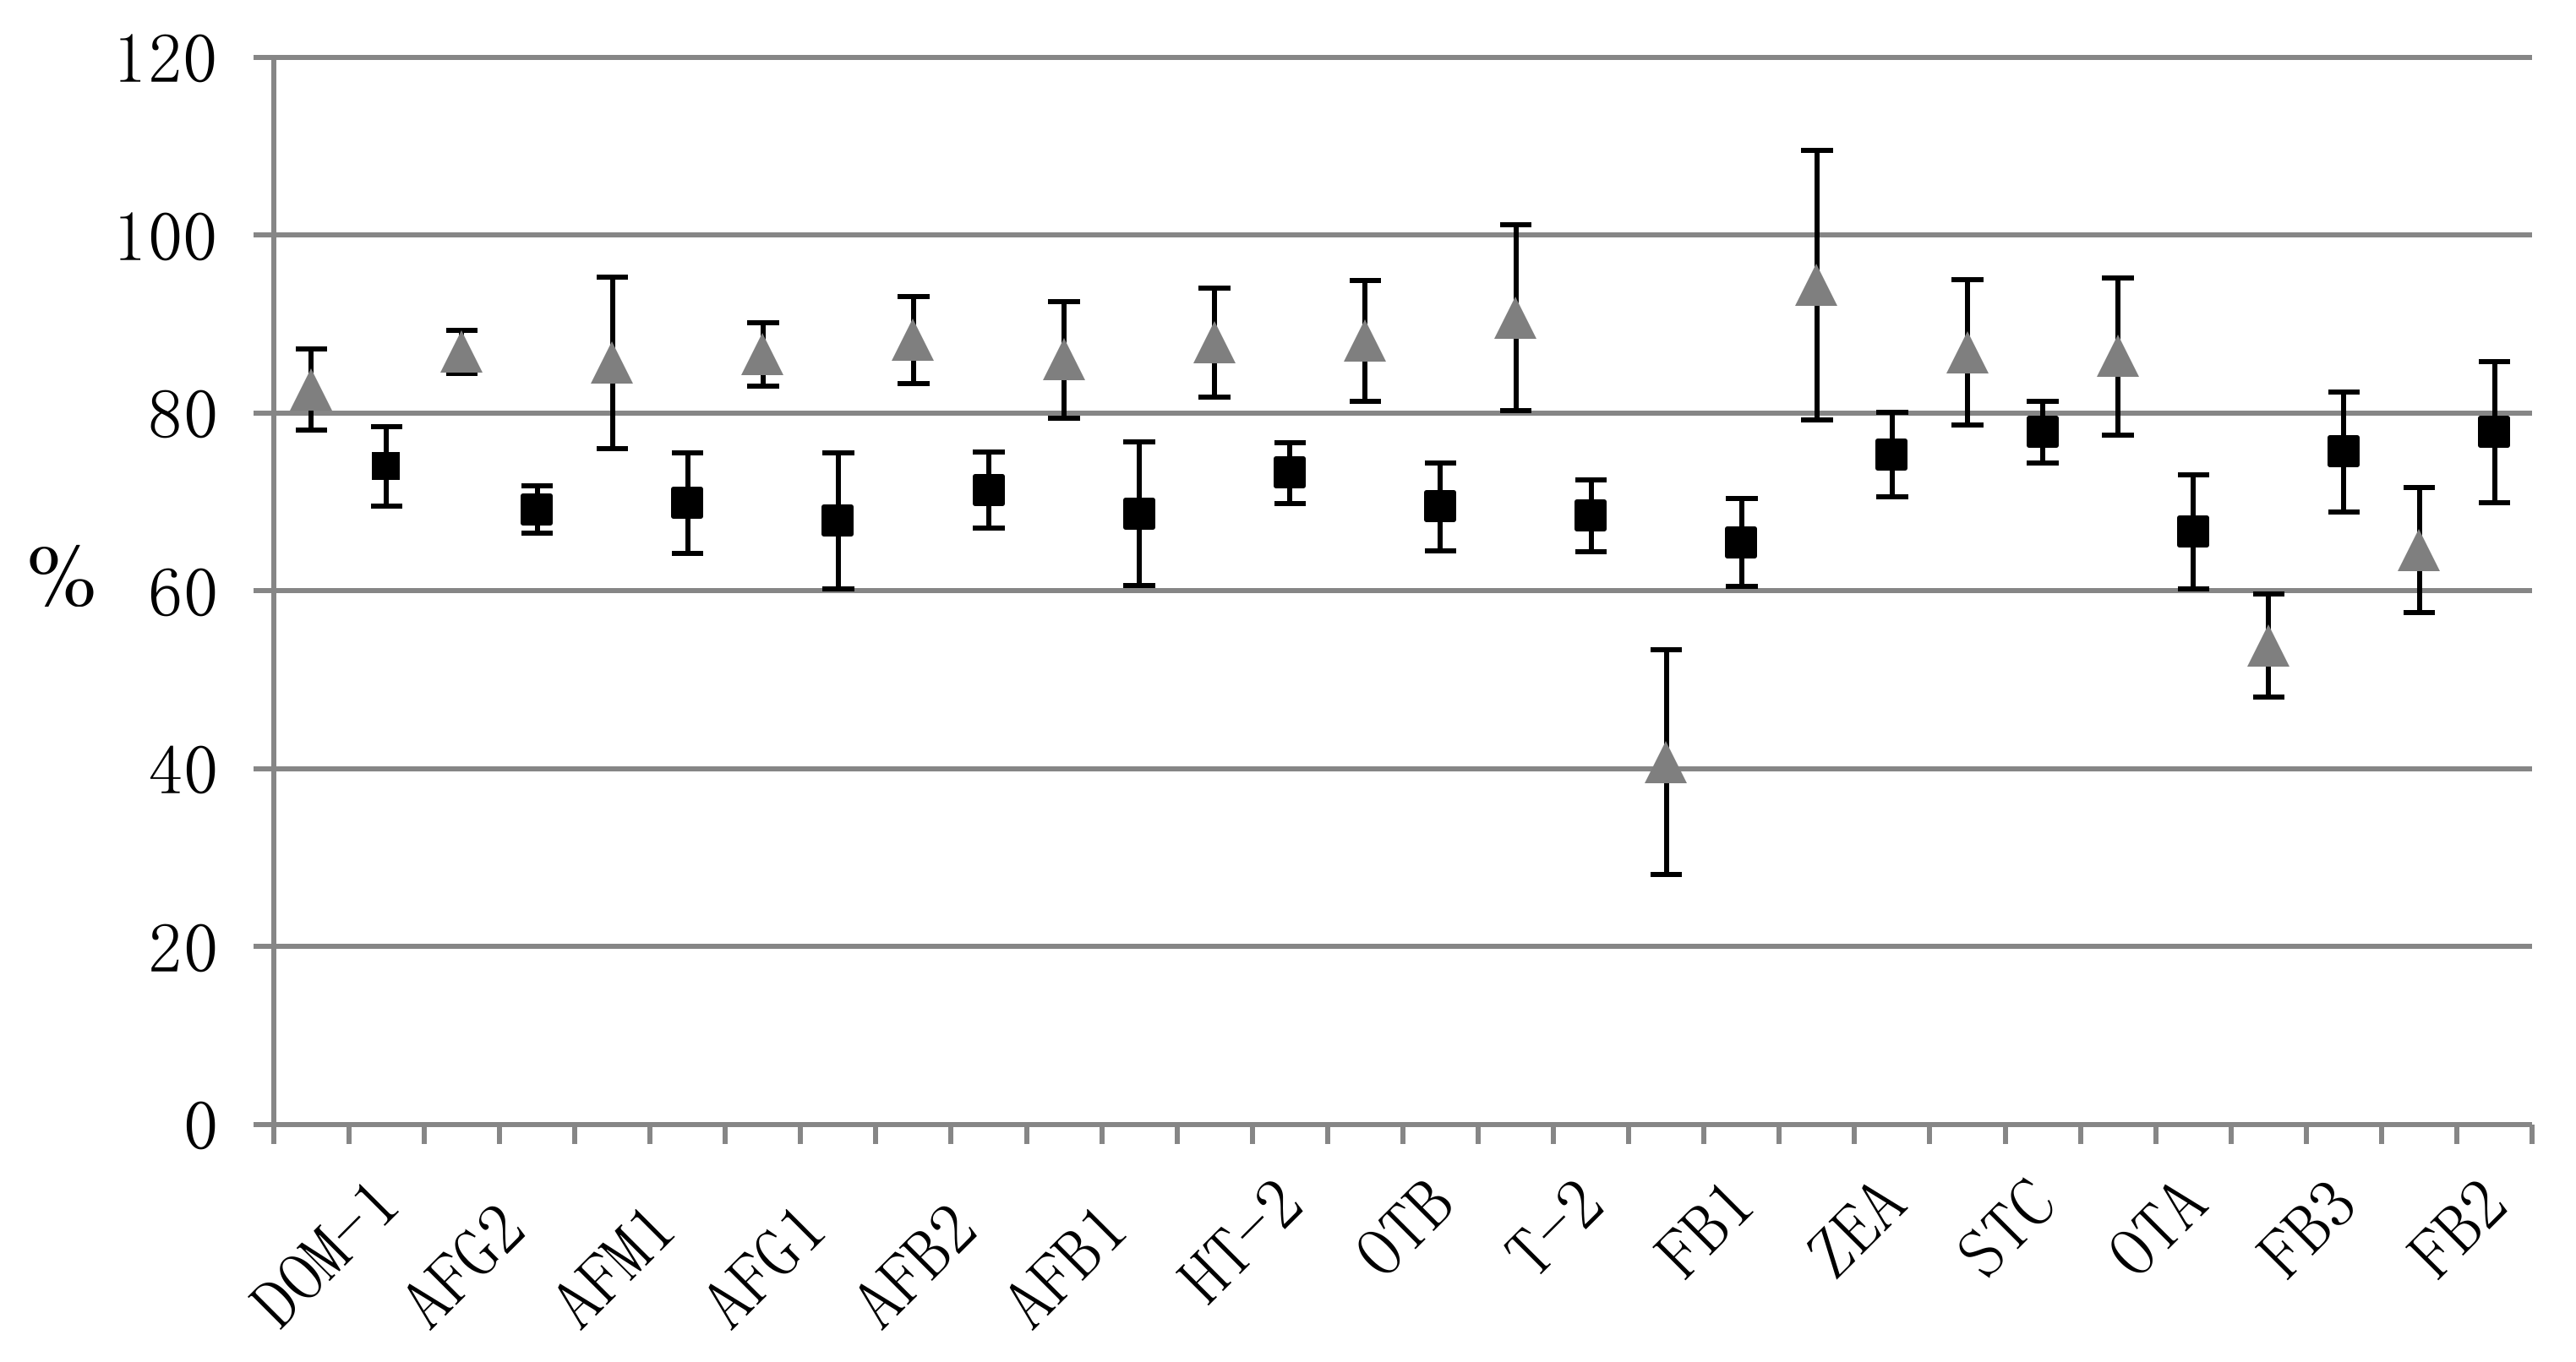
Figure 2.
Mean matrix effect values (with standard deviation) for mycotoxins when extracted from whole ( ![Beverages 04 00034 i001]() ) [18] and semi-skimmed evaporated milk (
) [18] and semi-skimmed evaporated milk ( ![Beverages 04 00034 i002]() ).
).
) [18] and semi-skimmed evaporated milk ( ).
Figure 2.
Mean matrix effect values (with standard deviation) for mycotoxins when extracted from whole ( ![Beverages 04 00034 i001]() ) [18] and semi-skimmed evaporated milk (
) [18] and semi-skimmed evaporated milk ( ![Beverages 04 00034 i002]() ).
).
) [18] and semi-skimmed evaporated milk ( ).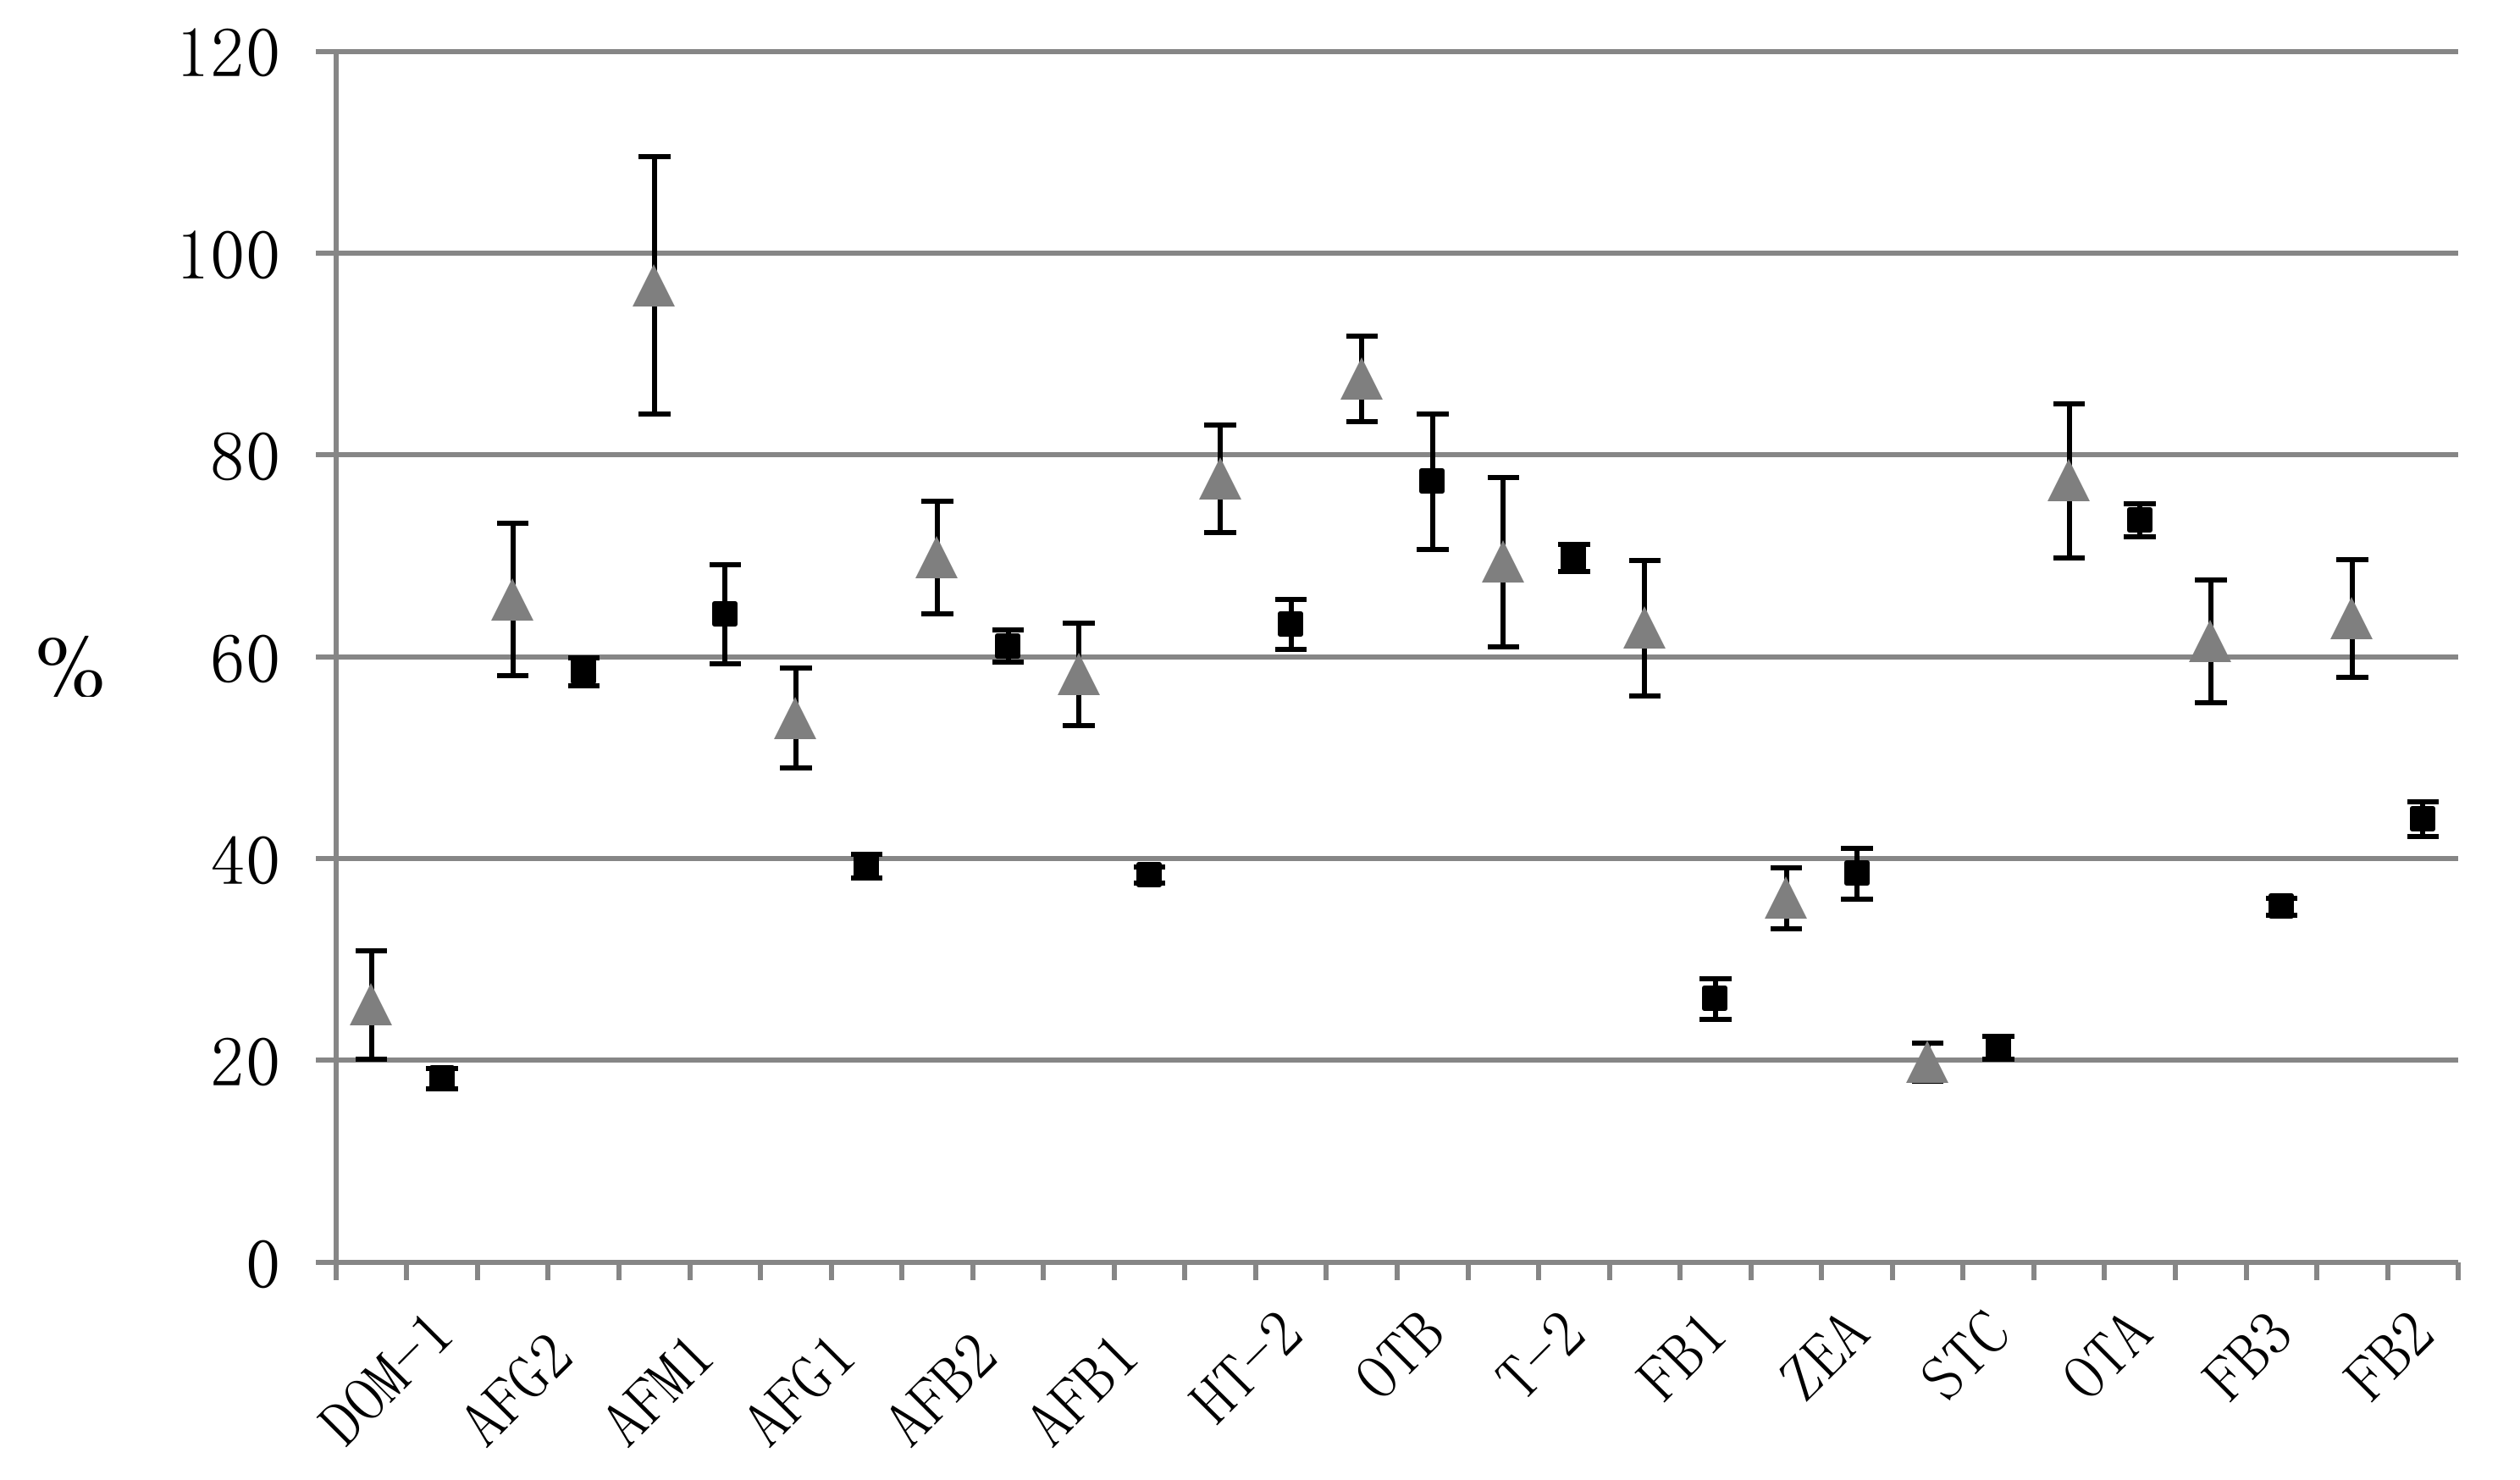
Figure 3.
Extracted OTA chromatograms (left: quantification and right: qualification transitions) in a naturally contaminated milk sample (A), a fortified milk sample at LOQ (B), and a non-contaminated milk sample (C).
Figure 3.
Extracted OTA chromatograms (left: quantification and right: qualification transitions) in a naturally contaminated milk sample (A), a fortified milk sample at LOQ (B), and a non-contaminated milk sample (C).


Table 1.
Concentration of each mycotoxin in the mixed stock solutions 1, 2, and 3.
| Mixed Stock Solution 1 | Mixed Stock Solution 2 | Mixed Stock Solution 3 | |||
|---|---|---|---|---|---|
| Mycotoxin | ng/mL | Mycotoxin | ng/mL | Mycotoxin | ng/mL |
| NIV | 1011.4 | DOM-1 | 151.5 | FB1 | 507.0 |
| DON | 251.3 | AFG2 | 7.5 | FB3 | 125.0 |
| FUS-X | 185.0 | AFM1 | 2.5 | FB2 | 125.0 |
| NEO | 10.0 | AFG1 | 5.1 | ||
| 3-ADON | 50.2 | AFB2 | 2.0 | ||
| 15-ADON | 101.1 | AFB1 | 2.0 | ||
| DAS | 8.0 | HT-2 | 20.1 | ||
| OTB | 2.5 | ||||
| T-2 | 2.5 | ||||
| ZEA | 25.5 | ||||
| STC | 25.1 | ||||
| OTA | 10.0 | ||||
NIV (nivalenol), DON (deoxynivalenol), FUS-X (fusarenon X), NEO (neosolaniol), 3-ADON (3-acetyldeoxynivalenol), 15-ADON (15-acetyldeoxynivalenol), DAS (diacetoxyscirpenol), DOM-1 (deepoxy-deoxynivalenol), AFG2 (aflatoxin G2), AFM1 (aflatoxin M1), AFG1 (aflatoxin G1), AFB2 (aflatoxin B2), AFB1 (aflatoxin B1), HT-2 (toxin HT-2), OTB (ochratoxin B), T-2 (toxin T-2), ZEA (zearalenone), STC (sterigmatocystin), OTA (ochratoxin A), FB1 (fumonisin B1), FB3 (fumonisin B3), FB2 (fumonisin B2).
Table 2.
Description of the sample collection. All the samples (commercial evaporated cow milk) were collected in Lima, Peru.
Table 2.
Description of the sample collection. All the samples (commercial evaporated cow milk) were collected in Lima, Peru.
| Number | Amount (g) | Presentation | Year | Comments |
|---|---|---|---|---|
| 1 | 400 | tetrabrik | 2015 | evaporated semi-skimmed milk 0% Lactose |
| 2 | 500 | tetrabrik | 2015 | evaporated semi-skimmed milk with DHA * for children |
| 3 | 520 | tetrabrik | 2015 | evaporated semi-skimmed milk |
| 4 | 500 | tetrabrik | 2015 | evaporated semi-skimmed milk |
| 5 | 400 | tetrabrik | 2015 | evaporated whole cream milk |
| 6 | 400 | bag | 2015 | evaporated whole cream milk |
| 7 | 170 | can | 2015 | evaporated semi-skimmed milk with DHA for children |
| 8 | 170 | can | 2015 | evaporated semi-skimmed milk 0% Lactose |
| 9 | 170 | can | 2015 | evaporated whole cream milk |
| 10 | 410 | can | 2015 | evaporated skimmed milk |
| 11 | 410 | can | 2015 | evaporated whole cream milk with Ca and Fe |
| 12 | 400 | can | 2014 | evaporated whole cream milk |
| 13 | 410 | can | 2015 | evaporated semi-skimmed milk |
| 14 | 410 | can | 2015 | evaporated whole cream milk |
| 15 | 400 | can | 2015 | evaporated semi-skimmed milk with DHA |
| 16 | 410 | can | 2015 | evaporated semi-skimmed milk for children |
| 17 | 410 | can | 2015 | evaporated semi-skimmed milk for babies |
| 18 | 165 | can | 2013 | evaporated whole cream milk |
| 19 | 170 | can | 2013 | evaporated semi-skimmed milk |
| 20 | 165 | can | 2014 | evaporated whole cream milk |
| 21 | 170 | can | 2013 | evaporated whole cream milk |
| 22 | 165 | can | 2014 | evaporated whole cream milk |
| 23 | 170 | can | 2015 | evaporated whole cream milk |
| 24 | 165 | can | 2015 | evaporated whole cream milk |
| 25 | 165 | can | 2015 | evaporated whole cream milk |
| 26 | 400 | tetrabrik | 2015 | evaporated whole cream milk |
| 27 | 400 | tetrabrik | 2015 | evaporated whole cream milk for children |
| 28 | 500 | tetrabrik | 2014 | evaporated semi-skimmed milk |
| 29 | 250 | tetrabrik | 2015 | evaporated semi-skimmed milk |
| 30 | 410 | can | 2015 | evaporated semi-skimmed milk with DHA for children |
* DHA: Docosahexaenoic acid.
Table 3.
Retention times, linear range, LOD, and regression data for a typical calibration curve, and the relative intensities of mycotoxin product ions.
Table 3.
Retention times, linear range, LOD, and regression data for a typical calibration curve, and the relative intensities of mycotoxin product ions.
| tR (min) | Mycotoxin | Range (ng/mL) | LOD (ng/mL) | R2 | Slope (Confidence Interval 95%) | Intercept | q/Q Sample % | q/Q Standard % | |
|---|---|---|---|---|---|---|---|---|---|
| 1.52 | DOM-1 | 3.03–30.3 | 0.758 | 0.9994 | 79.6 | (77.5, 81.8) | 63.8 | 89 | 93 |
| 2.71 | AFG2 | 0.15–1.50 | 0.038 | 0.9975 | 2229.9 | (2146.6, 2313.3) | −50.7 | 75 | 74 |
| 2.84 | AFM1 | 0.05–0.50 | 0.025 | 0.9963 | 1659.8 | (1587.4, 1732.2) | 24.5 | 95 | 98 |
| 3.39 | AFG1 | 0.10–1.02 | 0.025 | 0.9979 | 4428.9 | (4261.5, 4596.4) | −93.3 | 70 | 71 |
| 4.21 | AFB2 | 0.04–0.40 | 0.010 | 0.9937 | 4852.5 | (4596.8, 5108.2) | −62.4 | 97 | 96 |
| 5.21 | AFB1 | 0.04–0.40 | 0.020 | 0.9947 | 7582.5 | (7190.8, 7974.2) | −44.7 | 62 | 61 |
| 10.19 | HT-2 | 0.40–4.02 | 0.200 | 0.9948 | 197.3 | (186.5, 208) | −20.9 | 53 | 55 |
| 12.48 | OTB | 0.05–0.50 | 0.013 | 0.9996 | 3853.2 | (3775.3, 3931) | −19.8 | 44 | 41 |
| 14.17 | T-2 | 0.05–0.50 | 0.025 | 0.9988 | 1743.3 | (1689.8, 1796.9) | −12.2 | 60 | 66 |
| 13.77 | FB1 | 10.1–101.4 | 5.07 | 0.9935 | 8.2 | (7.5, 8.8) | −24.5 | 72 | 72 |
| 15.79 | ZEA | 0.51–5.09 | 0.510 | 0.9996 | 254.2 | (249.9, 258.6) | 0.9 | 101 | 98 |
| 16.74 | STC | 0.50–5.02 | 0.125 | 0.9939 | 361.2 | (332.9, 389.6) | 40.9 | 90 | 91 |
| 16.71 | OTA | 0.20–2.00 | 0.050 | 0.9997 | 701.3 | (686.6, 715.9) | −53.5 | 75 | 72 |
| 17.72 | FB3 | 2.50–25.0 | 0.625 | 0.9992 | 132.5 | (128.8, 136.2) | −39.6 | 66 | 66 |
| 20.08 | FB2 | 2.50–25.0 | 1.25 | 0.9989 | 100.9 | (97.6, 104.2) | 7.9 | 44 | 44 |
q/Q sample or standard %: mean of values obtained at three concentrations. Q and q correspond to the areas of quantification and qualification product ions; LOD (Limit of detection), DOM-1 (deepoxy-deoxynivalenol), AFG2 (aflatoxin G2), AFM1 (aflatoxin M1), AFG1 (aflatoxin G1), AFB2 (aflatoxin B2), AFB1 (aflatoxin B1), HT-2 (toxin HT-2), OTB (ochratoxin B), T-2 (toxin T-2), FB1 (fumonisin B1), ZEA (zearalenone), STC (sterigmatocystin), OTA (ochratoxin A), FB3 (fumonisin B3), FB2 (fumonisin B2).
Table 4.
Precision (%RSD), accuracy (relative error, %RE), matrix effect (%ME) and recovery (%R). Within-run precision and accuracy have been studied in three independent samples at each concentration level, whereas between-run have been studied in three independent samples on three different days. ME and recovery have been studied in within-run conditions on one day.
| Mycotoxin | Precision (%RSD) | Accuracy (%RE) | Matrix Effect | Recovery | ||||||||||||||||
|---|---|---|---|---|---|---|---|---|---|---|---|---|---|---|---|---|---|---|---|---|
| Within-Run (n = 3) | Between-Run (n = 9) | Within-Run (n = 3) | Between-Run (n = 9) | Within-Run (n = 3) | Within-Run (n = 3) | |||||||||||||||
| L * | M | H | L | M | H | L | M | H | L | M | H | L | M | H | (%RSD) | L | M | H | (%RSD) | |
| DOM-1 | 10.5 | 4.1 | 10.6 | 10.5 | 4.1 | 10.6 | 4.8 | 1.1 | 1.1 | 4.8 | 1.1 | 1.1 | 19.3 | 17.9 | 17.4 | (5.3) | 79.1 | 71.8 | 71.0 | (6.1) |
| AFG2 | 6.3 | 2.3 | 2.0 | 6.3 | 2.3 | 2.0 | 0.4 | 2.8 | 1.2 | 0.4 | 2.8 | 1.2 | 59.9 | 58.5 | 57.1 | (2.3) | 67.2 | 68.0 | 72.2 | (3.8) |
| AFM1 | 5.3 | 5.0 | 5.1 | 5.3 | 5.0 | 5.1 | 10.0 | 1.5 | 0.8 | 10.0 | 1.5 | 0.8 | 69.7 | 62.7 | 60.2 | (7.6) | 63.5 | 71.7 | 74.4 | (8.1) |
| AFG1 | 8.9 | 1.2 | 11.5 | 9.5 | 1.1 | 5.1 | 0.7 | 2.0 | 2.4 | 3.6 | 1.7 | 5.7 | 39.5 | 38.0 | 40.3 | (3.0) | 61.2 | 76.2 | 66.1 | (11.3) |
| AFB2 | 2.4 | 6.6 | 1.3 | 2.4 | 6.6 | 1.3 | 12.2 | 4.3 | 2.2 | 12.2 | 4.3 | 2.2 | 59.9 | 62.9 | 60.4 | (2.6) | 70.3 | 67.6 | 76.0 | (6.0) |
| AFB1 | 9.7 | 2.1 | 2.7 | 9.7 | 2.1 | 8.0 | 6.1 | 0.9 | 1.0 | 6.1 | 0.9 | 0.3 | 38.5 | 37.5 | 39.1 | (2.1) | 60.3 | 76.5 | 69.2 | (11.8) |
| HT-2 | 2.2 | 2.1 | 9.5 | 15.4 | 2.1 | 9.5 | 15.7 | 1.1 | 0.2 | 7.9 | 1.1 | 0.2 | 61.7 | 66.1 | 61.9 | (3.9) | 76.9 | 70.1 | 72.7 | (4.7) |
| OTB | 0.2 | 7.6 | 6.7 | 0.2 | 7.6 | 6.7 | 2.0 | 8.1 | 0.2 | 2.0 | 8.1 | 0.2 | 84.7 | 71.5 | 75.9 | (8.7) | 64.4 | 69.6 | 74.3 | (7.1) |
| T-2 | 10.1 | 8.5 | 4.2 | 10.1 | 8.5 | 4.2 | 1.1 | 4.2 | 2.5 | 1.1 | 4.2 | 2.5 | 70.5 | 70.6 | 68.2 | (1.9) | 64.8 | 67.7 | 72.8 | (5.9) |
| FB1 | 6.4 | 3.2 | 11.5 | 11.2 | 3.2 | 11.5 | 12.2 | 0.8 | 0.9 | 9.8 | 0.8 | 0.9 | 27.6 | 26.9 | 23.8 | (7.8) | 70.9 | 61.3 | 64.1 | (7.6) |
| ZEA | 5.5 | 2.2 | 5.5 | 5.5 | 2.2 | 5.5 | 2.3 | 1.0 | 3.2 | 2.3 | 1.0 | 3.2 | 35.7 | 40.7 | 39.1 | (6.6) | 79.7 | 70.3 | 75.9 | (6.3) |
| STC | 12.5 | 10.1 | 10.3 | 11.8 | 9.3 | 10.3 | 1.1 | 3.7 | 1.3 | 8.7 | 4.9 | 2.1 | 20.0 | 22.0 | 21.8 | (5.3) | 81.8 | 75.8 | 75.8 | (4.4) |
| OTA | 4.0 | 6.2 | 2.6 | 14.1 | 7.6 | 5.9 | 6.5 | 8.3 | 0.7 | 6.2 | 2.4 | 3.2 | 71.8 | 73.7 | 75.1 | (2.2) | 60.3 | 66.4 | 73.1 | (9.5) |
| FB3 | 1.4 | 4.9 | 6.3 | 13.4 | 8.0 | 6.9 | 17.0 | 2.1 | 9.0 | 4.3 | 2.0 | 3.9 | 34.8 | 36.2 | 34.7 | (2.5) | 73.1 | 70.5 | 83.3 | (9.0) |
| FB2 | 7.4 | 4.7 | 9.1 | 10.6 | 7.3 | 8.0 | 19.4 | 2.5 | 7.3 | 13.1 | 0.7 | 1.3 | 43.9 | 45.6 | 42.2 | (3.9) | 80.8 | 68.9 | 83.9 | (11.2) |
* L: low, M: medium and H: high concentration levels. DOM-1 (deepoxy-deoxynivalenol), AFG2 (aflatoxin G2), AFM1 (aflatoxin M1), AFG1 (aflatoxin G1), AFB2 (aflatoxin B2), AFB1 (aflatoxin B1), HT-2 (toxin HT-2), OTB (ochratoxin B), T-2 (toxin T-2), FB1 (fumonisin B1), ZEA (zearalenone), STC (sterigmatocystin), OTA (ochratoxin A), FB3 (fumonisin B3), FB2 (fumonisin B2).
© 2018 by the authors. Licensee MDPI, Basel, Switzerland. This article is an open access article distributed under the terms and conditions of the Creative Commons Attribution (CC BY) license (http://creativecommons.org/licenses/by/4.0/).
Share and Cite
MDPI and ACS Style
Flores-Flores, M.E.; González-Peñas, E. Analysis of Mycotoxins in Peruvian Evaporated Cow Milk. Beverages 2018, 4, 34. https://doi.org/10.3390/beverages4020034
AMA Style
Flores-Flores ME, González-Peñas E. Analysis of Mycotoxins in Peruvian Evaporated Cow Milk. Beverages. 2018; 4(2):34. https://doi.org/10.3390/beverages4020034
Chicago/Turabian StyleFlores-Flores, Myra Evelyn, and Elena González-Peñas. 2018. "Analysis of Mycotoxins in Peruvian Evaporated Cow Milk" Beverages 4, no. 2: 34. https://doi.org/10.3390/beverages4020034
Note that from the first issue of 2016, this journal uses article numbers instead of page numbers. See further details here.