1. Introduction
The basic principle of the vapour absorption refrigeration technology is the phenomenon of sorption. This process occurs as a result of the chemical affinity of one substance (sorbent) for holding another one (sorbate). In LiBr/water vapour absorption refrigeration systems, the sorbate is the water vapour and the sorbent is the aqueous lithium–bromide solution, which is responsible for the sorption and desorption of the sorbate. The desorption process, which consists of separating the sorbate from the sorbent, takes place in the generator by means of heat input. The sorption process, where the sorbate is absorbed again by the sorbent, takes place in the absorber via an exothermic reaction [
1]. Aqueous lithium–bromide is a salt solution substance. The maximum amount of salt which can dissolve in water is highly dependent on the water temperature. The higher the water temperature, the more salt can be dissolved in water, and it is said that the solubility of the salt increases with temperature. When no more salt can be dissolved in water the solution is said to be saturated. If the temperature of a saturated solution drops, precipitation/crystallization of the salt takes place [
2]. Thus, the sorption and desorption processes of the LiBr/water solution in the vapour absorption refrigeration system should be designed properly to avoid the precipitation and crystallization of the salt in the solution, which can lead to blockage of solution passage ways.
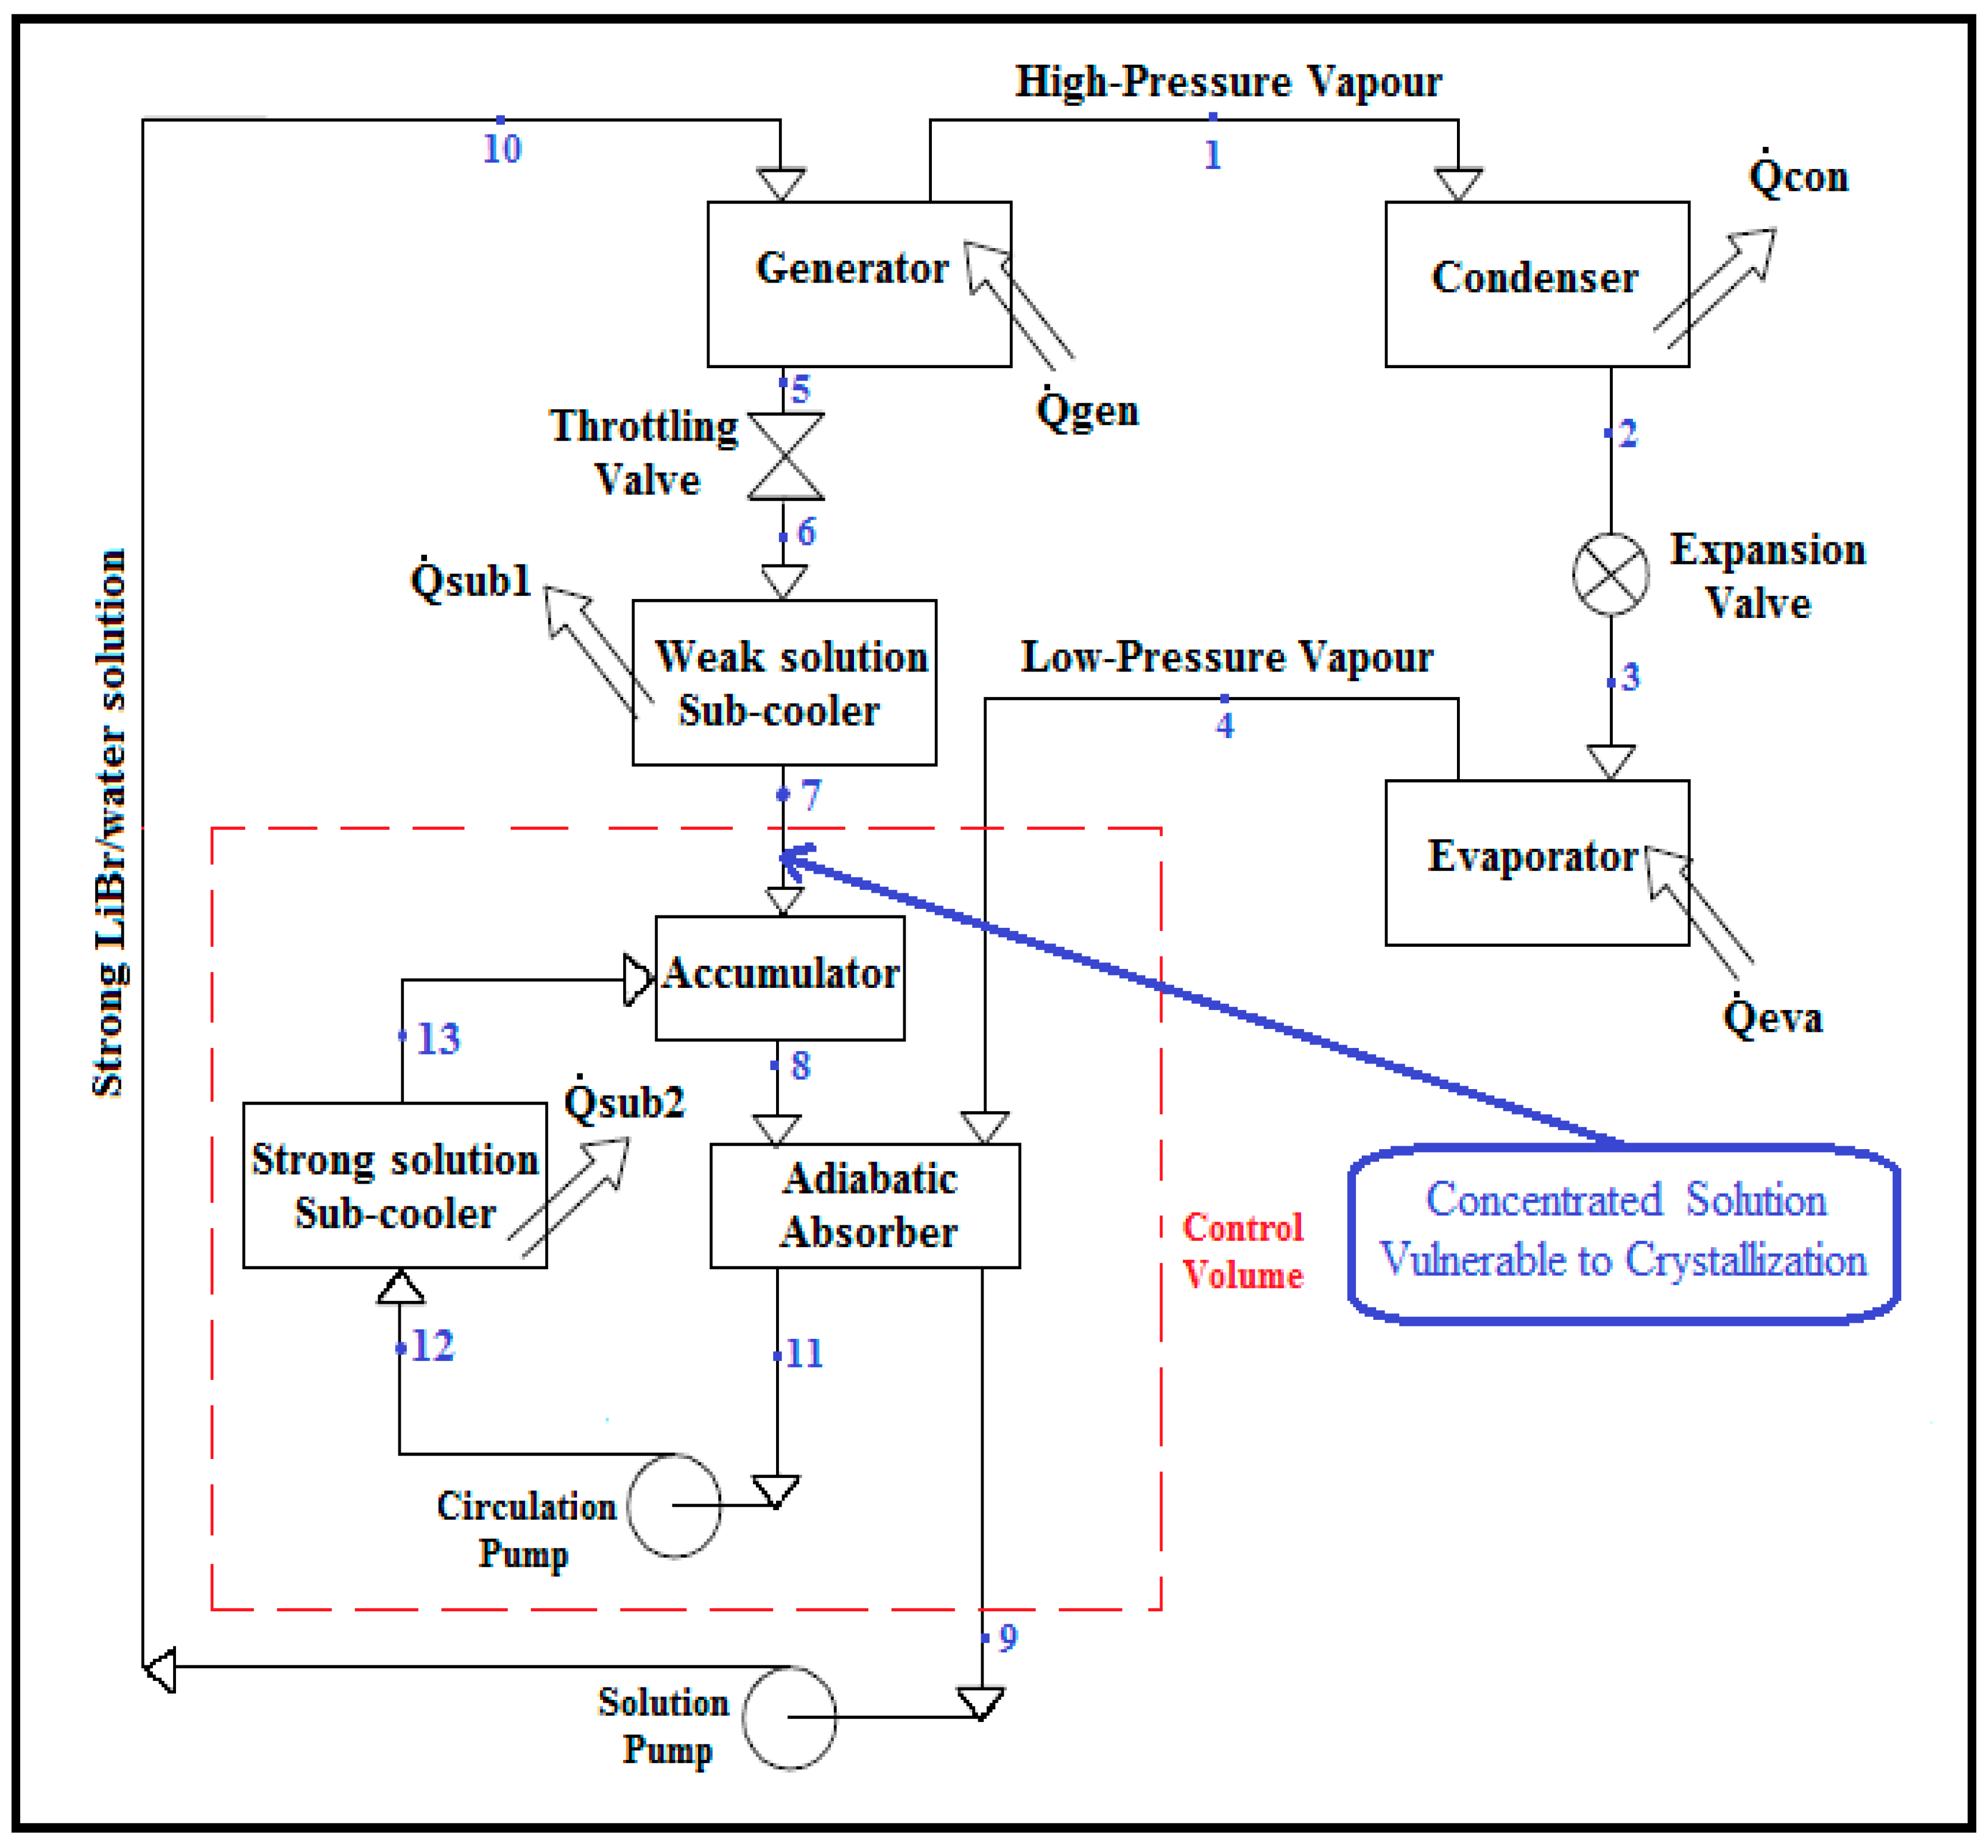
When the crystallization of the LiBr/water solution, which leads to the shutting down of the vapour absorption refrigeration system, appears during the operation of the vapour absorption refrigeration system due to a significant temperature drop or increase in LiBr mass concentration of the solution, the flow of the LiBr/water solution in the system is blocked. To avoid this, the concentration of the solution has to be monitored at critical positions prone to crystallization, in order to heat up the LiBr/water solution before the saturation limit is reached. The crystallization problem tends to occur in the weak LiBr/water solution between the throttling valve and the absorber as indicated in
Figure 1, at which point the temperature of the LiBr/water solution is at its relative lowest and LiBr mass concentration of the solution is at its highest in the system [
3].
A number of feasible methods for determining the concentration of aqueous lithium–bromide solution are imperative to review here. The most two common and well-known methods are: the determination of the LiBr/water concentration by measuring the specific gravity of the solution with a hydrometer [
5,
6] and by use of titration with silver nitrate [
2]. Both methods give accurate measurements but are necessarily time-consuming, as they require the extraction and manipulation of a sample from the system in a laboratory [
2,
5]. However, an alternative method which could be used to determine the concentration of LiBr/water solution is that of measuring the secondary properties that are associated with and affected by the change in concentration. An example of secondary properties which can be measured properly by using a sensor inside the vapour absorption refrigeration system is the electrical conductivity through which the concentration of LiBr/water solution can be determined easily in the system during the operation without extracting a sample [
6].
The electrical conductivity is the ability of the solution to conduct an electric current. This depends on such factors as concentration and temperature. An increase in the temperature of solution increases the mobility and the number of the ions in solution due to ionisation of molecules, which in turn leads to an increase in the electrical conductivity of the solution. Moreover, an increase in the concentration of solution leads to increase its electrical conductivity due to an increase in the number of ions per unit volume [
7,
8]. It is therefore always important to associate the electrical conductivity measurement of a solution with a reference concentration and temperature.
The electrical conductance of the aqueous lithium–bromide solution for concentrations in the range of 40.7% to 63.55% was studied by Fried and Segal [
5]. Their data shows that the electrical conductance increased from 162 mmho at 15
to 419 mmho at 80
for a concentration of 45% and from 115 mmho at 15
to 333 mmho at 80
for a concentration of 50%. Unfortunately their study gave measurements of the electrical conductance rather than electrical conductivity. Since electrical conductance measurement is a function of both the distance between the electrodes and the effective area of the electrodes, their results depends on the equipment being used and thus cannot be considered as reference data.
Sun et al. [
9] investigated the electrical resistivity (ohm × cm) of aqueous lithium–bromide solution for concentration and temperature ranges of 35% to 70% and of 10
to 100 ℃ respectively. Their results can be used to establish the concentration of aqueous lithium–bromide solutions when the electrical resistivity and the temperature of the solutions are known.
Nowadays the majority of equipment which are readily available on the market measures the electrical conductivity (mS/cm) of solutions. Thus, the existing literature is no longer useful since it gives data based on electrical conductance and electrical resistivity.
The purpose of this study is to find an alternative, practical, and modern way which can be used to determine the concentration of the aqueous lithium–bromide solution in the vapour absorption refrigeration system without extracting samples. Furthermore, the techniques used in this study mimic the working conditions of the LiBr/water solutions inside the vapour absorption refrigeration system; therefore, the results presented in this study are considered as data simulating the real-time of LiBr/water solution inside the vapour absorption refrigeration system. As a result, control of the performance of the vapour absorption refrigeration system can be achieved easily, which, in turn, leads to a significant reduction in costs prohibiting the wide spread adoption of the vapour absorption refrigeration technology.
2. Experimental Equipment and Measurement Technique
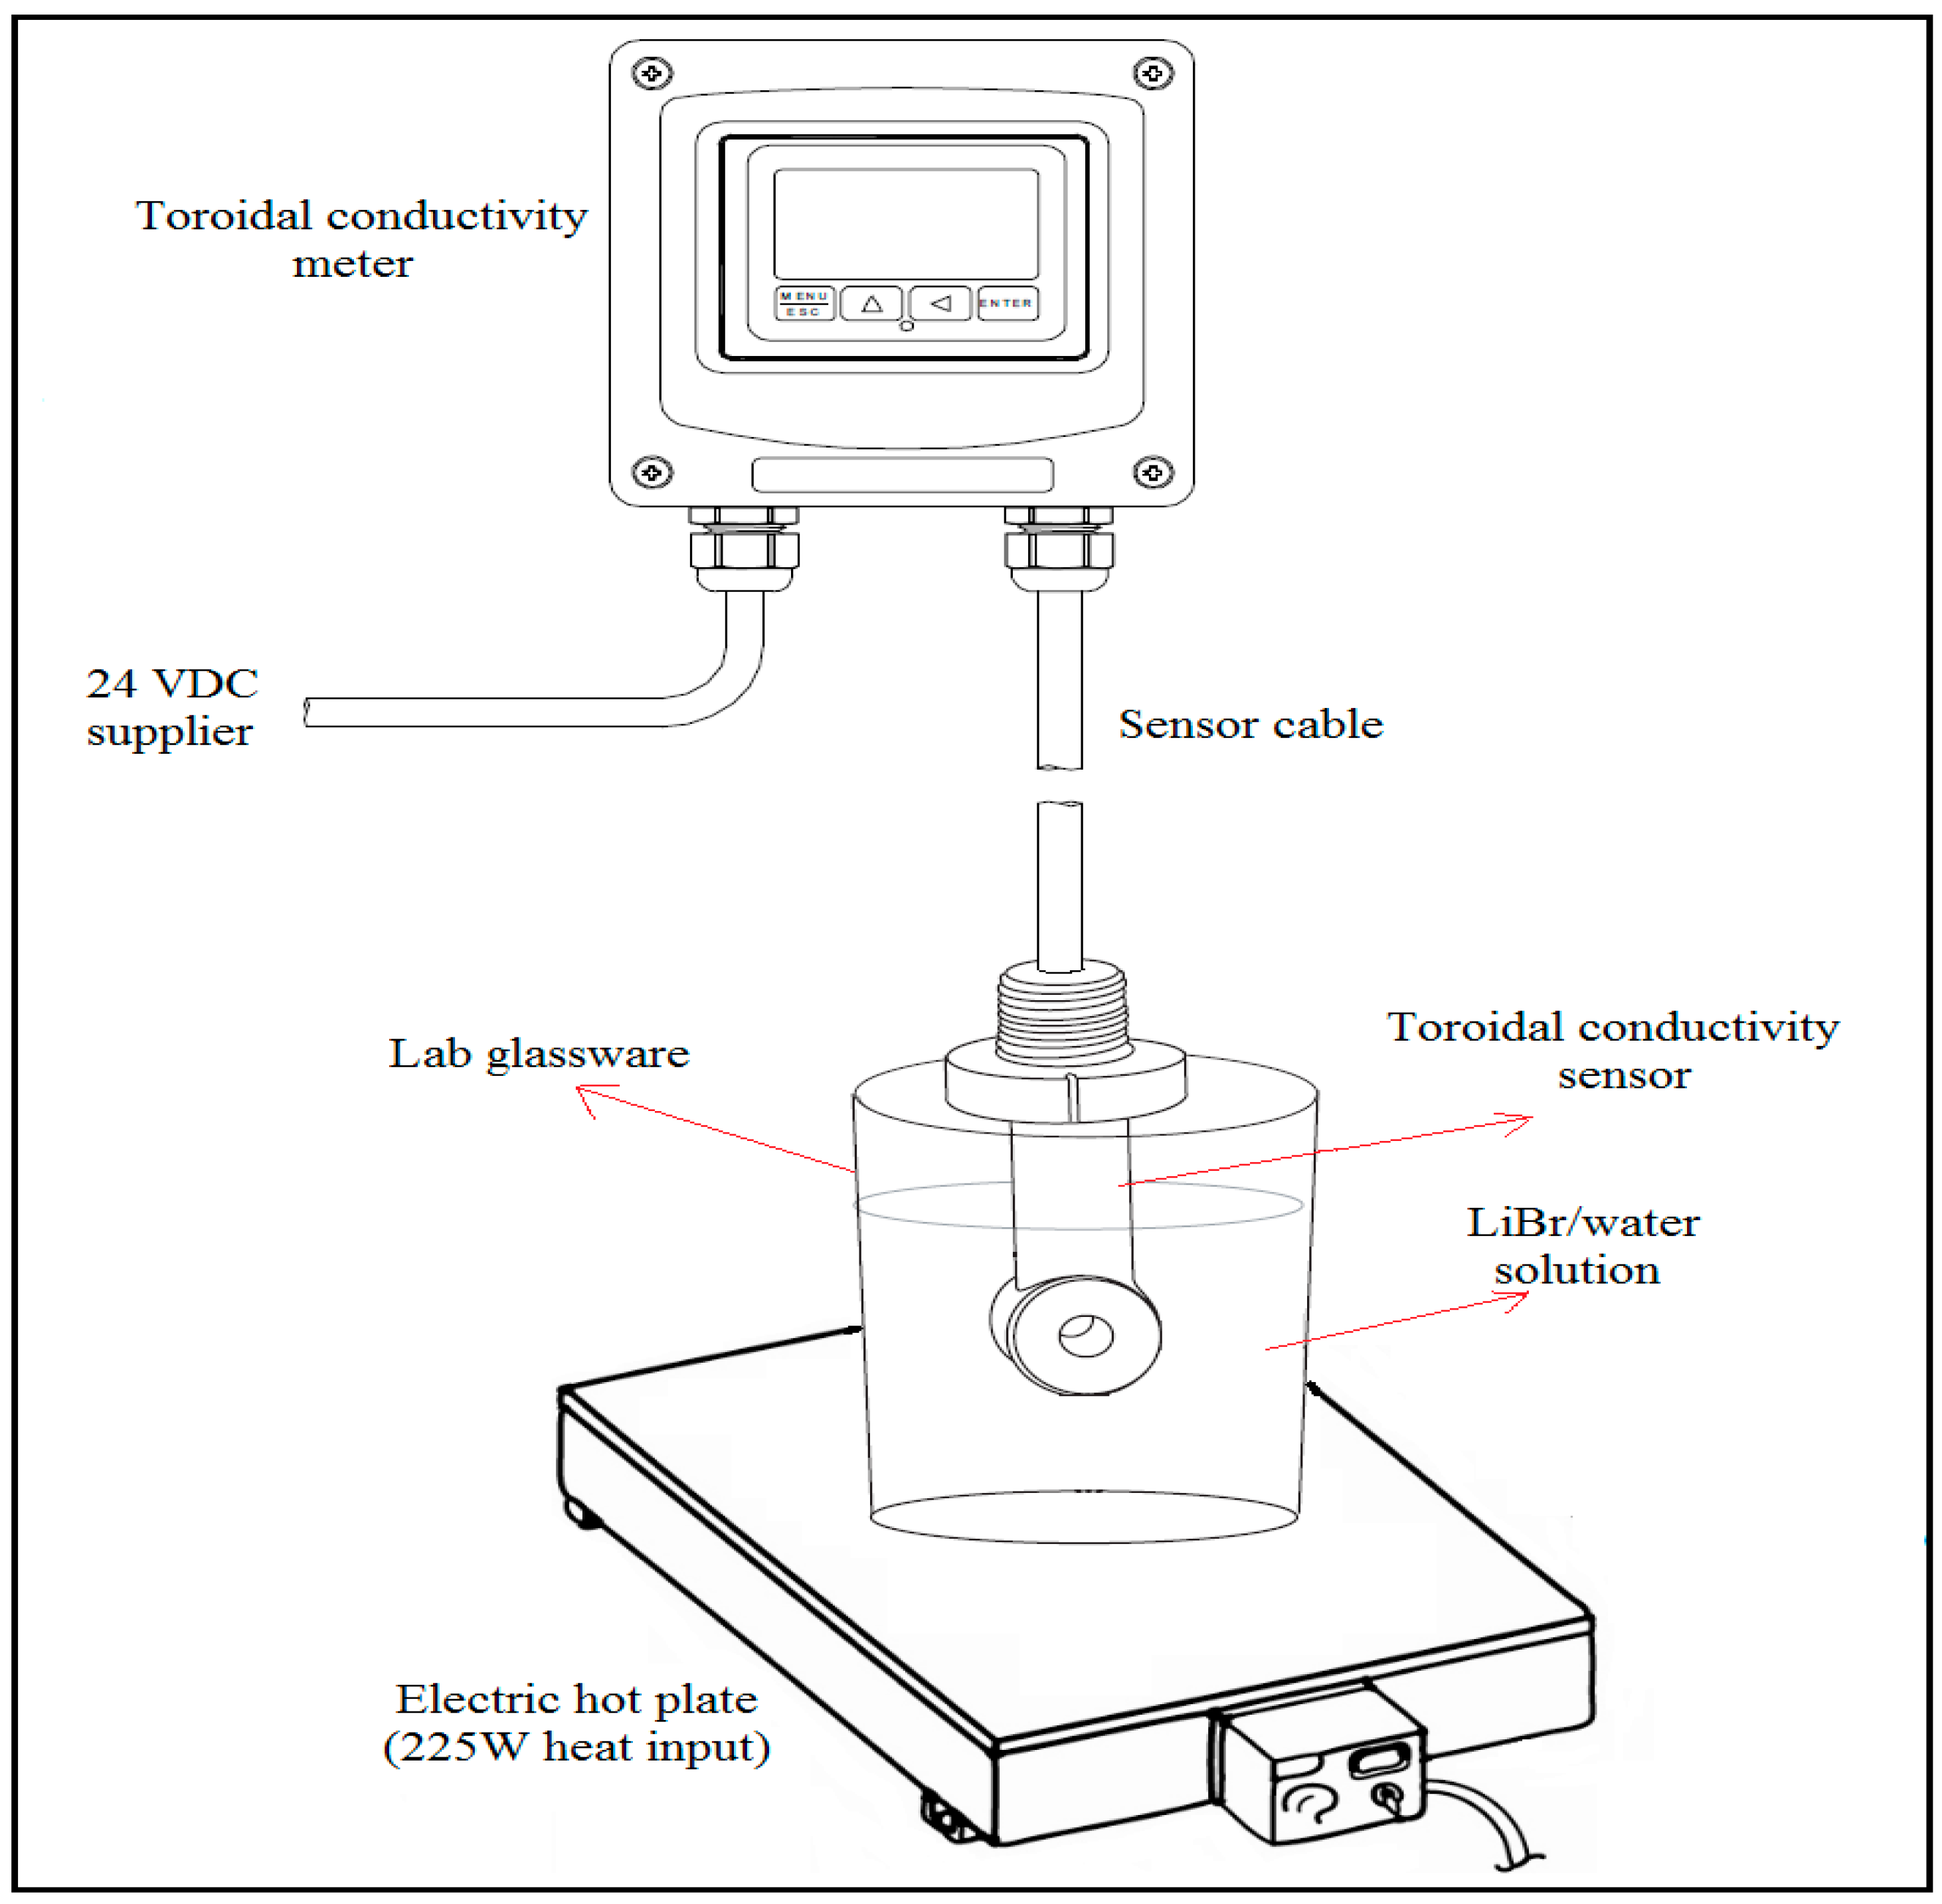
The aqueous lithium–bromide solutions were prepared in a mass percent concentration of 45%, 50%, 55%, 60%, and 65% by using distilled water and lithium bromide salt (with a purity of 99.0% according to the technical specification of the supplier). The solution preparation and the tests were performed in a dry laboratory room, and the amount of each LiBr/water concentrated solution was about 1.5 liters. During the experiments, the solution was placed in lab glassware over an electric hot plate at an input capacity of 225 W. At the center of the glassware, the submersion toroidal conductivity sensor (Omega Engineering, Model No. CDE-45T2) was mounted and connected to the toroidal conductivity meter (Omega Engineering, Model No. CDTX-45T), which was powered by 24 V DC supply as shown in
Figure 2. The temperature and electrical conductivity measurement ranges of the instrument are from
to 210
and from 0.0 mS/cm to 200.0 mS/cm with 0.5% accuracy for both measurements. For each of the five solutions listed above, six tests were performed; in tests 1, 3, and 5 the solution temperature was raised slowly from room temperature (25
) to 95
using an electric heater, while in tests 2, 4, and 6, the solution was allowed to cool naturally from 95
to room temperature.
Following the six tests performed for the heating and cooling processes, another test was performed for each of the five solutions listed above in order to obtain the electrical conductivity when the solution was allowed to reach steady state conditions. In this test, the electrical conductivity was measured in temperature-controlled oil bath (Memmert, Model No. One 7–45) at temperatures fixed to within a setting accuracy and temperature fluctuation of 0.1 and respectively. The procedure adapted was to heat the solution from room temperature (25) to the maximum temperature of 95 in steps of 5. After making sure that the solution reached a steady state condition, it was maintained at the set temperature for ten minutes before the electrical conductivity was recorded. It was noted that the solution took about forty minutes to reach equilibrium between temperature settings. During the experiments, the nozzle of the lab glassware used to hold the solution and the sensor was sealed with aluminum foil tape in order to maintain the concentration of solutions as prepared for the tests.
3. Results and Discussion
The experimental data presented in
Figure 3,
Figure 4,
Figure 5,
Figure 6 and
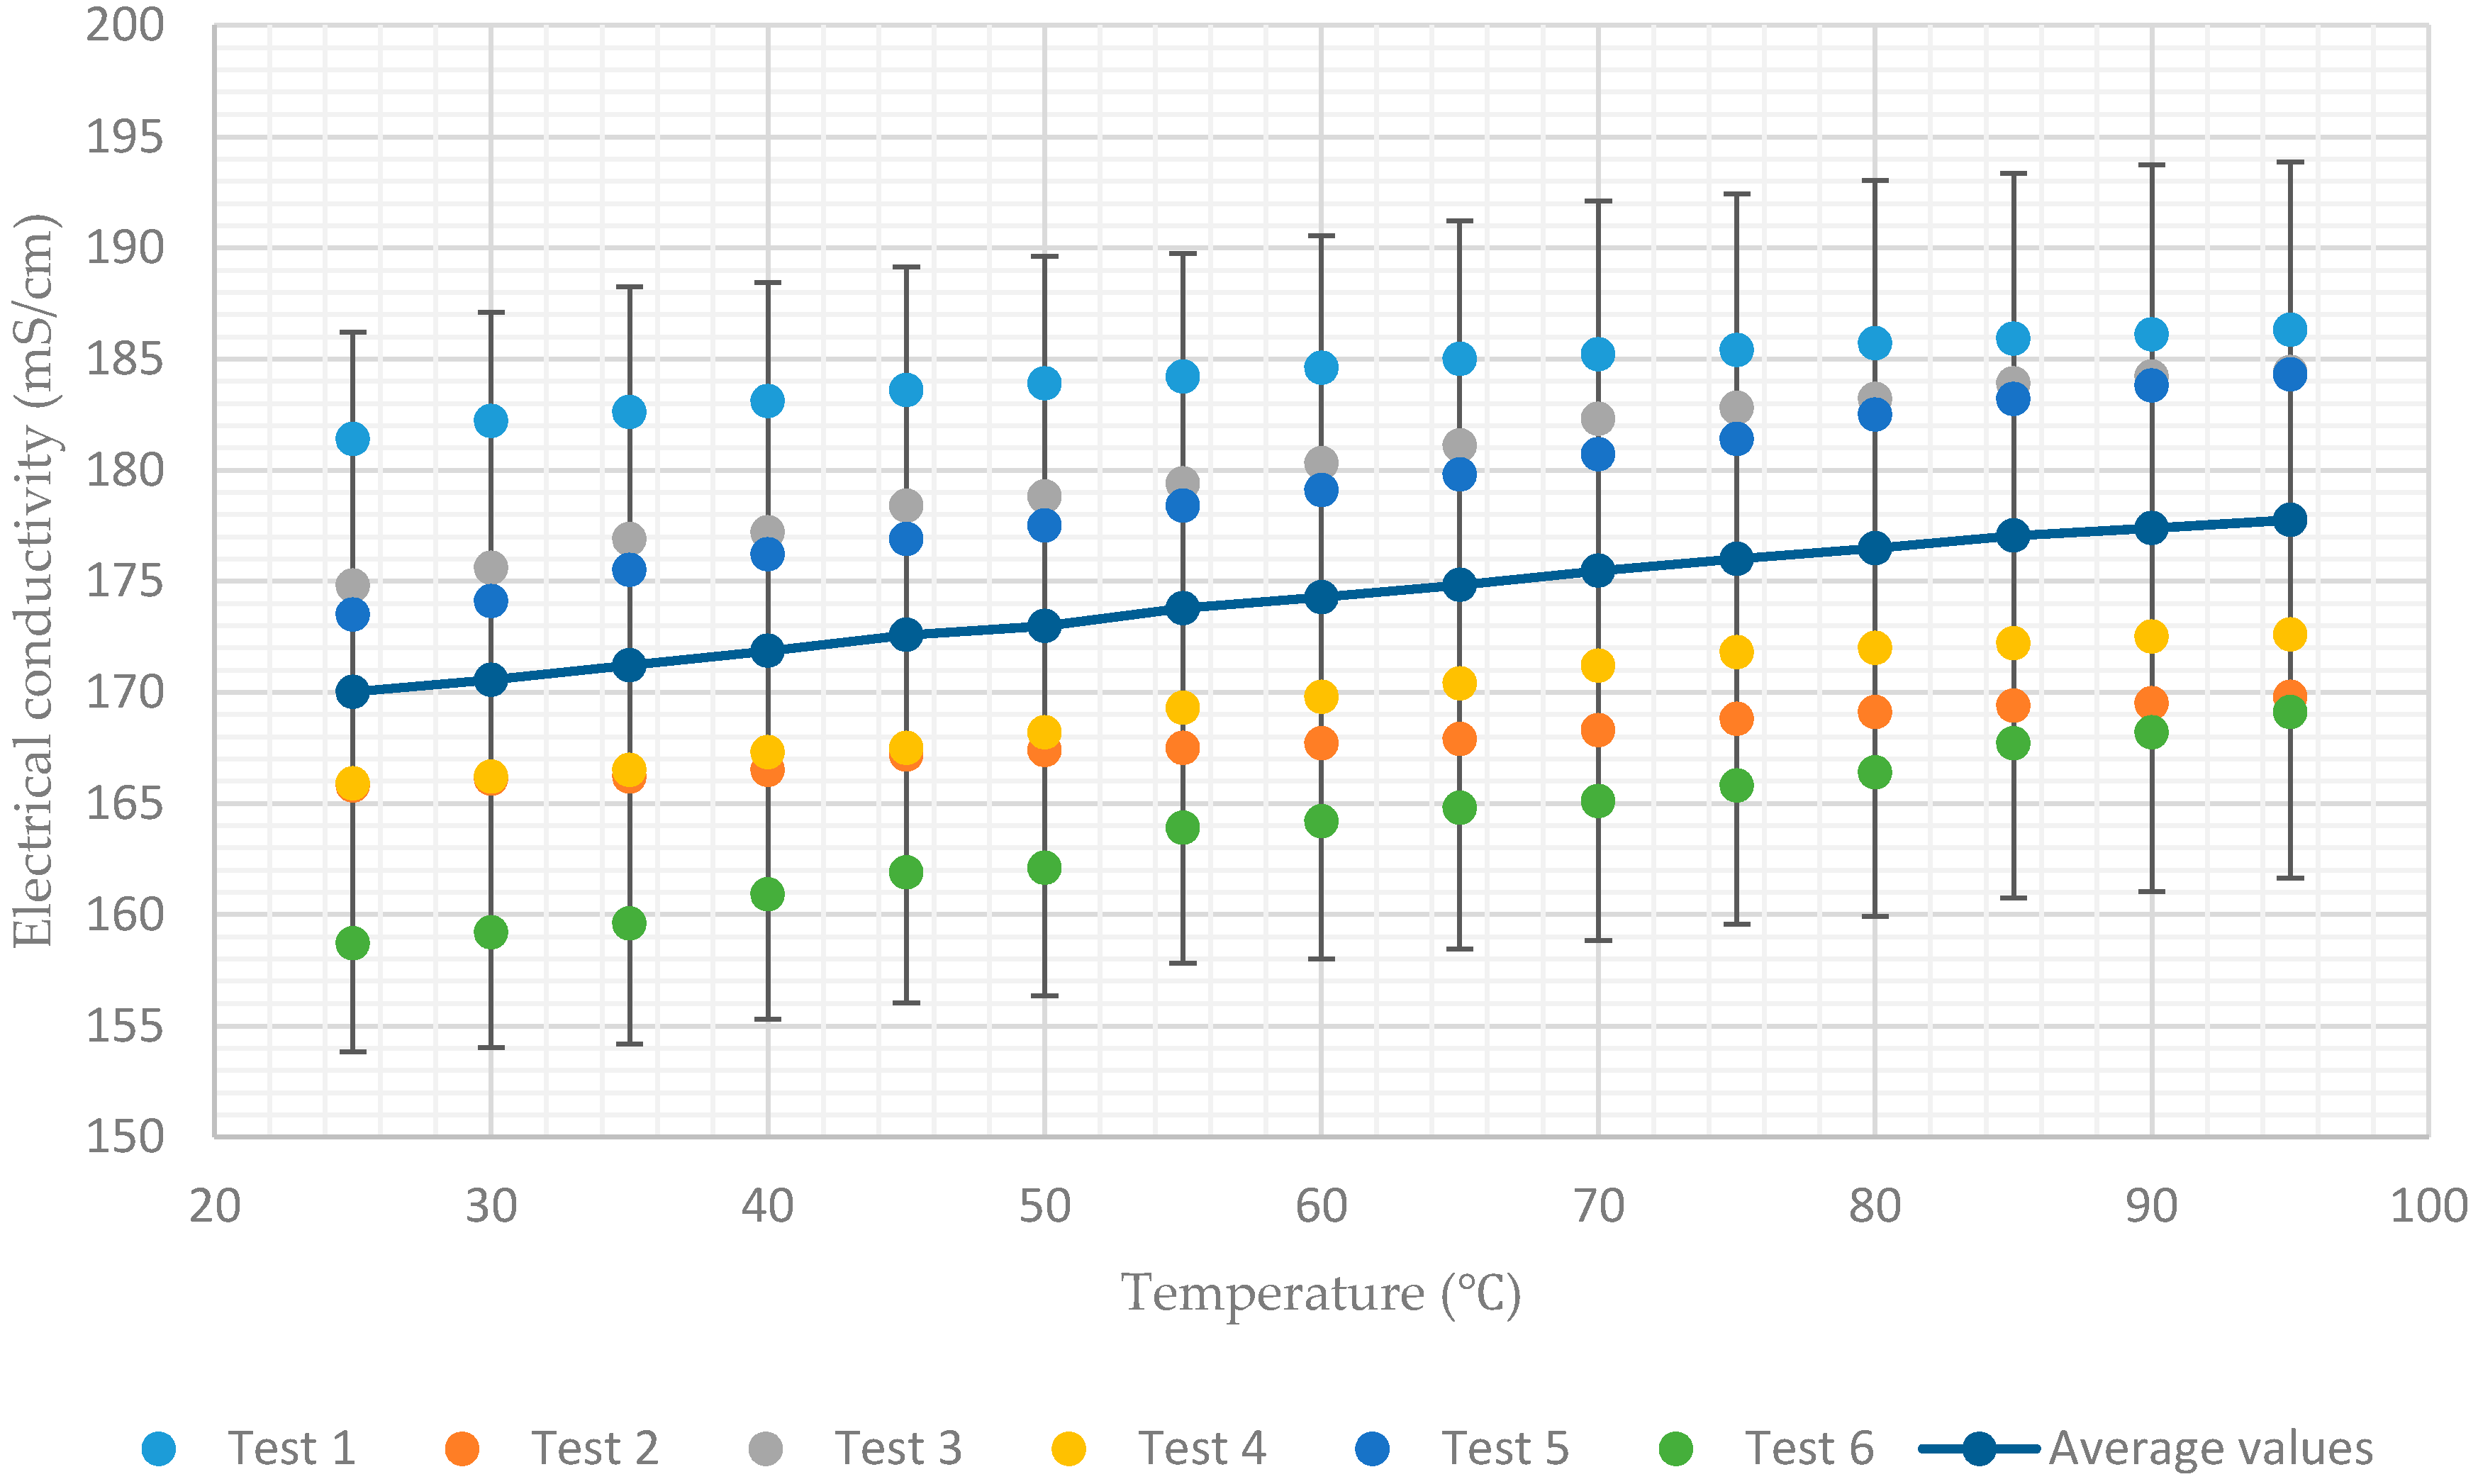
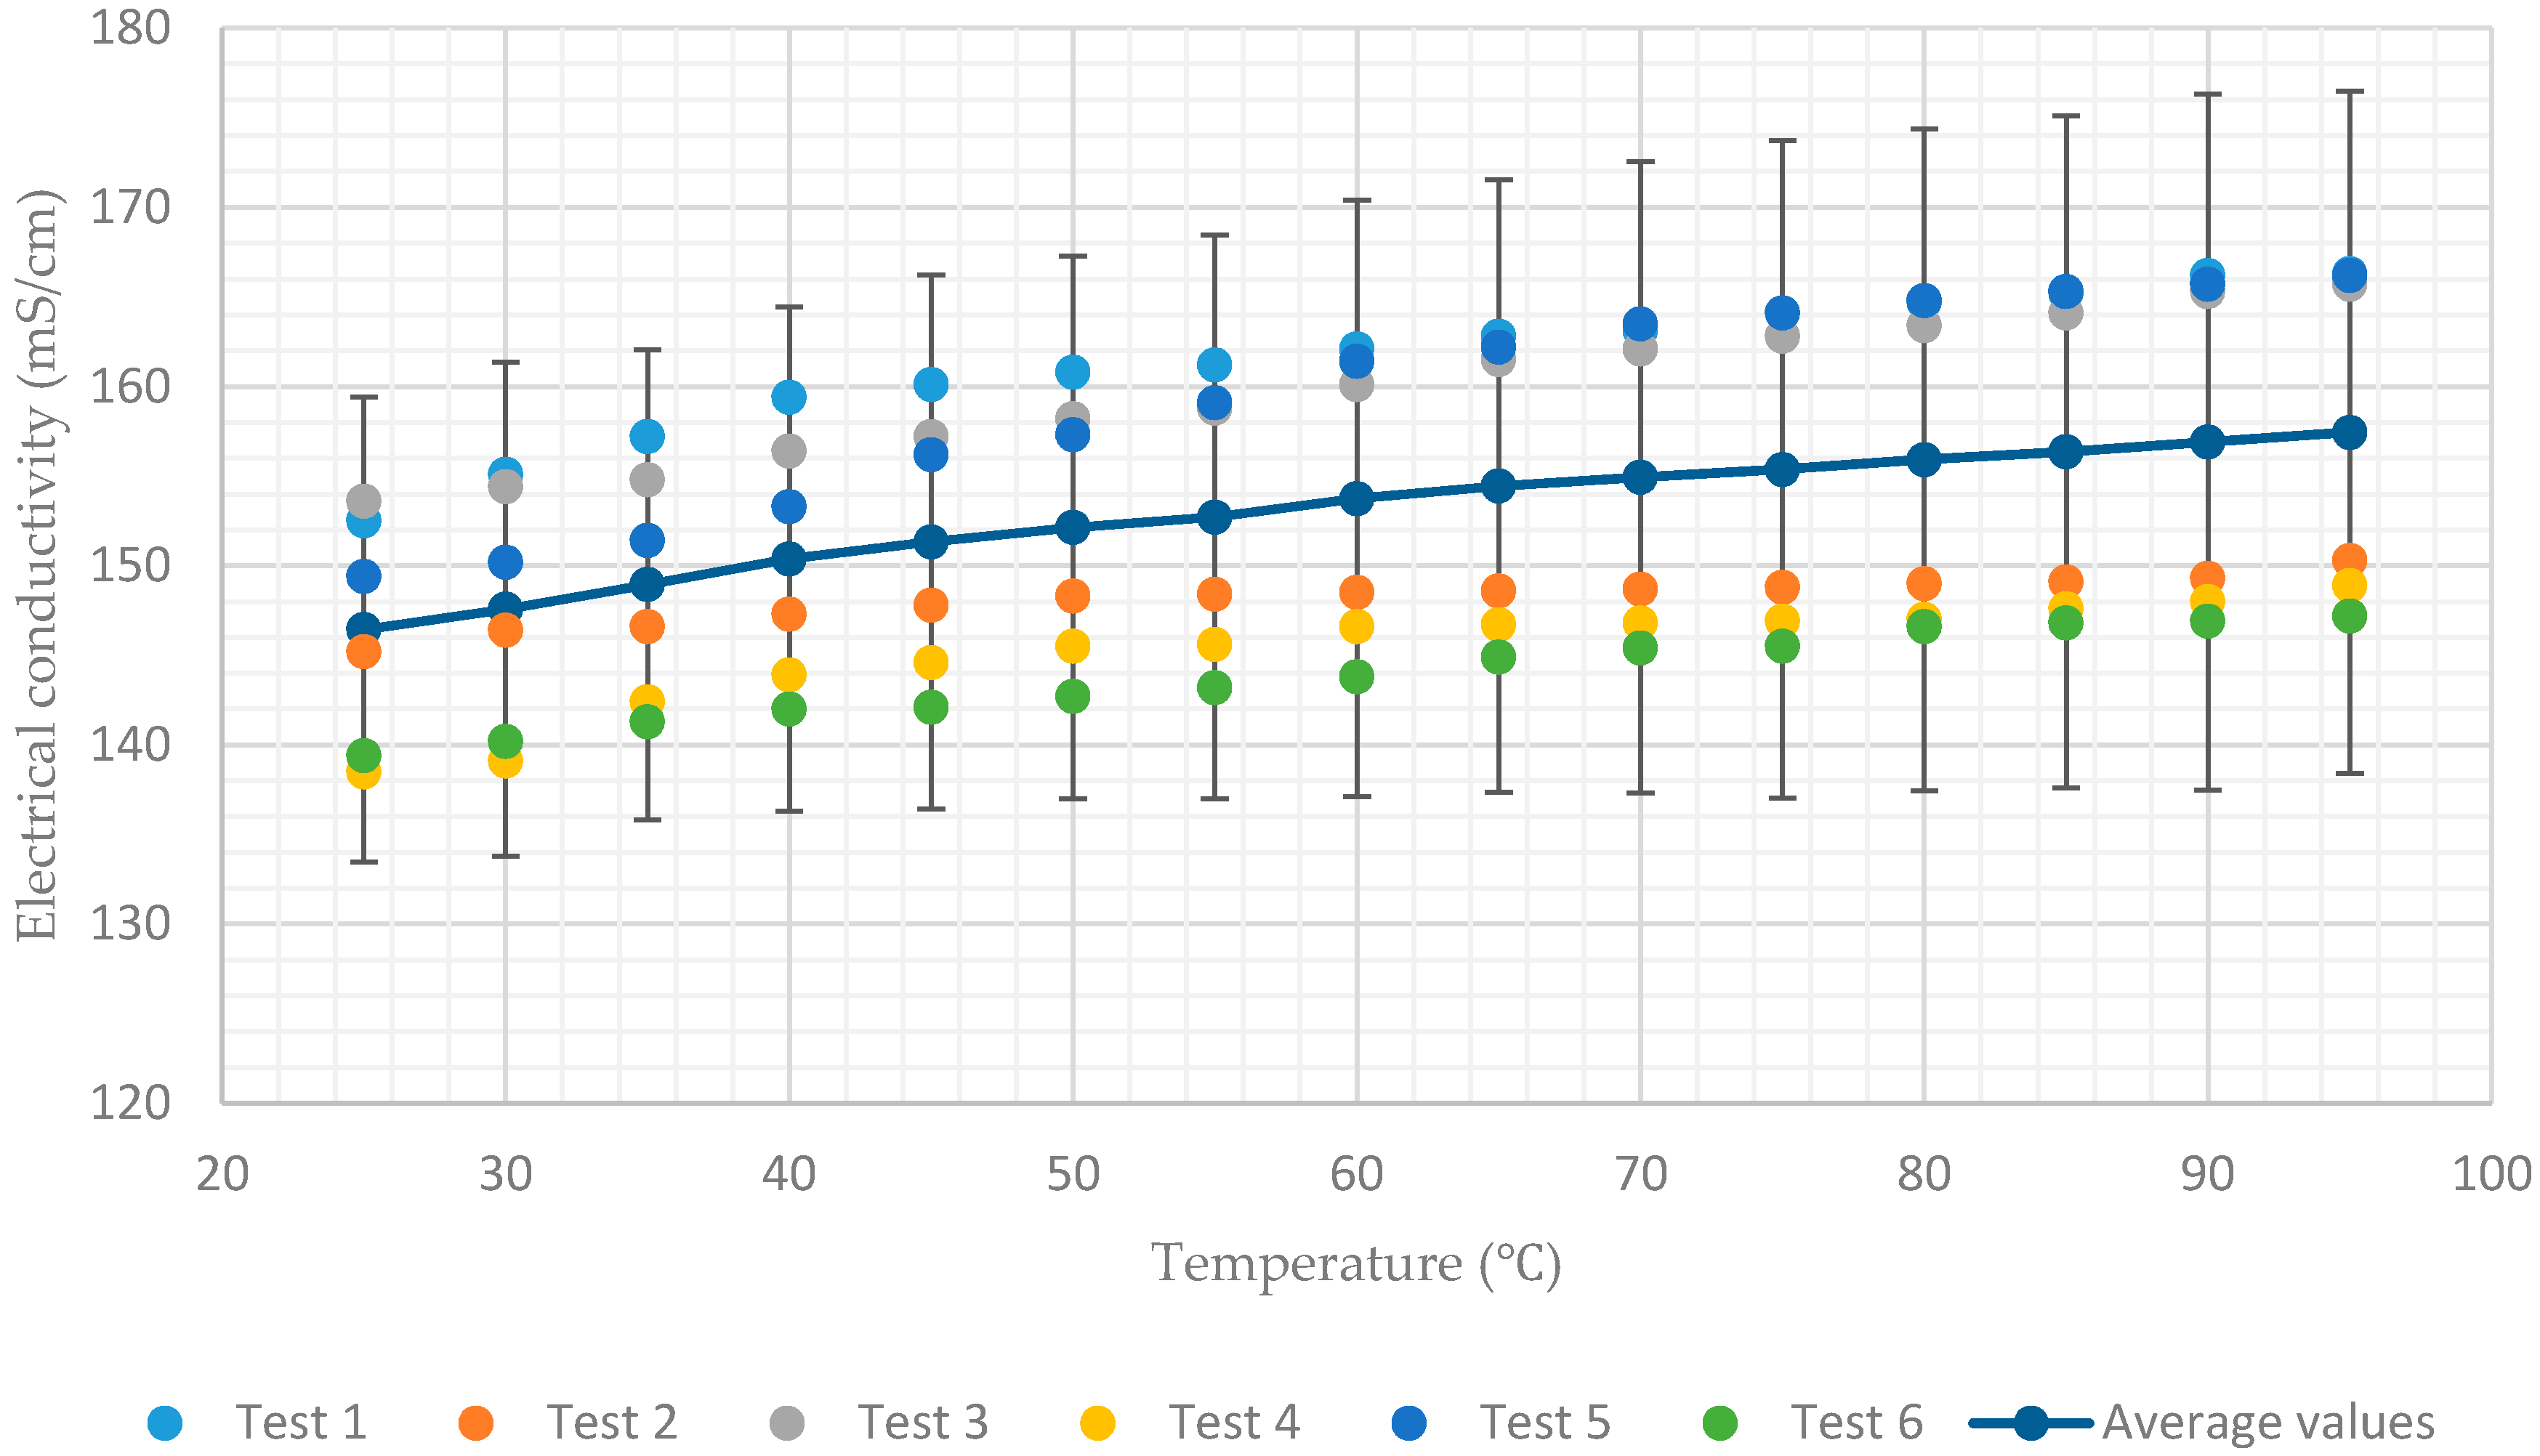
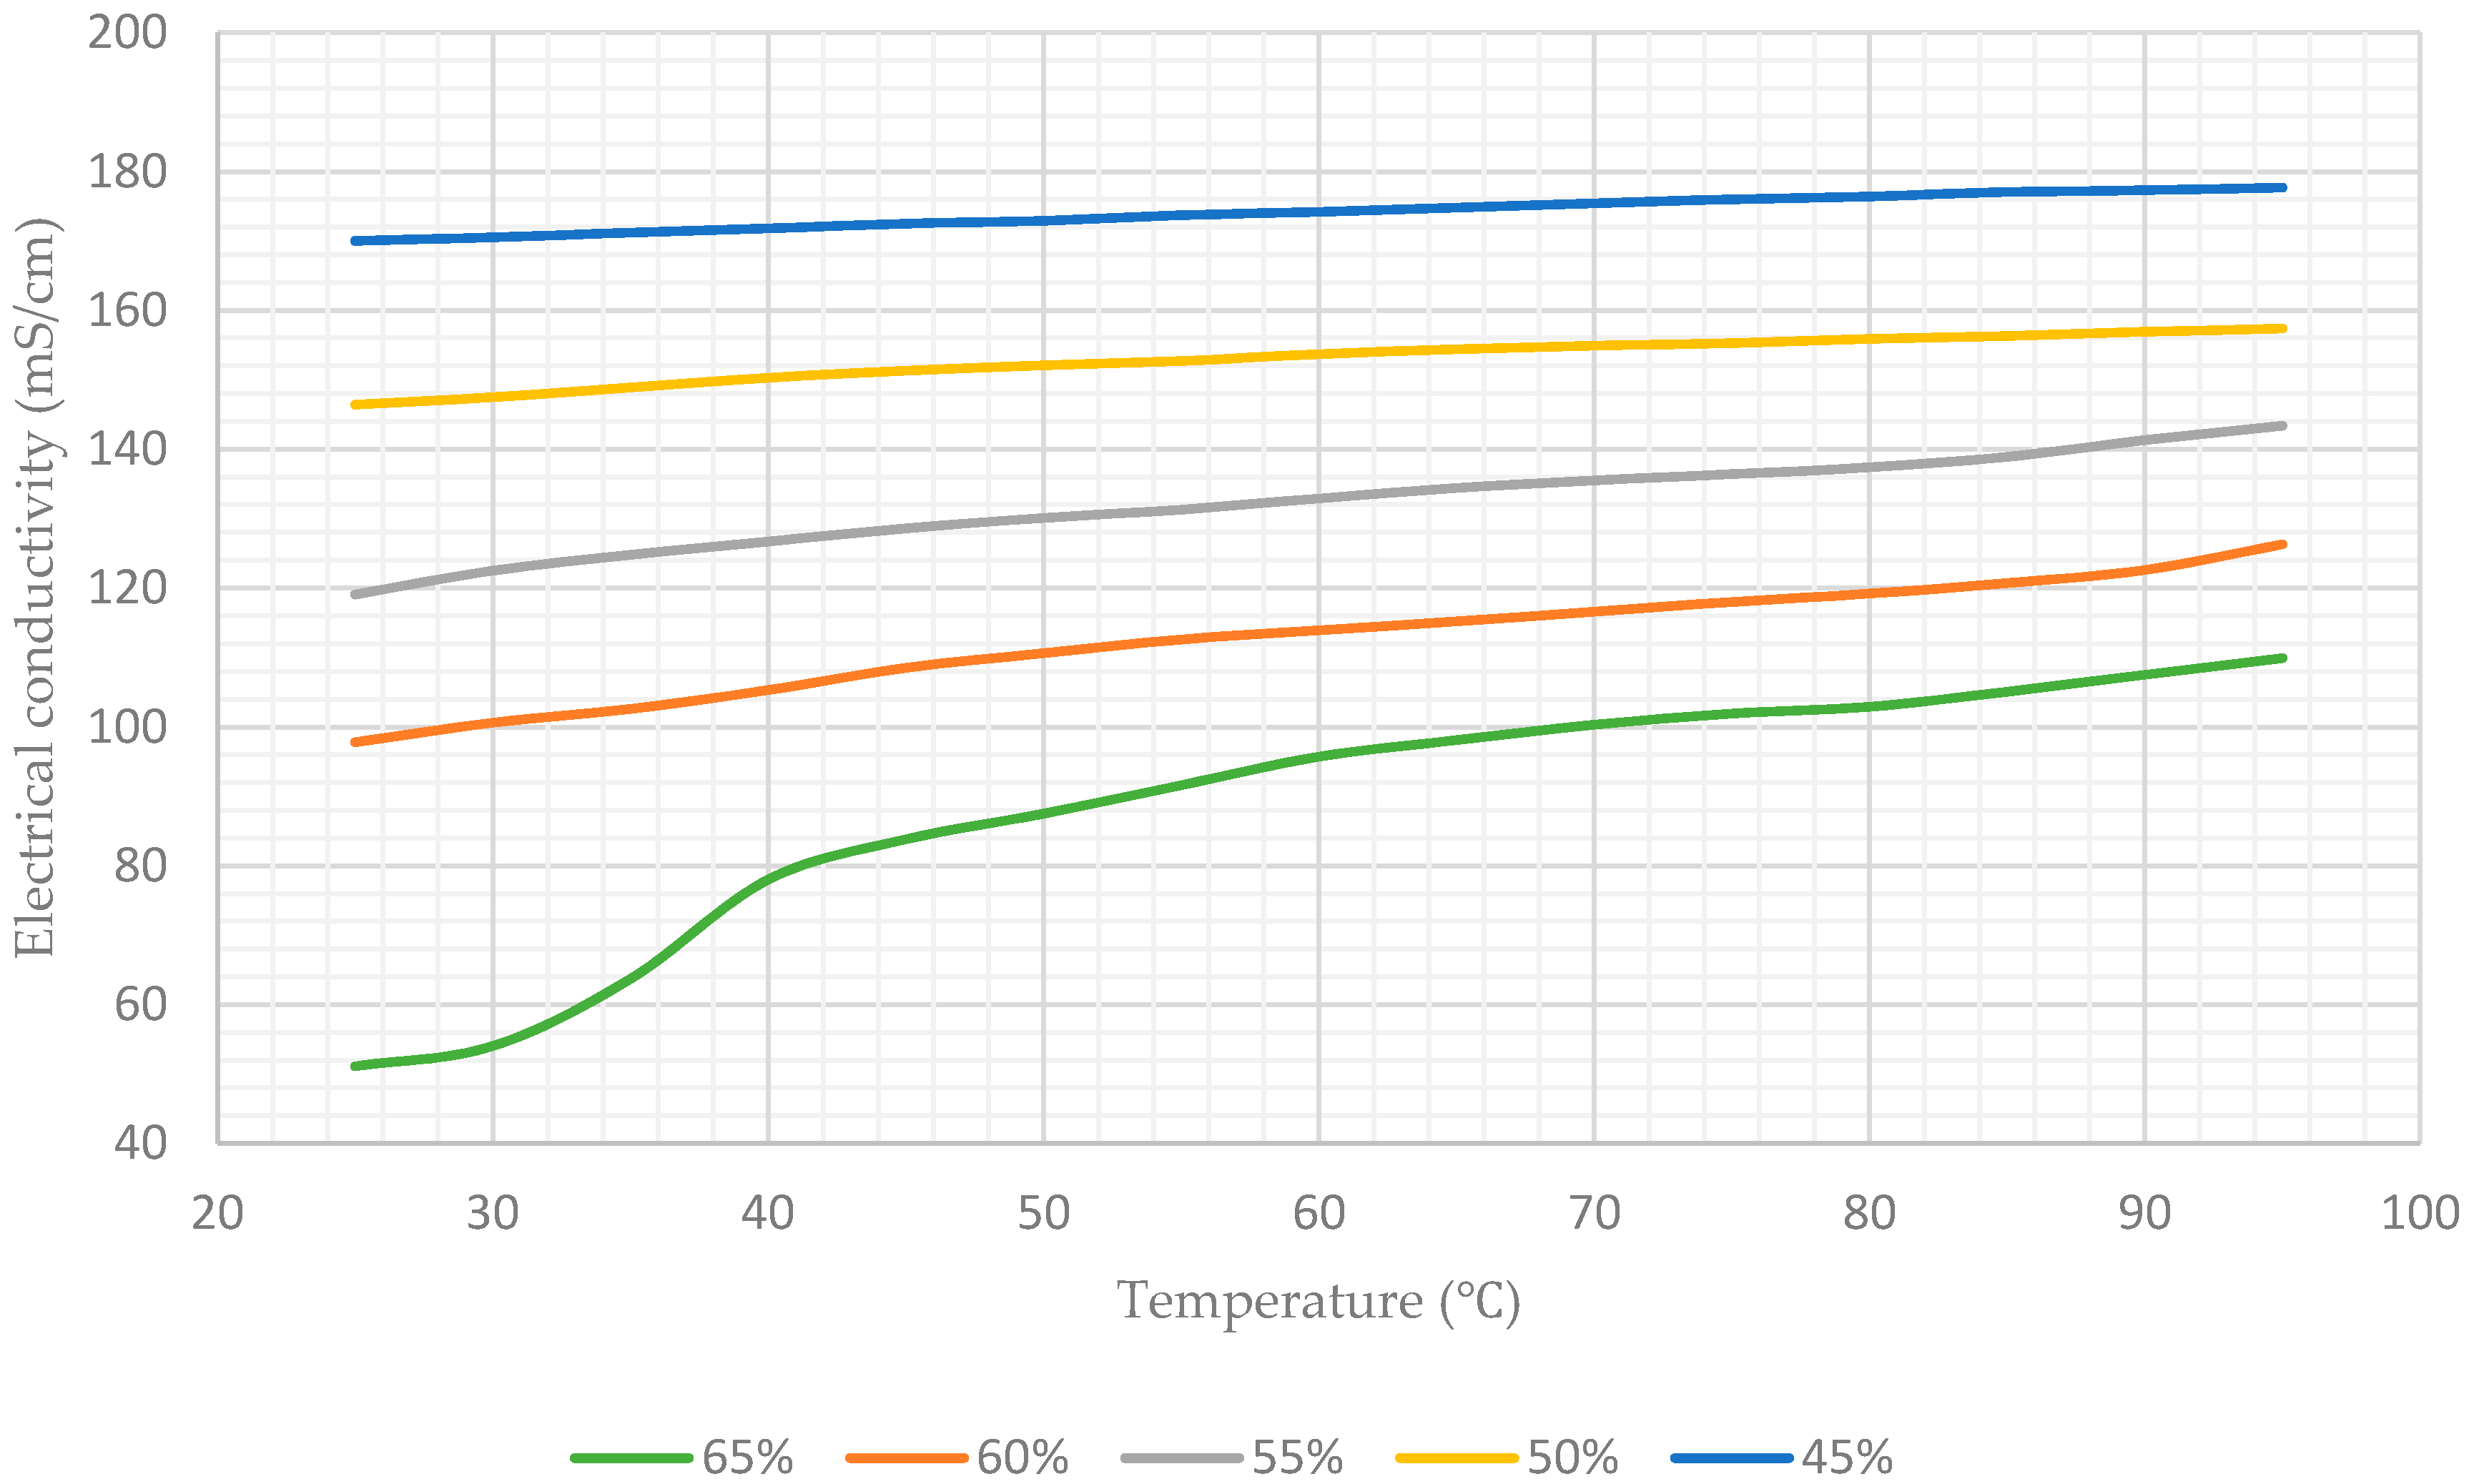
Figure 7 show that for a constant concentration, the electrical conductivity of the aqueous lithium–bromide solution increases as the solution temperature increases. However, for low concentrations of 45% and 50%, the electrical conductivity of the aqueous lithium–bromide solution shows less sensitivity to temperature increases when compared to the higher solution concentrations. As can be seen in
Figure 3 and
Figure 4, the average values of electrical conductivity increase from 170 mS/cm to 177.7 mS/cm and from 146.4 mS/cm to 157.4 mS/cm for the solution concentrations of 45% and 50% respectively, when the temperature increases from 25
to 95
.
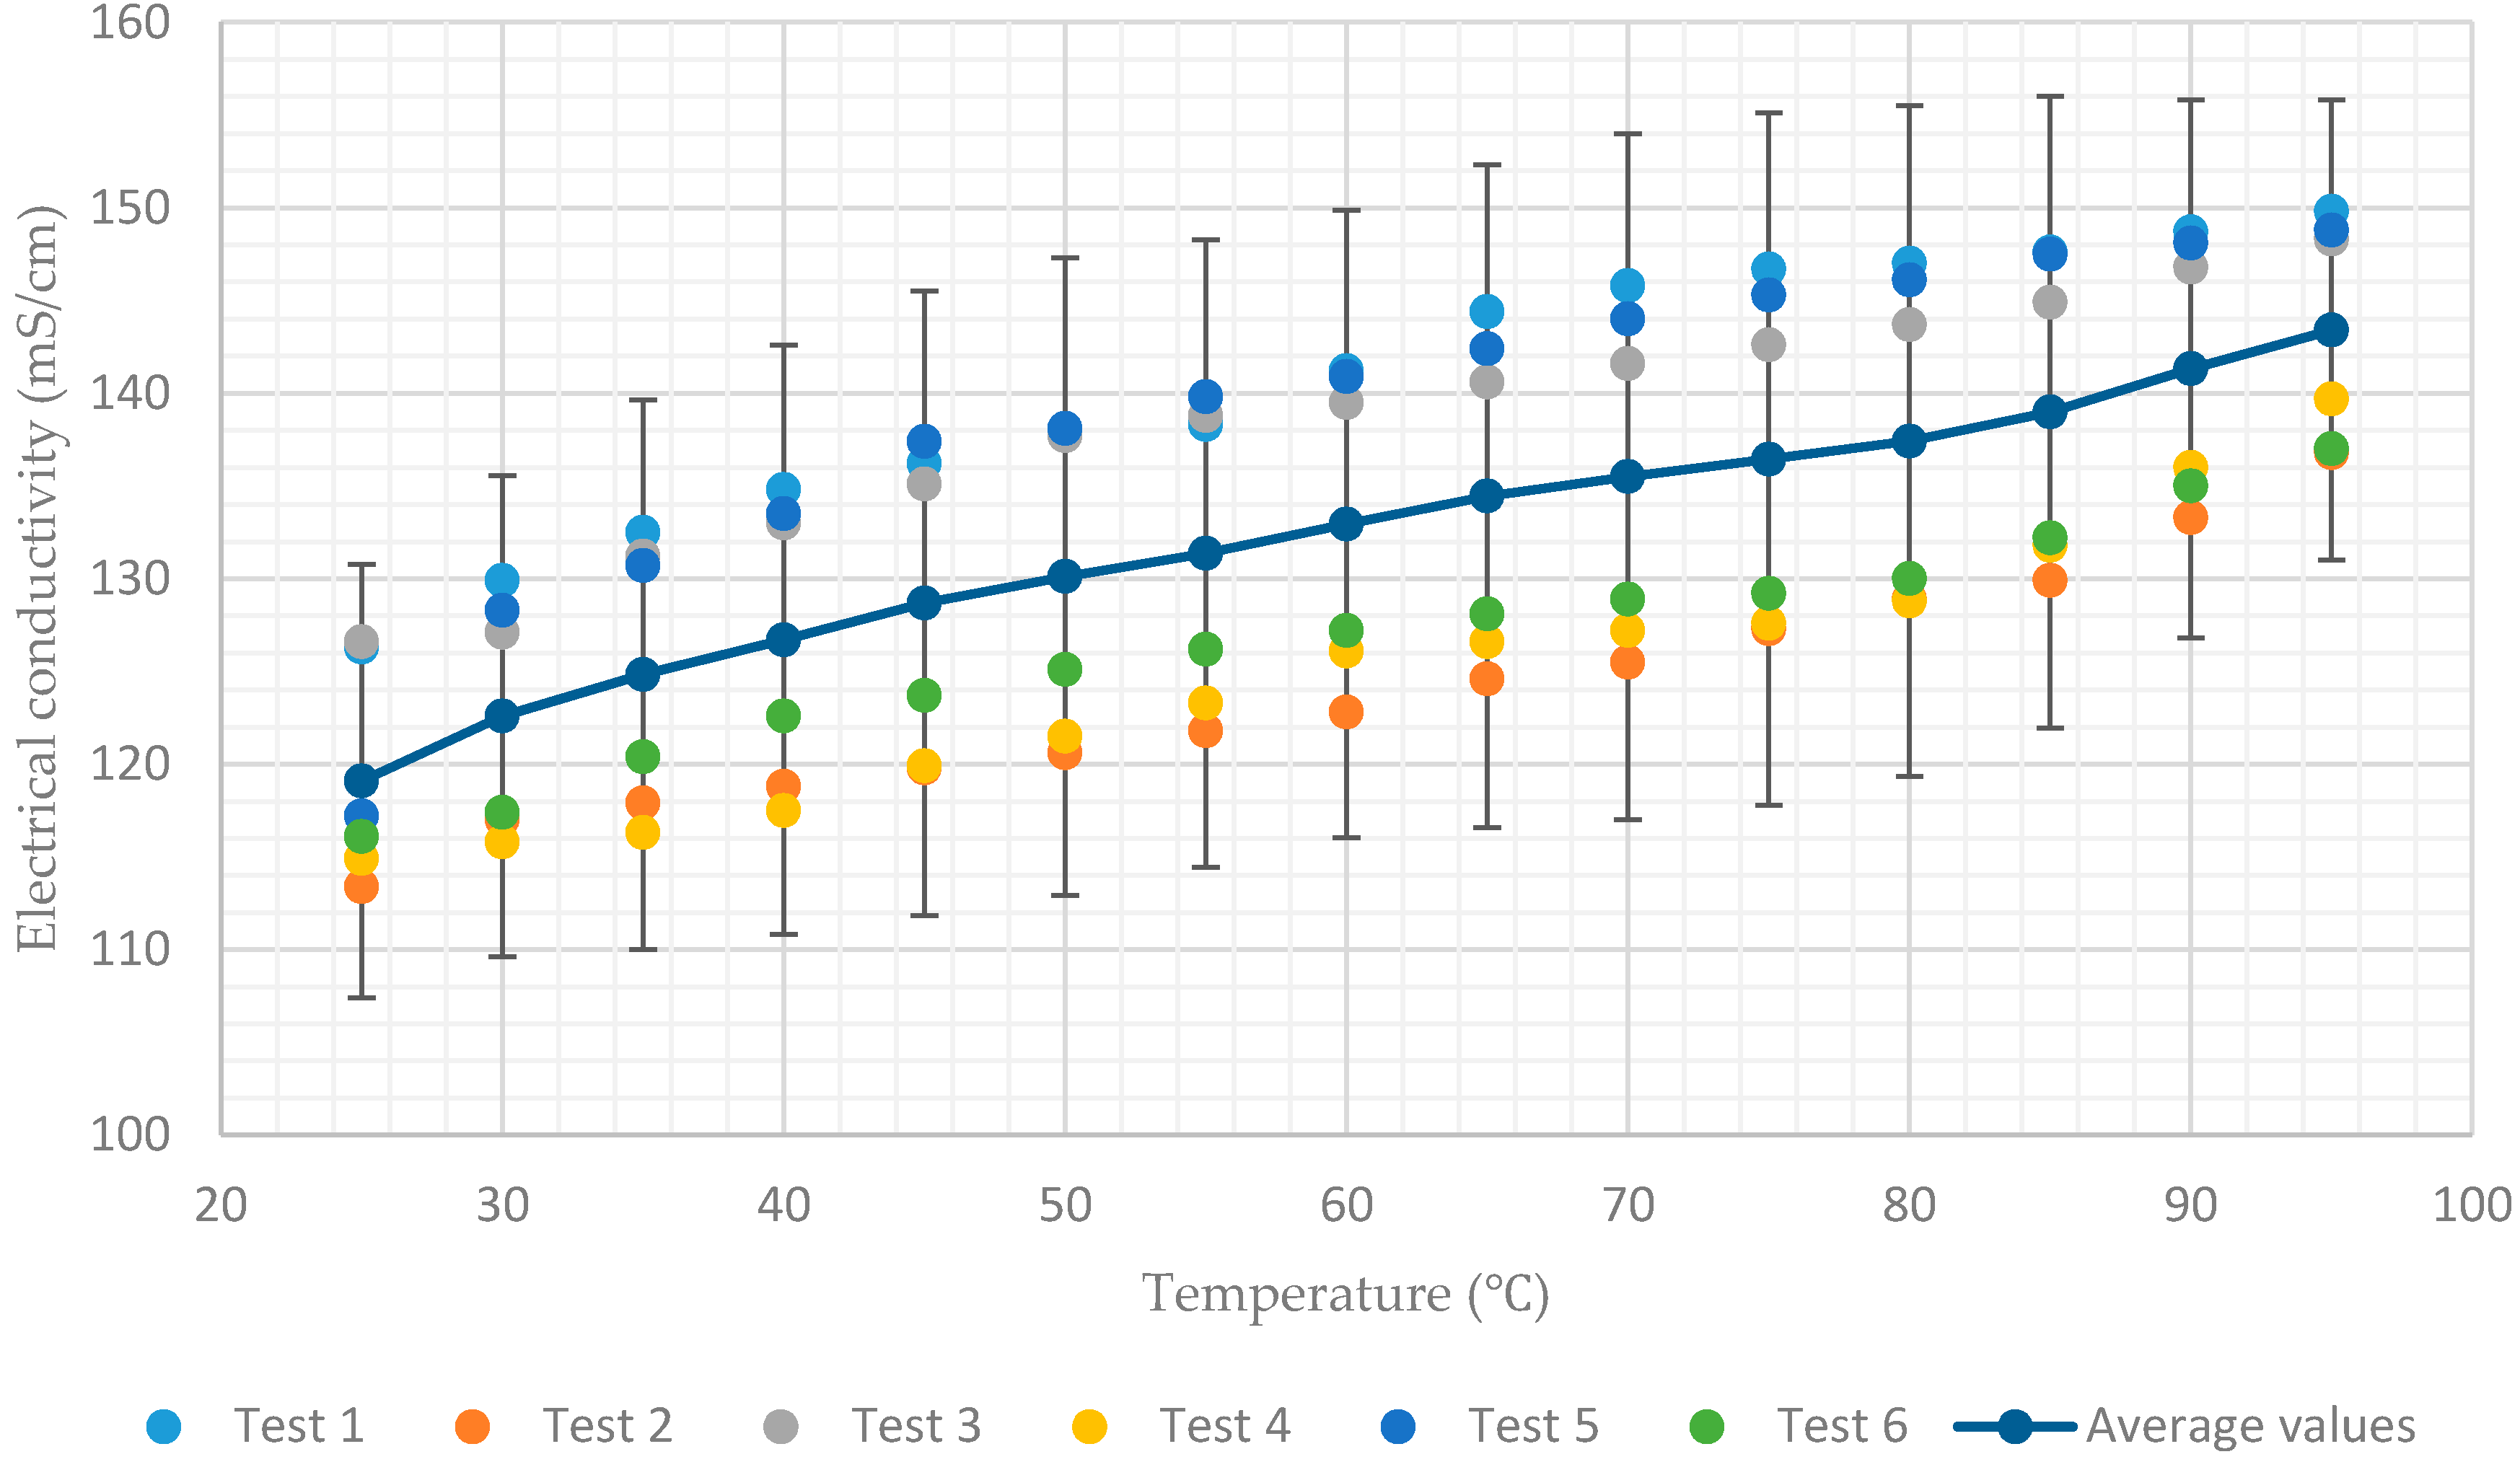
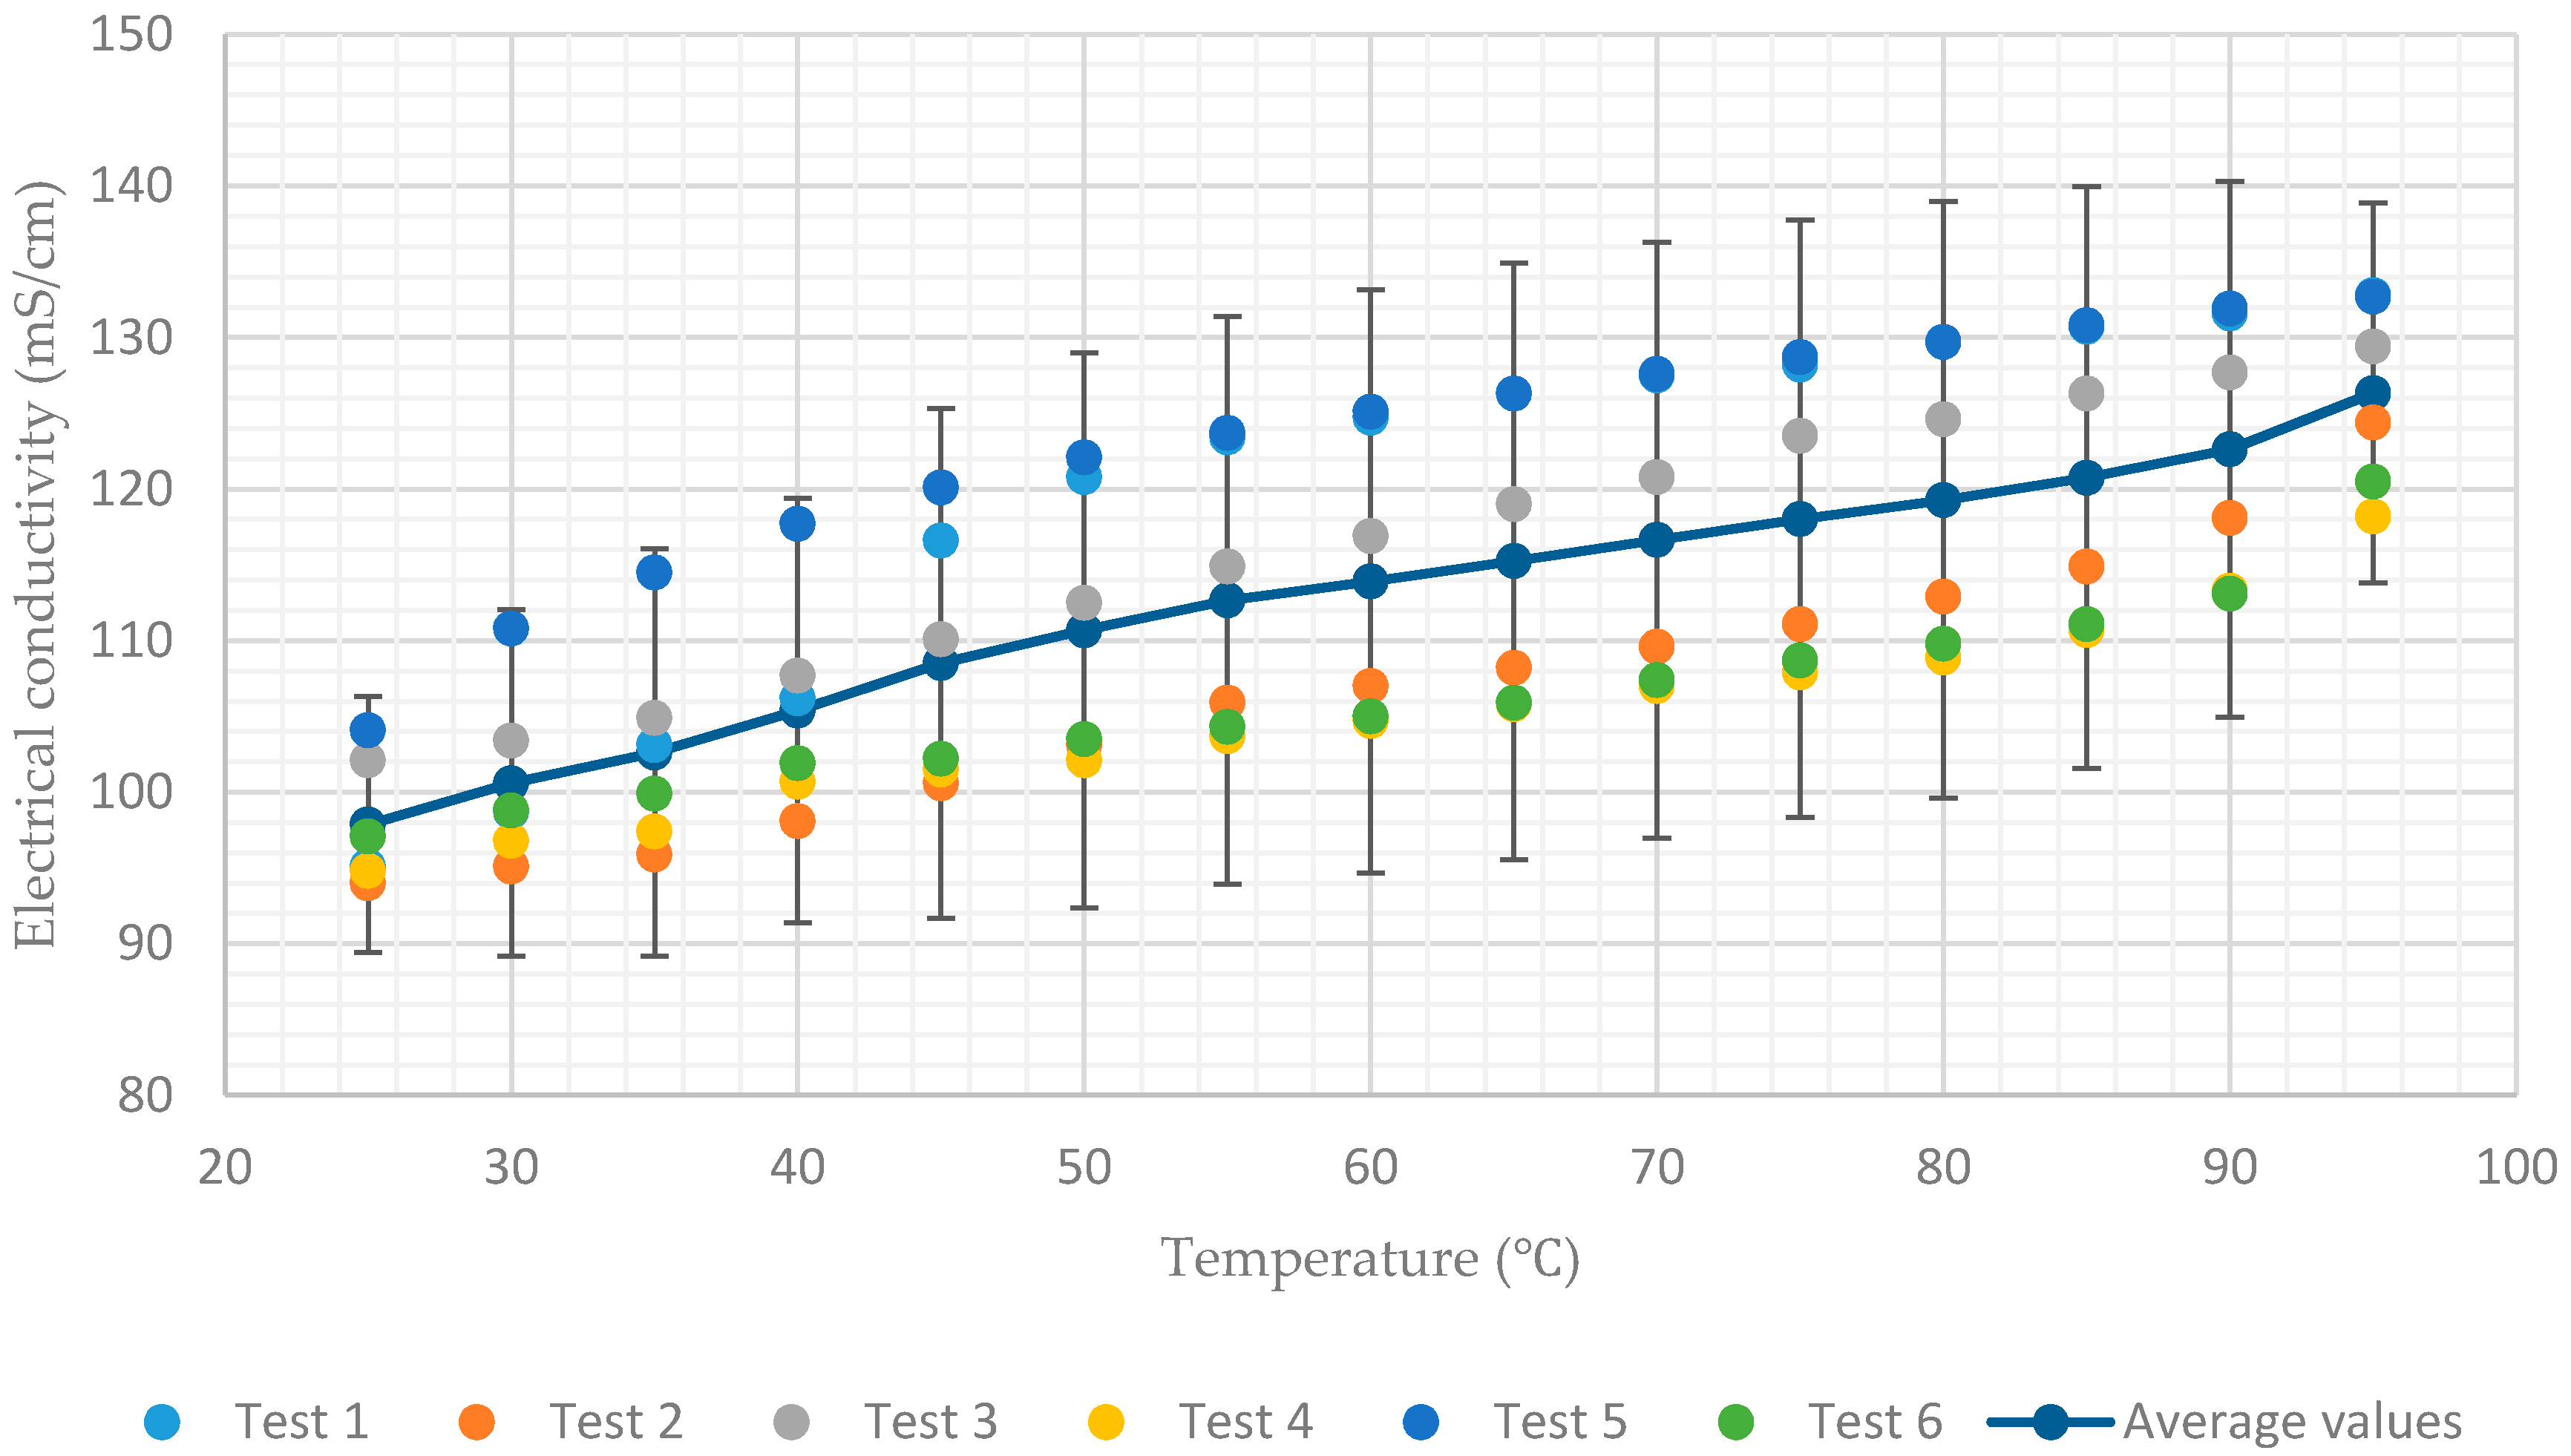
In contrast, the average values of electrical conductivity increase from 119 mS/cm to 143.4 mS/cm and from 97.8 mS/cm to 126.3 mS/cm for the solution concentrations of 55% and 60% respectively, when the temperature increases from 25
to 95
, as shown in
Figure 5 and
Figure 6. As a result, it can be concluded that when the concentration of the solution is increased, the electrical conductivity of the solution becomes more sensitive to the change in temperatures of the solution.
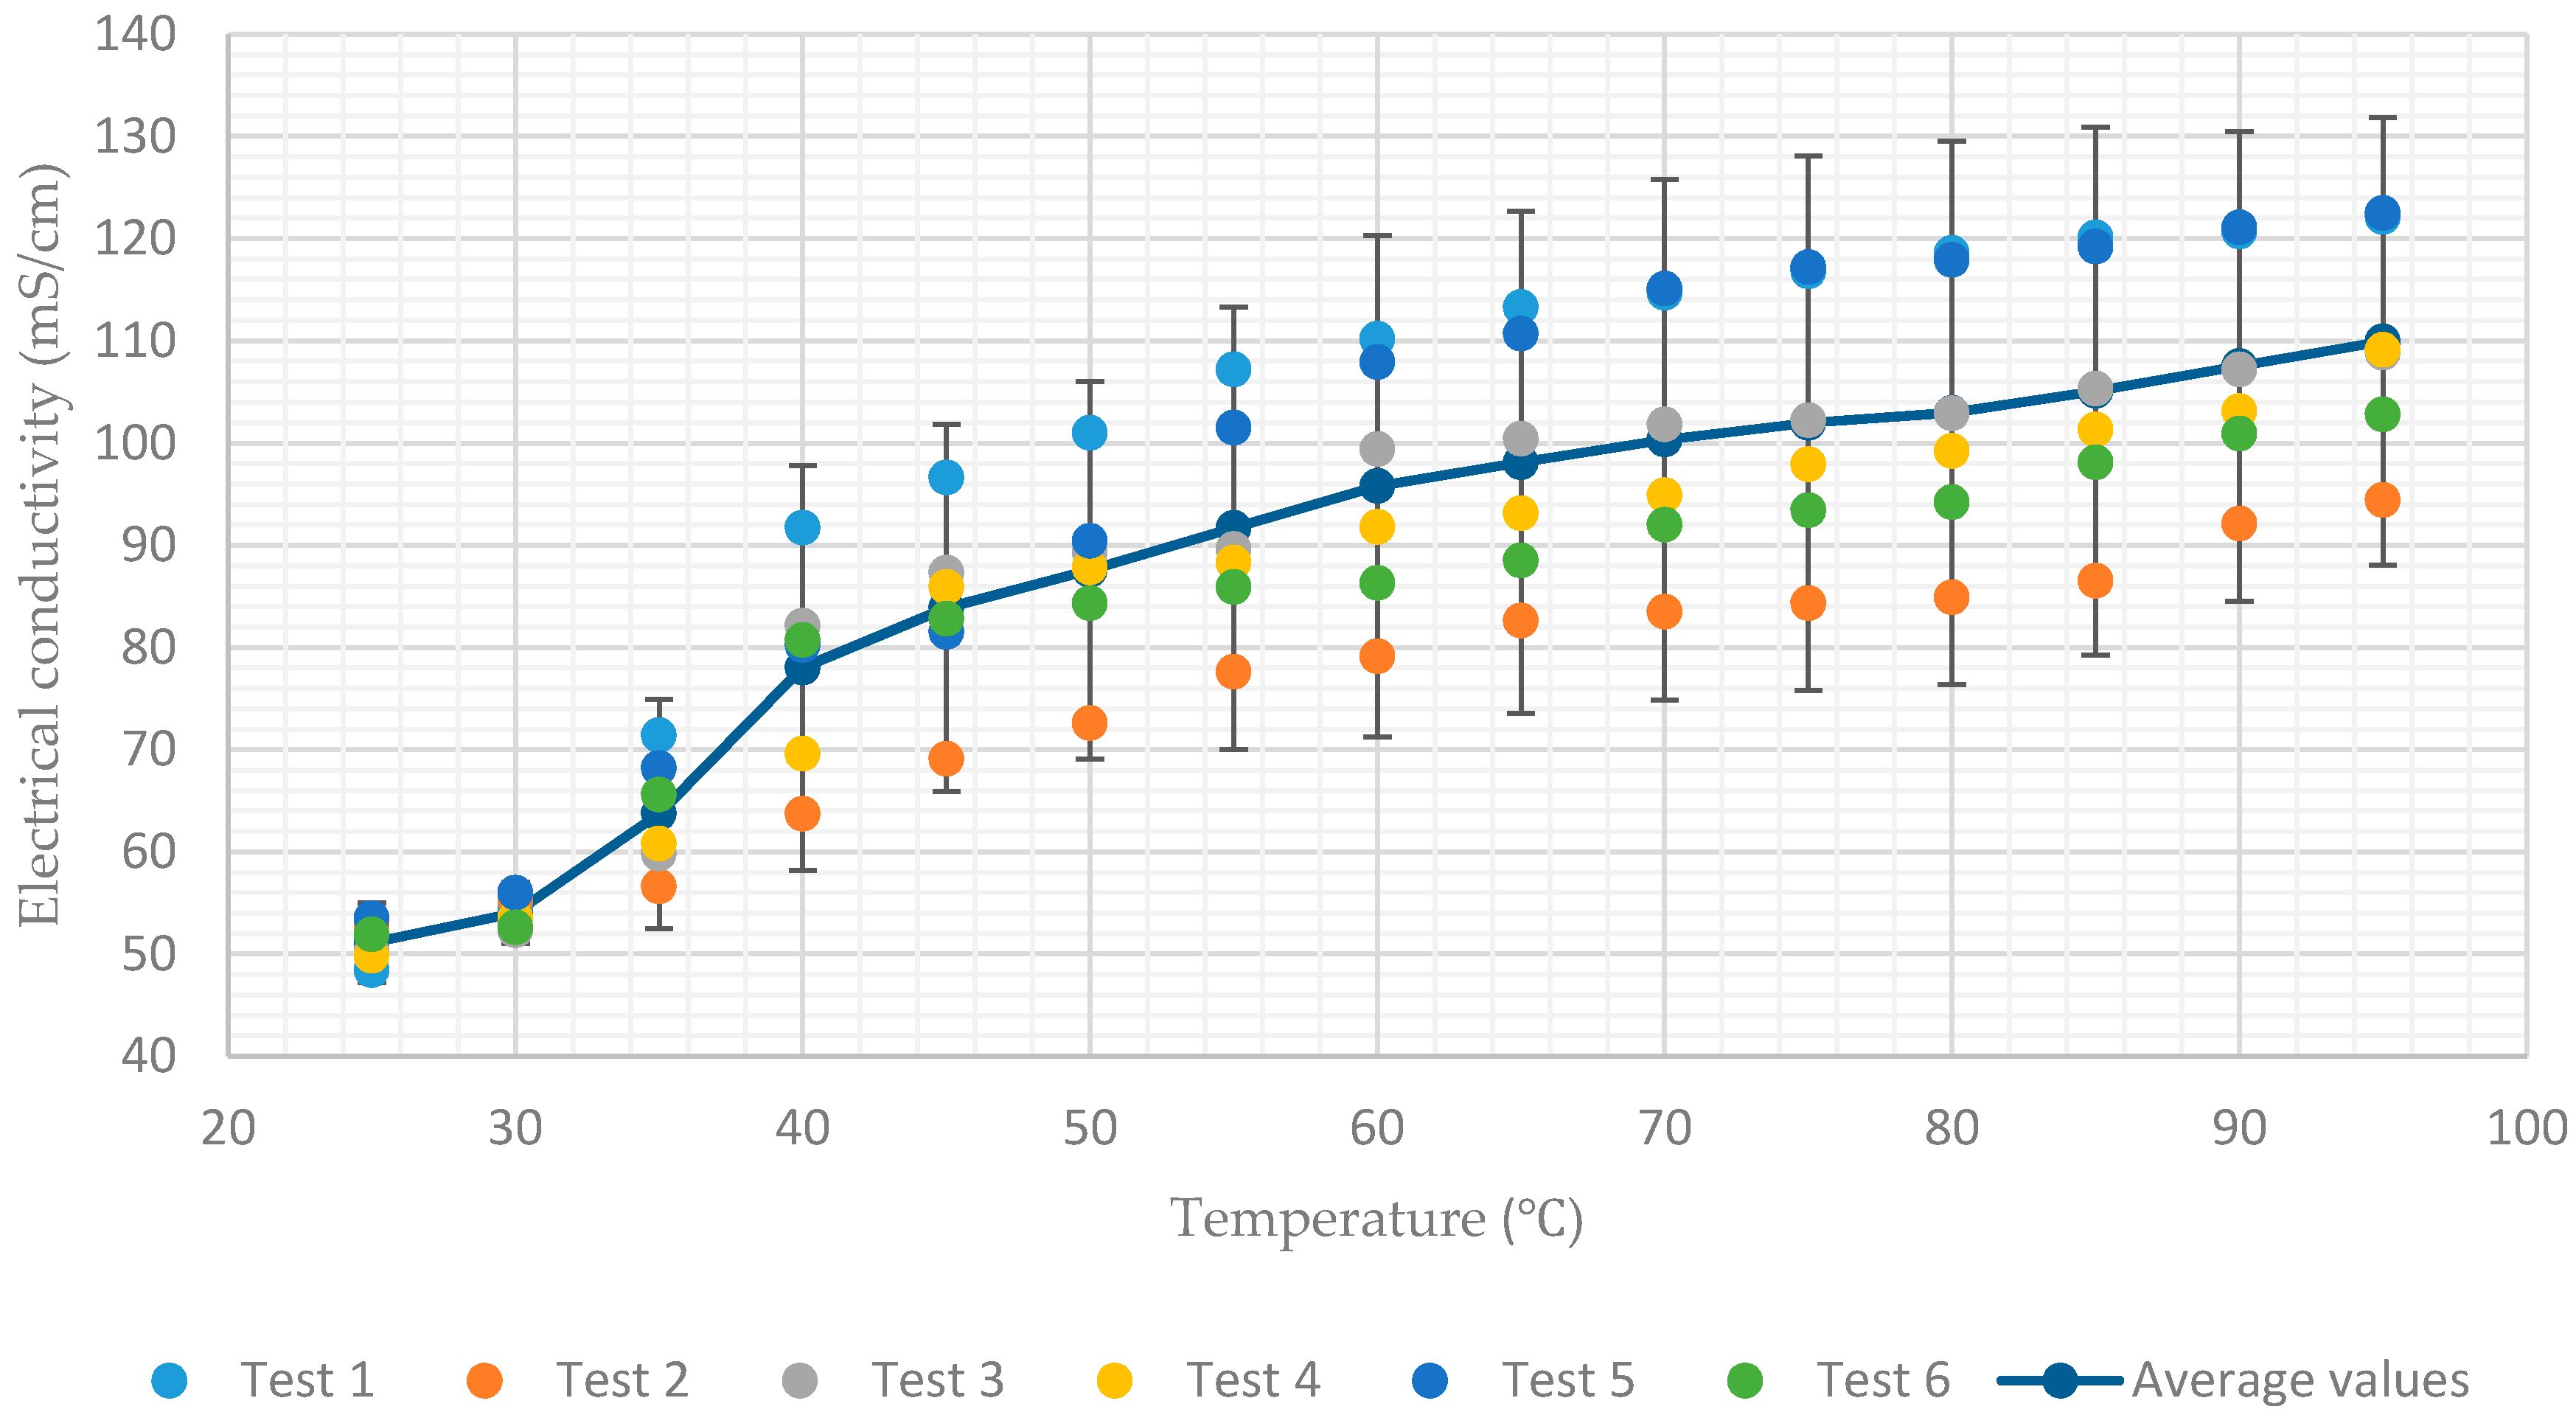
Additionally,
Figure 7 shows a rapid decrease in conductivity when the temperature of the solution having a concentration of 65% approaches 40
. This coincides with the onset of crystallization of the lithium–bromide from solution. As a result, the average values of electrical conductivity decrease rapidly from 78 mS/cm to 51 mS/cm when the temperature decreases from 40
to 25
. In all charts, for each solution concentration, average values of the six tests and error bar corresponding to two sample standard deviations (95% confidence interval) were plotted. In practice, the confidence intervals are typically stated at the 95% confidence level so that the result has only a 5% chance of being false [
10].
Another interesting point which can be seen in
Figure 3,
Figure 4,
Figure 5,
Figure 6 and
Figure 7 is that almost all the test results (tests 1, 3, and 5) which had been recorded when the solution temperature was increasing are above the average values. On the other hand, the test results (test 2, 4, and 6) recorded when the solution temperature was decreasing are below the average values. This discrepancy can be attributed to the rate of heating being much higher than the rate of cooling during the tests.
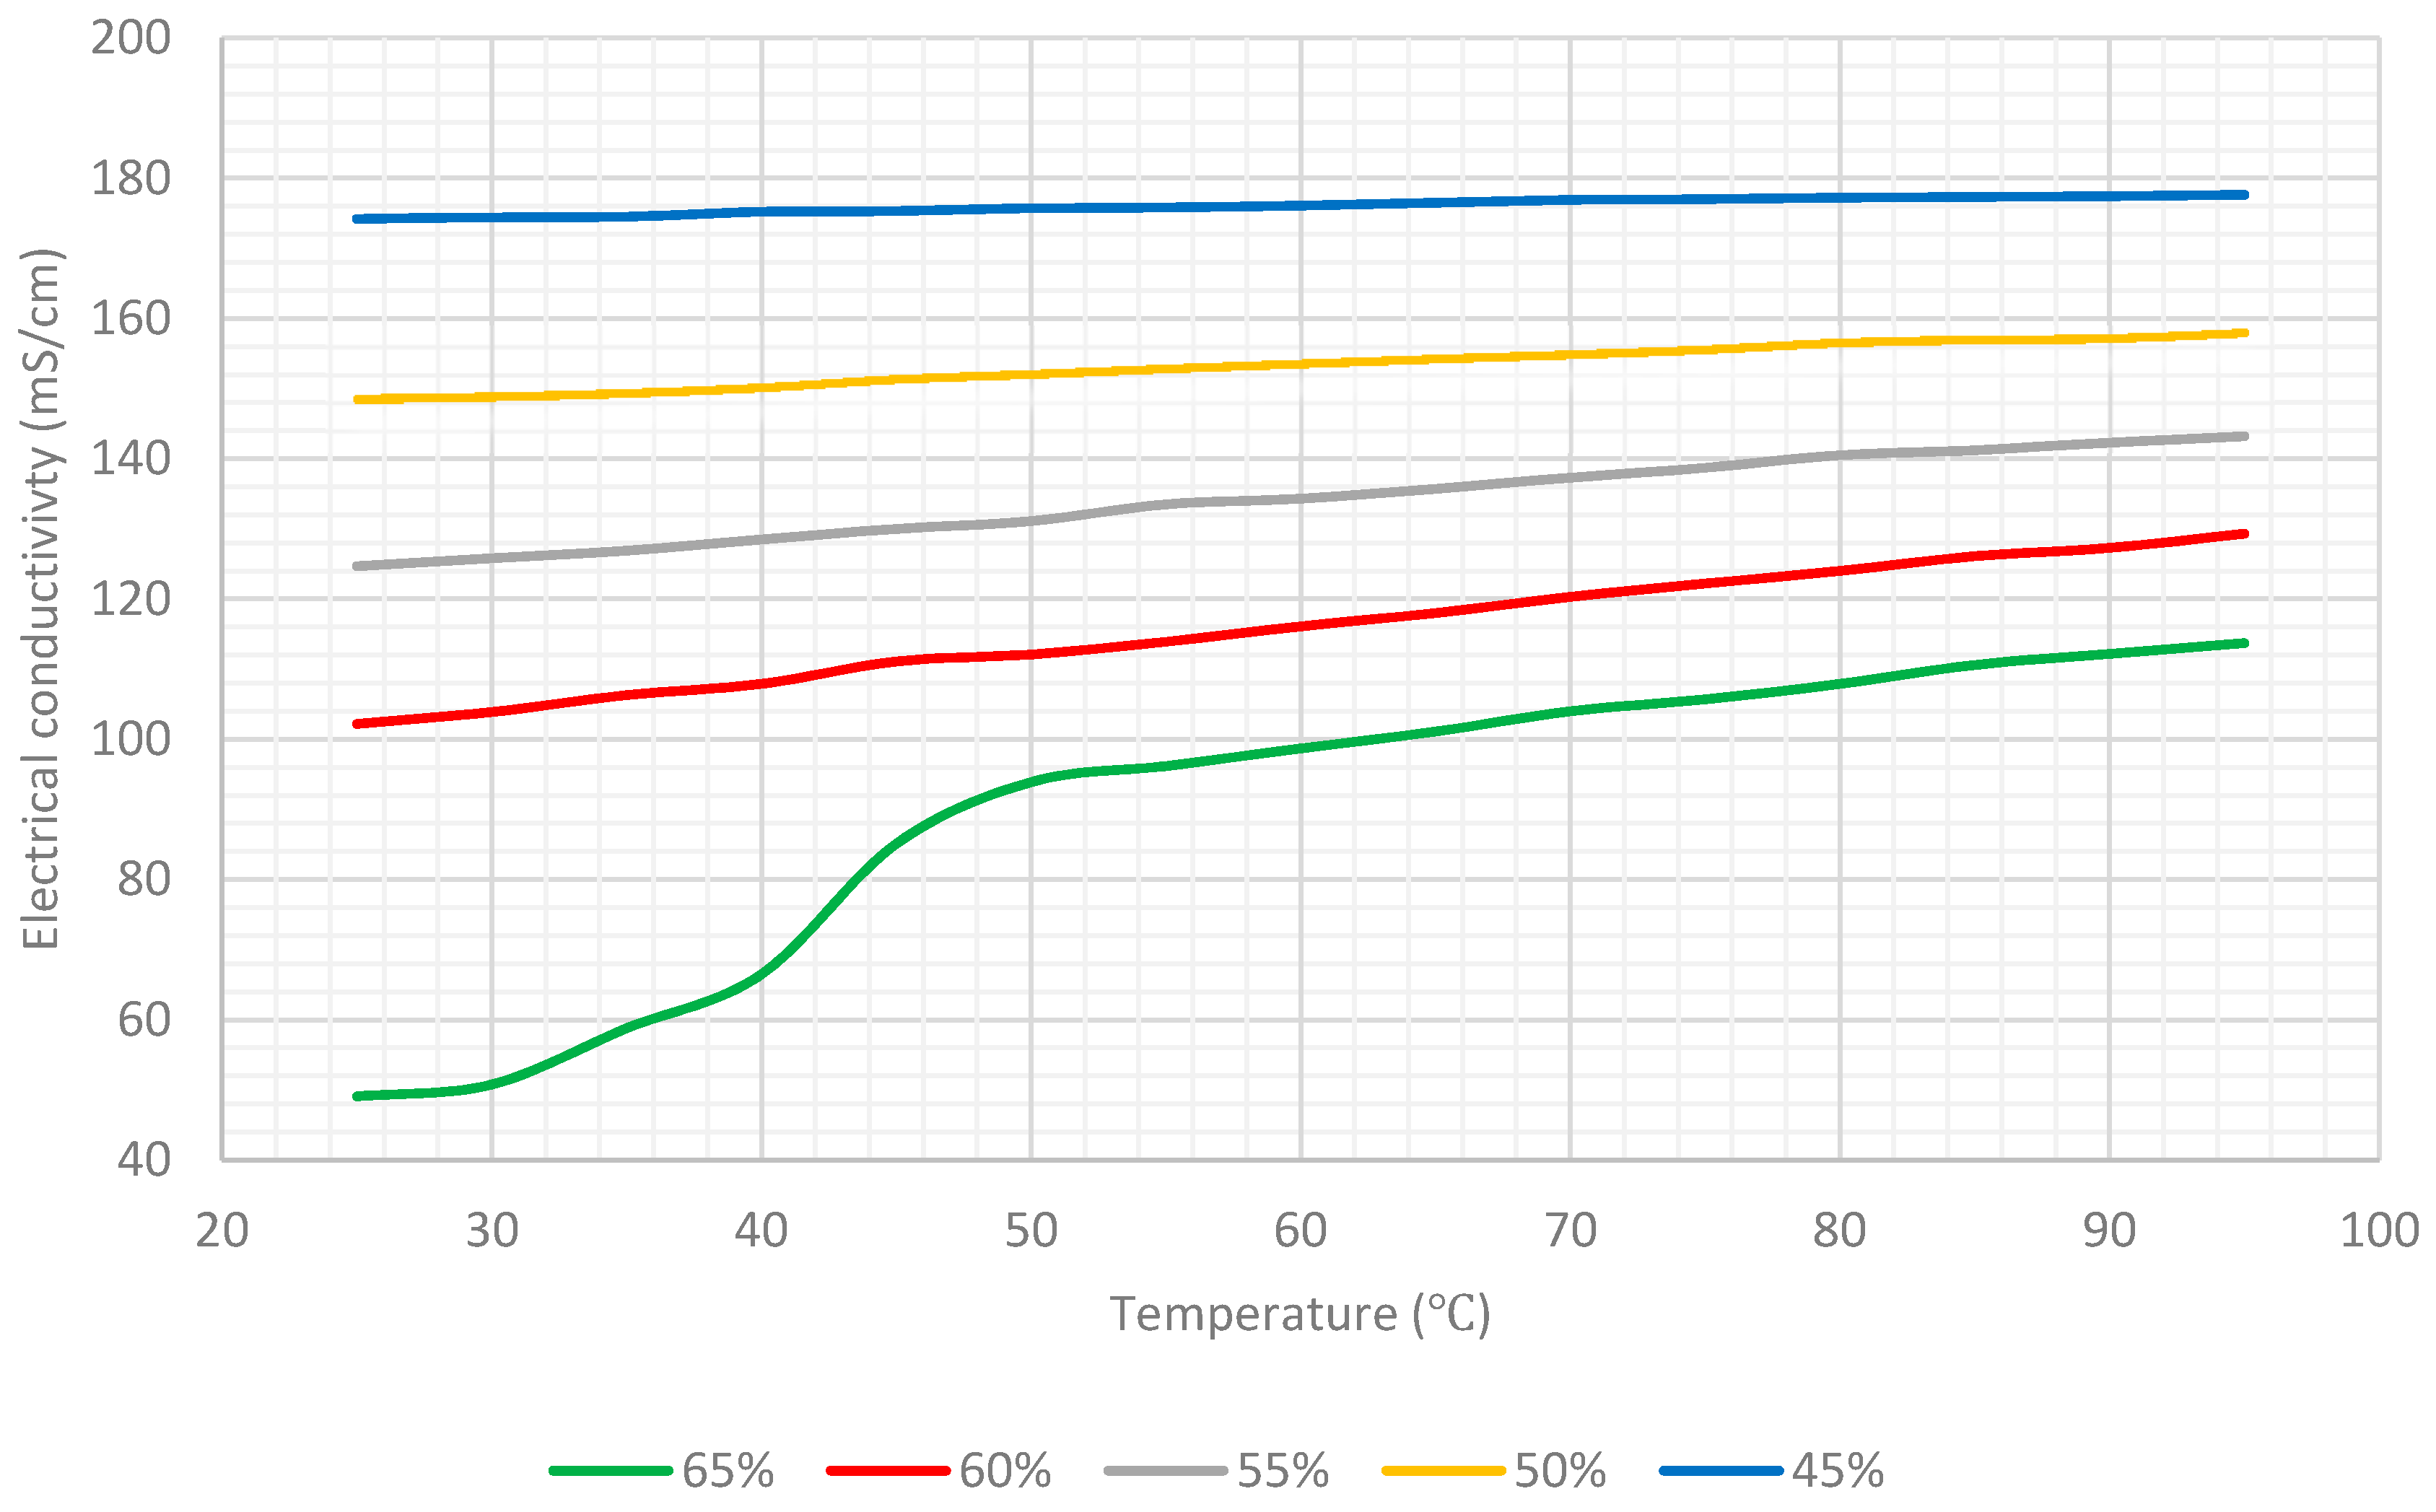
Table 1 lists the average values of the electrical conductivity of the aqueous lithium–bromide solution for concentrations of 45%, 50%, 55%, 60%, and 65% at various temperatures, and
Figure 8 shows this data in graphical form.
Regression analysis using all data except the 65% concentration set was done in order to arrive at the empirical correlation shown in Equation (1).
where C is the LiBr mass concentration of solution (% by mass), T is the temperature of LiBr/water solution (
), and EC is the electric conductivity of the LiBr/water solution (mS/cm). This empirical equation is only valid for a LiBr mass concentration range of
and for a temperature range of
.
Equation (1) can be used to estimate the concentration of aqueous lithium–bromide solution in any vapour absorption refrigeration system that uses a similar measurement technique to that which was used in this experimental work for the electrical conductivity and temperature of aqueous lithium–bromide solution. This empirical correlation has been determined with predictive values (
p-values) of
and
for the temperature and the concentration, respectively. Both
p-values are lower than the common alpha level of 0.05, which indicates that both of the independent variables (temperature and concentration) are statistically significant [
11].
Table 2 lists the values of the electrical conductivity of the aqueous lithium–bromide solution for concentrations of 45%, 50%, 55%, and 60% with temperatures ranging from 25
and 95
. These values have been estimated by using Equation (1). The maximum error in the concentration when using Equation (1) was calculated to be 5.8%.
Also,
Table 3 lists the values of the electrical conductivity of the aqueous lithium–bromide solution for a concentration of 65% with temperatures ranging from 45
and 95
. These values have been estimated by using Equation 1 (extrapolation outside applicable range). The maximum error in the concentration when using Equation 1 was calculated to be 8.5%.
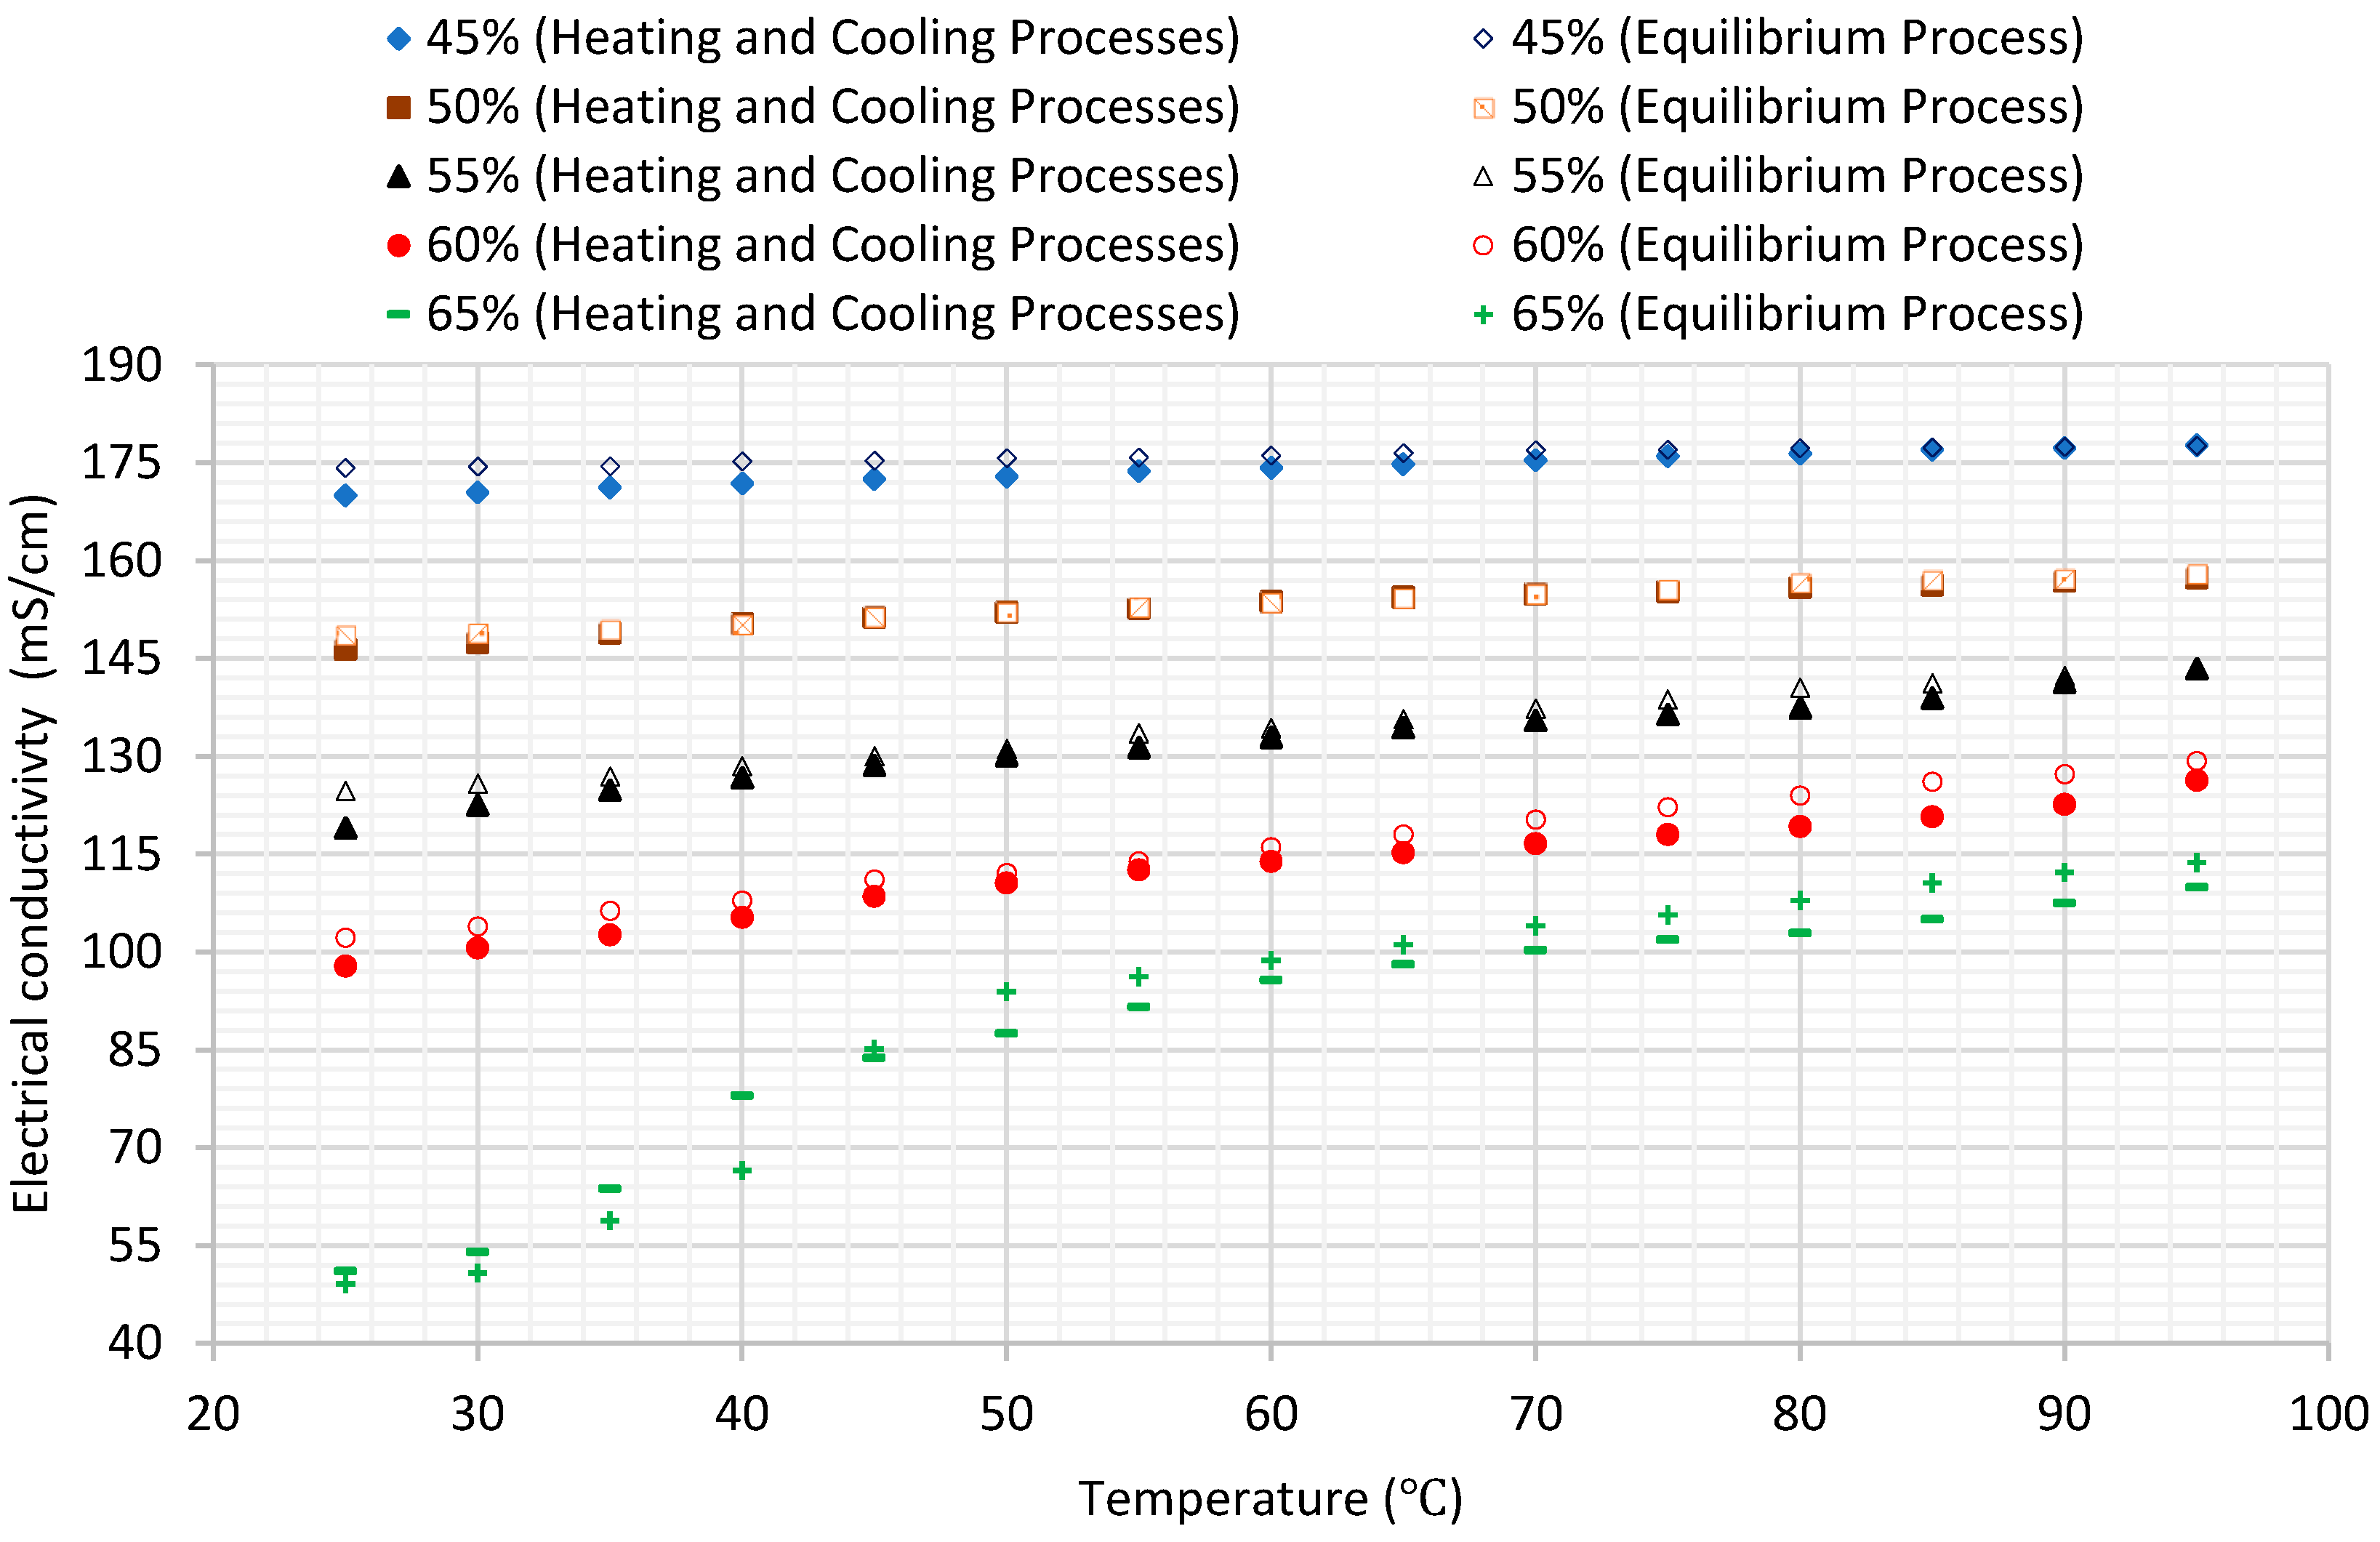
Table 4 lists the values of the electrical conductivity of the aqueous lithium–bromide solution for concentrations of 45%, 50%, 55%, 60%, and 65% at various temperatures when the solution was at steady state conditions, and
Figure 9 shows this data in graphical form. Furthermore,
Figure 10 compares the results of average values of the electrical conductivity of the aqueous lithium–bromide solution for concentrations of 45%, 50%, 55%, 60%, and 65% obtained from the heating and cooling processes with that obtained from the steady state process in which the solution was allowed to reach thermal equilibrium. The comparison shows that both of the results were very close even though the techniques used to collect the data were different. As a result of the validation of the data obtained for concentrations of 45%, 50%, 55%, and 60% from both experiments, the empirical correlation presented in Equation (1) can always be used whether the solution is at steady state or transient phase.
4. Conclusions
An empirical equation to determine the concentration of the aqueous lithium–bromide solution has been presented with ranges of validity and estimated error. For intermediate values, a linear interpolation between the data in
Table 1 can be used to estimate the concentration of the LiBr/water solution within the range of study. This work has been performed due to the need for such an empirical equation to be used easily to determine the LiBr mass concentration of solution in the vapour absorption refrigeration system when the temperature and electrical conductivity are known. Moreover, this method has been tested in an experimental vapour absorption refrigeration facility under study at the University of Malta, and the results showed a good indication for determining the LiBr/water solution concentration.
Therefore, the method used in this work has taken into consideration the working conditions of LiBr/water solutions inside a vapour absorption refrigeration system. Since the LiBr/water solution moves from one component to another inside the vapour absorption refrigeration system, and each component has a different operation temperature than any other one, the temperature of the LiBr/water solution is made to change drastically and frequently up and down during the operation of the vapour absorption refrigeration system. Consequently, similar working conditions were exposed to the LiBr/water solutions during this work by increasing and reducing the solution temperatures during the tests. Finally, given that the toroidal conductivity sensor used in this experimental work was designed to be used in submersion or pipe flow applications, this conductivity measurement system can be used in any vapour absorption refrigeration system without disturbing the solution flow or the system function.


