1. Introduction
The European Community adopted the Biodiversity Strategy to 2020 that, through Action 5 of Target 2, encourages Member States to map and assess the condition of the Ecosystems Services at all scales [
1]. Thus, a context-aware geographical data gathering has become a crucial step of the spatial decision-making processes since it should guarantee openness, involvement, and democracy to the evaluation. Nowadays, the knowledge of the landscape through global and local data is one of the major challenges for researchers, practitioners and decision-makers (DM). The heterogeneity of the public, private, and voluntary dataset entails different standards, formats, and scattered sources [
2]. Consequently, some environmental agencies, such as the European Environment Agency (EEA), have been focusing on the achievement of geospatial interoperability for many years. Depending on the goal, a suitable methodology must be able to level out a heterogeneous and cross-scale dataset in order to evaluate landscape services (LS) and ecosystem services (ES).
Moreover, the evaluation of the trade-off between the increase in demand for primary resources due to the population growth and the degradation in the capability to provide ecosystem services has become critical. Indeed, The Millennium Ecosystem Assessment estimated that “3 billion more people and a quadrupling of the world economy by 2050 imply a formidable increase in demand for and consumption of biological and physical resources, as well as escalating impacts on ecosystems and the services they provide” [
3]. Critical issues concern the implementation of the local communities’ knowledge about the phenomenon of the degradation of ES in order to ensure a more sustainable use of the resources and to enhance the resilience of landscape socio-ecological system.
Since 2000, the European Landscape Convention has been developing a new perspective for the perception of a landscape socio-ecological system where people become a crucial part of this system, providing services and benefits to human well-being due to sustainable transformations and ecological resource preservation [
4,
5]. Therefore, a multi-disciplinary approach is recommended in order to analyze the dynamism of the transformations and land-use changes, considering that a broader vision of the landscape is more suitable.
According to Termorshuizen and Opdam, the ES can be considered as a specification of the LS approach; indeed, the landscape functions are linked to the feature of the ecosystem processes and to their capacity for producing services [
6].
Within the literature there are several issues about the concept of ES and LS; however, in this research we seek to highlight three main questions:
What are the strengths and the weaknesses of the LS approach, if we compare it with the institutional approaches, such as the Environmental Impact assessment (EIA) and the strategic environmental assessment (SEA)?
What are the suitable methods and tools to recognize, map, manage, and evaluate the complexity of the LS?
What are the reliable data sources to be used in order to understand the link between the social and ecological systems?
Some authors have been recently focusing on the first question. They have argued that the LS approach can be useful to bridge the gap among decision-makers (DM), stakeholders, and local communities, as it provides a shared framework according to which the landscape perspective changes [
7,
8,
9]. According to other authors, instead, the ES approach aids the DM to focus on the impact of the environment on the planning strategies rather than just vice versa [
10]. At the same time, the LS concept considers the landscape as a “value-delivering system” [
6] for which multi-functional features co-exist within an human-ecological value system that connects the ecological functioning to the human values and functions [
11]. On the other hand, this approach has some problems concerning the integration within the environmental assessment (EA) procedures and in the uncertainty about the recognition of ecosystem functions and services at different scales [
12]. Therefore, the evaluation of the LS requires a multi-scale approach since a lack of interaction among the levels of the governance has led to an incorrect management of the services or their exclusion from the planning.
In response to the second question, the multi-criteria methods are recommended when DM and specialists within the EA framework tackle landscape monetary, qualitative, and quantitative valuations [
13,
14]. At one time, the landscape, as a system made by patterns, functions, and changes [
15], can be examined through the combination of spatial indicators and multi-criteria analysis (MCA) in order to understand not only the anthropic and natural transformation processes, but also the result of different time actions which are strictly interrelated each other [
16,
17]. Thus, the multi-criteria spatial decision making support system (MC-SDSS) allows DM to acquire and learn more information about the multi-dimensional issues to choose their preferences among different alternatives [
18,
19,
20]. A great support for decision-making processes is provided by GIS tools that are systems with functions of storage, manipulation, analysis, and display of a large geographically-referenced dataset through analytical modeling operations [
21,
22].
Finally, the availability of the information relating to landscape pattern aims to investigate the link between social and ecological systems. A preliminary step should involve data collection from official sources, such as environmental and governmental agencies, while the unofficial ones, such as volunteered geographical information (VGI) and social media geographic information (SMGI), can be useful to enhance the information flow whenever a quality assurance is accomplished. Indeed, some authors assert that the quality of VGI is often better than the authoritative sources [
23,
24]. Moreover, the spatial analysis allows to set explicitly spatial indicators [
25] and evaluate the multidimensional features of the landscape [
26].
Therefore, the paper aims at focusing on the second and third questions listed above, by specifically tackling the reliability of the sources to be used to build a dataset for the identification and evaluation of LS.
The first part of the paper defines materials and methods allowing a better knowledge of the landscape through data, indicators and multi-criteria procedures; the second one shows the case study and the results.
2. Material and Method
In this section, we show a proposal for a possible landscape evaluation model. A spatial representation model that assimilates the landscape to a mosaic of patches is performed [
27]. Indeed, the environmental structures are decomposable into systems and subsystems and, in order to understand the complex network of the human/natural components, a cross-scale approach is recommended. The methodology of the research derives from common data availability such as authoritative sources and volunteered geographic information. In summary, the multi-criteria method aims at quantifying the critical information included in the database, by assigning weights to each indicators and by mapping the consistency of services in the territory through the analysis of the impact distance and the DM preferences. In the next subsections, we illustrate the methodological framework provided, the data-gathering from open sources, and the classification of the spatial indicators for the landscape evaluation.
2.1. Knowledge-Mapping-Evaluation Model: The Workflow
Once the conceptual framework has been determined, it is necessary to define the steps of the methodological framework for the evaluation of the LS. Therefore, the MC-SDSS has been conceived in three main steps: knowledge, mapping, and evaluation [
28].
The first step seeks to identify the LS that produces benefits in the urban zones of Naples by checking the available data and by outlining the cognitive context. We collected data from both official and unofficial sources. Several spatial indicators of LS were selected and structured according to a hierarchical classification.
The second step is mapping the indicators of the selected LS in the knowledge phase, in order to include each LS indicator within a spatial reference system by making the benefits spatially explicit. We performed some operations through GIS software in order to standardize the data according to common parameters; thus, all the collected shapefiles were georeferenced in the WGS84/UTM zone 33N coordinate system. The census zones were chosen as minimal reference units for the spatial analysis, namely a spatial join operation was performed by appending a point layer’s attribute table to the attribute table of the census zones based on the relative locations.
The third step aims to compute the multi-criteria evaluation of the relative importance and priorities of each LS indicator through the analytic hierarchy process (AHP) method. This method is suitable in a decisional context in which qualitative and quantitative indicators are involved, since it allows comparing of heterogeneous aspects in a single scale value by comparing, in pairs, the element within the hierarchy through a consistency check of the judgments [
29]. Indeed, the multifunctional landscape has been processed as a hierarchy of services in order to simplify the complexity and lay the groundwork for a deeper understanding of the trade-off among ecosystem and anthropic functions. According to the levels of the hierarchical classification, the Multi-criteria Analytical Scoring Tool (MASCOT) software [
30], provided by EnviroSPACE Laboratory at University of Geneva, Switzerland, was implemented in the GIS environment to compare each sub-criteria through a weighting. MASCOT provided a distance-based method that aims at evaluating the spatial impact of each criterion in the context; namely, it allows us to use a distance decay, for which the spatial indicator gradually loses its intensity until the limit of distance setting.
2.2. Authoritative and Unofficial Data Sources
As previously seen, the data for the evaluation have different standard, format and scattered sources. According to Malczewski and Ogryczak, spatially-explicit and -implicit criteria have to be previously determined in order to structure the decision model [
22]. The majority data that describe the LS of the study area are part of the spatially explicit criteria, such as the geographic features of the EEA and OpenStreetMap (OSM) databases.
Urban Atlas is an initiative of the European Commission with the support of the EEA and the European Space Agency, through the GMES/Copernicus land monitoring services. The project aims at filling the gap in the knowledge about land use in European cities [
31]. It offers highly detailed urban land use maps, at a scale of 1:10,000, for large urban zones and their surroundings with more than 100,000 inhabitants, as defined by Eurostat [
32]. The aerial imagery reference year is 2006 and the minimum mapping unit (MMU) is 0.25 ha in urban areas and 1 ha in rural ones. It provides a 20-class classification based on Corine Land Cover (CLC) nomenclature with a better resolution [
33].
OSM is one of most well-known databases of crowdsourcing geographic information where geographic features about morphology, habitat, biodiversity, and networks at the urban scale can be easily downloaded and shared [
23]. The critical ability of this informative system is related to the voluntary mapping of urban features by citizens observing and living the places. Moreover, VGI can bridge the gap of the official agencies that lack up-to-date geographic information. Actually, there are some approaches for assuring and improving the quality of data in the VGI, e.g., crowdsourcing, social and geographic mechanisms were recognized by Goodchild and Li [
24].
In conclusion, Panoramio, as a Google Maps tool, is the last example of VGI we implemented in this research. An excerpt of a point pattern, through a code, represents the most photographed places by citizens and tourists in the study area. This indicator is able to simulate landscape attractiveness, as citizens or tourists perceive it.
2.3. Landscape Services (LS) Classification
A broad range of ES and LS classifications exist, often dependent on the different investigation fields, but, for this case study, three main approaches were considered. Specifically:
De Groot defines the ecosystem functions as “the capacity of natural processes and components to provide goods and services that satisfy human needs, directly or indirectly” [
34].
The Millennium Ecosystem Assessment (MA) takes into consideration “the benefits people obtain from ecosystems” [
3];
The Economics of Ecosystems and Biodiversity (TEEB) initiative considers the ES as “the direct and indirect contributions of ecosystems to human well-being” [
35].
The LS approach, as a specification of ES, was considered by including the multiple ecological, social, and economic functions that the landscape furnishes for human well-being in a specific context [
26].
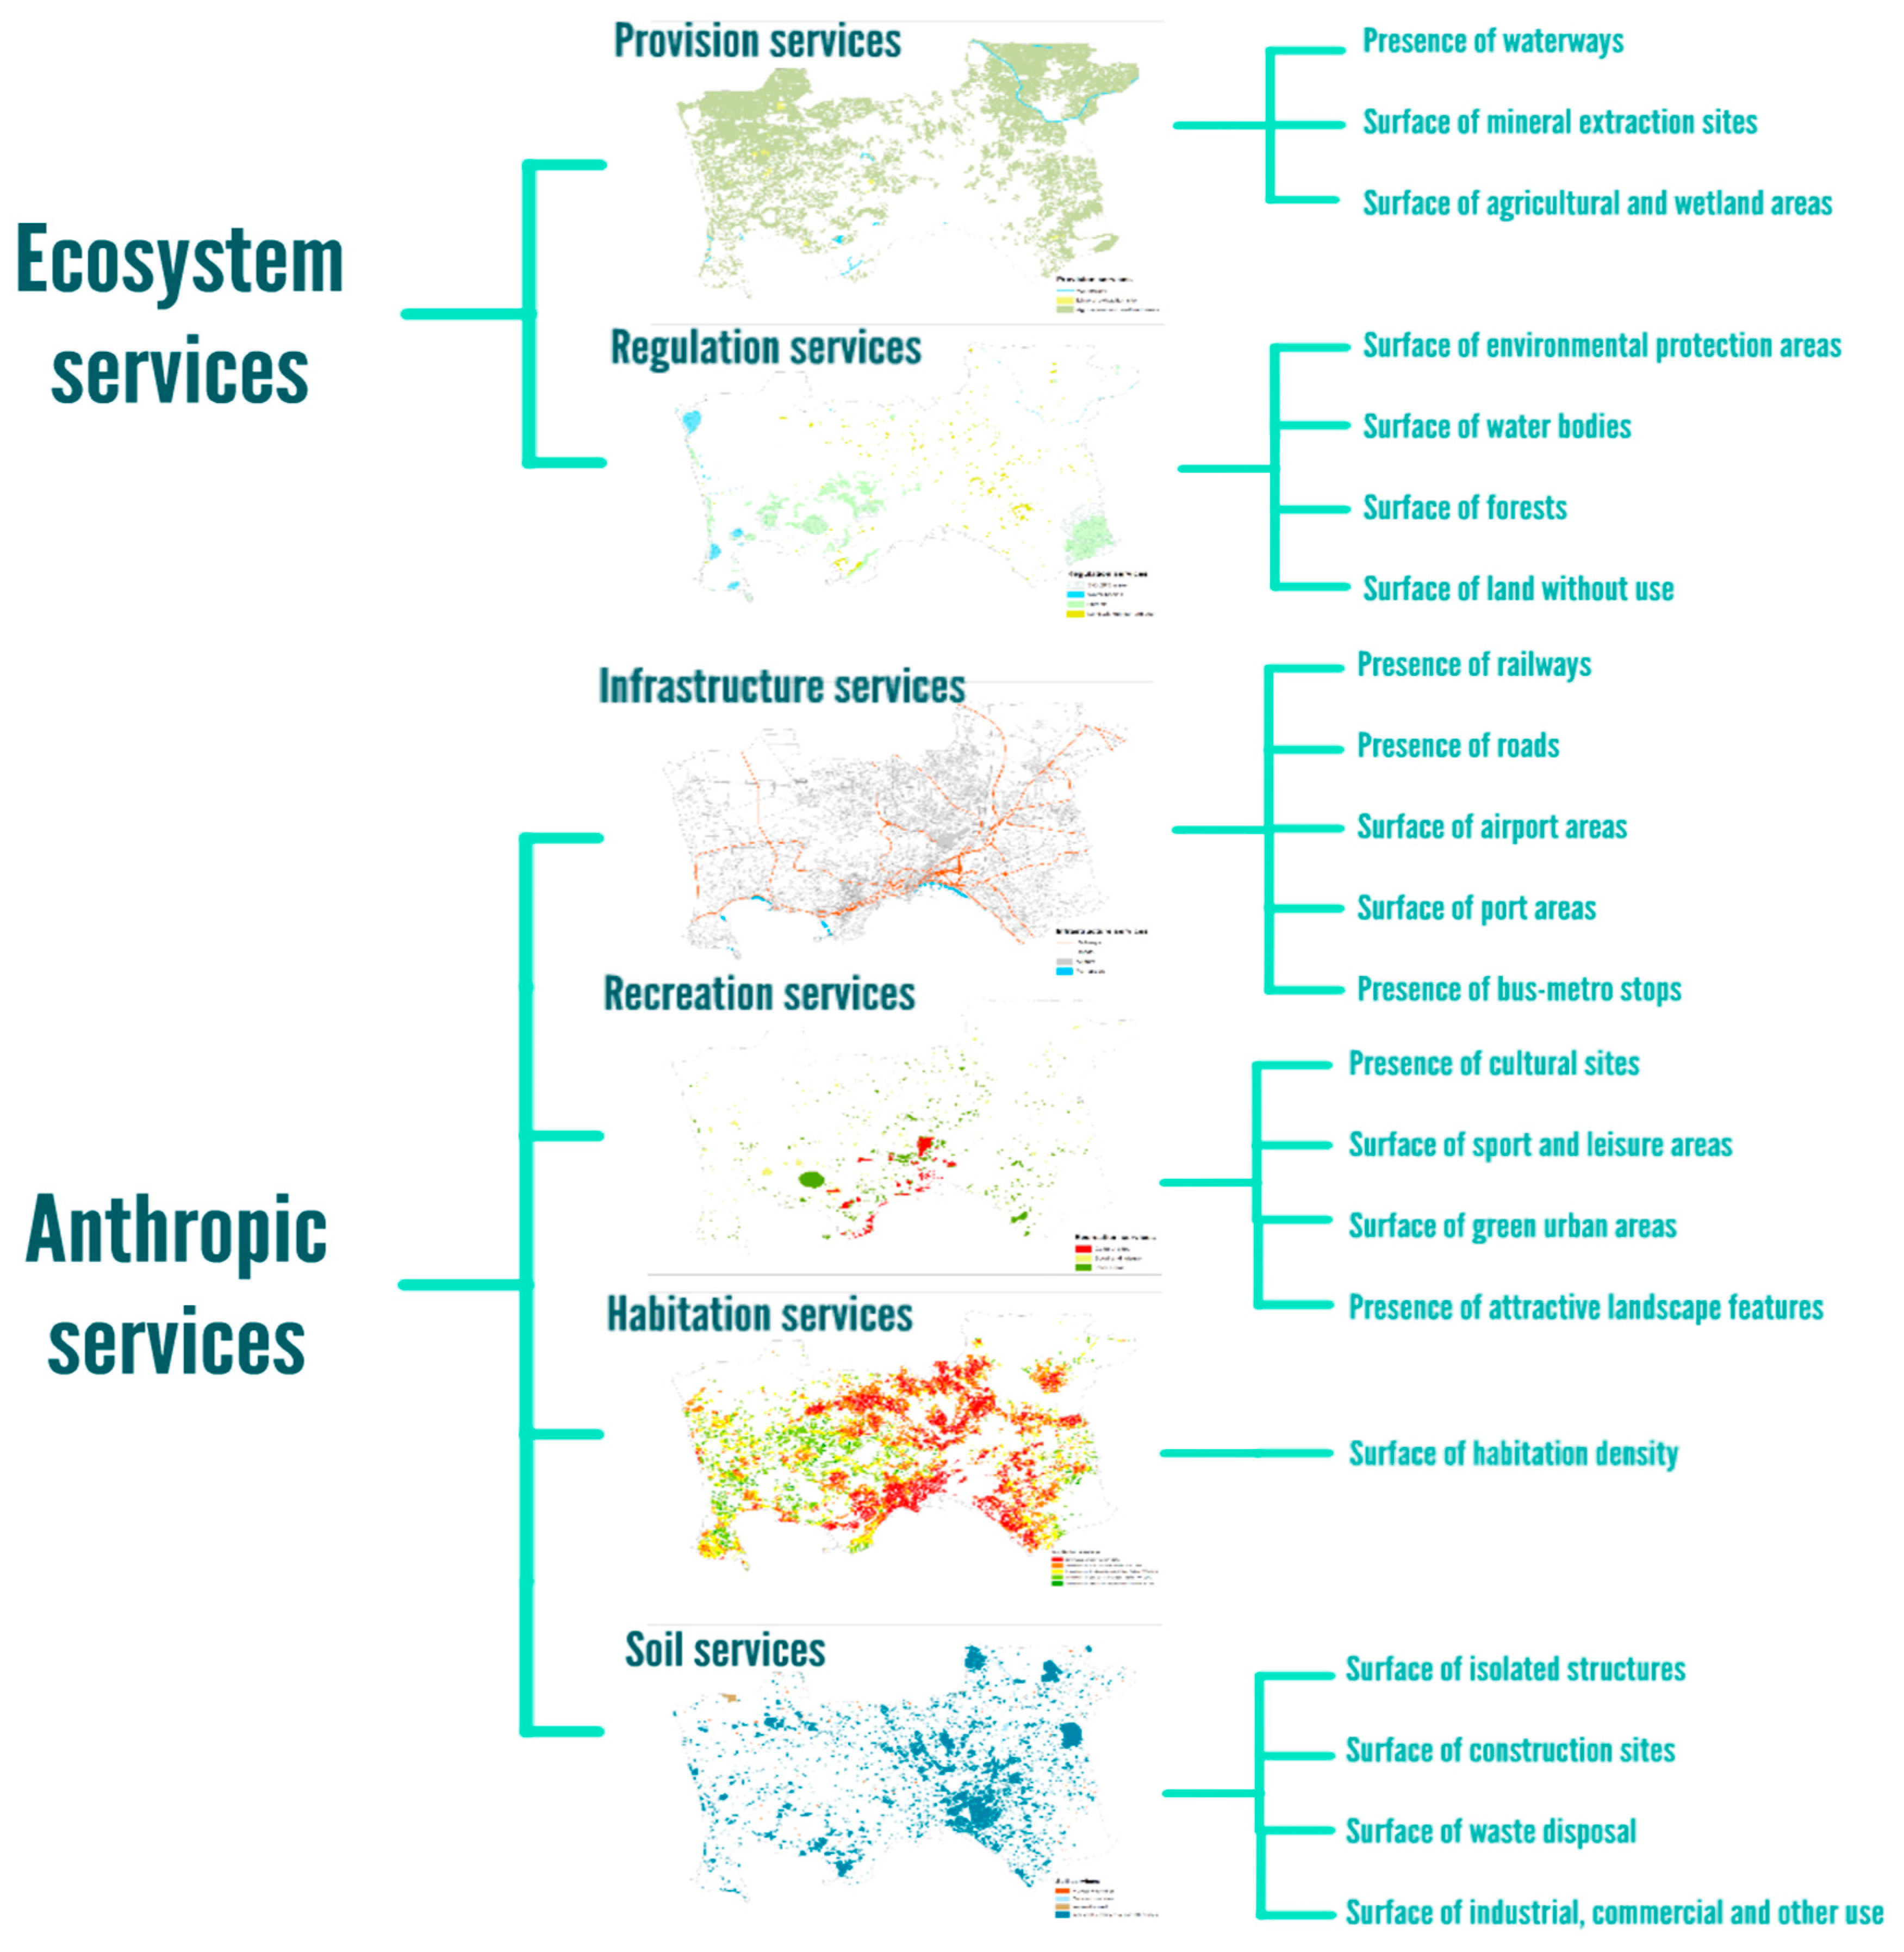
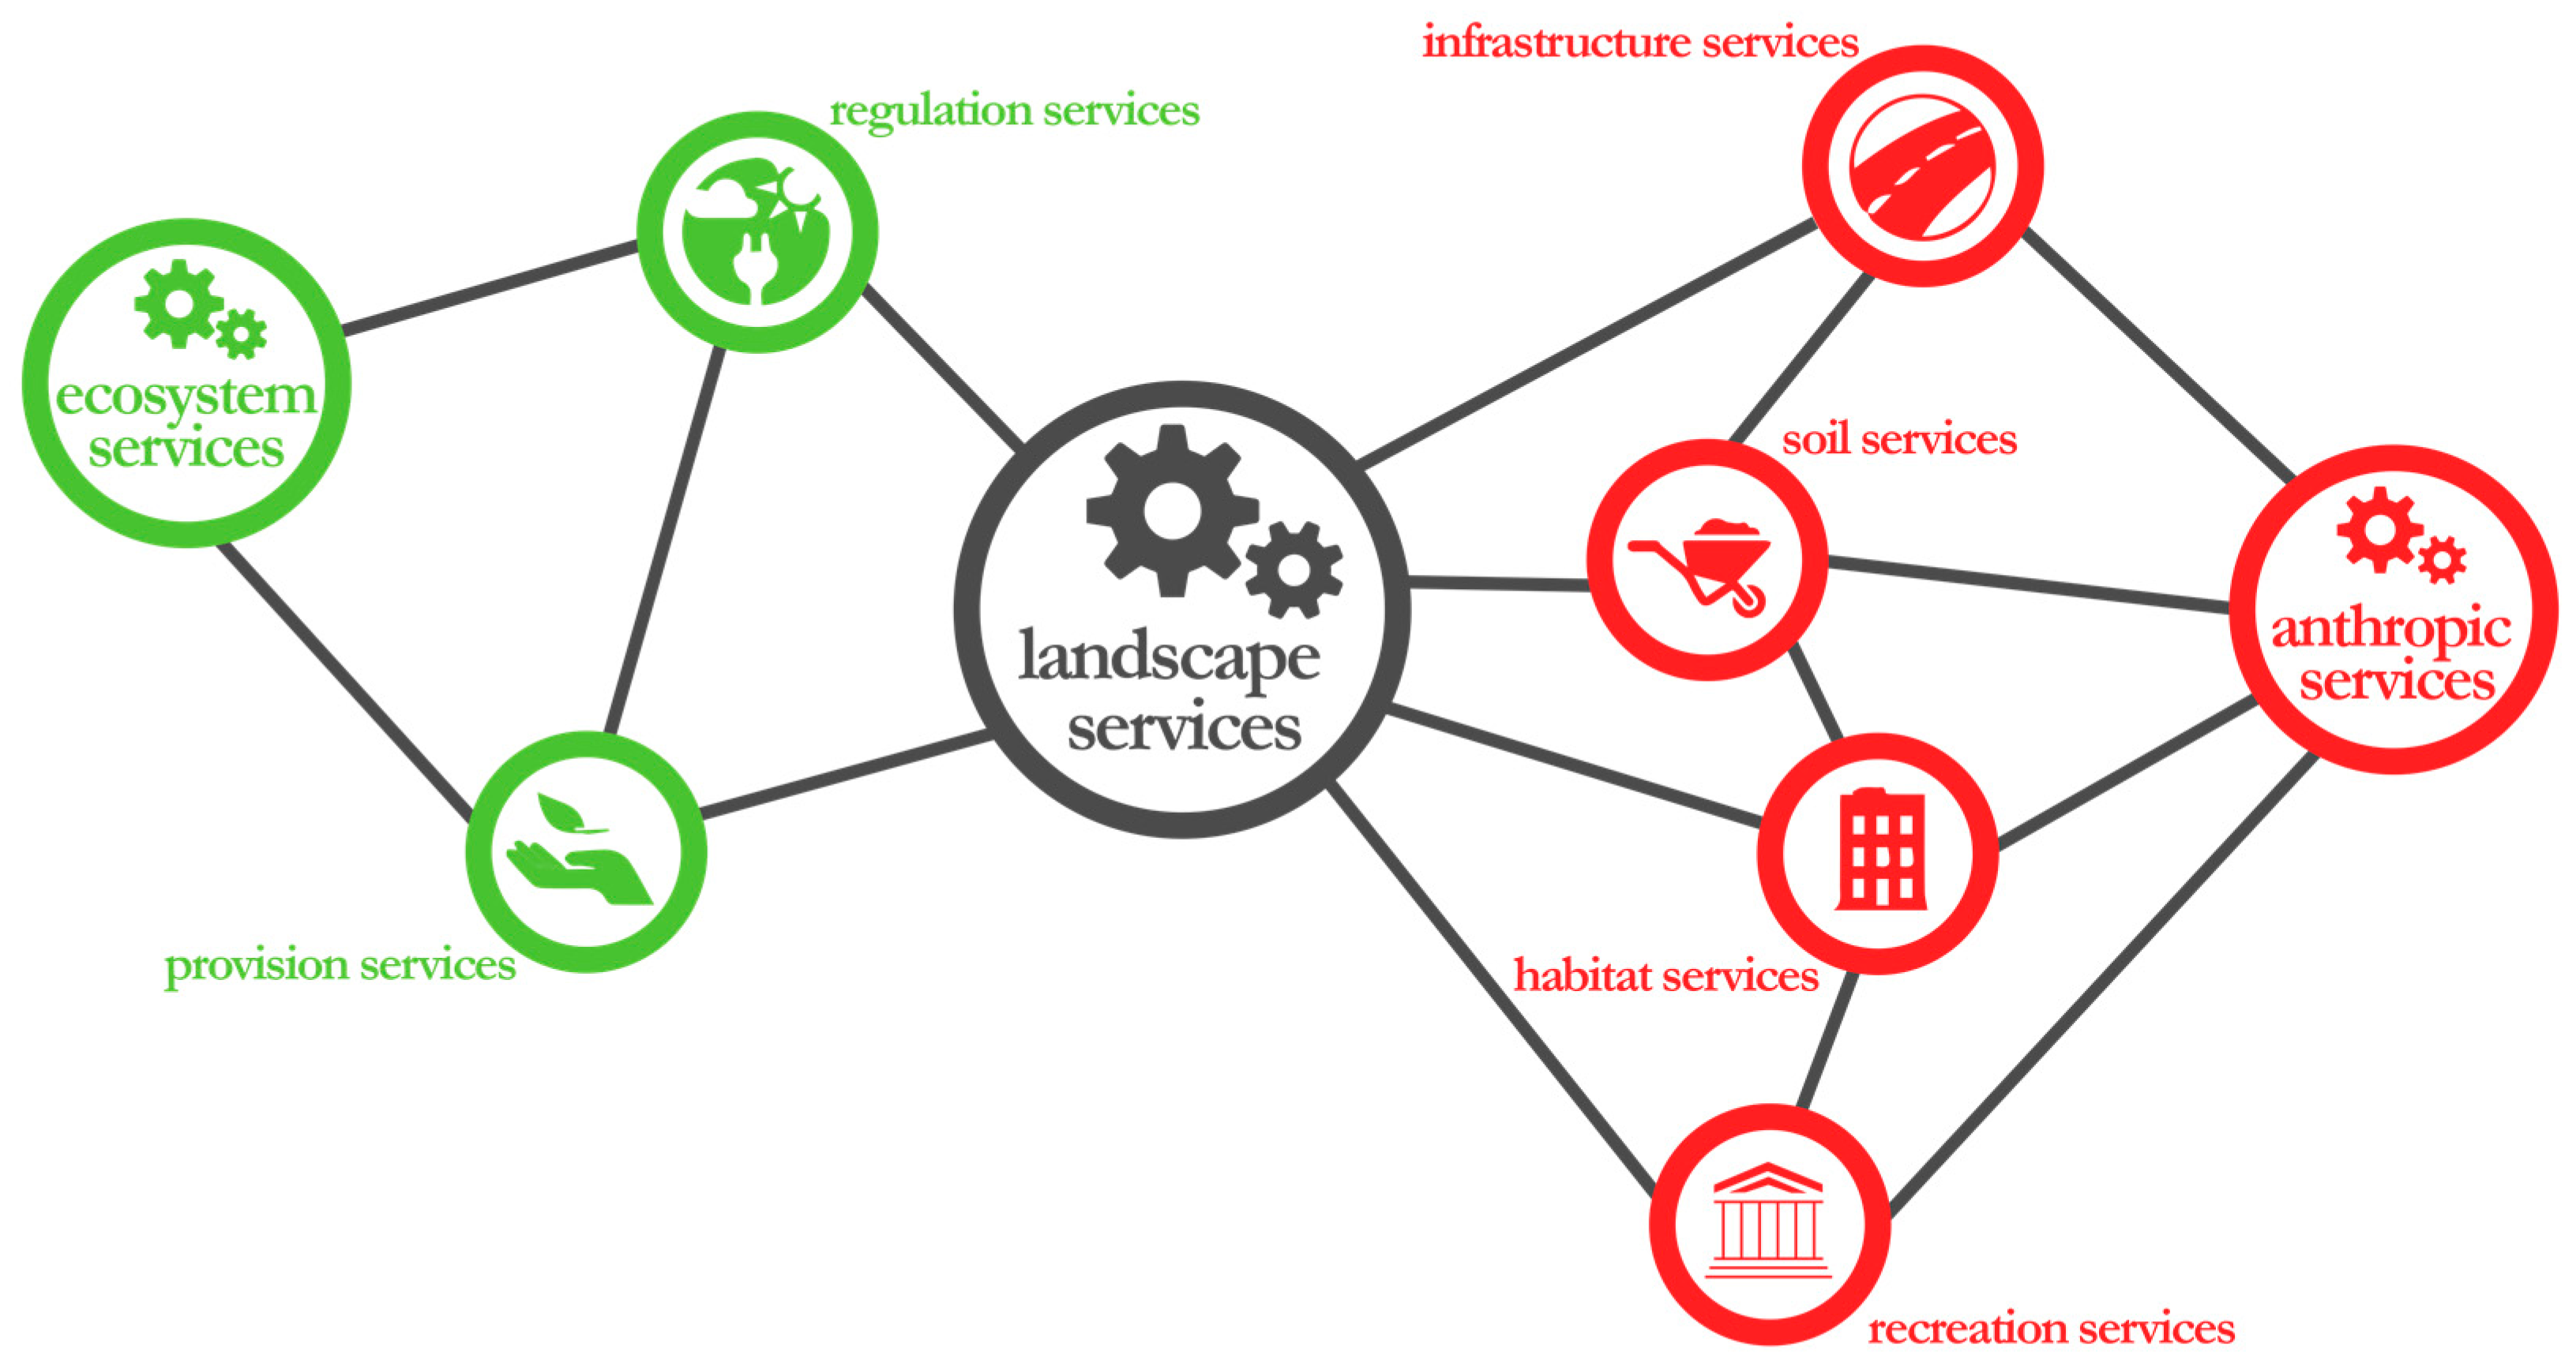
By following this approach, LS indicators are categorized according to two main criteria that represent the ecosystem services (ES) and the anthropic services (AS). The ES concerns the natural processes, while the AS includes the cultural and social aspects for which the anthropic component is decisive for the provisioning of benefits. Afterwards, six typologies of services for both previous criteria are identified (
Figure 1): provision and regulation services within the ecosystem dimension, and infrastructure, recreation, habitation, and soil services within the anthropic dimension (
Figure 1).
3. Results
In this section, an application will test the methodology by verifying the usefulness of the LS approach in urban planning and landscape management. In the following subsections the study area, indicators table, and evaluation maps of LS are shown.
3.1. Case Study
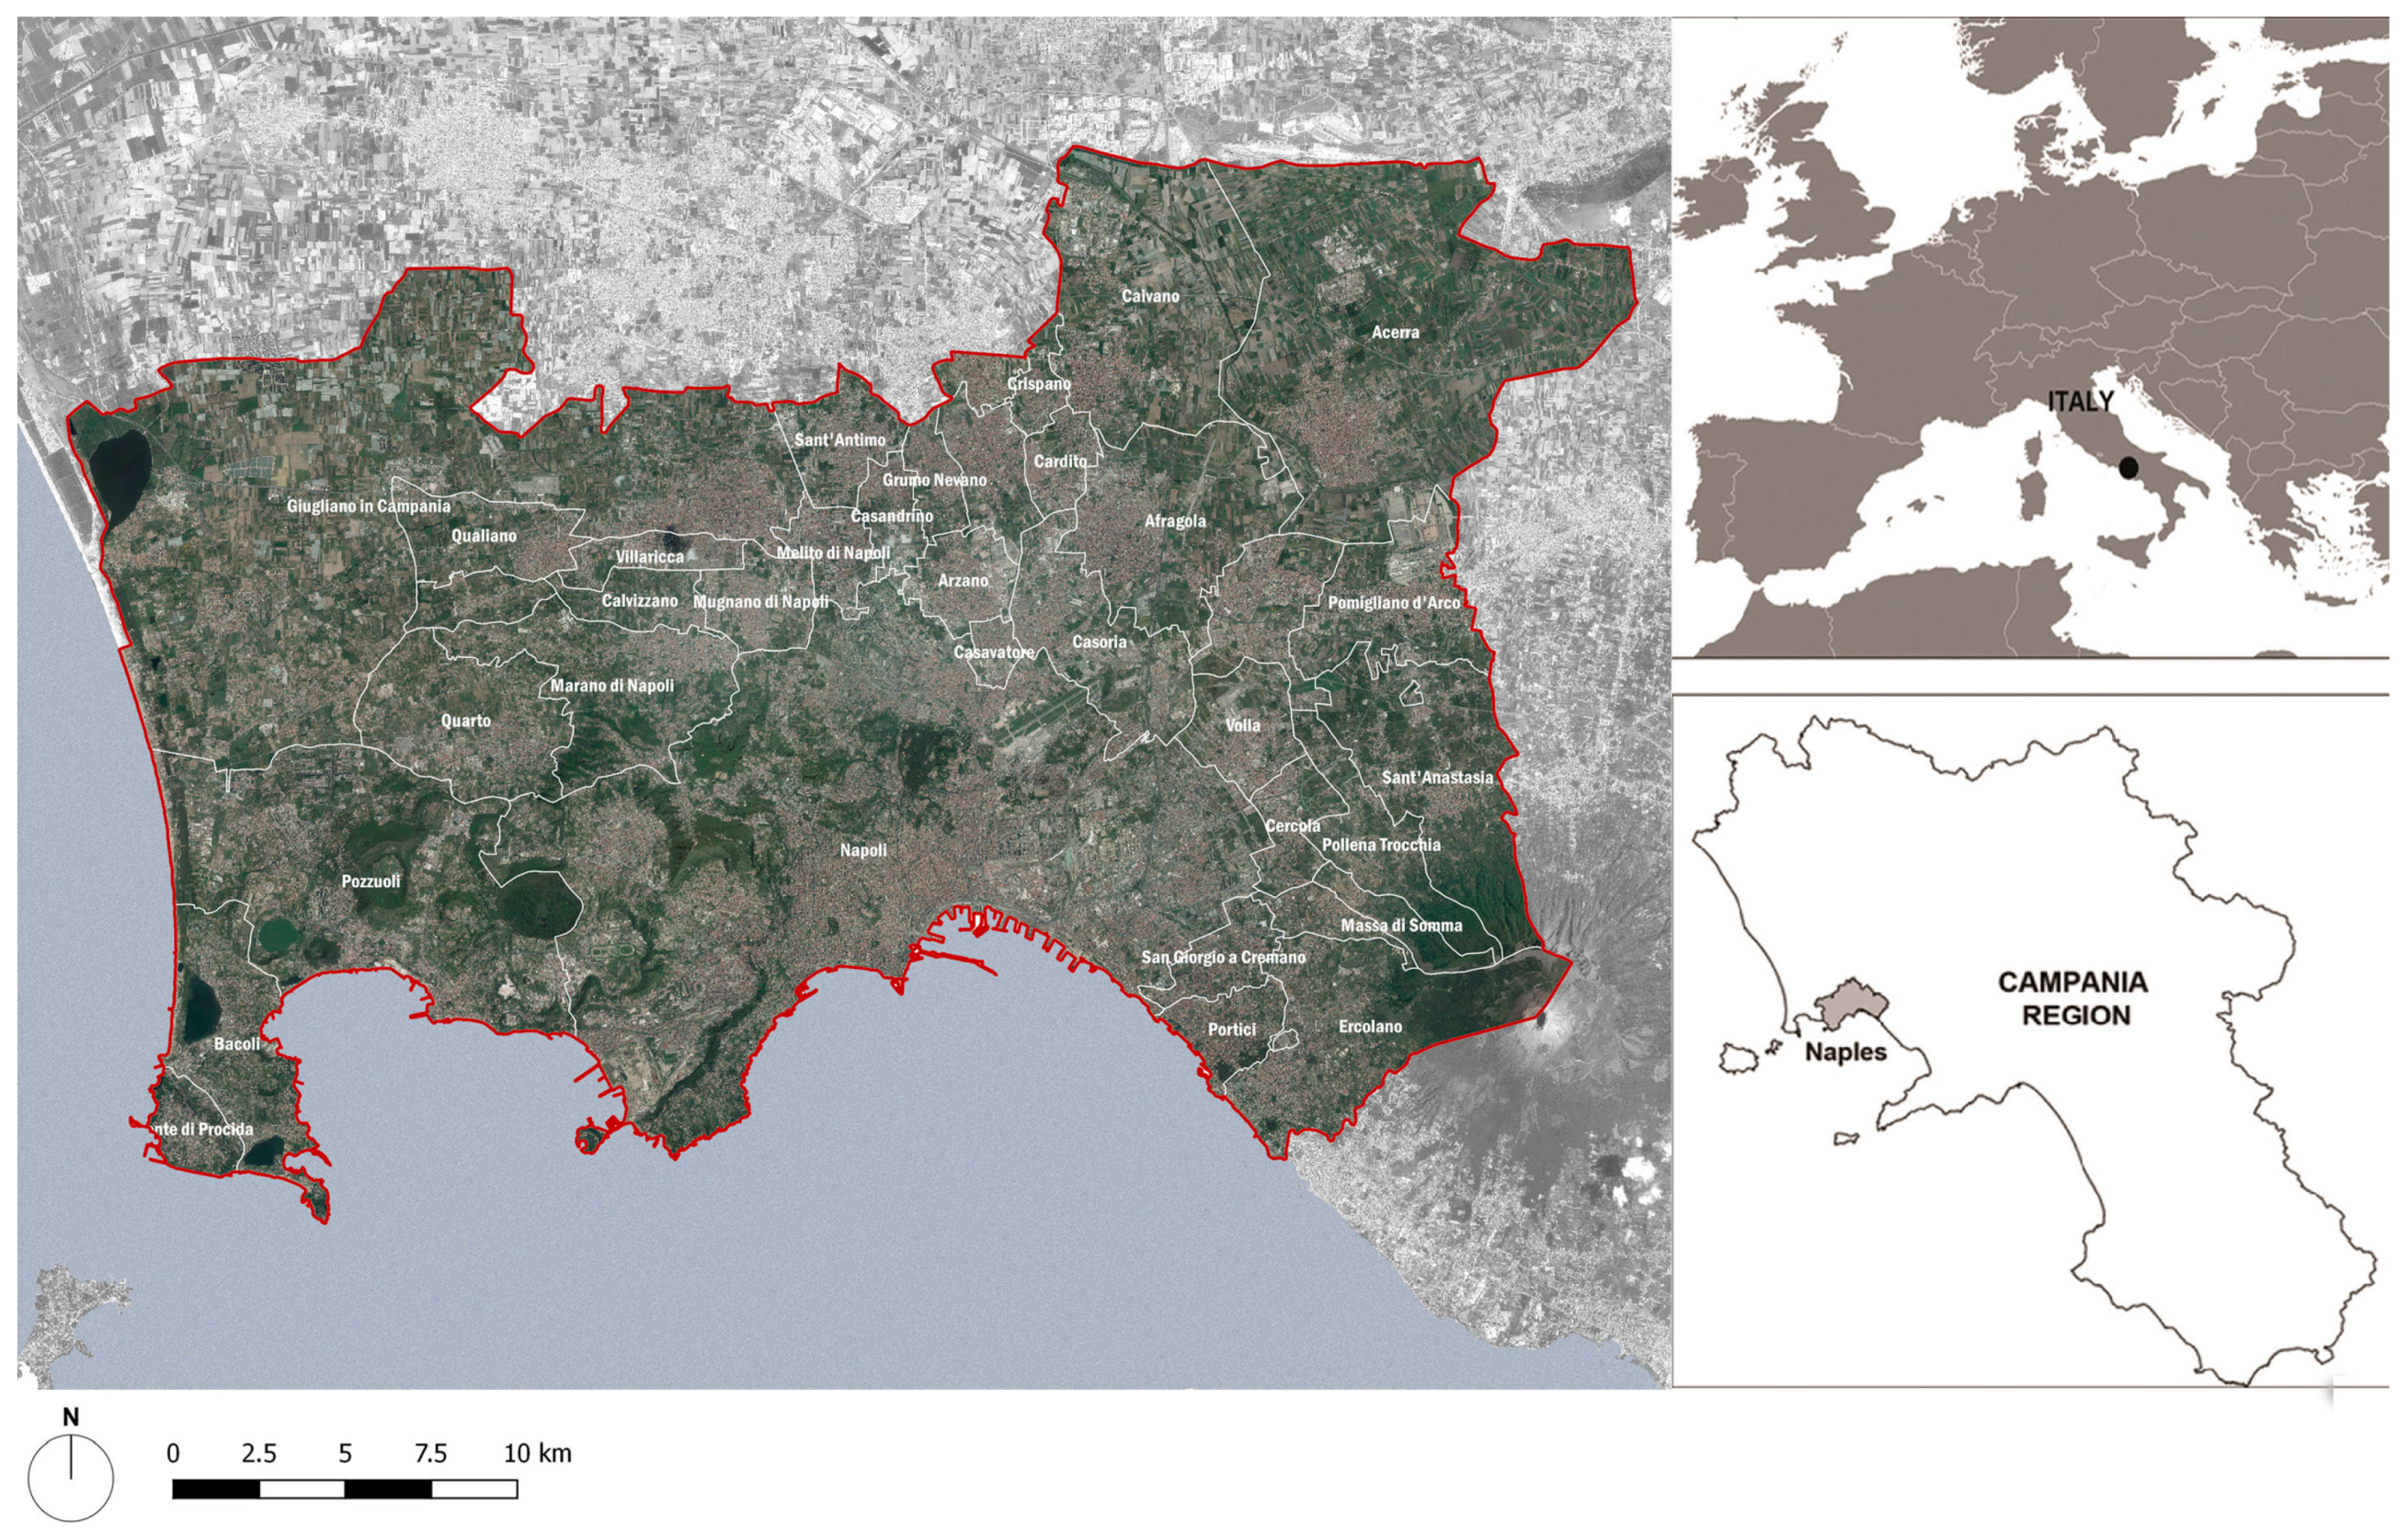
The study area extends over large urban zones of Naples (Italy) as conceived and mapped by EEA at a scale of 1:10,000. The area is approximately 560 km
2 and includes the city of Naples with its 960,000 inhabitants, 14 satellite-municipalities directly connected to the city, and 21 municipalities affecting the city in terms of economic, social, and environmental pressures (
Figure 2).
The territory is complex, varied, and marked by multiple high-density and low-density zones with prevailing agricultural and natural soil outside the urban cores. Intensive farming, abandoned industrial soils, and urban sprawl have compromised the potential environmental quality of the landscape. On the other hand, many cultural services are concentrated in the city center where the infrastructure and tourism facilities are more consistent than the ones located in the fringe areas.
3.2. The Spatial Indicators of Landscape Services (LS)
The hierarchy of the spatial indicators shows three levels of spatial analysis that involve the main criteria, typology of service, and spatial indicator. The structure of the indicators’ table identifies: criteria, type of service (T.s.), indicator, year, source, analysis distance (A. d.), unit of measure (U. m.), and value (
Table 1).
As previously seen, a classification in six categories of spatial LS indicators is derived. Provision services supply all of those environmental resources that sustain human activities (e.g., agriculture, water supply, raw materials). Regulation services are connecting to the ability of the landscape to promote natural cycles through ecological processes (e.g., safeguard areas, forests). Infrastructure services relate to the capacity of the landscape to contain a suitable space for transportation networks. Recreation services refer to cultural life and leisure activities (e.g., cultural sites, leisure areas, panoramic viewpoints). Habitation services relate to the capacity of the landscape to provide suitable places for human settlements. Soil services relate to the capacity of landscape to provide a suitable substrate for the different functioning of soils (e.g., waste disposal, industrial areas) (
Figure 3).
In conclusion, data collection within the VGI platform is crucial to describe the recreation services of the territory. Particularly, Panoramio or Flickr data are able to provide hot spots depicting the level of enjoyment of an area depending on the number of user’s snapshots. Moreover, this data-source is able to build the presence of attractive landscape features indicator. At the same time, OSM shows a density of numerous cultural sites, shaping the presence of cultural site indicators. In this category, places of cultural attraction are collected, e.g., museums, churches, cinemas, libraries, and theatres, in order to quantify the allocations of services inside and outside the city.
4. Multi-Criteria Evaluation and Landscape Services Maps
The multi-criteria procedure of Saaty’s AHP, in synergy with Mascot software, has tested on the study area to assess the services at different levels. A distance-based method was used in order to understand the influence of the services and their mutual relationships inside a pre-determined analysis distance. The method is more advanced than a weighted overlay, by providing a final scoring based on Euclidean Distance between the spatial features. The AHP method allows to merge, within a homogeneous scale value, the quantitative and qualitative aspects by determining the priorities among elements of the hierarchy [
29,
36]. Therefore, a pairwise comparison among the indicators is performed by considering their level of influence to fulfill anthropic and ecosystem functions. The weights and the priorities are determined for each indicators by considering this study as a test-model that stakeholders can improve and expand with their effective preferences. In this case, we set equal importance for each indicator in the pairwise comparison, according to the semantic scale of Saaty. The implementation of this research will focus on the recognition of real stakeholder preferences.
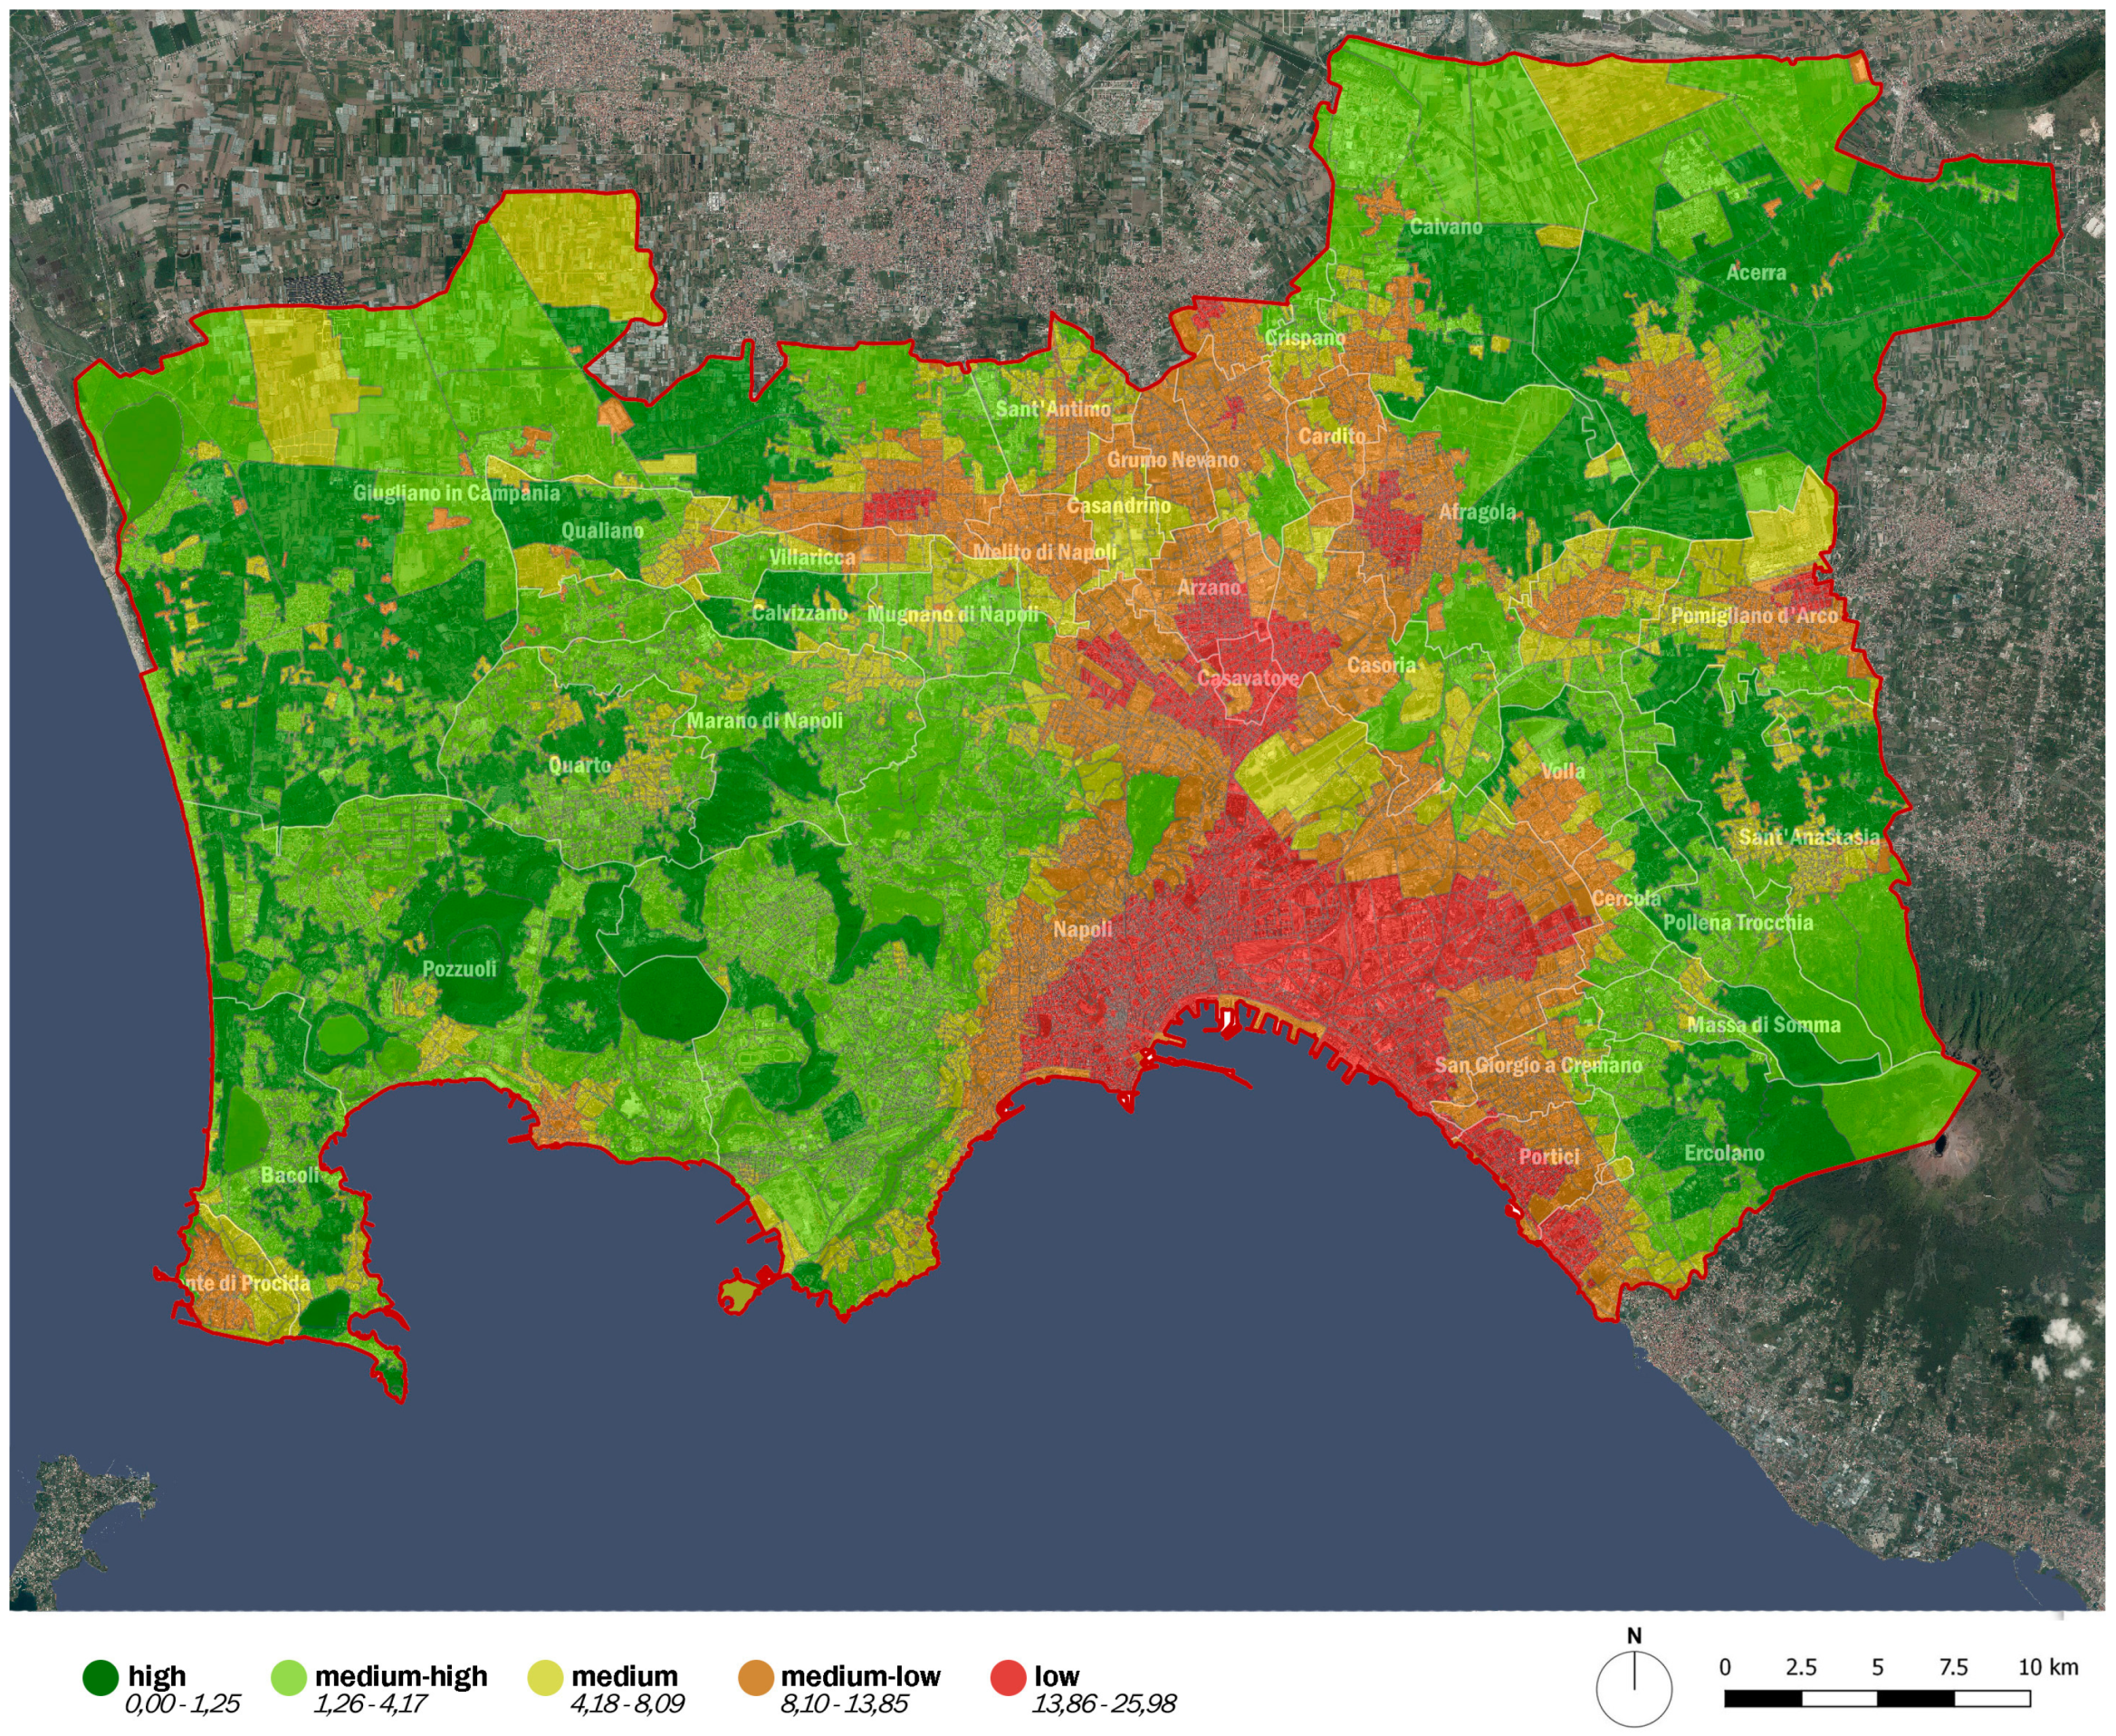
The result of the KME process provides two multi-criteria maps considering the overall weights of ecosystem and anthropic services. Five classes of density values are depicted with the data-clustering method of natural breaks and each class was given the following semantic judgment: low, medium-low, medium, medium-high, and high. The chromatic graduation from red to green highlights zones with variable density of services, by considering the red zones as low-density and green ones as high-density. These maps aim to aid the DM choices within a vision of integrated sustainability.
The ES map (
Figure 4) highlights the main hot spots of services in those areas distinguished by a low or medium human use and dominated by a mosaic of forests, green areas and water surfaces. Specifically, the east and west fringe areas of the urban belt have higher values than the city center, because of the diversified landscape patterns resulting in wetlands, agricultural fields and environmentally protected areas. Moreover, low values of provision and regulation services also occurred in the northern areas that represent a barrier between the eastern and the western municipalities. However, the enhancement of green urban areas on this barrier can play a crucial role in linking the municipalities through the creation of new green infrastructures, by hindering the ecological fragmentation and the land consumption that are two of the major troubles in the contemporary cities.
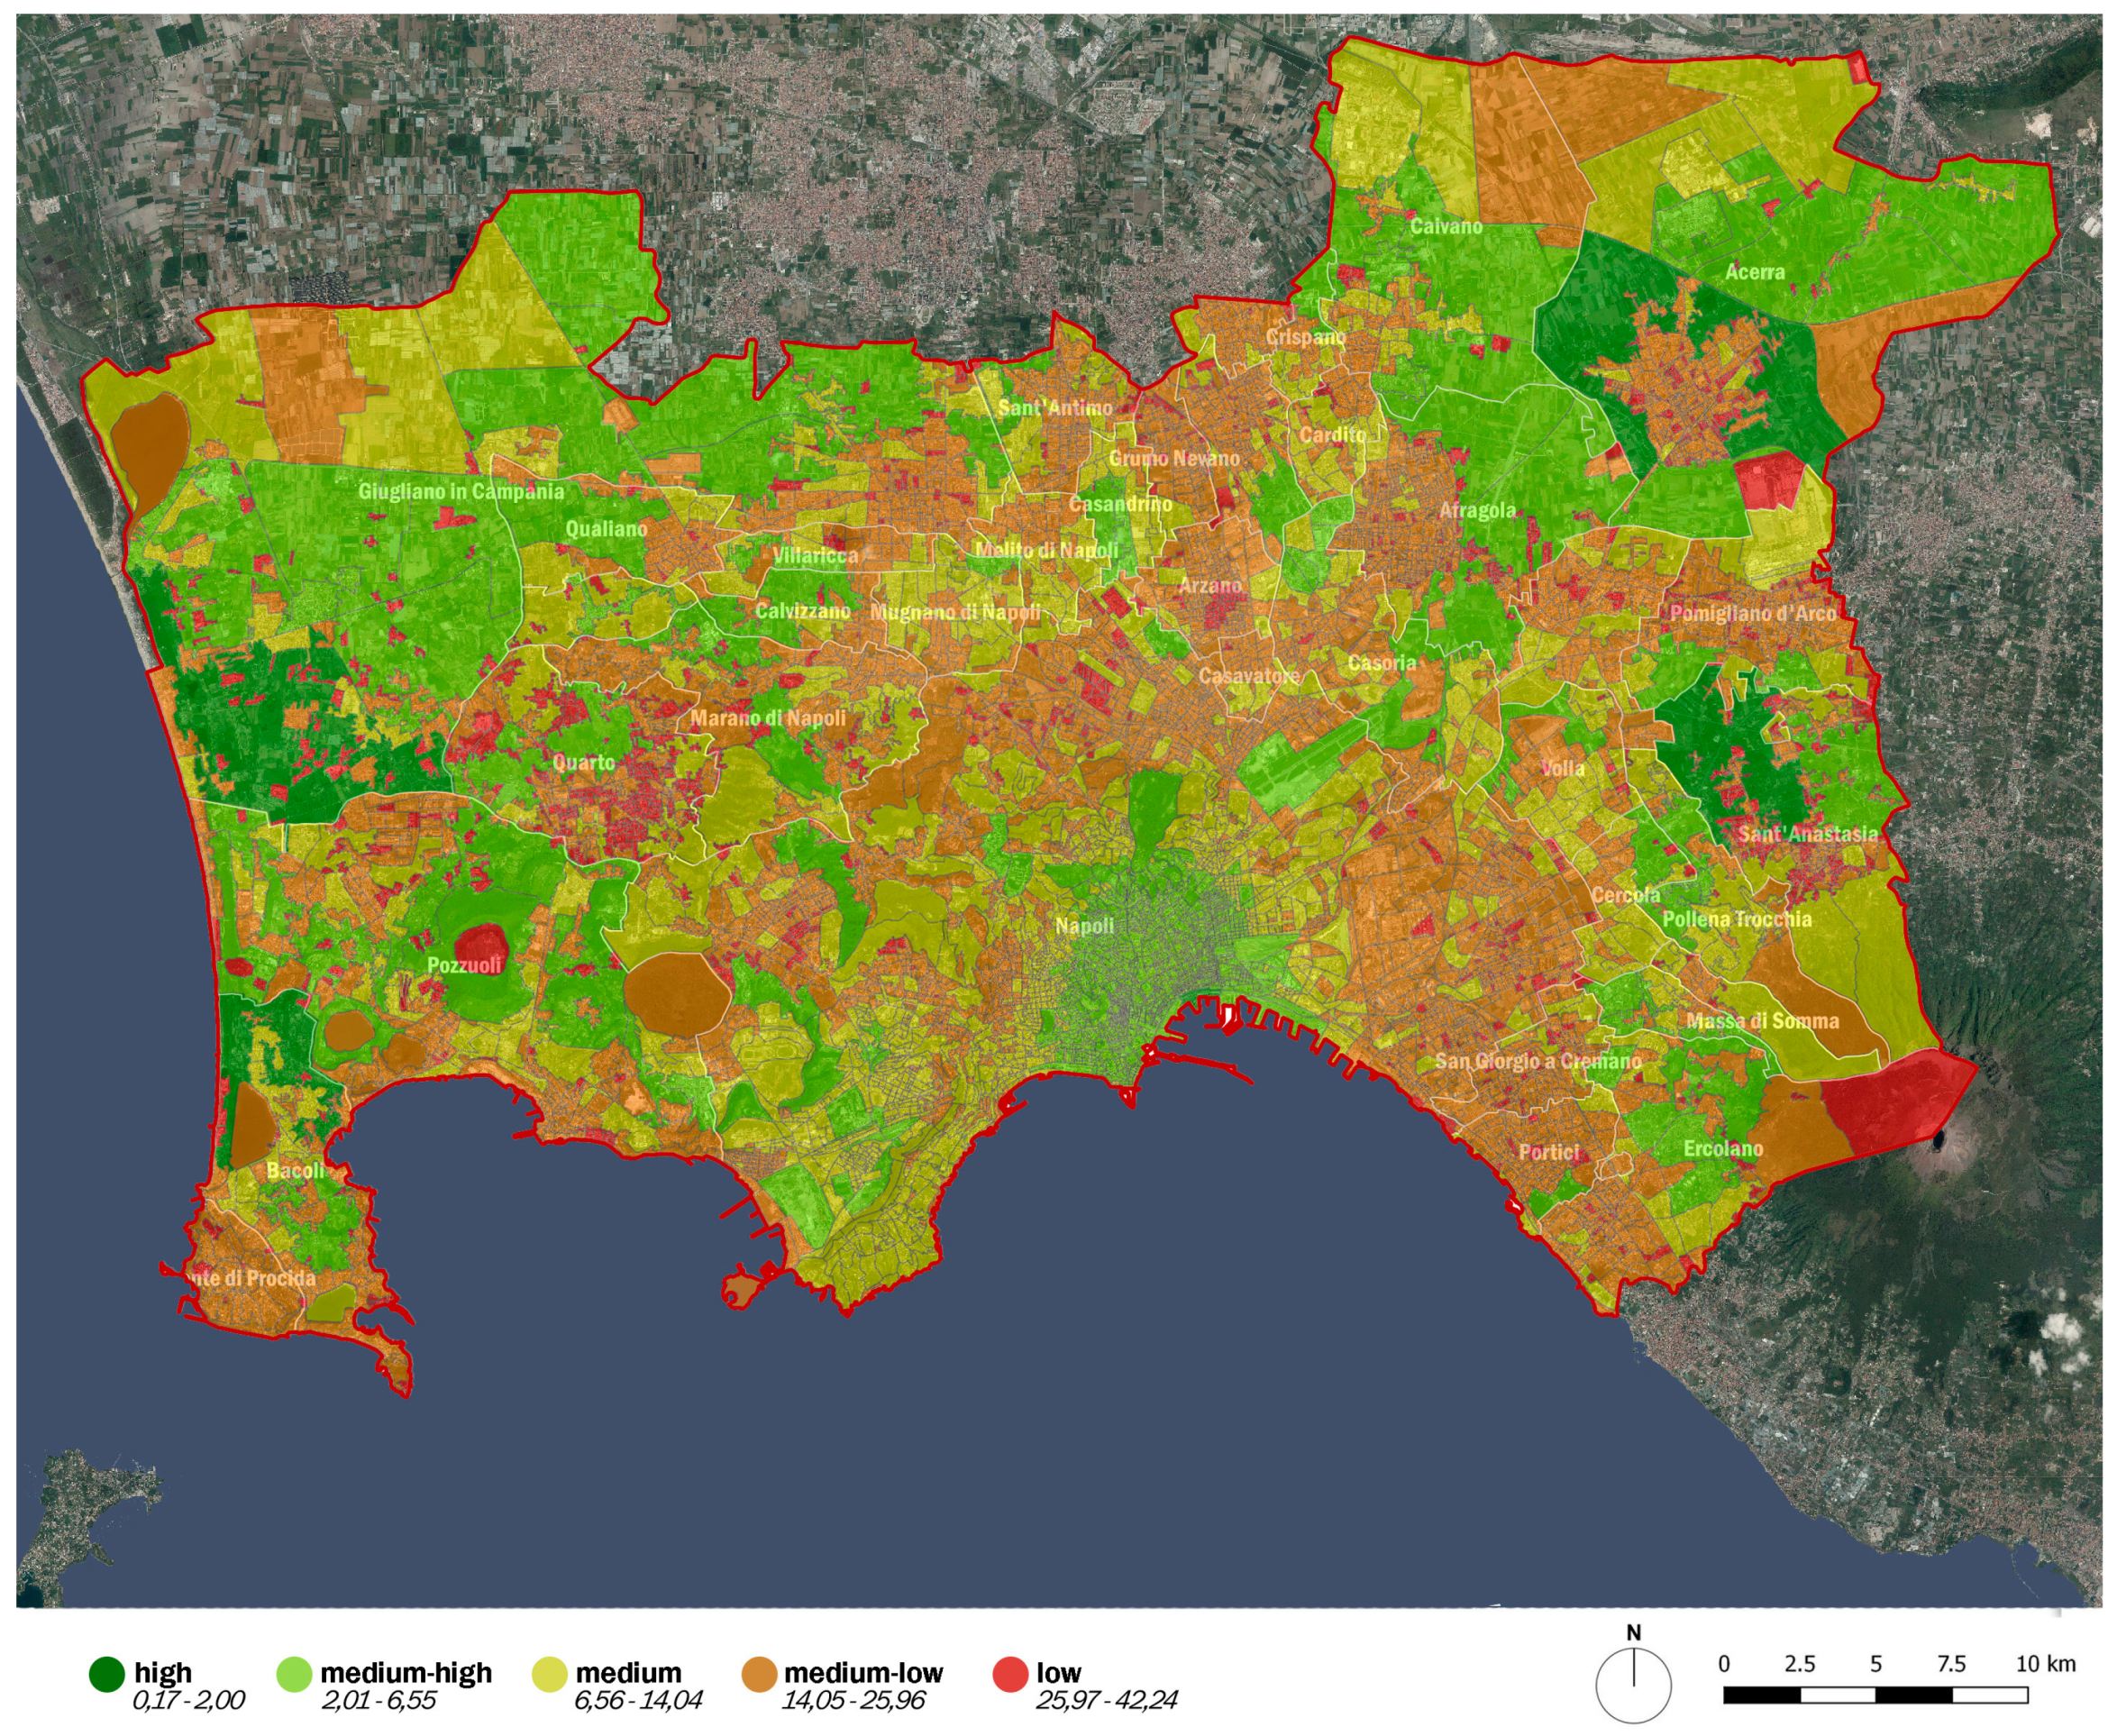
The AS map (
Figure 5) shows high density of habitation, infrastructure and recreation services in the city center, although the ecosystem services have very-low values. Finally, the distribution of AS inside the study area is more diverse than ES; thus, the main effort of policy and planning should focus on the enhancement of ES in the low-value areas.
5. Discussion and Conclusions
In summary, the SDSS for the city of Naples and its surrounding municipalities aims at evaluating the landscape services and functions in order to visualize the critical zones with low values for which policy for improving the environmental quality is required. Thus, GIS allowed us to provide the distribution and the quantification of the spatial phenomena of the territory. The complex values of the multifunctional landscape were organized in a hierarchy of functions and services in order to simplify the evaluation. Moreover, the dynamic change of landscape features needs flexible and up-to-data tools, easily accessed by both specialists and commons.
A step forward of this research should focus not only on the real expert preferences according to pre-selected criteria, but also on a common individuation of LS by local community and stakeholders. VGIs can play an important role within the shared knowledge process while the evaluation makes a decisional process more democratic by combining user-generated data and different people preferences.
The maps of spatial criteria are useful for prioritization and problem identification when context-aware information are available. Moreover, the communication among stakeholders improves by displaying the spatial data maps, and the contribution of MCA increases the quality of the planning and management of the landscape.


