UAT ADS-B Data Anomalies and the Effect of Flight Parameters on Dropout Occurrences

Department of Mechanical Engineering, University of North Dakota, Grand Forks, ND 58202, USA
*
Author to whom correspondence should be addressed.
Data 2018, 3(2), 19; https://doi.org/10.3390/data3020019
Submission received: 11 April 2018
/
Revised: 23 May 2018
/
Accepted: 5 June 2018
/
Published: 8 June 2018
Abstract
:An analysis of the performance of automatic dependent surveillance-broadcast (ADS-B) data received from the Grand Forks, North Dakota International Airport was carried out in this study. The purpose was to understand the vulnerabilities of the universal access transceiver (UAT) ADS-B system and recognize the effects on present and future air traffic control (ATC) operation. The Federal Aviation Administration (FAA) mandated all the general aviation aircraft to be equipped with ADS-B. The aircraft flying within United States and below the transition altitude (18,000 feet) are more likely to install a UAT ADS-B. At present, unmanned aircraft systems (UAS) and autonomous air traffic control (ATC) towers are being integrated into the aviation industry and UAT ADS-B is a basic sensor for both class 1 and class 2 detect-and-avoid (DAA) systems. As a fundamental component of future surveillance systems, the anomalies and vulnerabilities of the ADS-B system need to be identified to enable a fully-utilized airspace with enhanced situational awareness. The data received was archived in GDL-90 format, which was parsed into readable data. The anomaly detection of ADS-B messages was based on the FAA ADS-B performance assessment report. The data investigation revealed ADS-B message suffered from different anomalies including dropout, missing payload, data jump, low confidence data, and altitude discrepancy. Among those studied, the most severe was dropout and 32.49% of messages suffered from this anomaly. Dropout is an incident where ADS-B failed to update within a specified rate. Considering the potential danger being imposed, an in-depth analysis was carried out to characterize message dropout. Three flight parameters were selected to investigate their effect on dropout. Statistical analysis was carried out and the Friedman Statistical Test identified that altitude affected dropout more than any other flight parameter.
1. Introduction
In order to meet the increasing air travel demand, airspace capacity must be increased which, in turn, depends to a large extent on the future air traffic control (ATC) technologies and the capability of ATC and associated functions to manage the airspace. One way of increasing airspace capacity is to reduce the required separation minima between aircraft, which demands very high performance (accuracy, integrity, continuity, and availability) on the navigation and associated functions of communications and surveillance systems. Reducing the separation between aircraft to increase airspace capacity, without considering the constraints will cause an increase in the risk of a collision. To overcome the limitations and to meet the future air travel demand, the International Civil Aviation Organization (ICAO) developed a committee on future air navigation systems (FANS) in partnership with Boeing, Airbus, Honeywell, and others to work for future air traffic [1]. As a result, a new surveillance technology referred to as automatic dependent surveillance-broadcast (ADS-B) was proposed by the ICAO and is envisioned to fill the gaps in the current surveillance systems. The FAA-led modernization of America’s air transportation system, NextGen i.e., the Next Generation Air Transportation System, also consider ADS-B as a backbone of future surveillance [2].
According to the definition from the Radio Technical Commission for Aeronautics (RTCA) ADS-B is a function on an aircraft or a surface vehicle operating within the surface movement area that periodically broadcasts its position and other information without the knowledge of the identity of the recipients and without expecting acknowledgments [3]. It is a cooperative surveillance system as it requires common equipage for the aircraft sharing the information. Unlike radar, ADS-B makes use of satellite data to navigate and acquire position data which ensures real-time precision and advanced situational awareness. In the United States ADS-B works in two distinct frequencies; one is 1090ES, and another is 978 MHz. The 1090ES is an international standard and aircraft must be equipped with a 1090ES transponder in order to fly above the transition altitude, which is 18,000 feet in the US. On the other hand, the 978 MHz datalink is used by general aviation only in the United States Airspace, except Class A. According to the Minimal Operational Performance Standard for UAS [4], UAS need to be equipped with UAT ADS-B to fly within the National Airspace System (NAS). The FAA mandates all aircraft to be equipped with ADS-B by the year 2020 to fly within the designated controlled airspace, as described in Federal Regulation 14 CFR 91.225. To inspire and facilitate the installation, the FAA also declared an ADS-B rebate program [5] in September 2016 for one year, which helped defrayed the costs associated with the equipment and installation for eligible general aviation aircraft. Since an avionics shop’s ramp test equipment might not be able to validate all ADS-B operational parameters, the performance of the installed ADS-B provided the FAA a guideline to evaluate the avionics standards [6].
Although a large number of studies were found on the 1090ES ADS-B system, the UAT ADS-B lacks studies addressing the important questions regarding limitations, as well as failure modes including their characterization, modeling, and assessment of impacts. This is most likely because the UAT is newer comparative to 1090ES and only used in the US. Given the motivation, this study analyzes four weeks of UAT ADS-B data received from the Grand Forks International Airport, North Dakota. The dataset is unique and significant as it incorporates the UAT-ADS-B data from the UND Aerospace fleet which is the one of the largest fleets of civilian flight training aircraft in North America [7].
The objective of this study is to analyze the performance of the UAT ADS-B, discuss the vulnerabilities, and address the potential factors behind the degraded performance. Section 2 provides a background of ADS-B with related works and Section 3 introduces the data format. Section 4 describes the parsing of the archived data and filtration. Section 5 is the experimental section where data analysis was carried out and introduces the data anomalies which was revealed in the step by step data assessment. One of the major performance issue dropout, which is discussed in Section 6. The dropout was categorized based on the duration of dropout and statistical testing was further carried out to relate flight parameters with the occurrences of dropout. Section 7 discusses the results and future work.
2. Background of ADS-B and Related Work
Today’s surveillance systems can be classified into two broad categories. One is ground-based, and the other is airborne. The ground-based surveillance system mostly consists of different radar and beacon systems. ADS-B is an airborne surveillance system that makes use of satellite navigation, such as GPS, for generating surveillance information.
2.1. ADS-B as a Surveillance System
ADS-B is a system that uses radio transmissions from aircraft to provide geographical position, pressure altitude data, positional integrity measures, flight identity, 24-bit aircraft address, velocity, and other data which have been determined by airborne sensors. Typically, the airborne position sensor is a GPS receiver. This sensor must provide data that indicates the position errors with a containment bound. The altitude sensor is typically the same barometric source/air data computer source used for secondary radar. There are two different ADS-B systems: ADS-B Out and ADS-B In. ADS-B Out in the aircraft collects its state information, including 3D position, velocity, and altitude, and then broadcasts this information to the ground stations and other aircraft via a data link. There are two different data links available: the 1090ES utilizes the mode-S transponder, and the other is the 978 MHz universal access transceiver (UAT) channel. Any aircraft equipped with ADS-B In will receive the ADS-B message sent out by other aircraft, as well as by the ground stations.
A ground station includes a receiver which relays the message to ATC and sends out additional reports, such as flight and traffic information to the sender aircraft. Additionally, it provides a service called automatic dependent surveillance-rebroadcast (ADS-R) and traffic information service-broadcast (TIS-B). The ADS-R system monitors if there are proximate aircraft with differing ADS-B links and then rebroadcasts surveillance information received on one link frequency to aircraft on the other link frequency. ADS-B In refers to the appropriate avionics equipage that can receive, process, and display information [8] transmitted via ADS-B Out, as well as from ground stations. ADS-B In provides the pilot with extended situational awareness and self-separation. ADS-B In avionics are capable of receiving and decoding ADS-B, ADS-R, and TIS-B messages. The surveillance data processing system processes ownship and nearby traffic data. A Cockpit display of traffic information (CDTI) provides pilots with surveillance information of traffic along with some application-specific information, such as traffic indications, alerts, and spacing guidance.
2.2. Related Work
As one of the fundamental components of modern navigation systems, much research has been done and is still ongoing with respect to different aspects of ADS-B. This includes, but is not limited to, security and verification of messages [9,10,11,12,13,14,15,16] experimental attack analysis [17,18,19,20], data quality analysis [21,22,23,24,25], safety assessment [26,27], flight testing [21,28,29], etc. ADS-B security protocols have been a topic of many studies during the system evolution. Having an open and known data format, which is broadcast on known frequencies makes the protocol highly susceptible to radio frequency (RF) attacks. Attacks can be either passive or active and can be initiated from within or outside of the ATC system (e.g., an unauthorized ADS-B transceiver). Passive attacks include eavesdropping, where the attacker tries to listen in on periodic ADS-B messages to obtain unique identifiers or position trajectory of communicating aircraft without necessarily disrupting the system [10]. Experimental attacks were generated and infused to ADS-B messages in order to visualize the severity and find a solution to the potential attacks. Matthias et al. [17] assessed the practicability of different threats and quantify the main factors that impact the success of such attacks. The results revealed that attacks on ADS-B can be inexpensive and highly successful. Various techniques were discussed to adopt while verifying original ADS-B messages. These include traditional Kalman filtering, group validation [10], cryptography [9,13,15,16], and identity-based signature with batch verification [30]. Each of the solutions is yet to be implemented in the real-time ADS-B network.
A small amount of study was found on 1090ES ADS-B data assessment describing the data integrity, accuracy, error detection, and potential risk. Busyairah et al. assessed the ADS-B data collected from the London terminal area ground receiver [25,26,27,31]. This work [26] describes an assessment framework for evaluating 1090ES ADS-B data performance. This involves comparing onboard GPS data collected from British Airways with received ADS-B data from a ground station [25]. As this framework needs both the recorded flight data and ADS-B data for the assessment, it is not possible to use this if only ADS-B data is available. Findings of this study revealed that ADS-B often failed to assign a correct navigation integrity category (NIC) and navigation accuracy category for position (NACp) values. Additionally, it disclosed that ADS-B position data suffers from data jump [31], an event where data deviates from its adjacent sample. Studies [25,31] showed ADS-B also failed to update at the specified interval and Busyairah et al. also developed a generalized linear model [25] to relate the factors affecting the ADS-B update rate. Prior to developing the model, several statistical tests have been carried out to investigate the correlation between the update rate and influencing factors. Martin et al. showed that 1090ES ADS-B is prone to message loss and susceptible to severe message collisions in dense air spaces [32].
Nur et al. [24] analyzed 29 aircraft ADS-B data and address deviation between barometric and geometric altitudes. The deviation was in the range of 25 feet to 1450 feet. This work focused on how specific onboard avionics affect the deviation. Zhang [21] conducted a flight test to analyze the integrity and accuracy of ADS-B data in China. A probabilistic analysis was carried out in [27] to quantify the risk of different ADS-B failure modes.
Several flight tests were conducted to check the conformity of the transmitted ADS-B messages with the performance standard. The flight inspection report of I90 TRACON/HOUSTON flight test [31], conducted by the FAA, related the lower integrity and accuracy of position information with the lower coverage of Satellite availability and signal loss. Additionally, it evaluated the use of the dual data link. The CRISTAL-ITP [29] Project by EUROCONTROL, was tested to confirm the quality of the ADS-B Out information from the reference aircraft regarding update interval and accuracy.
Although much data evaluation work has been done on 1090ES ADS-B data, no study, until writing this review on UAT data evaluation, was available to the public. From the literature it was found that 1090ES has shown data anomalies, so it is crucial to discover whether UAT ADS-B is prone to similar anomalies and the extent of the severity of the anomalies. An initial study was carried out as a part of the FAA sponsored Assure A6: Surveillance Criticality [33] project with seven days of data.
This work is carried out on a large scale in comparison to others, which ensures improvement of the result, statistically. The other studies utilized small datasets (one day or a few hours), except for Zhang et al. [21], which considered one month of data. However, that study was centered on two pieces of integrity information from ADS-B data. The work carried out in this paper is novel in the sense that this is the first kind of work that analyses a large volume (one month) of UAT ADS-B data taking into account most of the major information available in the data frame.
3. Data Description and ADS-B Message Characteristics
The test data received from UND Aerospace was in GDL-90 format. This is the format of the data interface to the serial communication and control panel ports of the Garmin AT UAT Data Link Sensor, model GDL 90 [34]. The ground receiver at the Grand Forks International Airport is a GDL 90 ADS-B system which is aviation’s first certified ADS-B datalink transceiver [34]. It is designed to transmit, receive, and decode ADS-B messages received via the 978 MHz datalinks. This system works in two different interfaces, one is the “Traffic Interface”, and another is the “Pass-through Interface”.
The traffic interface, when enabled by the GDL 90 configuration, provides conflict alerts for proximate traffic that are projected to enter the protected zone surrounding the ownship position. On the other hand, the pass-through interface does not provide conflict alerts. The output reports under this interface consists of the message payloads that are received over the UAT data link, without modification. Due to constraints on the interface bandwidth, the received UAT messages are filtered by range from the ownship [29]. There are two pass-through report messages; one for the basic UAT message and one for the long UAT message. The difference between the basic and long messages is that the long message contains some additional state information. The message structure for basic and long UAT is defined in RTCA DO-282B [30].
3.1. GDL-90 Message Definition
The generic format of the GDL-90 datalink message structure is based on “Async HDLC,” as described in RTCA DO-267. The message types available in the GDL-90 datalink are summarized in Table 1. The message structure is as follows:
- A flag byte character (0x7E);
- A one-byte message ID which specifies the type of message being transmitted. The type of message found in the data frame is summarized in Table 1;
- The message data, which can be of variable lengths;
- A message frame check sequence (FCS). The FCS is a 16-bit CRC with the least significant byte first; and
- Another flag byte character (0x7E).
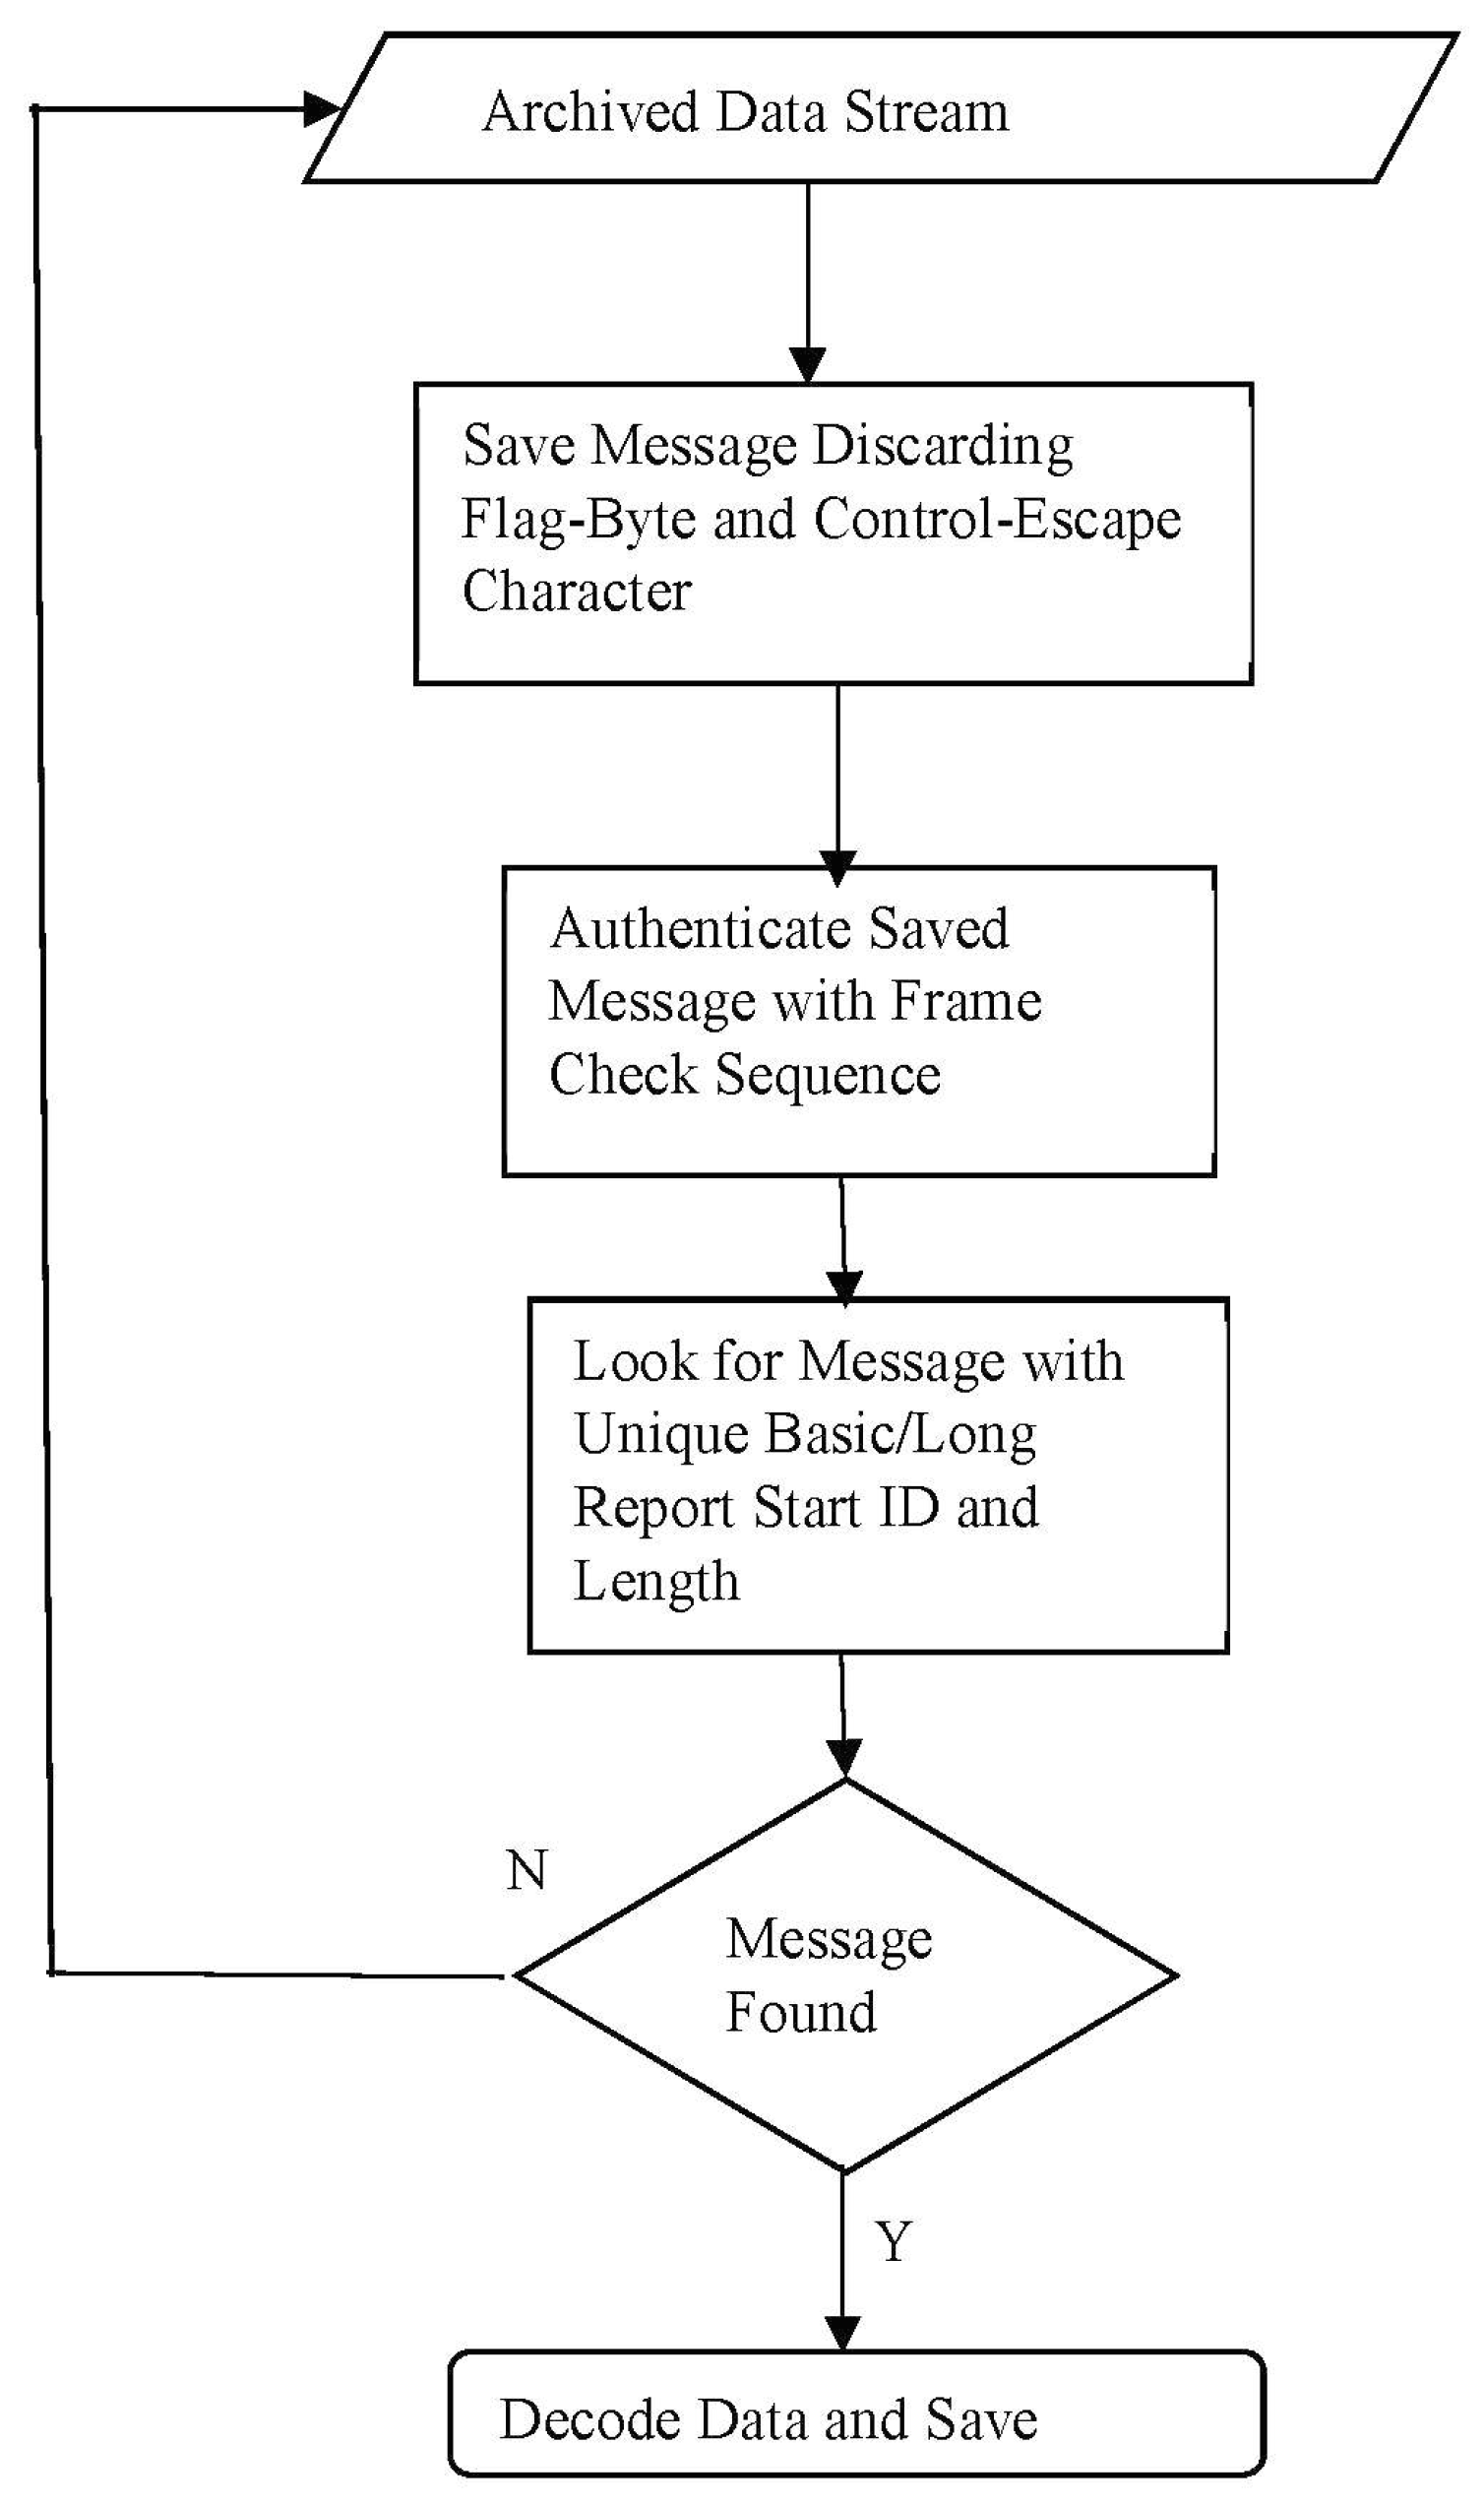
A “byte-stuffing” technique is used to provide the binary transparency. To include a data byte that coincides with either a flag byte (0x7E) or control-escape character (0x7D) within a message, each is converted into a unique two-byte sequence. On reception, any control-escape characters found are discarded, and the following byte is included in the message after being converted to its original form by XORing with the value 0x20 [35]. The frame check sequence (FCS) is then calculated on the clear messages. If the calculated FCS matched with the FCS in messages, the message is authenticated and ready for use. The message ID for basic UAT is 3010 and long UAT is 3110. The format of the UAT message in GDL 90 interface is shown in Table 2.
3.2. UAT ADS-B Message Definition
Each basic and long UAT message frame is known as the payload. The information encoded in the frame is called payload element. Each transmitted ADS-B message contains a payload that the receiver first identifies by the “payload type code” encoded in the first five bits of the payload [36]. The “payload type code” for basic and long messages are 0 and 1, respectively. The composition of ADS-B payload is presented in Table 3.
There are four basic payloads in the ADS-B message: header, state vector, mode status, and auxiliary state vector. All UAT messages incorporates a header that provides a means to correlate different messages received from a given aircraft. The header includes the payload type code, address qualifier, and aircraft address fields. The payload type code also determines if the message is an ADS-B or automatic dependent surveillance-rebroadcast (ADS-R) report. ADS-R is a client-based service that relays ADS-B information transmitted by an aircraft broadcasting on one link to aircraft equipped with ADS-B In on the other link [37]. For example, the information for an aircraft equipped with a 1090ES ADS-B Out system will be re-broadcasted to an aircraft equipped with ADS-B In on the 978 MHz frequency, and vice versa. The address qualifier determines the type of vehicle transmitting the report, i.e., if the transmitting aircraft has an ICAO address, or a surface vehicle or a fixed beacon.
The state vector contains position information, i.e., latitude, longitude, primary altitude, and horizontal and vertical velocity. It also contains the air or ground status of the aircraft and the type of primary altitude. The mode status elements are aircraft intent data that specify various parameters of the onboard avionics including the call sign, quality indicators of the position data both in horizontal and vertical directions, a quality indicator for velocity data, source integrity level, and capability modes. Furthermore, the auxiliary payloads include the information about secondary altitude.
4. Archived Data Parsing Algorithm and Data Filtration
A python module was developed to decode the data as defined as RTCA DO 282B. The module read the archived binary data from a text file, authenticated, and then decoded in consonance with the byte-to-byte definition. The module can process a single file or multiple files in batches depending on the option selected by the user. Figure 1 shows the algorithm adopted to decode the archived raw data stream.
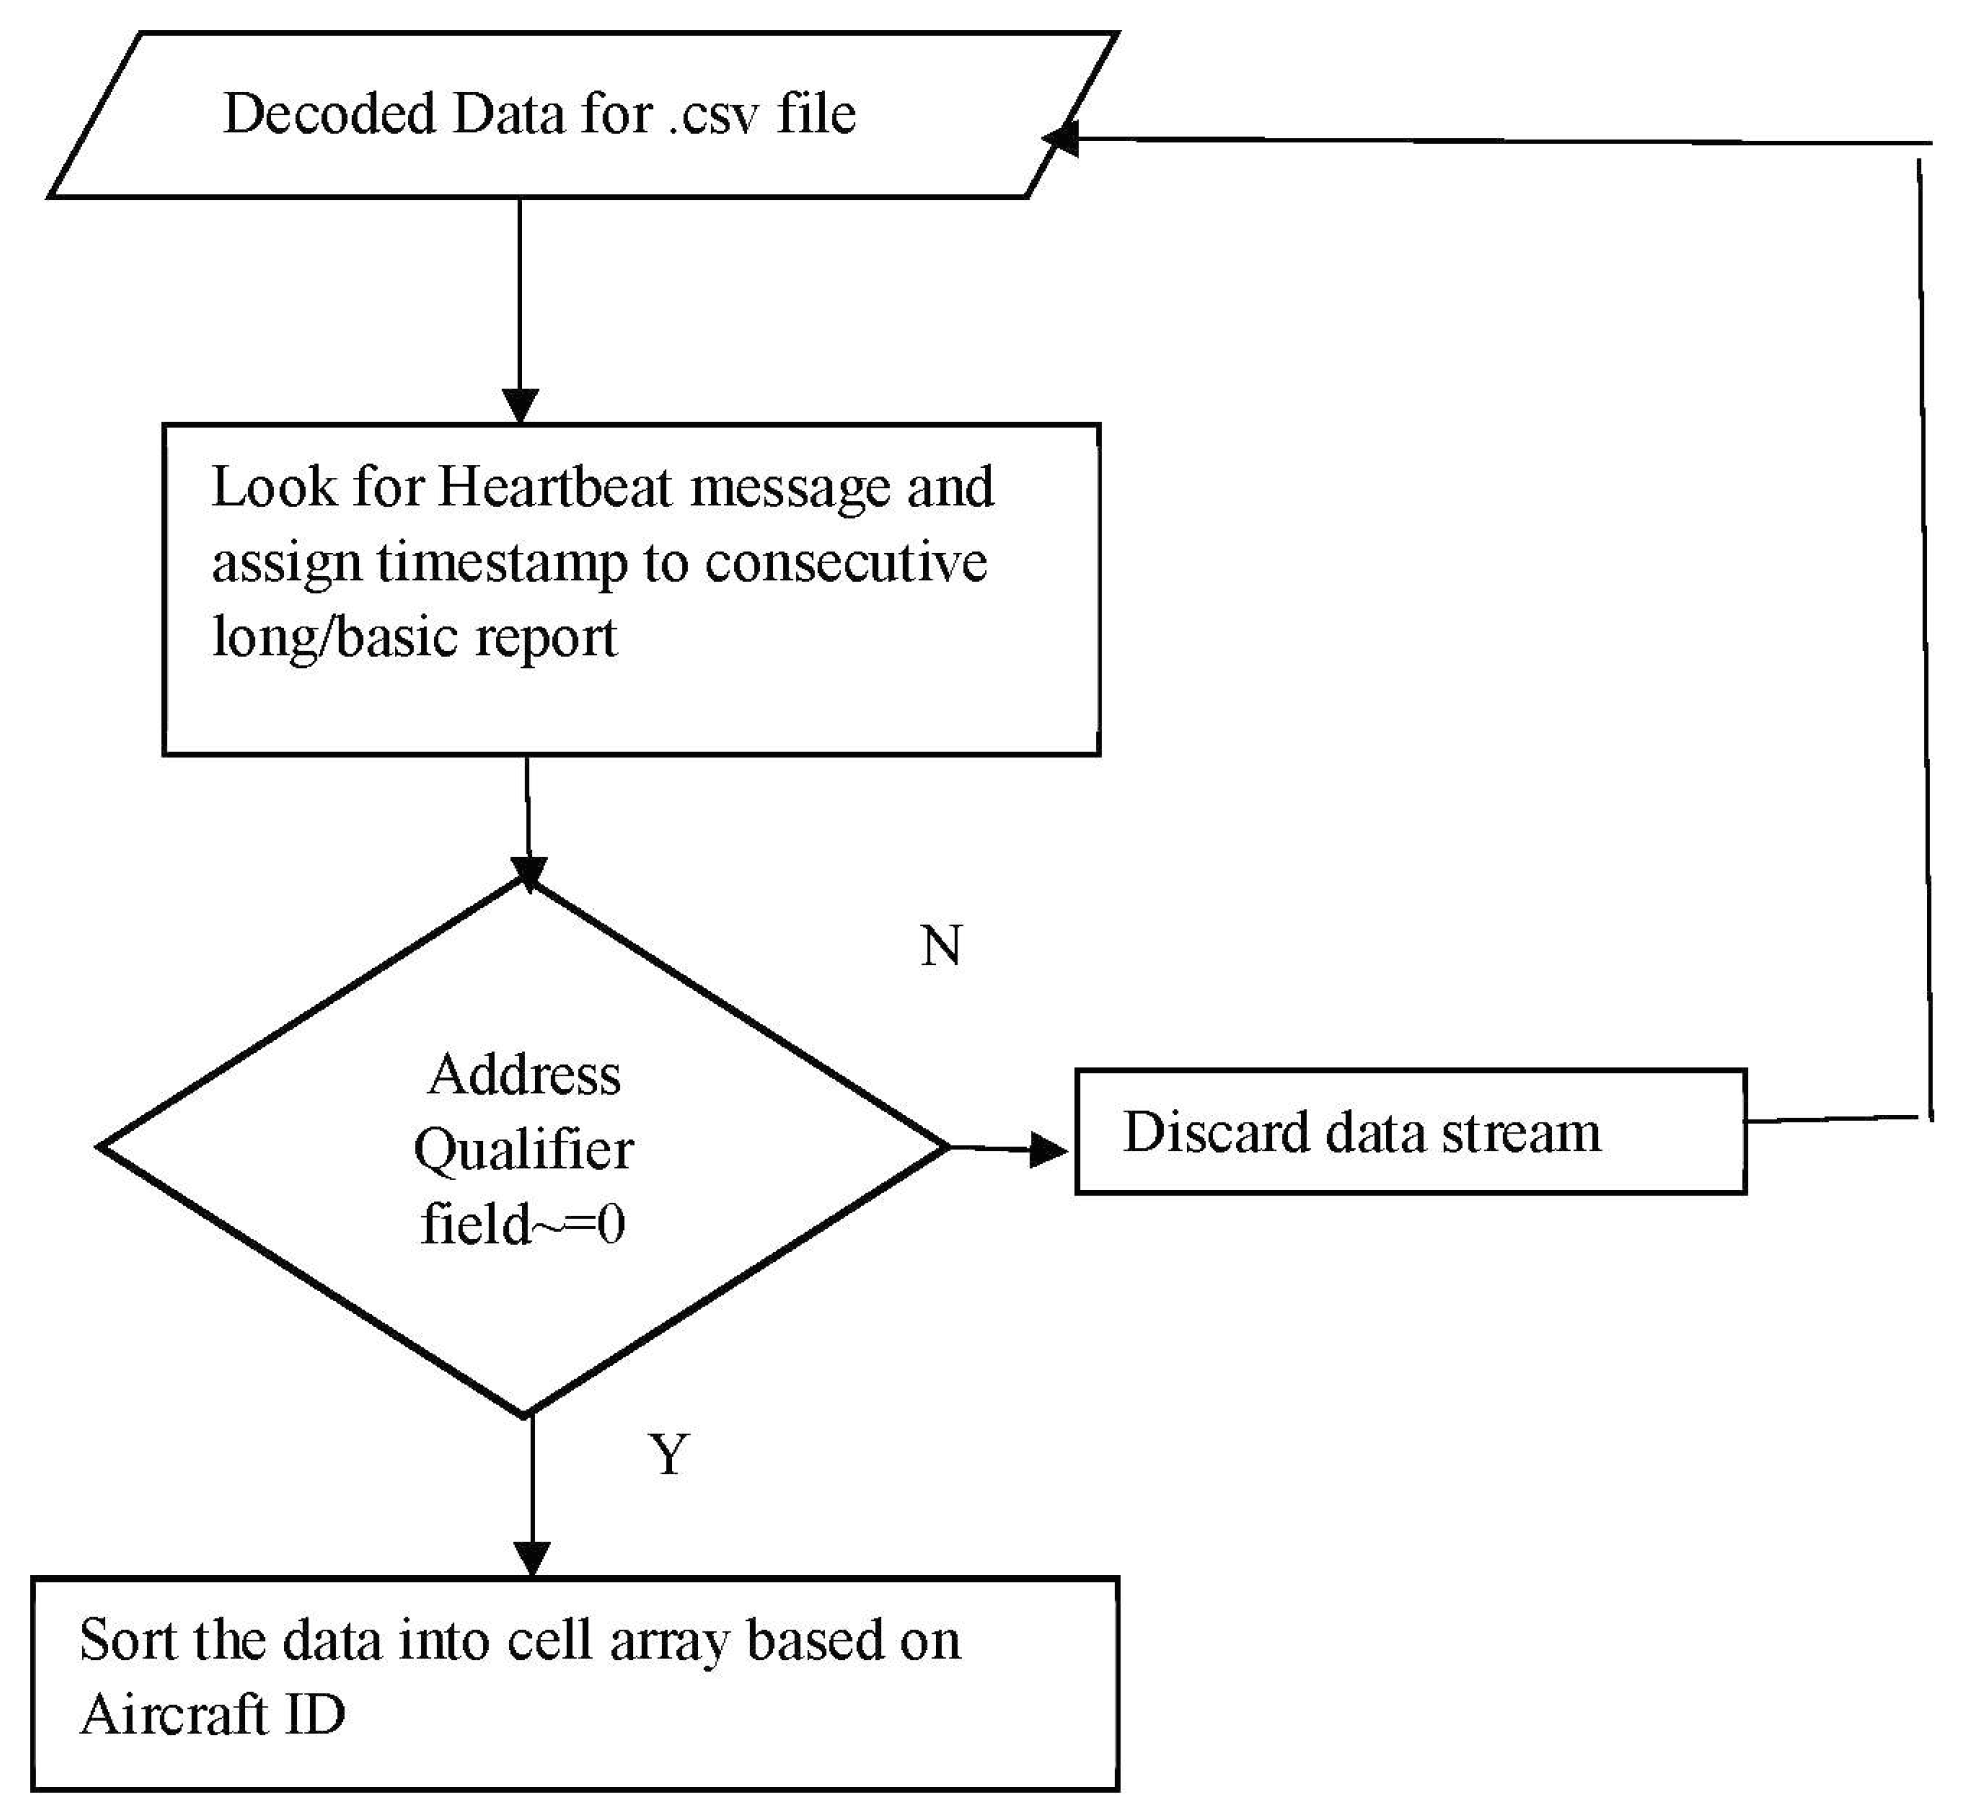
It should be noted time is not broadcasted with the UAT message. It is found from the heartbeat message generated by the GDL 90 sensor itself. The message ID for the heartbeat is 010. This message outputs the UAT time stamp in seconds elapsed since UTC midnight (0000Z). Thus, the time stamp for the messages is assigned from the preceded heartbeat message. The decoded messages are saved into a .csv file. After that the binary data are decoded and the readable messages are prepared for further analysis. To prepare the data for analysis, the first task was to assign the timestamp in each stream and separate the long and basic messages. The data stream received in between two stamps is assigned to the preceding time stamp. The basic and long messages are separated based on the type code. The ADS-B messages are also filtered by the unique identifier. At this point the data were saved as a matrix. The sorted data were further split up into a cell array based on the aircraft ID, a 24-bit unique address assigned by the ICAO. The data sorting was carried out in Matlab (R2016a by the MathWorks Inc. ©1994-2018). The sorted data were saved as a .mat file for the analysis. Figure 2 provides the data filtration and preparation algorithm.
The transceiver outputs one text to file every minute, 1440 files every day and, thus, four weeks of data brought about 43,200 archived text data files. Decoded data were saved to a .csv file. Each .csv file contained eight hours of data. The receiver also receives ADS-R and TIS-B reports. TIS-B is also a client-based service like ADS-R that provides ADS-B Out/In-equipped aircraft with surveillance information about aircraft that are not ADS-B equipped. A total of 186,477,411 data reports were decoded, amid them 173,624,802 reports were discarded during the filtration. About 6.89% of the entire data is considered in this study, which are the UAT data transmitted from ICAO address-assigned aircraft. The percentage of ADS-R data was higher compared to ADS-B, as all the commercial aircraft use 1090ES ADS-B which, in turn, is transmitted via ground stations as ADS-R for UAT transceivers to receive. Furthermore, the data contain ADS-B messages from different ground receivers, surface vehicles, etc. Saved data rows belong to only UAT basic and long messages transmitted from the aircraft whose address was assigned by ICAO. There is significantly more information present in the payload elements and not all of it is included or discussed in this study. Prior to assessing the messages, a list of message fields for analysis were selected based on the FAA’s Performance Analysis reports for ADS-B [6] and the flight test reports [28]. Table 4 lists the message field descriptions considered in this study.
5. Data Analysis and Detection of the Anomalies
The performance parameters, along with an extensive study of the overall ADS-B system, were done according to the public ADS-B performance report (PAPR) checklist [6] provided by the FAA. The purpose of this guidance material was to provide information to aid in the interpretation of data and also to help understand post-installation compliance/configuration checks and fault isolation. The performance was assessed by the percentage of failure in compliance with the standard, the maximum deviation from a nominal value, and the total time of failure. The inspection of the messages involves:
- Message Count Verification: The total number of basic and long messages received within one second is reported in the consecutive heartbeat message. A number of messages received in a specified time and the number of messages parsed was matched to verify if all the received messages were authentic.
- Missing Elements Identification: Identify if there is any payload information missing in the report.
- Message Discontinuation: Identify discontinuation when the update rate exceeds a specified interval. This anomaly is called data dropout.
- Integrity and Accuracy Check: Check the position data integrity and accuracy for enhanced surveillance. The minimum NICp and NACp value to operate in the airspace is seven and eight, respectively.
- Kinematic Check: Includes checks of changes in baro/geo altitude, horizontal position, and velocity. This involves a difference in baro/geo altitude, abrupt changes in position from the nominal value, etc.
A total of 12,852,609 messages received from 1389 aircraft were analyzed. The analysis started with the verification of the authentic messages. The ratio of the authentic message to the total number of message received was calculated. The number of total basic/long message received can be found in the heartbeat message and the number of authentic messages was counted while decoding the message. According to the authentication, even if the data stream has a basic/long report it will not be consider as a valid report if it is not of full length or if the calculated Frame Check Sequence (FCS) does not match with the FCS present in the report [35]. This verification reveals that not all the messages received are authentic and full. On average 87% of the received messages were full and authentic, and 13% of the reports received may contain important navigation information that were not used in this study. This ratio was calculated per day and the maximum message loss was 17%, whereas the minimum was 7%.
The second step was to identify the presence of specified message elements required for broadcast by ADS-B Out avionics, as described in Federal Regulation 14 CFR §91.227(d) [38]. The authentic and successfully-parsed messages missed some of these message elements. This anomaly is referred to as missing payload. As the individual aircraft data were plotted against the timestamp, it was found that the update interval of ADS-B was sometimes higher than the specified rate. ADS-B continuity is one of the important performance requirement and must be less than 3 s in the terminal airspace. This is referred to as message dropout or, simply, dropout.
An accuracy and integrity check was carried out according to Federal Regulation 14 CFR §91.227(c) [38]. In this study, the accuracy and integrity of the position value was assessed, and it was revealed that about 3% of the positions are non-precision (NICp < 8 or NACp < 7) conditioned data, which was regarded as low-confidence data.
The kinematic check disclosed the deviation between the altitude data. It should be noted that the 1090ES ADS-B data study [24] also showed a similar anomaly of altitude discrepancy. Among 1389 aircraft, 1305 aircraft exhibited discrepancies in altitude. Approximately 45% of the data have a discrepancy within 100 feet. Table 5 summarizes the experimental data analysis. Detailed characteristics of the anomalies found is described with graphical representations.
5.1. Missing Payload
Missing payload refers to two different anomalies. In some cases, the whole basic and long messages are missed, and, in some cases, part of message fields are not present in the payload. A total of 87% of messages were successfully parsed after authentication. The successfully-parsed messages missed some payload information. Most of the time these were the navigation accuracy values for position (NACp) and secondary altitude (essentially geometric altitude) value from the long report. NACp specifies the accuracy of the aircraft’s horizontal position information, which is vital for separation. In most airspaces, NACp must be greater than 8 [39]. The navigation integrity category (NIC) values were also missing in some reports, although these were not considered as severe as NACp. A total of 95% of the long message reports had geometric altitude in the secondary altitude field and 5% of the messages suffered from losing geometric altitude, which is an essential element. Additionally, the NACp value was not present in 0.50% of the data, which is crucial information to determine the accuracy of the position information. Other than these two fields, all the other information was available from all aircraft in all data frames. Overall, 0.40% of the messages were missing at least one kind of payload.
5.2. Dropout
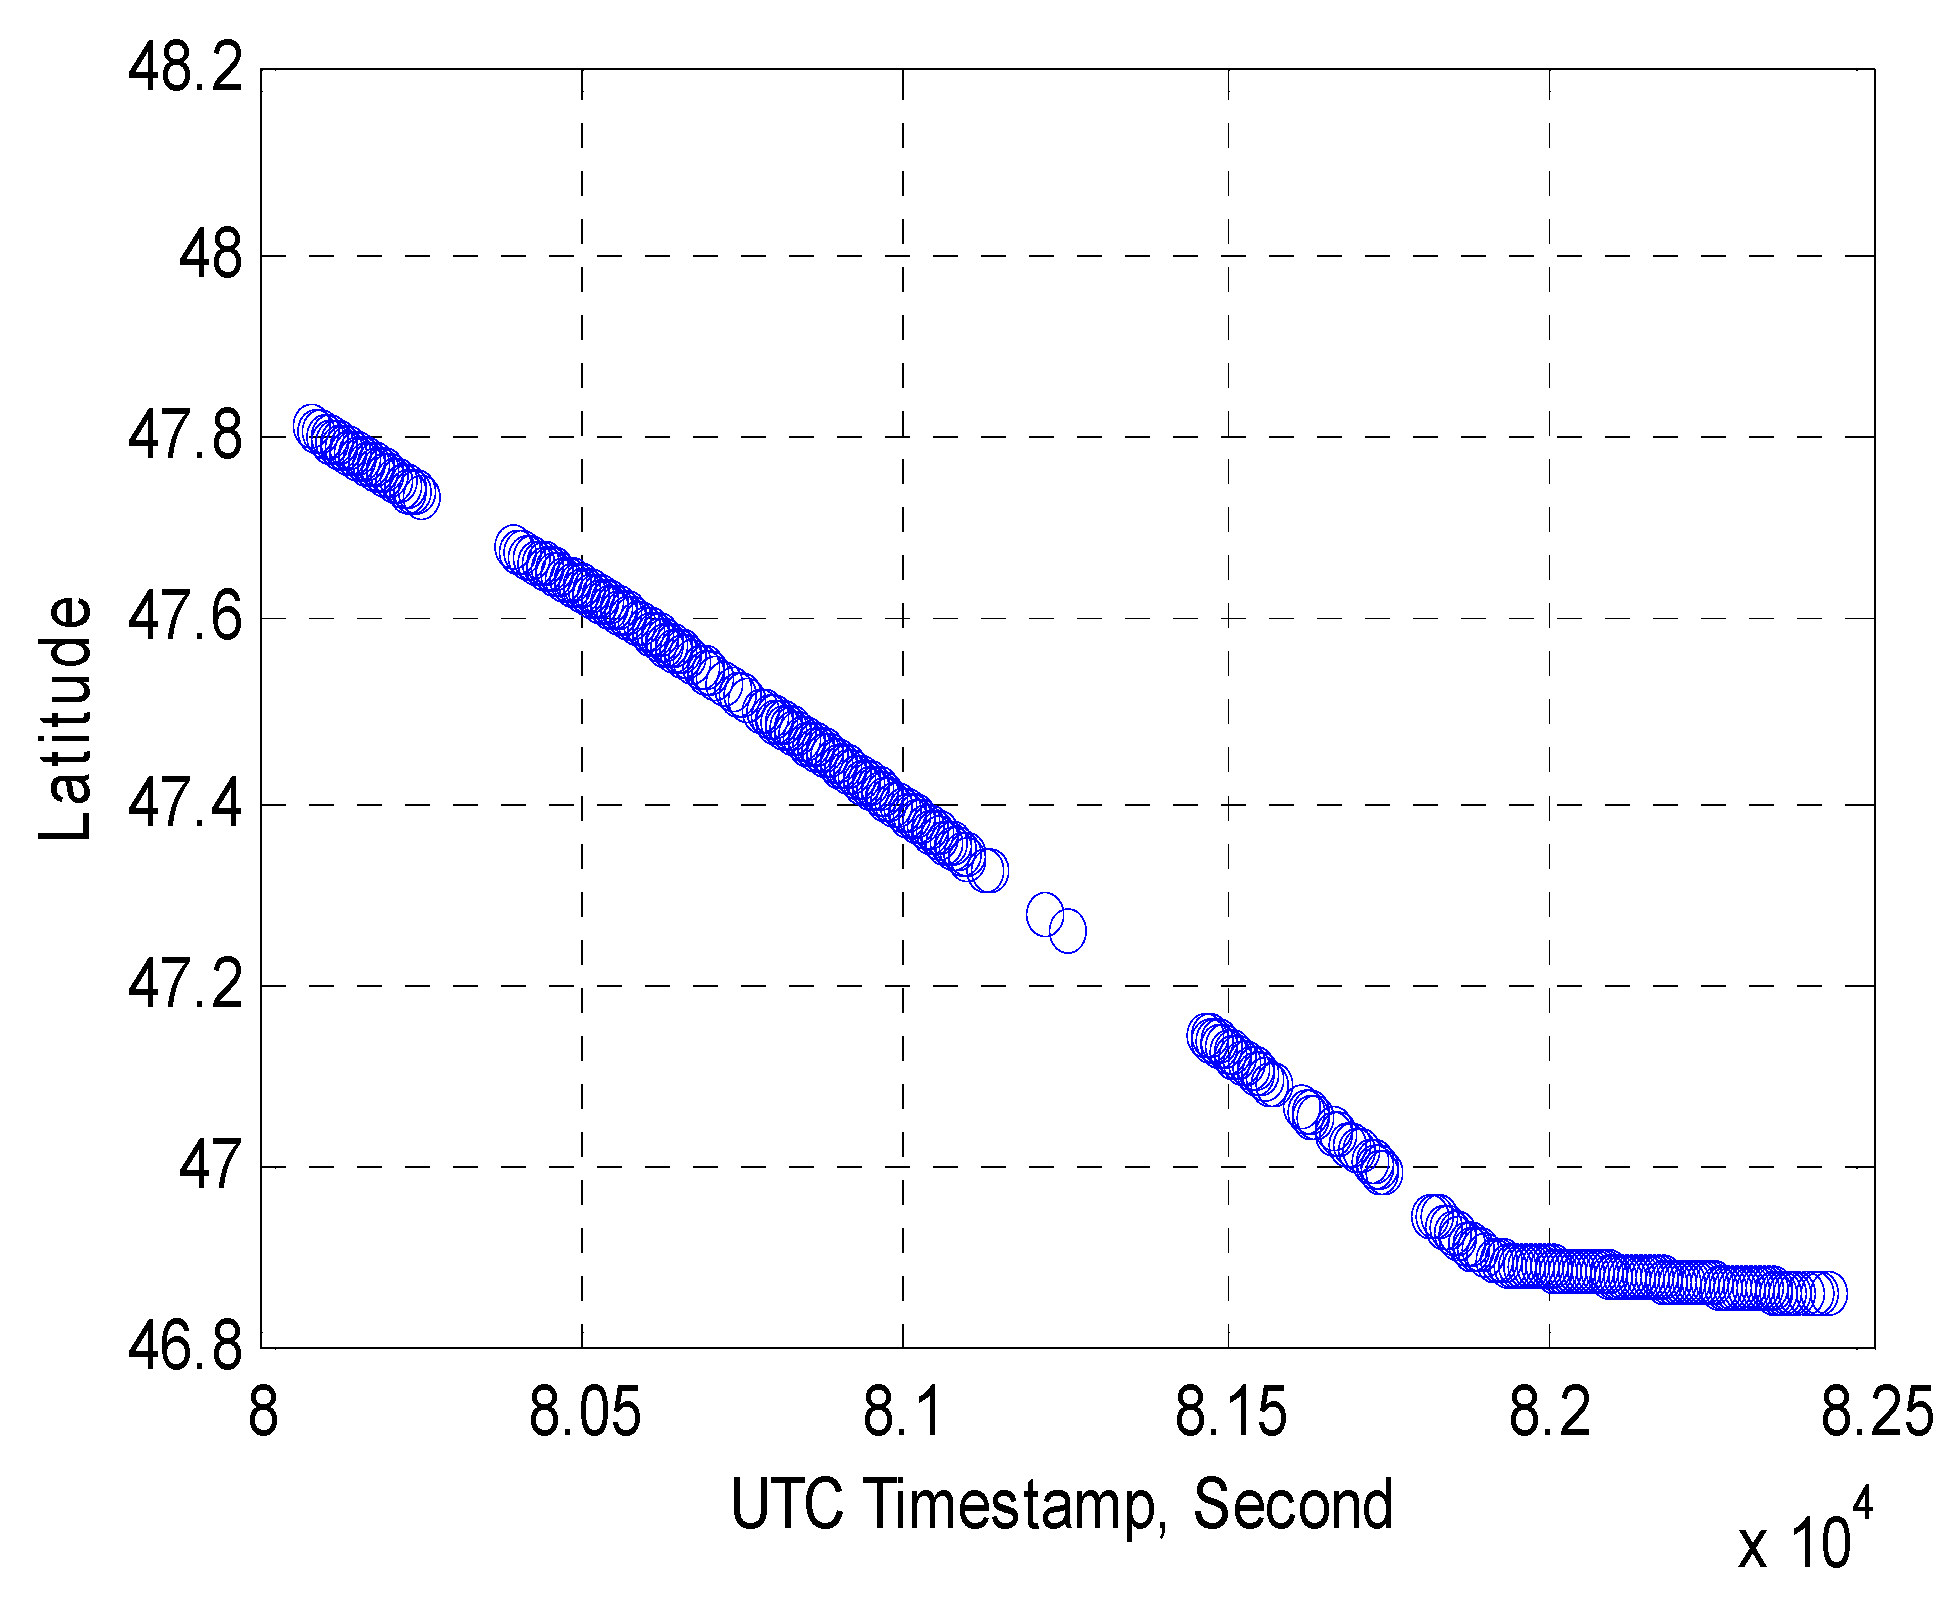
The first and foremost performance metric for any surveillance system is the continuous transmission and reception of the messages. Each surveillance sensor has a defined update rate or scan rate based on the capability and requirements. ADS-B is designed to update each second to provide a better traffic scenario, enhance situational awareness, and address the limitations of ground-based surveillance sensors. Dropout refers to a discontinuation of an update within one second. It is expected and designed that ADS-B will update information at a 1 Hz rate. However, the primary inspection which involved plotting payload data against timestamp revealed that the update rate is often much longer than 1 s. Dropouts occurred in flight multiple times, and they were of different time durations. Figure 3 is a visual presentation of discontinuation of the updates during a flight. Latitude data is used as a reference of discontinuation of the overall message frame. During flights the update interval must not exceed three seconds [40], therefore, in this study, if the time between two consecutive updates is equal to, or exceeds, the threshold of three seconds it is considered a dropout.
5.3. Data Jump
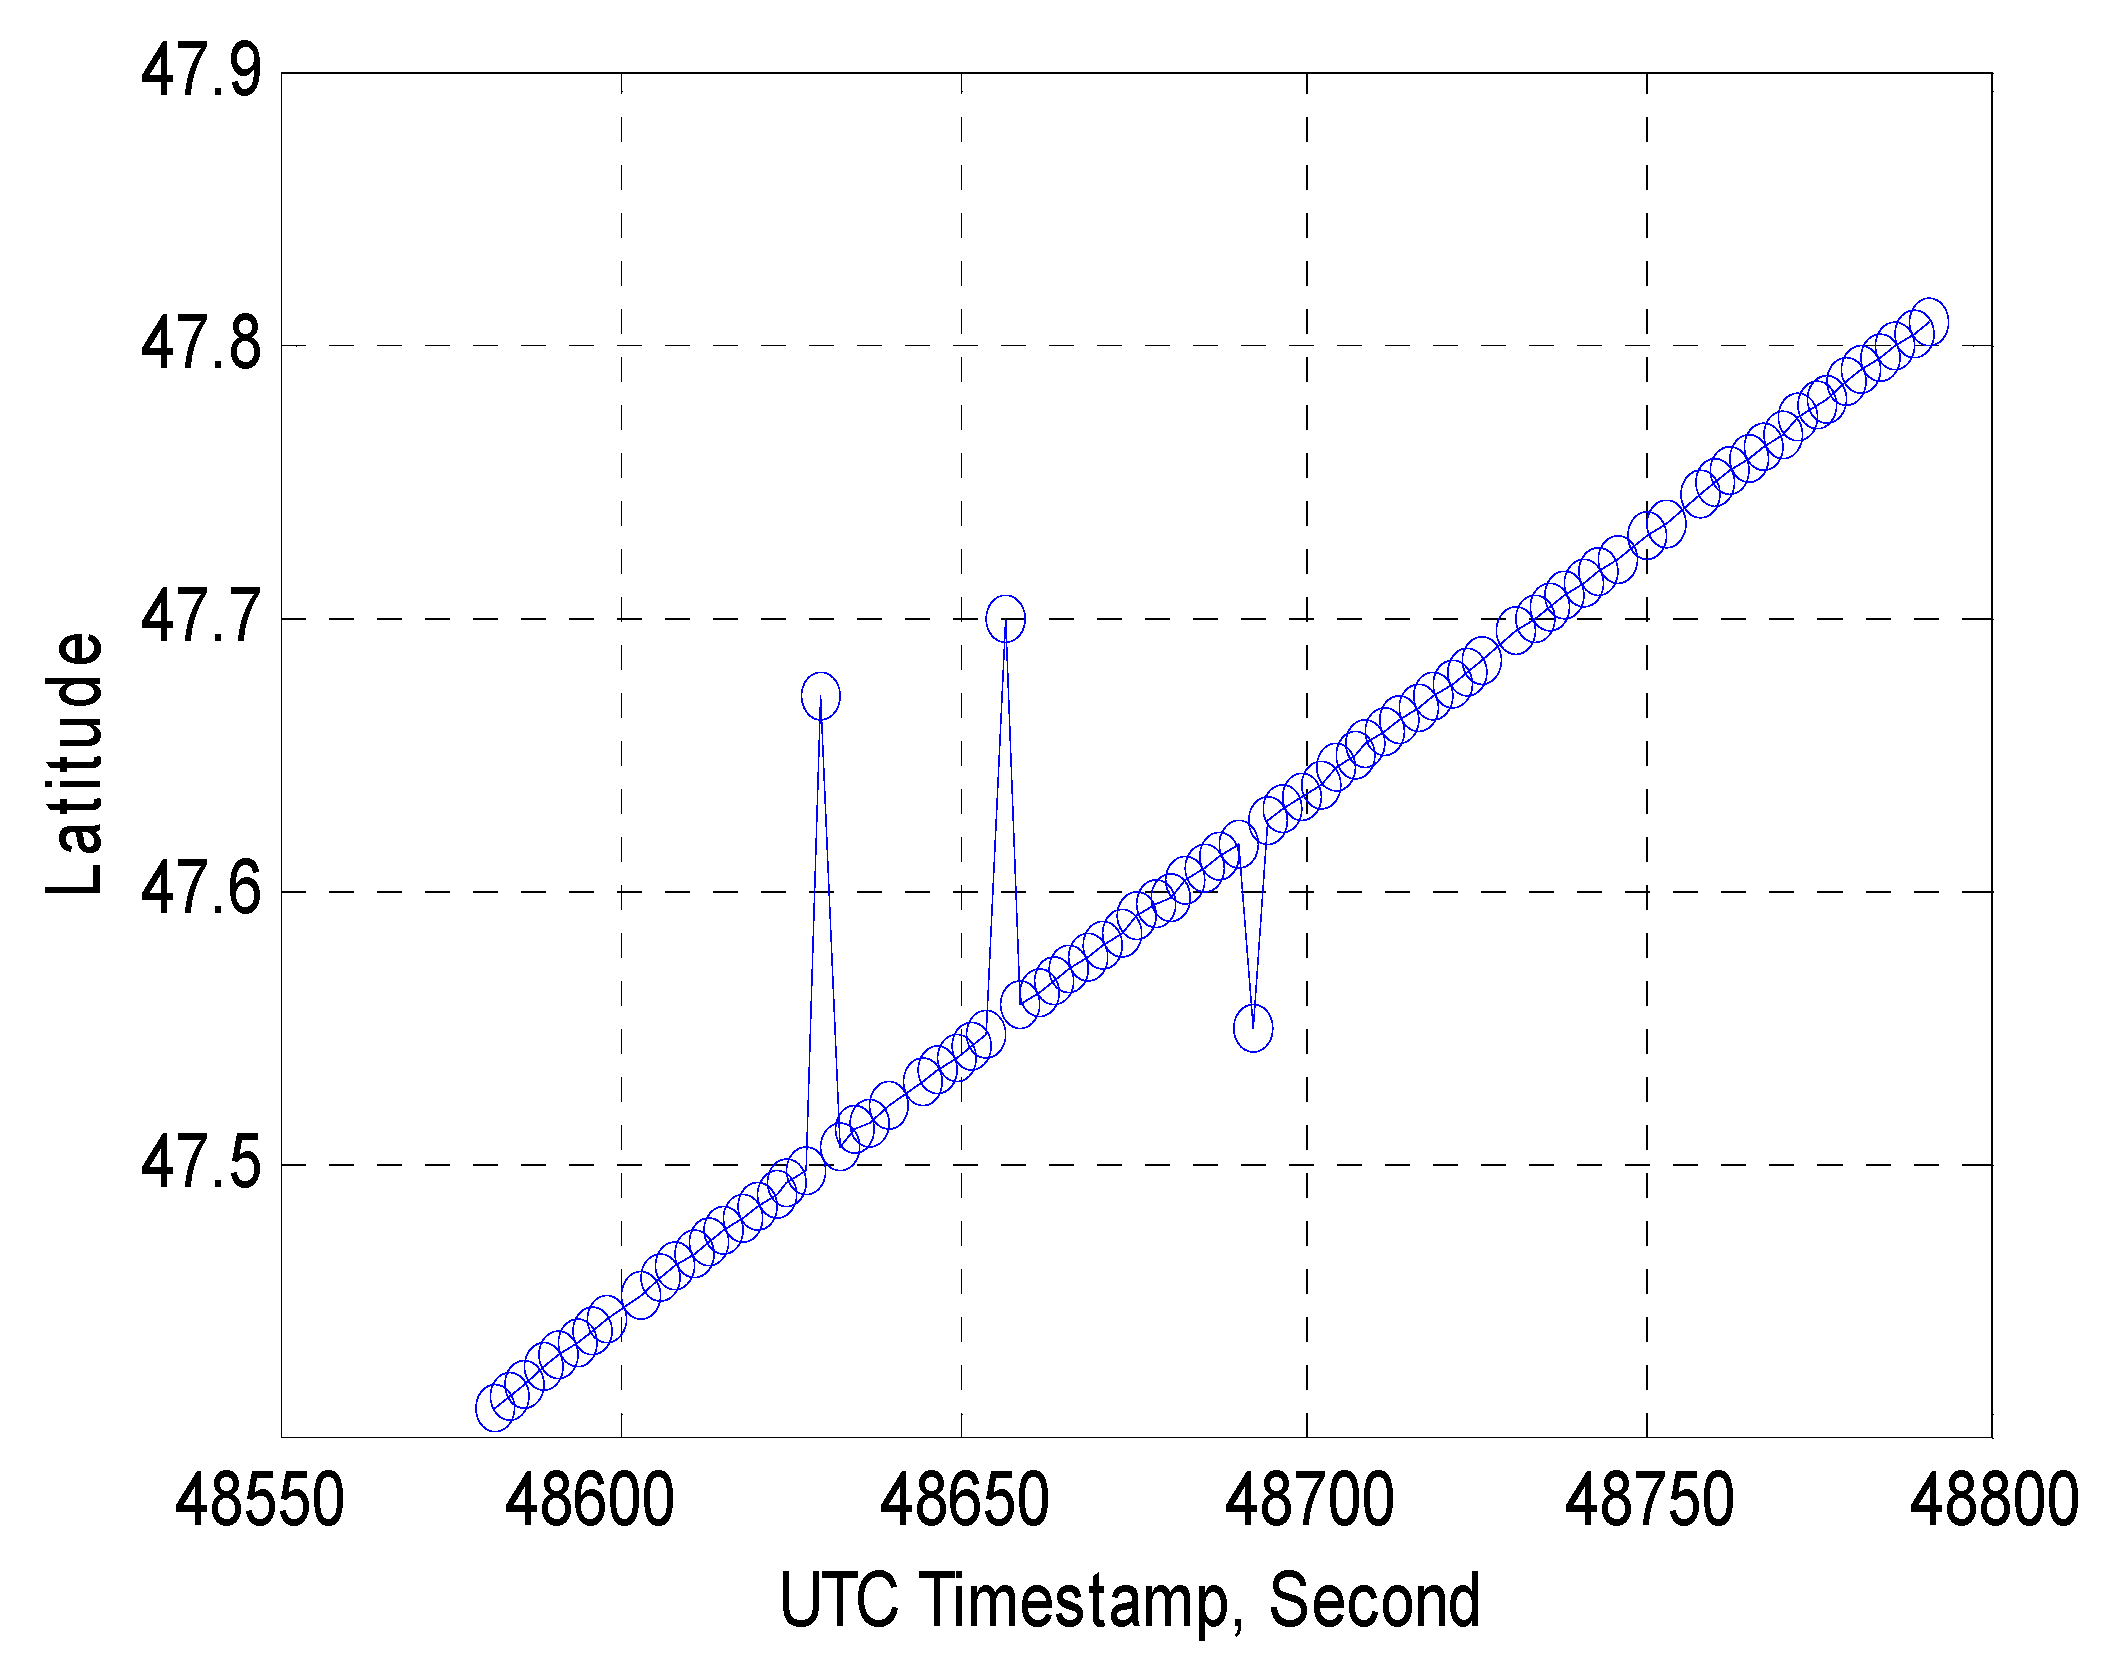
Data jump is a situation where any data point deviates significantly from its previous and next samples. This anomaly mostly occurred in latitude and longitude data. This also refers to dispersed data from a regular set of data. It looks like a jump when represented graphically. Thus, a jump is the event when one data point deviates significantly from its previous and next samples. As the data jump occurred for latitude and longitude data only, the most probable reason behind this is a data encoding issue from either the GPS end or ADS-B message generation end. The FAA also reported on ADS-B position jumps in their early implementation experiences and justified the cause as being a position encoding issue [26]. Experts from UND aerospace also suggested it may be a potential transponder issue. Figure 4 illustrates the jump in latitude data from a nominal value.
5.4. Non-Precision Data
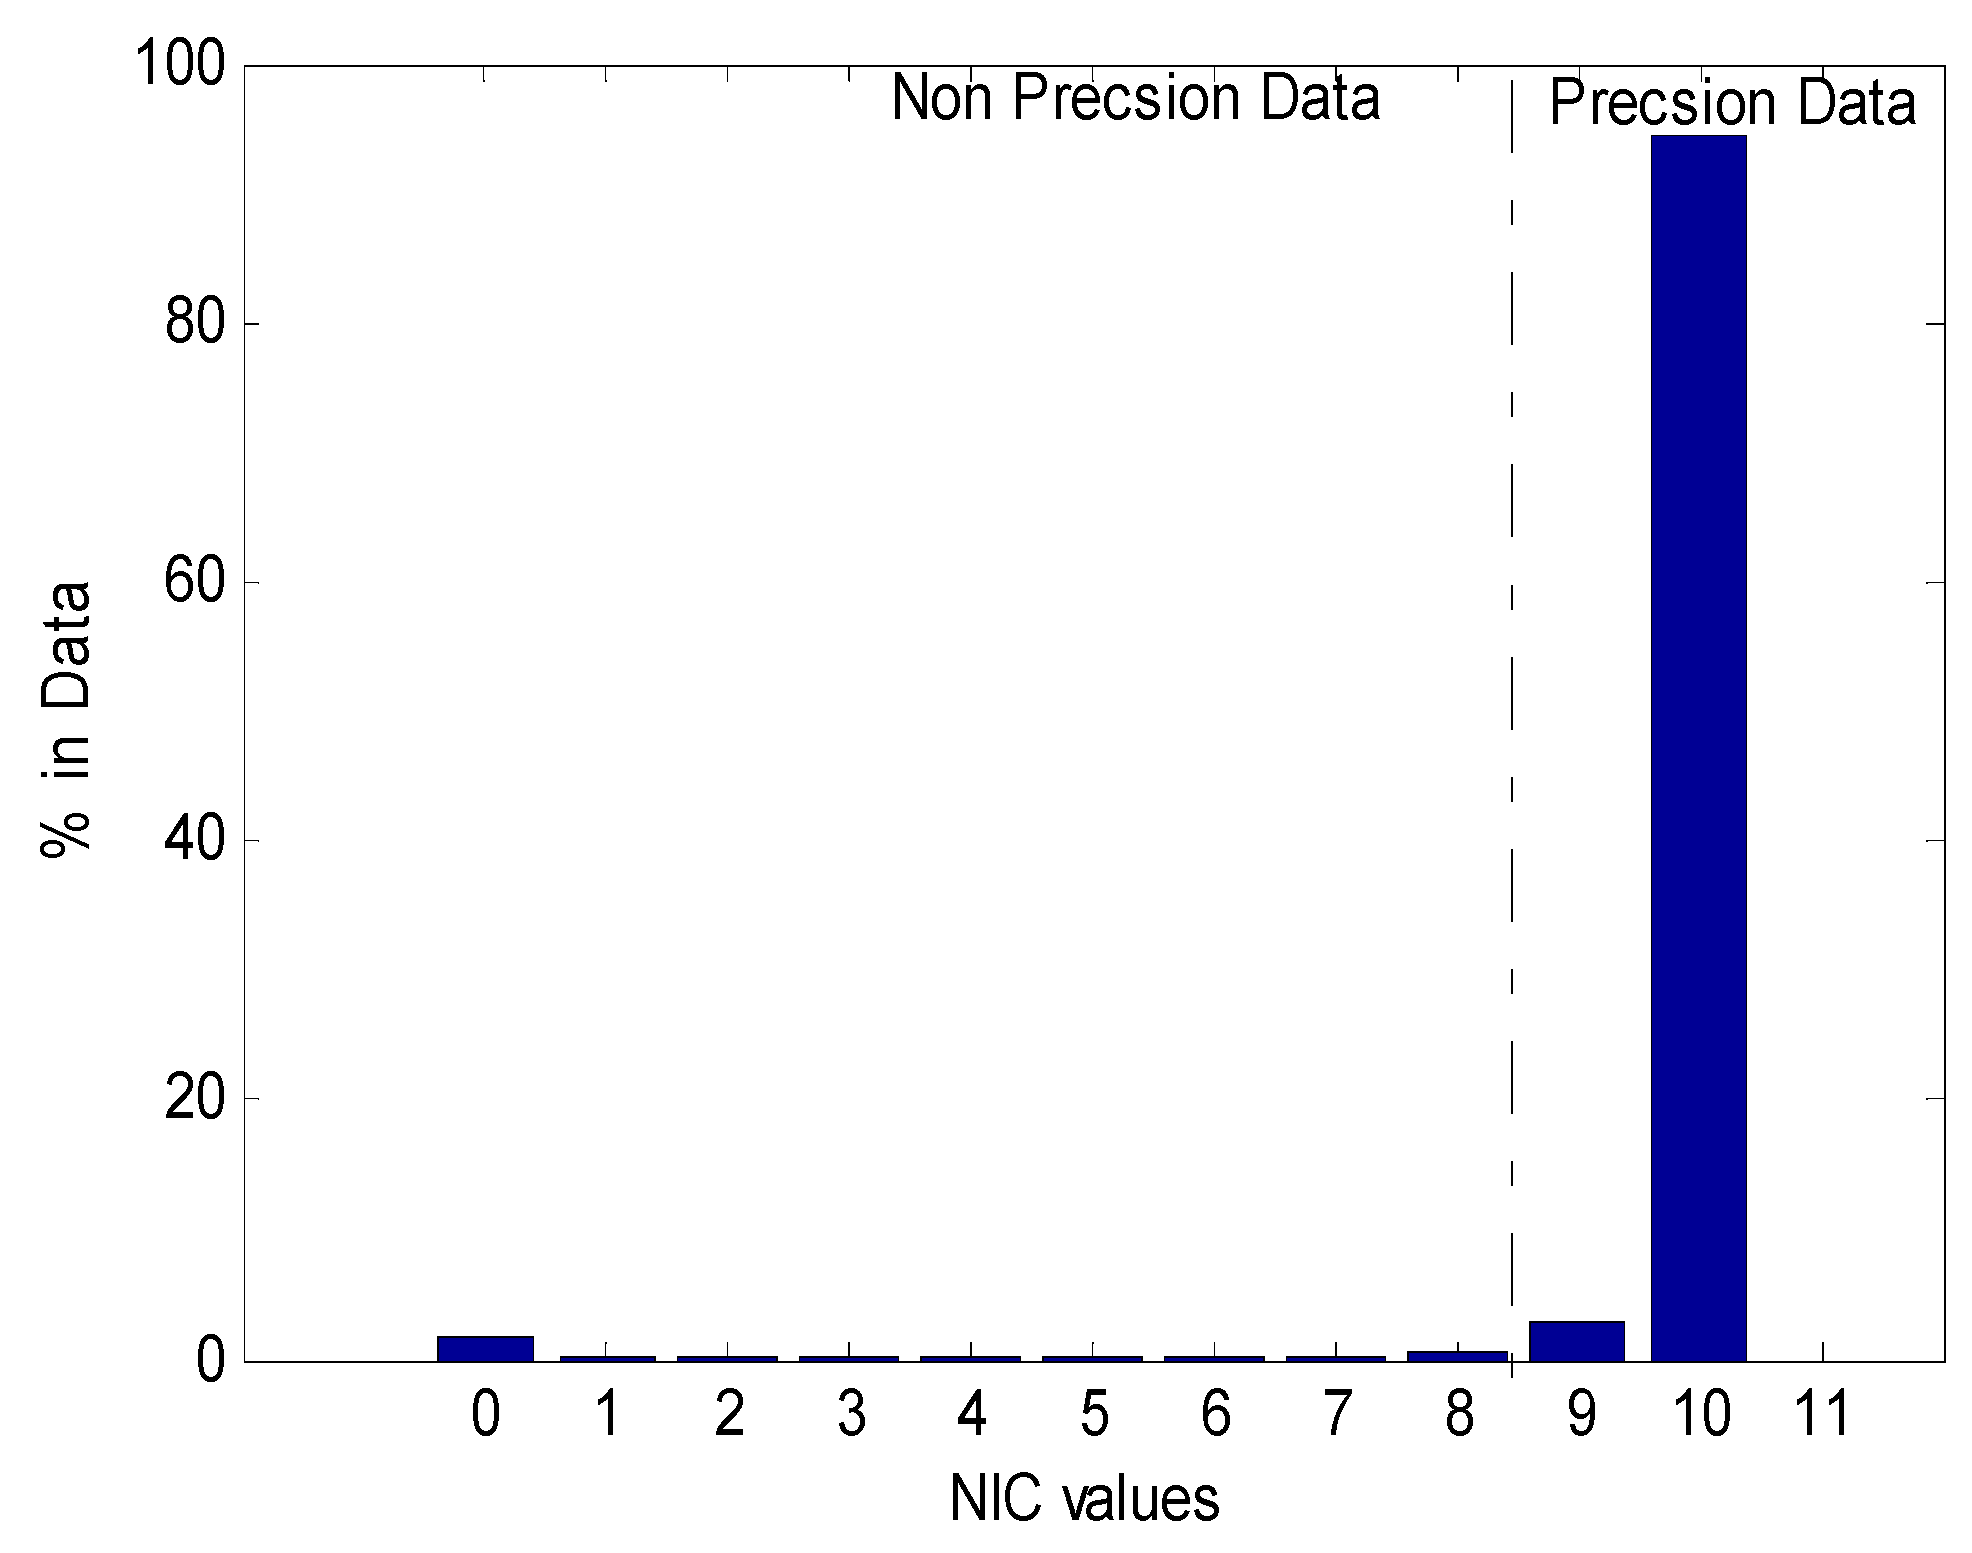
It is expected that the ADS-B position report will have an NIC value greater than eight and an NACp value greater than seven. However, the ADS-B system reports position with lower than the expected value in some cases. The data is called precision condition data when the NIC > 8 or the NACp > 7. When the NIC < 8 or the NACp < 7, the position data is referred to as the non-precision condition data. The low confident data refers to the data with a NIC < 8 or NACp < 7. According to the NIC, about 3% of the data are non-precision condition data, and for 1.82% of the data the integrity was unknown. The highest NIC value observed was ten, where the maximum NIC value possible is 11. Figure 5 shows the percent of the data integrity in a bar graph.
No data were found to have the maximum integrity in this dataset and a similar percentage was obtained from the accuracy indicator. The highest value for the accuracy indicator was 10, although the maximum possible accuracy indicator value is 11. An NACp value of 10 implies that the estimated position uncertainty of the GPS position data was less than 10 m. That means all the position data reported by ADS-B in the airspace surrounding Grand Forks have an uncertainty of less than 10 m. The highest accuracy data would reduce the uncertainty range from 10 m to 3 m.
5.5. Altitude Discrepancy
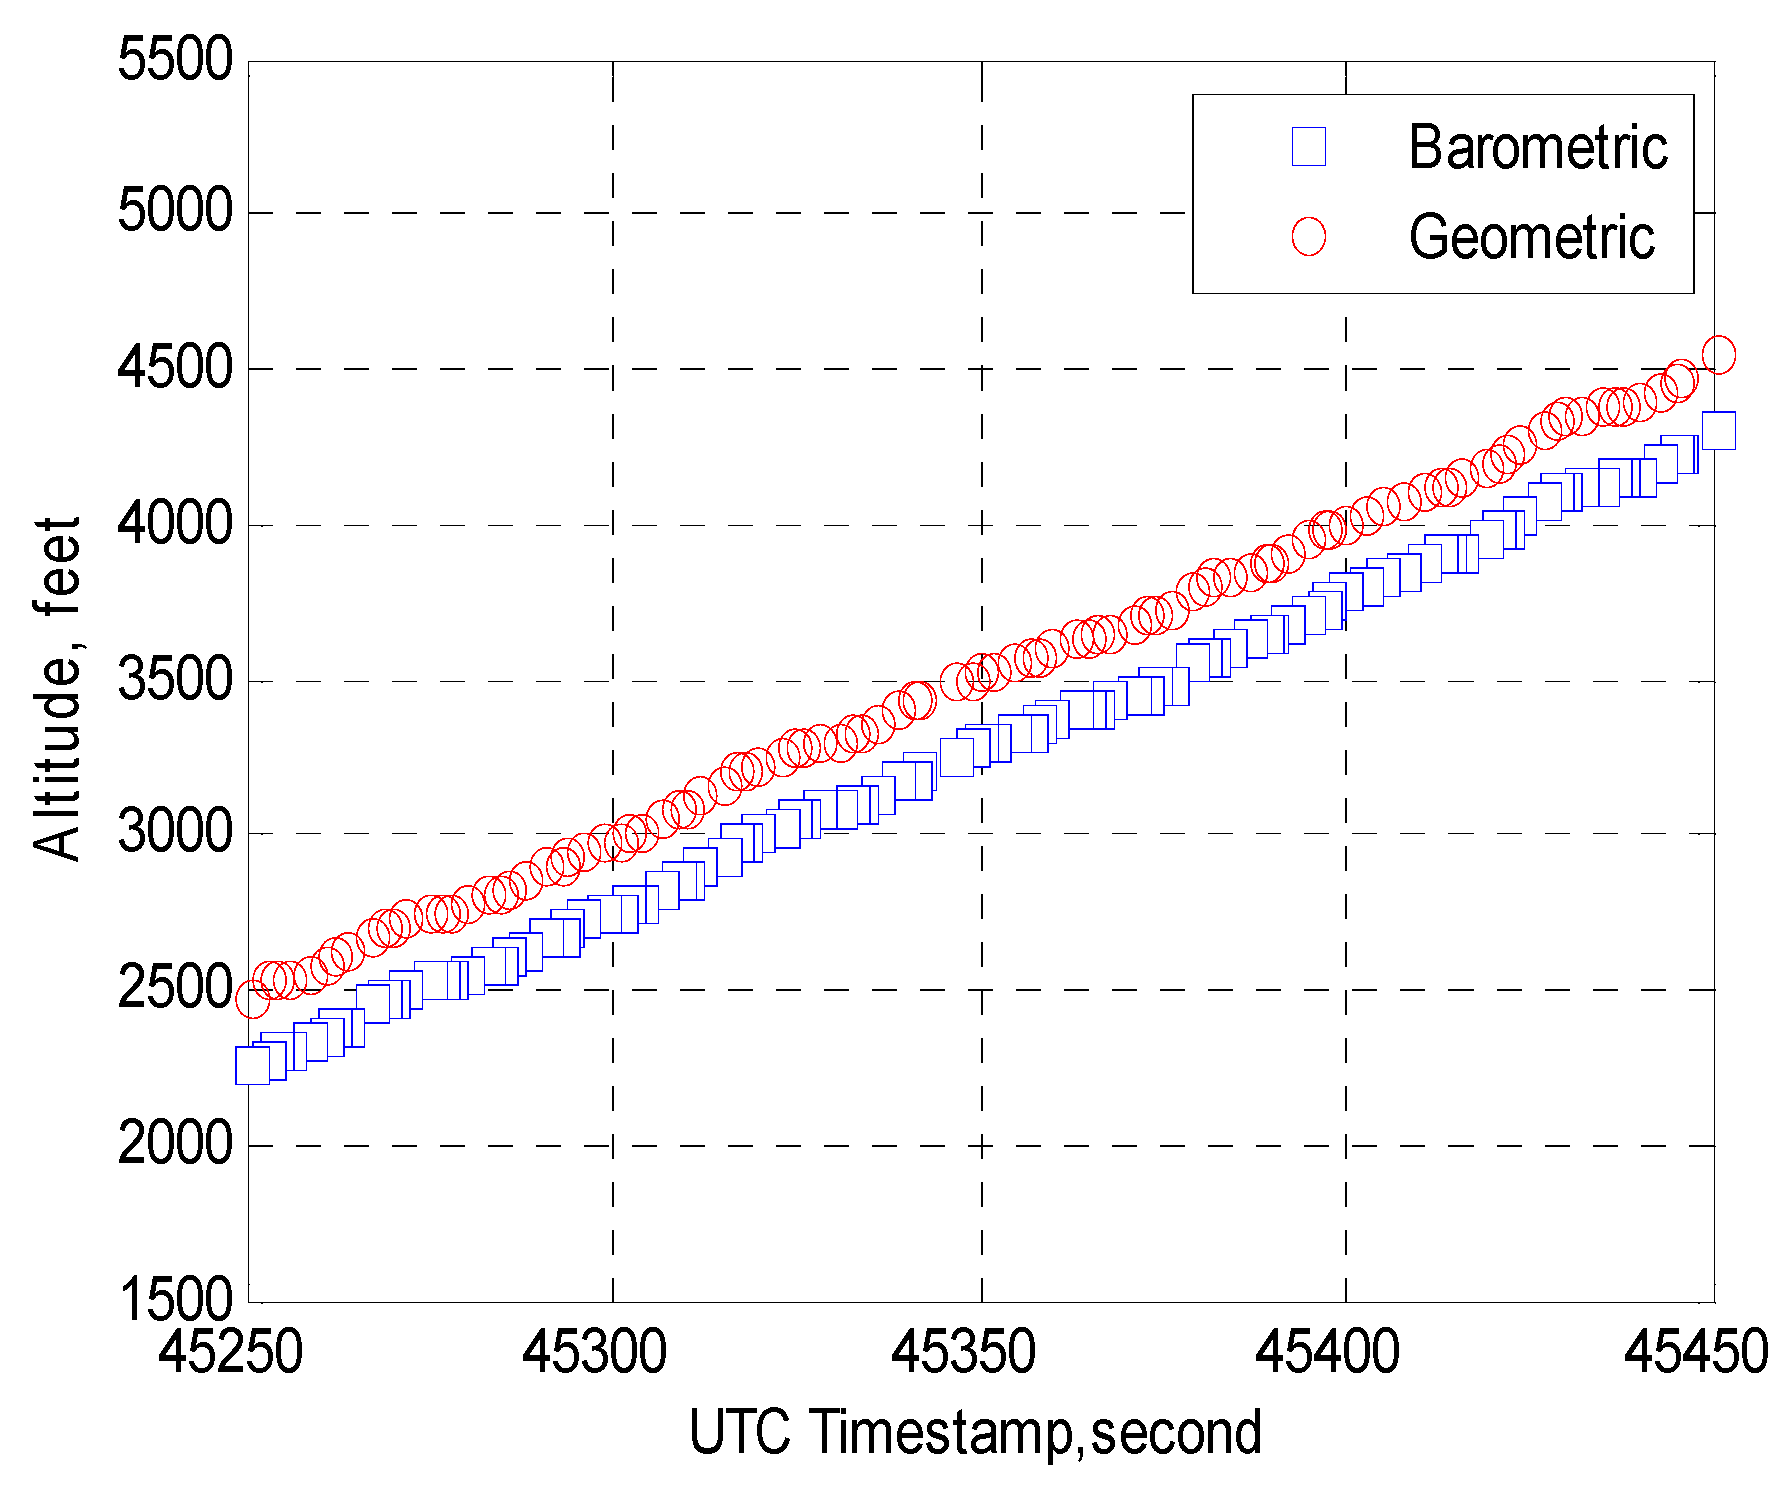
From the long reports, two different altitudes are available, one from the pressure sensor and another from GPS/WAAS. Barometric altitude has long been used by the aviation industry for measuring altitude and separation. Deviations between barometric and geometric altitude were observed from the analysis of the long report. A visual example of deviation between altitudes is presented in Figure 6.
The deviation ranges from 25 feet to 525 feet. Approximately 45% of the data have a discrepancy within 100 feet. About 47% of the data exhibit discrepancy of 101 feet to 300 feet. Around 3% of the deviation were higher than 300 feet. Although it is not entirely an anomaly from the ADS-B system itself, while using geometric altitude from ADS-B message for separation, this deviation may be a safety concern.
6. Dropout and Effect of Flight Parameters
ADS-B is envisioned to provide continuous surveillance and address the limitation of radar systems with a lower update rate. Similar to 1090ES, UAT ADS-B also suffered from message loss and/or failed to update within a specified rate. This is one of the most concerning issues because it degrades the situational awareness and increases the risk, especially in a high-density airspace. This section highlights dropout and classifies them into different groups and explores some factors that have the most significant influence on the results.
ADS-B continuity is the probability that the system performs its required function without unscheduled interruption, assuming that the system is available when the procedure is initiated [37]. The preliminary analysis of the test data demonstrates that approximately 67.51% of the messages were updated within the specified update rate. Dropout includes those 32.49% instances where the update rate exceeded 3 s.
To understand the factors behind the dropout, an analysis of flight data available in the ADS-B message was carried out. The main purpose was to understand the effect of flight from the ADS-B message itself. Three essential pieces of information from the flight data are considered as potential factors behind dropout which are referred to as airborne factors. These are:
- Flight level (altitude);
- Distance from the ground receiver (range); and
- Heading.
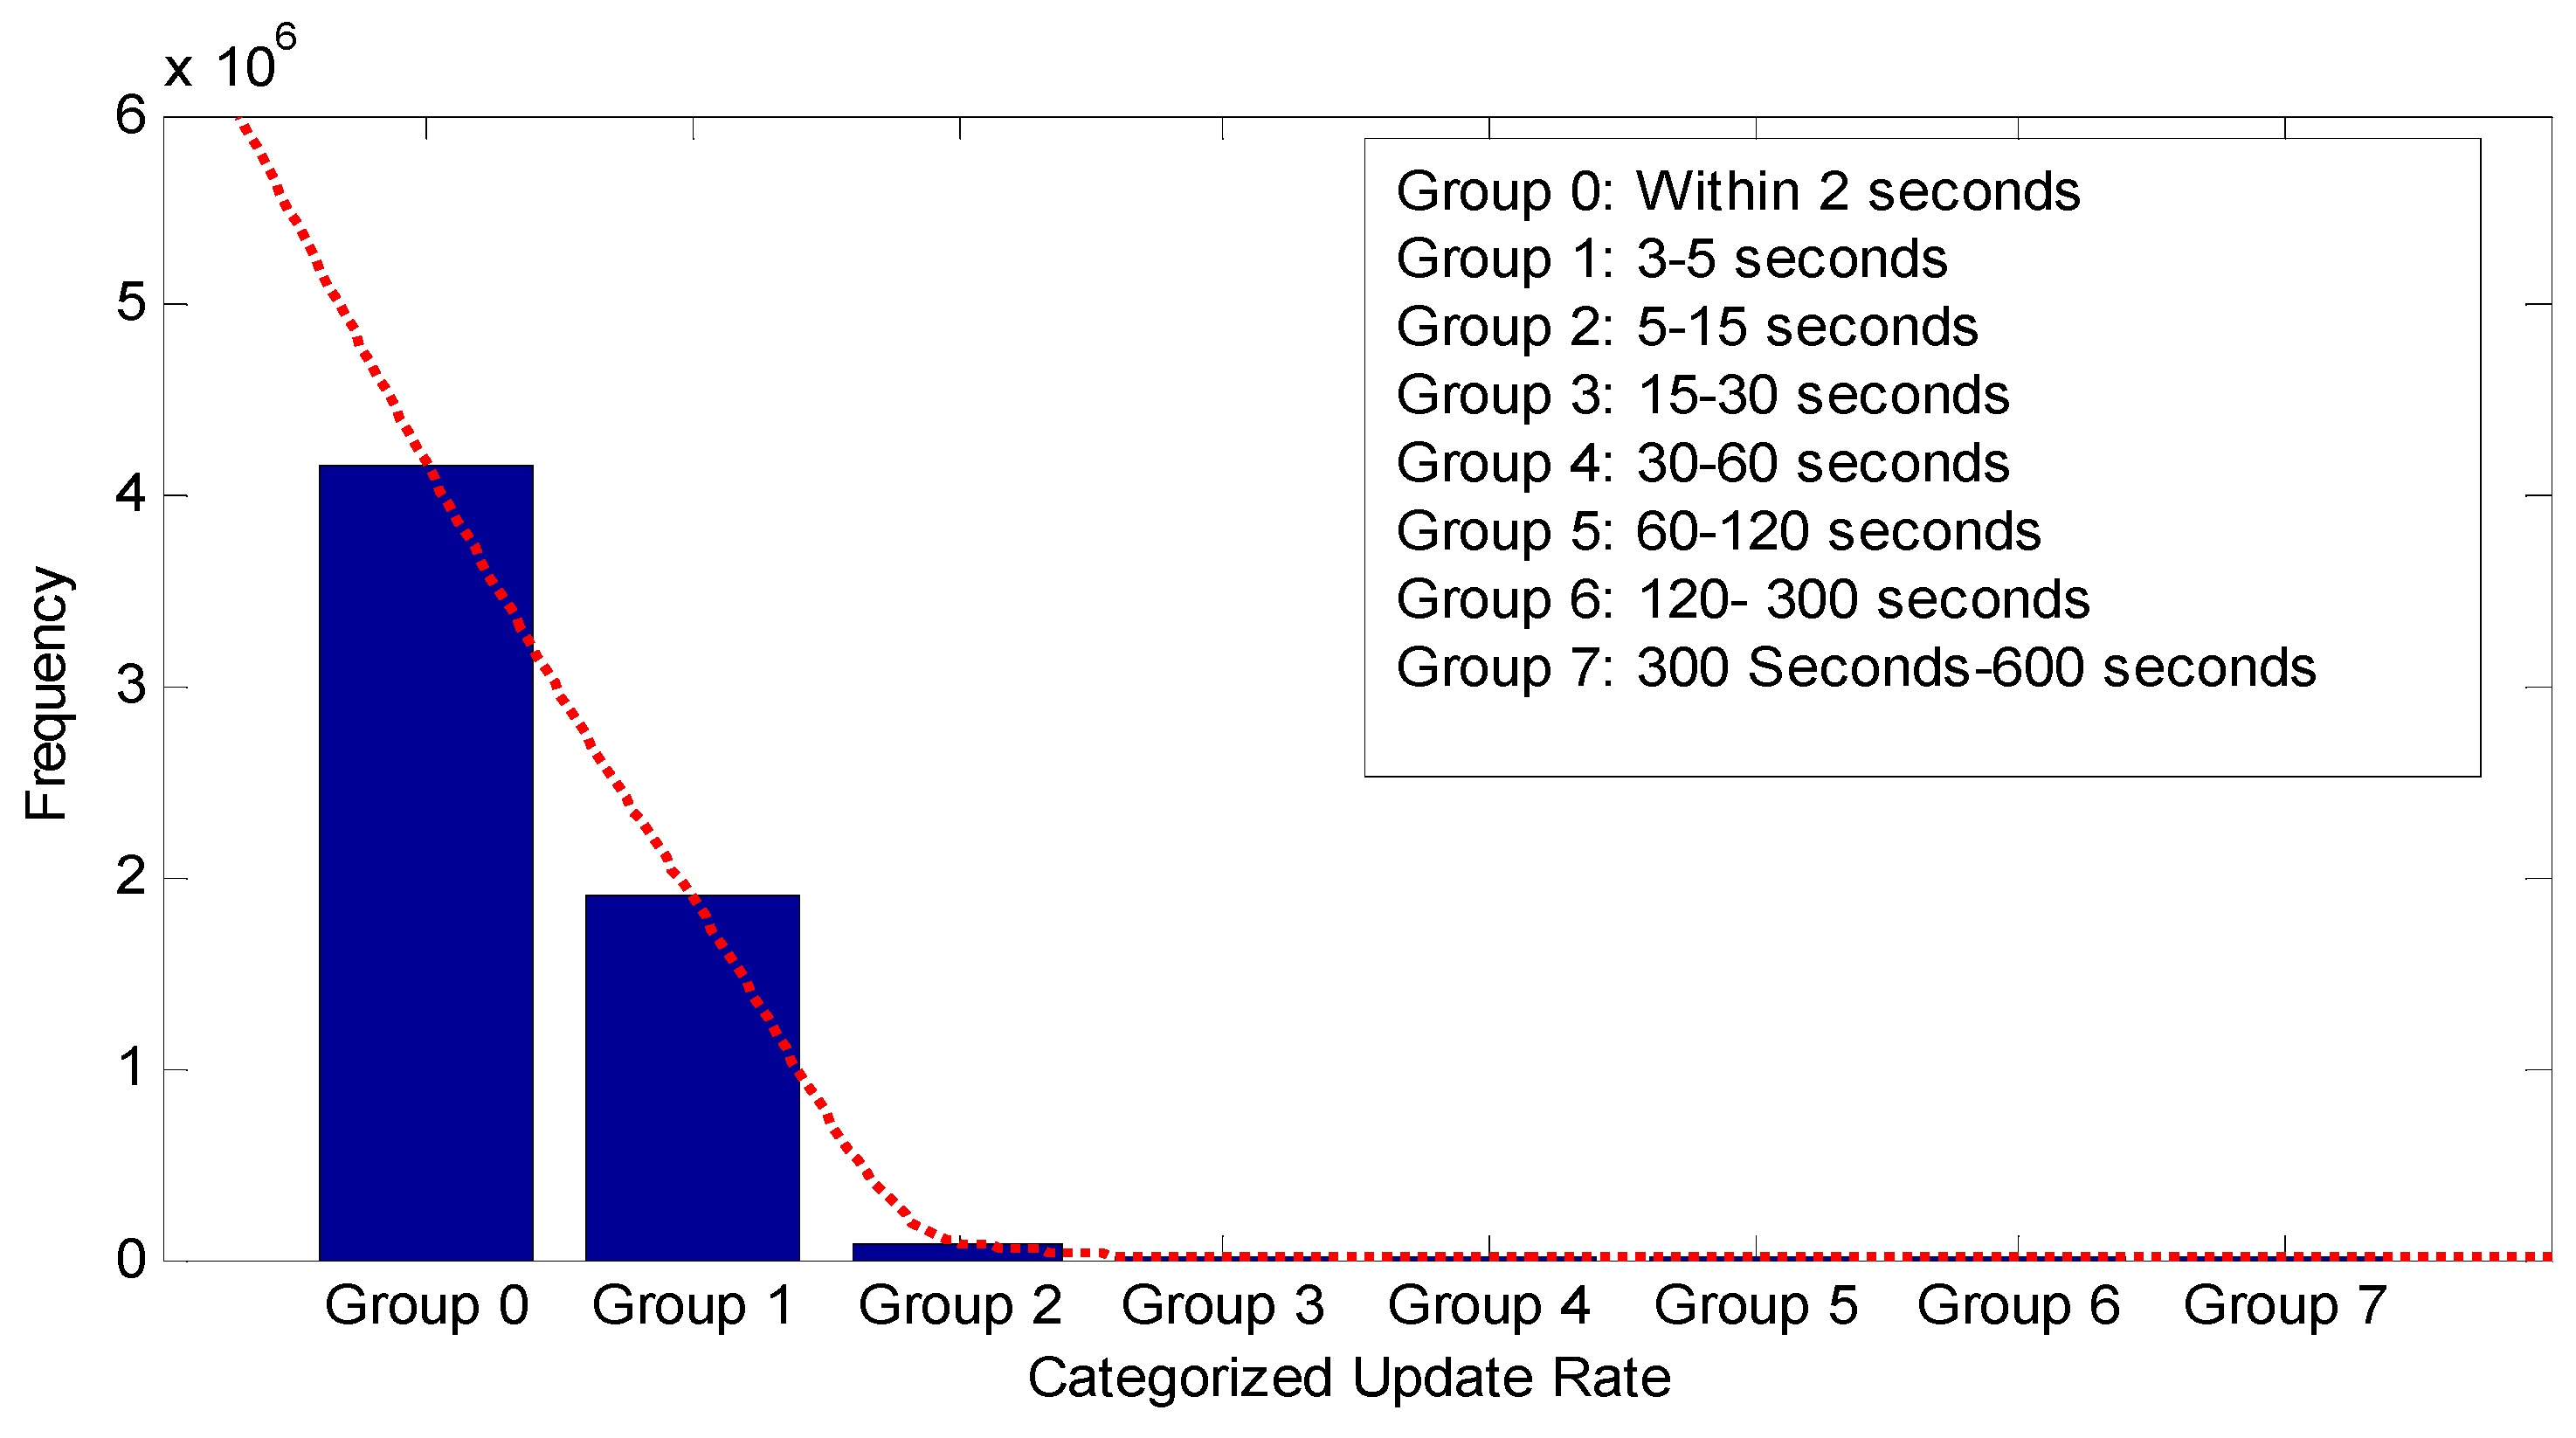
To reveal the effect of airborne factors, a statistical hypothesis test was carried out. Prior to conducting any statistical test, it is mandatory to know the data distribution. To conduct the test, the dropout occurrence was categorized based on the duration of the dropout. Table 6 illustrates the update rate category based on the duration of the update interval. It represents the update rate categorized in eight different groups, the frequency of each group dropout occurrence, the occurrence percentage, and a remark. The update interval of Group 0 was within 2 s, which is the expected update rate for the ADS-B system, and over 67% of the data belong to this group. Group 1 to group 7 are marked as dropout, and 32.49% of the data belonged to these seven groups.
Figure 7 shows the histogram of categorized update rates that clearly indicates that the update rate duration follows a non-normal distribution; instead, an exponential distribution is observed.
Most of the dropouts (30.80%) are of Group 1, Group 2 comprises 1.42% of dropouts, and Group 3 comprises 0.10% of dropouts. The percentage of dropout in the rest of the four groups is 0.17%. Only 0.01% of dropout durations were between 300 and 600 s. The most prolonged time interval with no update was 520 s.
An exponential distribution describes a process which occurs continuously and independently at a constant average rate. This kind of distribution was expected as all the update rate categories are independent of each other, and a longer duration of the update is not wanted. The dropout frequency is a term used to represent the number of events that occurred in the dataset. The frequency of Group 0, Group 1, and Group 2 are higher than the rest of the groups. Group 0 update rate was the successful update rate, where the remaining groups were marked as dropouts.
To confirm data distribution, a Shapiro–Wilk normality test [41] was carried out as previous studies [24,25,26] tested the ADS-B data normality with this test. This test compares the sample data to a normally-distributed set of data with the same mean and standard deviation. All hypothesis tests ultimately use a p-value to weigh the strength of the evidence. A small p-value (typically ≤0.05) indicates strong evidence against the null hypothesis, so the null hypothesis is rejected. If the test is non-significant (p > 0.05), the sample distribution is not significantly different from a normal distribution. If, however, the test is significant (p < 0.05), then the sample distribution is different from a normal distribution. The p-value of test data, p test = 0.03 < 0.05, thereby proving that the data are not normally distributed and conforms to a non-linear function.
As the data distribution does not follow normality, a non-parametric hypothesis testing “Friedman Test” was adopted to test the significance of the factors in dropout. The Friedman test is used to test for the differences between two or more groups when the dependent variable being measured is ordinal [42], or the continuous data deviates from normality, and the independent variable is categorical. It is a non-parametric hypothesis test. The ADS-B continuity study [25] also made use of this test prior to modelling the 1090ES ADS-B update rate with a generalized linear model. This test was chosen because the characteristics of the data agree with the fundamental assumption of this hypothesis testing and it provided a reliable result with surveillance sensor data in the prior study. This test assumes [42] that the data are not normally distributed, and each group is measured on a different occasion for the different altitude/heading/range cases, while the response is measured at a continuous level (i.e., dropout in flight time is continuous).
Like other hypothesis tests if the p-value is lower than 0.05, it implies that there is a significant difference between the group in a different category. The test was carried out in Minitab, a statistical software package [43]. The hypotheses were:
H0: There is no significant difference between dropout occurrence and factor levels (flight level, range, heading); and
H1: There is a significant difference between dropout occurrence and factor levels (flight level, range, heading).
This test was also carried out in Minitab. The Friedman test provides a rank to each level. In non-parametric statistics, ranks transform the numerical values of each group in ascending order that describes the changes in the group. An overall χ-square value is also provided, which is calculated from the sum of squared errors. The update rate for different groups per flight hour is the treatment and the different levels of the flight parameters are considered as the block. The change in dropout per flight hour due to the change in block for different flight levels was assessed, for example. This ranked data was calculated within each level of block, and tests for a difference across the levels of the update rate, i.e., the update rate of different groups.
6.1. Effects of Flight Level
To understand the effects of altitude, the categorized dropout was again grouped into different flight levels. Four different flight levels were chosen, and the number of dropout occurred are expressed in per flight hours. FL 1 is a region where the altitude is less than 4000 feet, FL 2 is the region between 4000 feet to 8000 feet, the altitude region of 8000 feet to 12,000 feet is depicted as FL 3, and the altitude region of 12,000 feet to 18,000 feet is referred to as FL 4. For Group 1 to Group 5, the frequency of dropout per flight hour decreases until Flight Level 3 and then it increases again. Groups 6 and 7 follow the same trend as the dropout frequency, decreasing until Flight Level 2 and increasing in higher altitudes. The frequency of each group of dropouts at different flight level is listed in Table 7.
In the analysis the different group dropout was considered as the treatment and the altitude was regarded as the block. The test result for different flight level dropout frequency indicates there is a significant difference in dropout frequency in the different flight levels. Table 8 represents the statistical results; the p-value is 0.03, which reveals the significance of flight level in dropout occurrence.
Figure 8 shows the grouped dropout frequency changes with different flight levels. The figure indicates the fact that with changes in flight level the frequency of dropout changes.
From Table 8 the rank indicated the occurrence of dropout in ascending order. FL 4 has the highest rank, which is interpreted as the dropout frequency being the highest in that altitude region. FL 1 and FL 3 suffered from dropout mostly after FL 4. FL 2 suffered the least from dropout according to the rank associated. Thus, it reveals that flying in the altitude level of 4000 to 8000 feet will result in less ADS-B message dropout, resulting in more continuous surveillance during flight.
6.2. Effect of Range
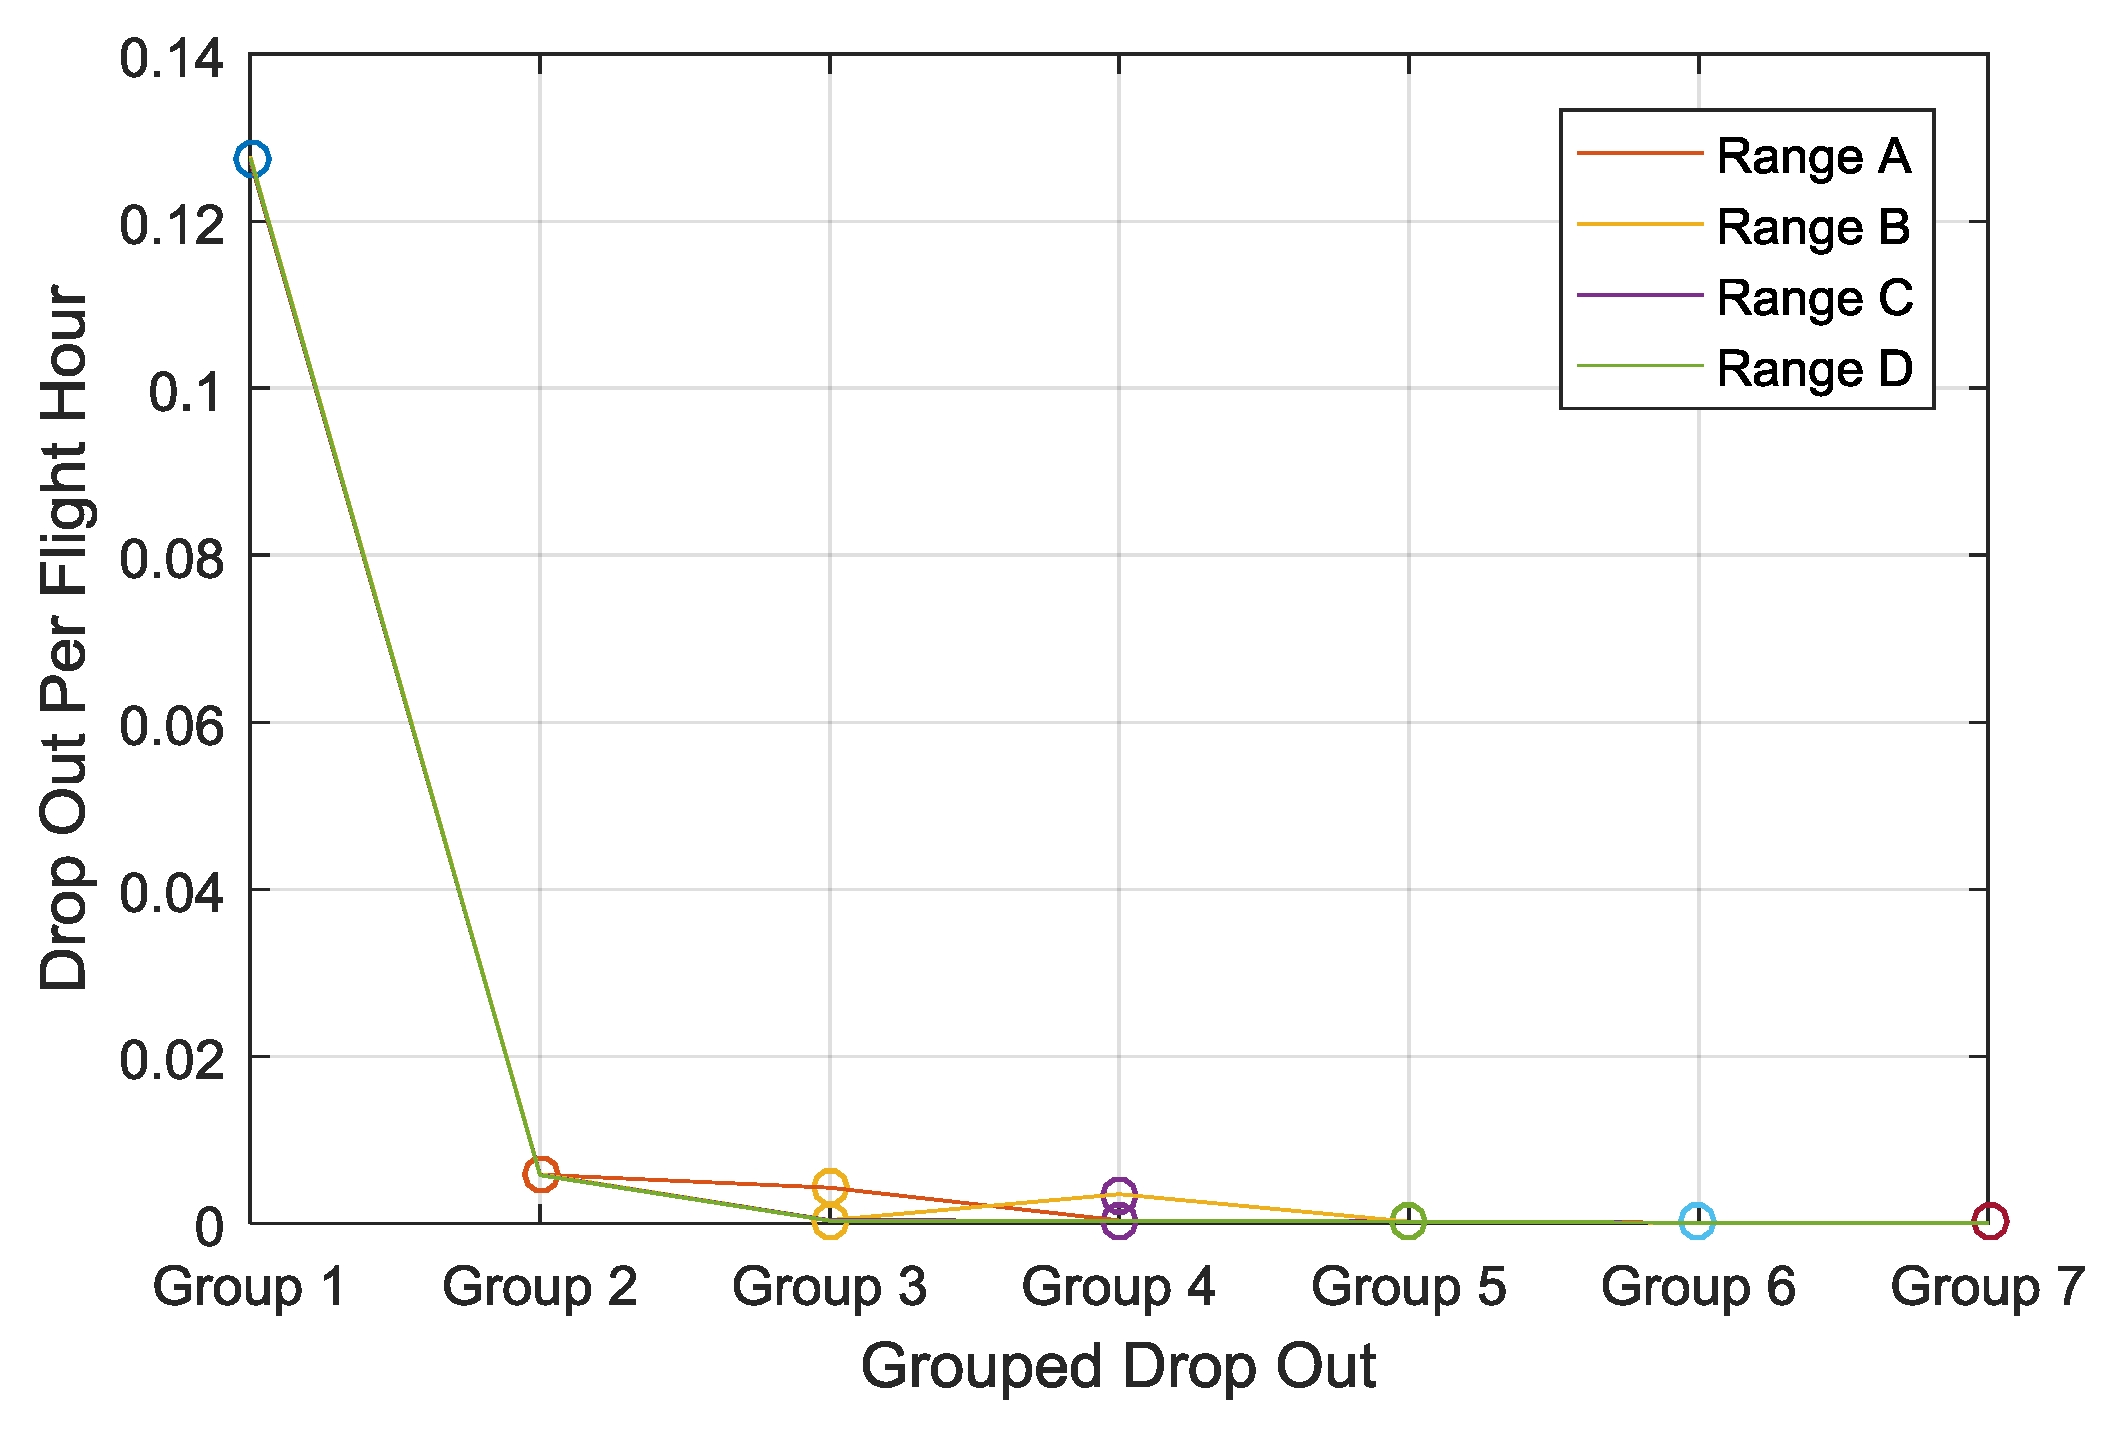
A similar statistical test was carried out to examine the effects of the range of the aircraft and the ground receiver. The range was calculated using the Haversine spherical formula [44]. The Haversine formula determines the great-circle distance between two points on a sphere given their longitudes and latitudes. The pass-through interface data were saved based on range, therefore, only aircraft within approximately 120 NM of the receiver were observed. This range is further divided into four categories based on the air traffic density. Table 9 lists the dropout frequency in a different group for each different range.
Figure 9 shows the grouped dropout vs. the dropout frequency per flight hour for four different ranges. A small change in frequency in Group 3 and Group 4 can be seen from the figure, however a statistical test is required to reveal the significance of this change. The different range was considered as the block or nuisance factor in the test.
From the Friedman test it is found that there is no significant difference between dropout frequency and range. It should be noted that the effective range of ADS-B is 200–250 N, however all the test data observed were within half of the maximum range. This might be a reason why the dropout frequency is not significantly different in the data studied. The test statistics are given in Table 10.
The p-value is much higher than 0.05, thus depicting no significance in the different ranges in the frequency of dropout.
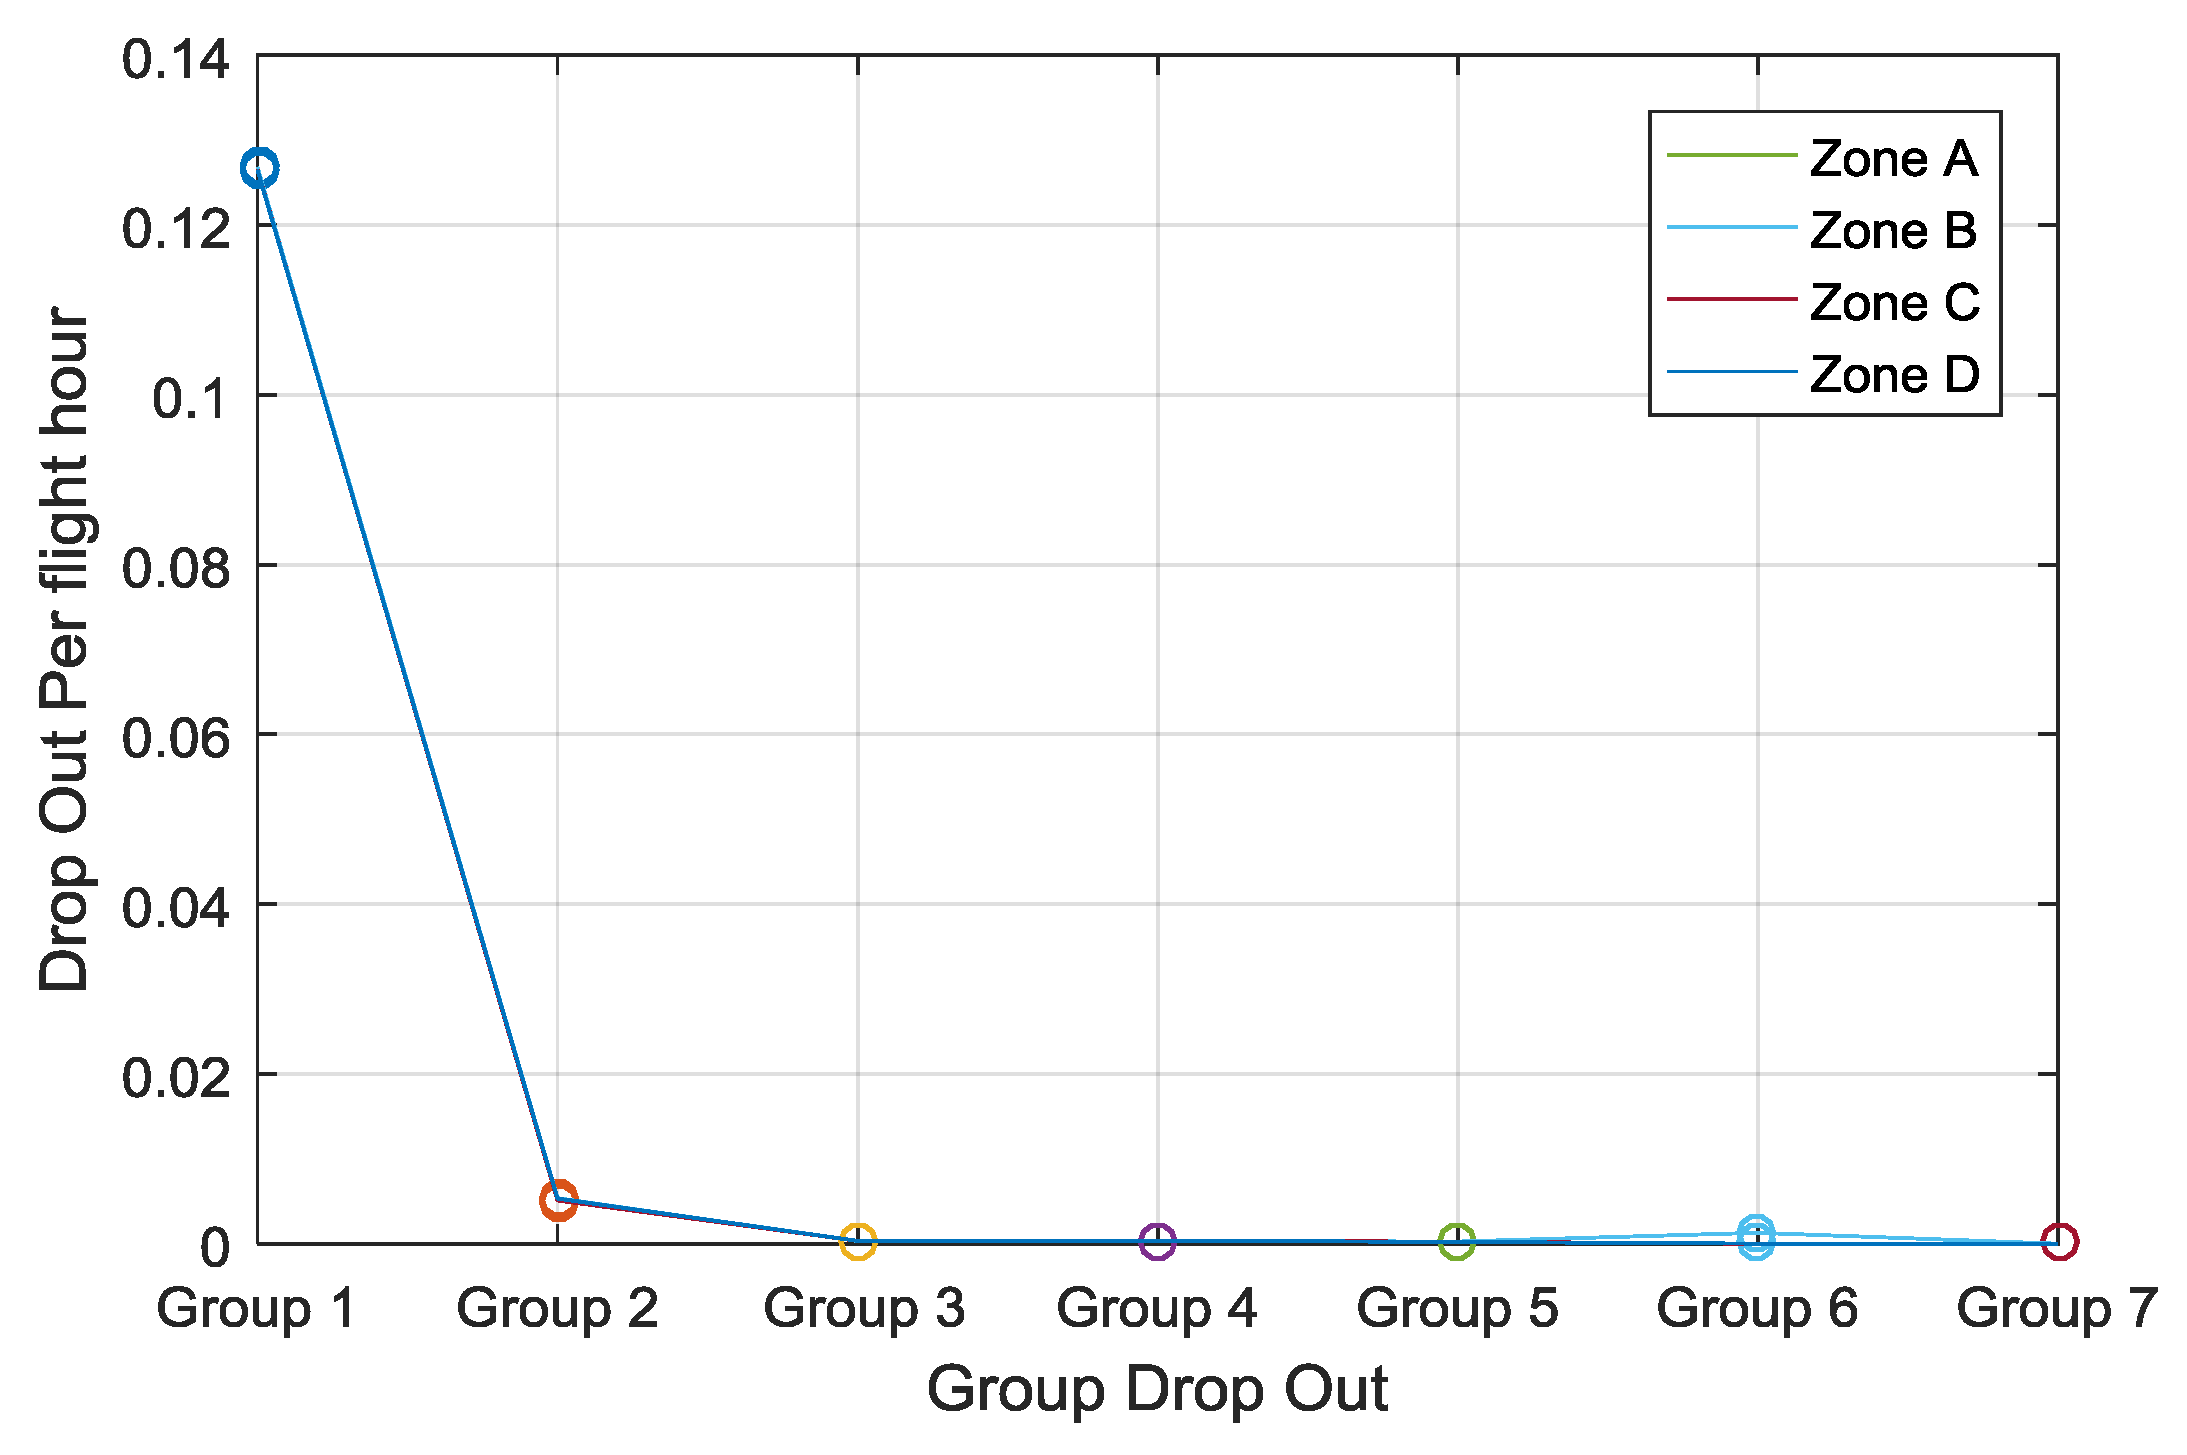
6.3. Effects of Heading
The effect of heading on dropout was also studied using a statistical significance test. Figure 10 provides a visual notion of the heading zone. The heading information is extracted from the velocity sign field: a north velocity sign implies a north–south direction, and an east velocity sign implies an east–west direction.
Table 11 presents the categorized dropout for the different zones. It should be noted that traffic density was not equal in the different zones. Most of the aircraft were found in Zone B and Zone D. This is most likely due to the approach path to the airport studied. The different heading was considered as the block and the dropout as the treatment. From a visual perspective from Table 11 and Figure 10, the frequency of dropout does not differ between the zones. However, that does not infer that heading does not have any impact on the dropout frequency. Like the previous analysis, the decision made is based on the hypothesis test. The test result is presented in Table 12.
The p-value of 0.93 (>0.05) concludes that the heading does not influence the dropout occurrence. The value of the ranks for the different zone are very comparable indicating the dropout occurrence is similar in any heading.
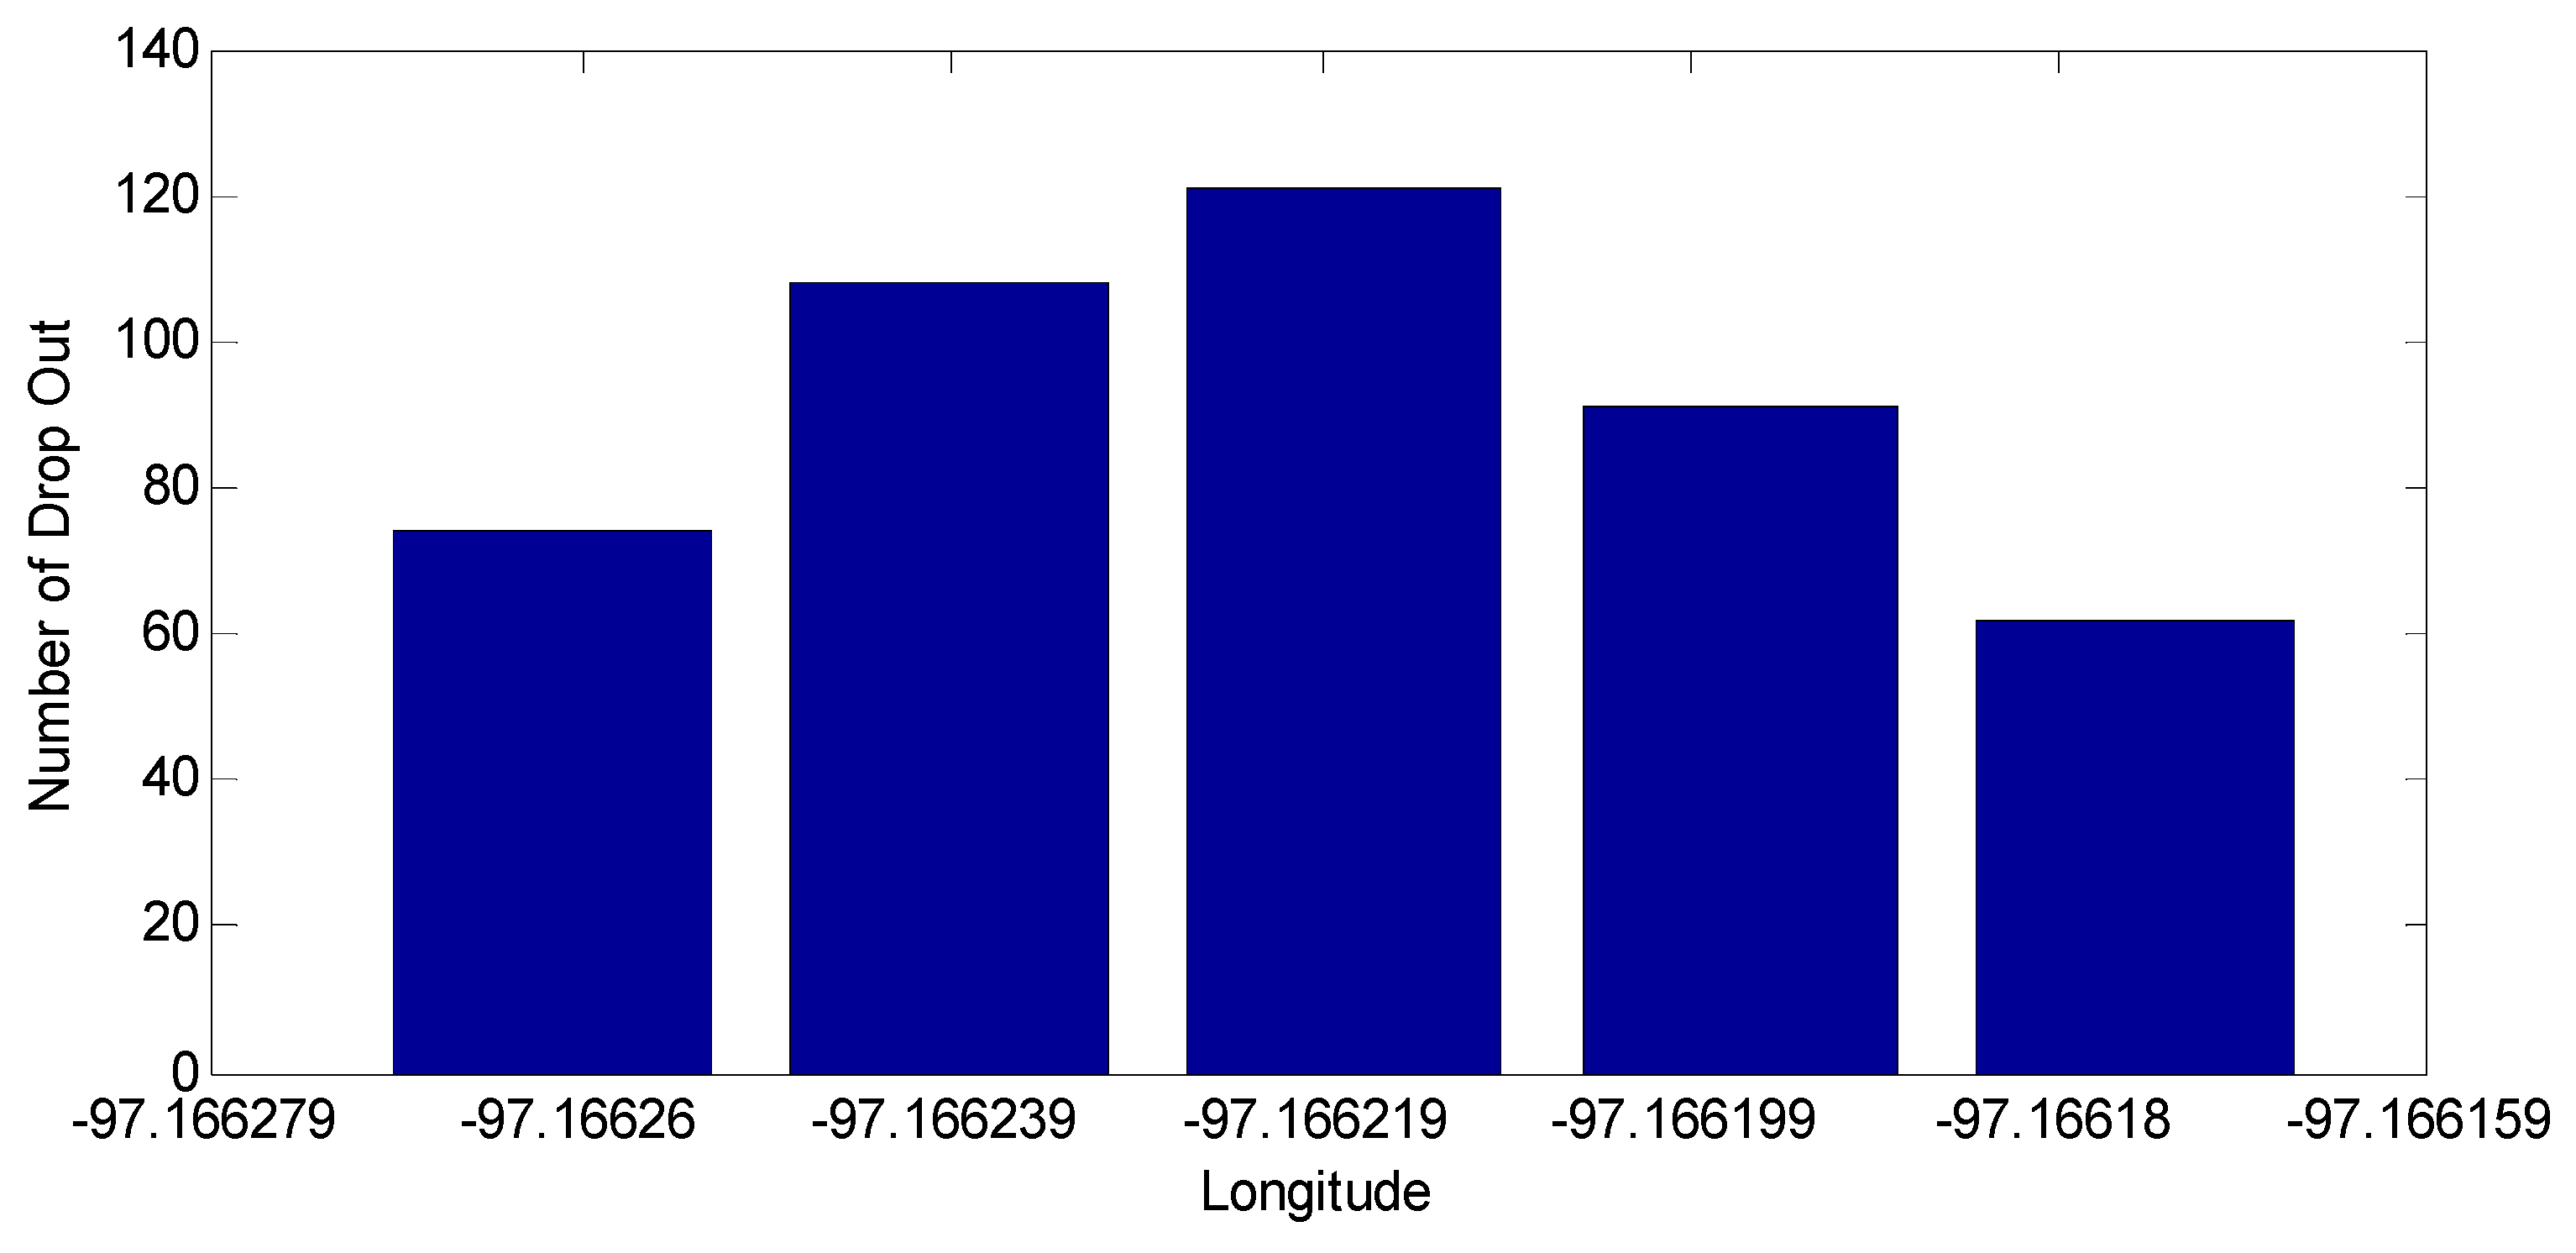
6.4. Dropout Mapping
The position (latitude, longitude) data where the higher duration of dropout occurred (Group 5–Group 7) and the position where they recovered were extracted for this analysis. The aim was to examine if a certain position is prone to ADS-B message loss. As position is discrete in nature, this was not categorized in groups, rather, it was checked if certain latitude or longitude data had more dropout occurrences. It is found that multiple numbers of dropout appeared at certain longitudes, while latitude did not show any of these characteristics. This refers to the fact that individual longitude lines are susceptible to the loss of the ADS-B signal. A histogram of the number of dropouts at certain longitudes is presented in Figure 11. The maximum number of dropouts at a certain longitude value was as high as 107.
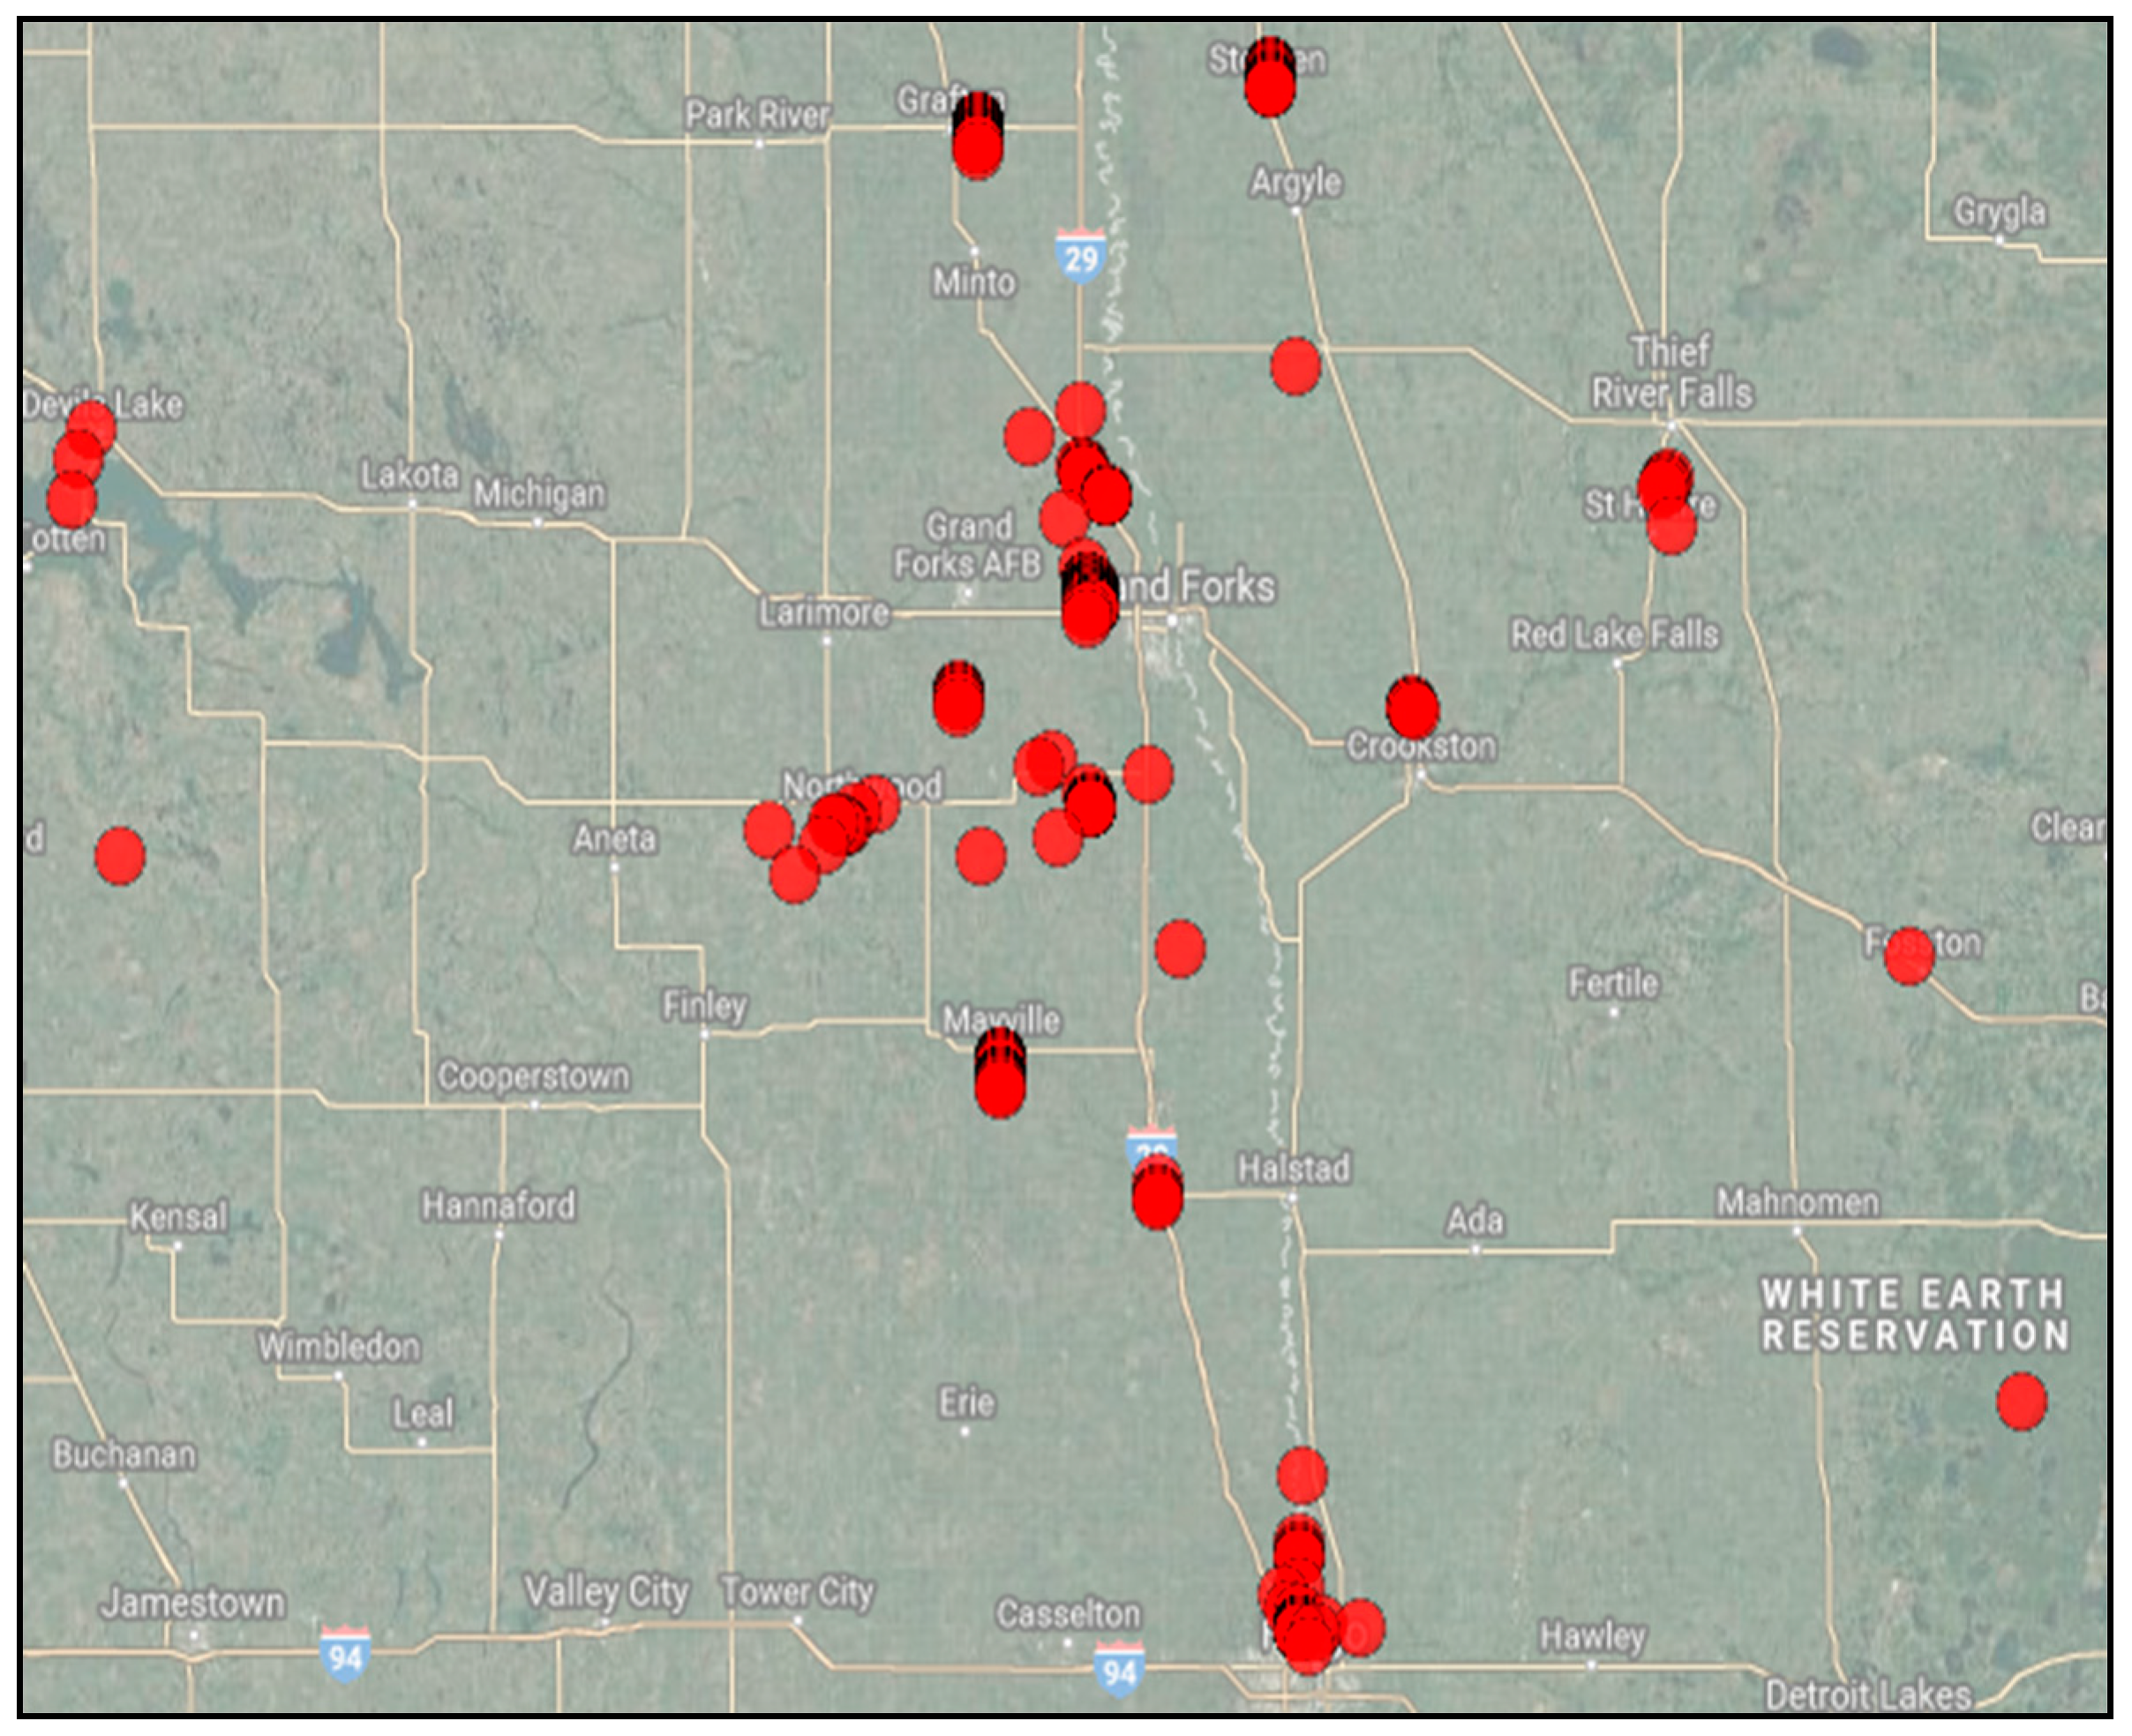
For a better understanding the longitude along with the latitude where the dropout occurred most were drawn on a map. Figure 12 shows the map where the red dot indicates the position of the most dropout occurrences.
It was further revealed that the clustered dropouts were due to the heavy traffic density at those locations. According to the FAA in 2015, the enroute traffic density was 17.1% and terminal traffic density was 82.9%, based on the statistics from 34 airports [45]. The airport regions have a higher traffic density than any other location, hence the clusters of red dots. An analysis on range effects already revealed the fact that the frequency of dropout per flight hour is similar within the ranges of the ground receiver studied. The map also indicates discrete positions also causing a higher duration of dropout. In the discrete random places other than near an airfield, the dropout occurred at an altitude higher than 6000 feet. No definite pattern or causes have been identified, but these might be due to the impact of several factors, such as path loss, transponder issues, onboard sensors, etc.
7. Conclusions and Future Work
The aim of this study was to understand the current state of ADS-B system surveillance and understand its vulnerabilities in future implementations. This study showed that UAT ADS-B systems exhibit anomalies similar to the 1090ES ADS-B system. The presence of the anomalies in ADS-B data point toward the ADS-B Out system not transmitting in compliance with FAR 91.227. As of May 2018, a total of 40,368 general aviation aircraft have installed ADS-B and 3648 of them have shown some form of data anomaly [46]. At present, 9.03% of general aviation aircraft have data anomalies or non-performing emitter issues. Although it is presently customary to check for the proper installation through UAT ADS-B flight data analysis, in the future the FAA is likely to move toward an enforcement process [47]. This study presents results using data-level statistics and not at the aircraft level. The most severe anomaly encountered was message loss or dropout that comprised of 32.49% of the overall messages. The main findings of the dropout analysis can be listed as follows:
- Altitude plays a key role in dropout frequency. The lower the altitude, the more chances that a dropout will occur in the ground receiver.
- Range does not have any significant role in the frequency of dropout given that the data received were within the effective range of the receiver.
- Aircraft heading is not a significant factor for dropout.
- Position may affect the dropout occurrence due to communication loss in certain locations.
From the statistical testing under different flight conditions and factors it is evident that altitude plays a vital role in dropout occurrence frequency. Higher altitude levels showed a longer duration of dropout. In some positions, the ADS-B signals were more frequently lost due to high traffic density. This occurred most frequently when the altitude is lower than 1000 feet. It should be noted that this study only made use of Ground Receiver Data, which may not provide a complete scenario of air-to-air data anomalies. The characteristics and the vulnerabilities might be less or more severe for air-to-air rather than air-to-ground. Hence, a data anomaly study using air-to-air received data is recommended. Additionally, this research found that there are differences in the anomalies in different flights, thus a periodic check of ADS-B system is recommended, especially if the detected anomalies appear on regular basis. One of the future extensions of this work may be comparison of the real time recorded ADS-B data and raw pass through data.
For full utilization of the congested airspace, understanding the anomalies of ADS-B and knowing how to handle these anomalies is crucial for its effective implementation. As ADS-B is envisioned to be a leading technology for future ATC operations provisions, regulations, and technical advancements must be made to address its current weaknesses and limitations.
Author Contributions
A.T. developed the UAT ADS-B data extraction algorithm and carried out the data analysis. W.S. directed and supervised the research work at all stages.
Acknowledgments
This work is partially funded by ASSURE, an alliance of universities across the United States by the Federal Aviation Administration for System Safety of UAS.
Conflicts of Interest
The authors declare no conflict of interest.
References
- Honeywell. Future Air Navigation System (FANS). Available online: https://www.theairlinepilots.com/forumarchive/quickref/fans.pdf (accessed on 3 May 2018).
- Next Generation Air Transportation System (NextGen)—NextGen Works. Available online: https://www.faa.gov/nextgen/works/ (accessed on 6 November 2017).
- RTCA. Minimum Aviation System Performance Standards for Automatic Dependent Surveillance Broadcast (ADS-B); RTCA: Washington, DC, USA, 2002. [Google Scholar]
- RTCA. RTCA-SC-228 Draft Detect and Avoid (DAA) Minimum Operational Performance Standards for Verification and Validation; RTCA: Washington, DC, USA, 2015. [Google Scholar]
- Federal Aviation Administration General Aviation ADS-B Rebate Program—Frequently Asked Questions. Available online: https://www.faa.gov/nextgen/equipadsb/rebate/faq/ (accessed on 18 May 2018).
- Aircraft Maintenance Division. Public ADS-B Performance Report (PAPR) User’s Guide Flight Standards Service Background—Public ADS-B Performance Report; Federal Aviation Administration: Washington, DC, USA, 2016; pp. 1–18.
- University of North Dakota History of the John D. Odegard School of Aerospace Science. Available online: http://aero.und.edu/About/History.aspx (accessed on 18 May 2018).
- ICAO. ADS-B Overview. Available online: https://www.icao.int/SAM/Documents/2017-ADSB/08%20FAA%20Briefing%20ADS_B%20Rules%20and%20Airspace%20(2).pdf (accessed on 10 June 2017).
- Kim, Y.; Jo, J.-Y.; Lee, S. A secure location verification method for ADS-B. In Proceedings of the 2016 IEEE/AIAA 35th Digital Avionics Systems Conference (DASC), Sacramento, CA, USA, 25–29 September 2016; IEEE: Piscataway, NJ, USA, 2016; pp. 1–10. [Google Scholar]
- Kovell, B.; Mellish, B.; Newman, T.; Kajopaiye, O. Comparative Analysis of ADS-B Verification Techniques. Available online: https://pdfs.semanticscholar.org/d0ea/b53a6b20bfca924b85fcfb0ee76bfde6d4ef.pdf (accessed on 7 June 2018).
- Sampigethaya, K. Visualization & assessment of ADS-B security for green ATM. In Proceedings of the 2010 IEEE/AIAA 29th Digital Avionics Systems Conference, Salt Lake City, UT, USA, 3–7 October 2010; IEEE: Piscataway, NJ, USA, 2010; pp. 3.A.3-1–3.A.3-16. [Google Scholar]
- Sampigethaya, K.; Poovendran, R.; Shetty, S.; Davis, T.; Royalty, C. Future E-Enabled Aircraft Communications and Security: The Next 20 Years and Beyond. Proc. IEEE 2011, 99, 2040–2055. [Google Scholar] [CrossRef]
- Wesson, K.D.; Humphreys, T.E.; Evans, B.L. Can Cryptography Secure Next Generation Air Traffic Surveillance? Available online: https://pdfs.semanticscholar.org/94be/9dccbb8708a2ca1444ae8b24afb128026762.pdf (accessed on 4 May 2018).
- Yang, H.; Huang, R.; Wang, X.; Deng, J.; Chen, R. EBAA: An efficient broadcast authentication scheme for ADS-B communication based on IBS-MR. Chin. J. Aeronaut. 2014, 27, 688–696. [Google Scholar] [CrossRef]
- Lee, S.-H.; Kim, Y.-K.; Han, J.-W.; Lee, D.-G. Protection Method for Data Communication between ADS-B Sensor and Next-Generation Air Traffic Control Systems. Information 2014, 5, 622–633. [Google Scholar] [CrossRef] [Green Version]
- Kacem, T.; Barreto, A.; Wijesekera, D.; Costa, P. ADS-Bsec: A novel framework to secure ADS-B. ICT Express 2017, 3, 160–163. [Google Scholar] [CrossRef]
- Schäfer, M.; Lenders, V.; Martinovic, I. Experimental Analysis of Attacks on Next Generation Air Traffic Communication. Appl. Cryptogr. Netw. Secur. 2013, 7954 LNCS, 253–271. [Google Scholar]
- Manesh, M.R.; Kaabouch, N. Analysis of vulnerabilities, attacks, countermeasures and overall risk of the Automatic Dependent Surveillance-Broadcast (ADS-B) system. Int. J. Crit. Infrastruct. Prot. 2017. [Google Scholar] [CrossRef]
- Strohmeier, M.; Schäfer, M.; Pinheiro, R.; Lenders, V.; Martinovic, I. On Perception and Reality in Wireless Air Traffic Communications Security. IEEE Trans. Intell. Transp. Syst. 2017, 18, 1338–1357. [Google Scholar] [CrossRef]
- Costin, A. Ghost in the Air(Traffic): On Insecurity of ADS-B Protocol and Practical Attacks on ADS-B Devices. Available online: https://www.semanticscholar.org/paper/Ghost-in-the-Air(Traffic)%3A-On-insecurity-of-ADS-B-Costin-Francillon/07bba7cf28015bdf78971db708a1bd5c59f7e242?tab=citations (accessed on 2 November 2017).
- Zhang, J.; Liu, W.; Zhu, Y. Study of ADS-B data evaluation. Chin. J. Aeronaut. 2011, 24, 461–466. [Google Scholar] [CrossRef]
- Li, T.; Sun, Q.; Li, J. A Research on the Applicability of ADS-B Data Links in Near Space Environment. In Proceedings of the International Conference on Connected Vehicles and Expo, Beijing, China, 12–16 December 2012; pp. 1–5. [Google Scholar]
- International Civil Aviation Organizations. Use of Barometric Altitude and Geometric Altitude Information in ADS-B Message for ATC Application. Available online: https://www.icao.int/APAC/Meetings/2012_SEA_BOB_ADSB_WG8/WP06_HKG%20AI.%205%20-%20Use%20of%20Barometric%20Altitude.pdf (accessed on 7 June 2018).
- Taib, N.A.; Ali, B.S. An Analysis of Geometric Altitude Data in ADS-B Messages. In Proceedings of the 2016 International Technical Meeting of the Institute of Navigation, Monterey, CA, USA, 25–28 January 2016. [Google Scholar]
- Ali, B.S.; Ochieng, W.Y.; Zainudin, R. An analysis and model for Automatic Dependent Surveillance Broadcast (ADS-B) continuity. GPS Solut. 2017, 1–14. [Google Scholar] [CrossRef]
- Ali, B.S. A Safety Assessment Framework for Automatic Dependent Surveillance Broadcast (ADS-B) and its Potential Impact on Aviation Safety. Ph.D. Thesis, Imperial College London, London, UK, 2013. [Google Scholar]
- Ali, B.S.; Ochieng, W.Y.; Majumdar, A. ADS-B: Probabilistic Safety Assessment. J. Navig. 2017, 70, 887–906. [Google Scholar] [CrossRef]
- Federal Aviation Administration. Houston/I90 TRACON Automatic Dependent Surveillance—Broadcast (ADS-B) Flight Inspection Analysis and Coverage Report Date Flight Check Conducted. Available online: https://www.faa.gov/air_traffic/flight_info/avn/media/documents/I90%20Flight%20Check%20Analysis%20Report%20Example.pdf (accessed on 10 April 2017).
- Martensson, J.; Rekkas, C. Airborne Traffic Situational Awareness: Flight Trials of the in Trail Procedure Project. Air Traffic Control Quart. 2009, 17, 39–61. [Google Scholar] [CrossRef]
- Yang, A.; Tan, X.; Baek, J.; Wong, D.S. A New ADS-B Authentication Framework Based on Efficient Hierarchical Identity-Based Signature with Batch Verification. IEEE Trans. Serv. Comput. 2017, 10, 165–175. [Google Scholar] [CrossRef]
- Syd Ali, B.; Schuster, W.; Ochieng, W.; Majumdar, A. Analysis of anomalies in ADS-B and its GPS data. GPS Solut. 2016, 20, 429–438. [Google Scholar] [CrossRef]
- Strohmeier, M.; Schafer, M.; Lenders, V.; Martinovic, I. Realities and challenges of NextGen air traffic management: The case of ADS-B. IEEE Commun. Mag. 2014, 52, 111–118. [Google Scholar] [CrossRef]
- Snyder, K. UAS Surveillance Criticality Final Report; Federal Aviation Administration: Washington, DC, USA, 2016.
- GDL® 90, Garmin. Available online: https://buy.garmin.com/en-US/US/p/6436 (accessed on 24 October 2017).
- Garmin. GDL 90 Data Interface Specification. Available online: https://www.faa.gov/nextgen/programs/adsb/Archival/media/GDL90_Public_ICD_RevA.PDF (accessed on 15 February 2017).
- RTCA. Minimum Operational Performance Standard for Universal Access Transceiver (UAT) Automatic Dependent Surveillence Broadcast (ADS-B); RTCA: Washington, DC, USA, 2009. [Google Scholar]
- International Civil Aviation Organization. Assessment of ADS-B and Multilateration Surveillance to Support Air Traffic Services and Guidelines for Implementation Notice to Users. Available online: http://atm.airport.ir/documents/799481/2253088/Cir+326++Assessment+of+ADS-B+and+Multilateration+Surveillance.pdf/f15083ec-3c4f-48fe-b6c4-0d138c3e72f8?version=1.0&previewFileIndex= (accessed on 7 June 2018).
- LII/Legal Information Institute. 14 CFR 91.227—Automatic Dependent Surveillance-Broadcast (ADS-B) Out Equipment Performance Requirements. Available online: https://www.law.cornell.edu/cfr/text/14/91.227?qt-ecfrmaster=0#qt-ecfrmaster (accessed on 21 May 2018).
- RTCA. Minimum Aviation System Performance Standards (MASPS) for Flight Information Services-Broadcast (FIS-B) Data Link; RTCA: Washington, DC, USA, 2004. [Google Scholar]
- Federal Aviation Administration. Advisory Circular. Available online: https://www.icao.int/safety/pbn/Documentation/FAA/FAA%20AC%2090-100A%20U.S.%20Terminal%20and%20En%20Route%20Area%20Navigation%20(RNAV)%20Operations.pdf (accessed on 7 June 2018).
- Shapiro, S.S.; Wilk, M.B. An Analysis of Variance Test for Normality (Complete Samples). Biometrika 1965, 52, 591–611. [Google Scholar] [CrossRef]
- Laerd Statistics. Friedman Test in SPSS Statistics—How to Run the Procedure, Understand the Output Using a Relevant Example. Available online: https://statistics.laerd.com/spss-tutorials/friedman-test-using-spss-statistics.php (accessed on 3 December 2017).
- Minitab Statistical Software—Minitab. Available online: http://www.minitab.com/en-us/products/minitab/ (accessed on 17 November 2017).
- Van Brummelen, G. Heavenly Mathematics: The Forgotten Art of Spherical Trigonometry; Princeton University Press: Princeton, NJ, USA, 2013; ISBN 9780691148922. [Google Scholar]
- European Commission. Comparison of Air Traffic Management-Related Operational Performance: U.S./Europe 2015; European Commission: Brussels, Belgium, 2016. [Google Scholar]
- Federal Aviation Administration Current Equipage Levels. Available online: https://www.faa.gov/nextgen/equipadsb/installation/current_equipage_levels/ (accessed on 22 May 2018).
- Mike Collins ADS-B: What Is an NPE?—AOPA. Available online: https://www.aopa.org/news-and-media/all-news/2017/march/pilot/adsb-npe (accessed on 22 May 2018).
Figure 1.
GDL-90 data decode algorithm.

Figure 2.
Data sorting and filtering flow chart depicting the steps used to filter and sort the data.
Figure 2.
Data sorting and filtering flow chart depicting the steps used to filter and sort the data.

Figure 3.
Multiple dropout in a flight. Latitude (in degree) data is used to illustrate the data dropout for a 70-min flight.
Figure 3.
Multiple dropout in a flight. Latitude (in degree) data is used to illustrate the data dropout for a 70-min flight.

Figure 4.
Jump in latitude (in degree) data from a continuous nominal value.

Figure 5.
Data integrity distribution bar graph, no data were found having maximum integrity. The dashed line distinguishes the precision and non-precision range.
Figure 5.
Data integrity distribution bar graph, no data were found having maximum integrity. The dashed line distinguishes the precision and non-precision range.

Figure 6.
Altitude discrepancy in the climbing phase of flight. Blue rectangles describe the barometric altitude, and red circles describe the geometric altitude.
Figure 6.
Altitude discrepancy in the climbing phase of flight. Blue rectangles describe the barometric altitude, and red circles describe the geometric altitude.

Figure 7.
Histogram of the categorized update rate.

Figure 8.
Grouped dropout vs. dropout per flight hour for four different flight level.

Figure 9.
Grouped dropout vs. dropout per flight hour at different ranges.

Figure 10.
Grouped dropout vs. dropout per flight hour in different zones.

Figure 11.
Histogram of dropout at certain longitudes.

Figure 12.
Location of the dropout in Google Maps.


Table 1.
GDL-90 message summary.
| Message Name | Heartbeat | Initialization | Uplink Data | Height above Terrain | Ownship Geometric Altitude | Traffic Report | Basic Report | Long Report |
|---|---|---|---|---|---|---|---|---|
| Availability (Real Time/Archived) | Both | Both | Both | Real time | Both | Real time | Archived | Archived |
Table 2.
Message information and size.
| Basic UAT Message | Long UAT Message | ||||
|---|---|---|---|---|---|
| Byte # | Name | Size | Byte # | Name | Size |
| 1 | Message ID | 1 | 1 | Message ID | 1 |
| 2–4 | Time of Reception | 3 | 2–4 | Time of Reception | 3 |
| 5–22 | Basic Payload | 18 | 5–38 | Long Payload | 34 |
| Total Length | 22 | Total Length | 38 | ||
Table 3.
Payload composition.
| Type Code | ADS-B Message Payload Byte Number | |||
|---|---|---|---|---|
| 1–4 | 5–17 | 18–29 | 30–34 | |
| 0 | Header, HDR | State vector, SV | Not present in basic message | |
| 1 | Header, HDR | State vector, SV | Mode status, MS | Auxiliary state vector, AUX SV |
Table 4.
Description of the message fields.
| Data | Description |
|---|---|
| Address Qualifier | Indicate what the 24-bit “ADDRESS” field represents. If the address qualifier value is 0, the message is considered from an ICAO target. |
| Address | Unique ICAO assigned address used to distinguish aircraft |
| Latitude, Longitude | Two-dimensional position |
| Primary Altitude | Altitude from barometer in feet |
| Secondary Altitude | Altitude from GPS sensor in feet |
| NICp | Navigation Integrity Category for the position, determine whether the reported position has an acceptable level of integrity for the intended use. |
| NACp | Navigation Accuracy Category for Position determine if the reported State Vector has sufficient position accuracy for the intended use |
| Aircraft State | Airborne or on ground condition |
| Vertical Velocity | Velocity in upward/downward in knots |
| Vertical Velocity Sign | Sign indicating the direction of vertical velocity field |
| East Velocity | Velocity in east/west direction in knots |
| East Velocity Sign | Sign indicating the direction of east velocity field |
| North Velocity | Velocity in north/south direction |
| North Velocity Sign | Sign indicating the direction of north velocity field in knots |
ADS-B messages encode velocity as knots, distance as NM, and altitude as feet; these are standard. Units set by FAA and used by ATC for separation. This work adheres to units set by the FAA for UAT ADS-B.
Table 5.
Data anomaly summary.
| Checks/Assessment | Anomalies | % Failure |
|---|---|---|
| FCS Calculation and Authentication | Message Loss | 13% of the messages loss prior parsing |
| Payload Check | Missing Payloads | 0.40% of the messages missed one payload |
| Update Rate | Dropout | 32.49% of the messages exhibits dropout |
| Accuracy and Integrity Check | Non-precision Data | 3% of the position data are of non-precision |
| Kinematic Check | Data Jump | 0.67% of the participating aircraft showed data jump |
| Kinematic Check | Altitude Deviation | 93% of the participating aircraft showed altitude deviation |
Table 6.
Update rate categorization.
| Category | Duration | Times Occurred, Frequency | % | Remarks |
|---|---|---|---|---|
| Group 0 | Within 3 s | 4161116 | 67.51 | Not Dropout |
| Group 1 | 3 s to 5 s | 1898598 | 30.80 | Dropout |
| Group 2 | 5 s to 15 s | 86876 | 1.42 | Dropout |
| Group 3 | 15 s to 30 s | 6175 | 0.10 | Dropout |
| Group 4 | 30 s to 60 s | 5223 | 0.08 | Dropout |
| Group 5 | 60 s 120 s | 3330 | 0.05 | Dropout |
| Group 6 | 120 s to 300 s | 1365 | 0.03 | Dropout |
| Group 7 | More than 300 s to less than 600 s | 451 | 0.01 | Dropout |
Table 7.
Frequency of categorized dropout in different flight level.
| Altitude | Frequency of Occurrence per Flight Hour | |||||||
|---|---|---|---|---|---|---|---|---|
| Group 1 | Group 2 | Group 3 | Group 4 | Group 5 | Group 6 | Group 7 | ||
| Less than 4000 feet | FL 1 | 13.21 × 10⁻² | 13.21 × 10⁻² | 7.11 × 10⁻⁴ | 2.54 × 10⁻⁴ | 1.12× 10⁻⁴ | 4.09 × 10⁻⁵ | 1.88 × 10⁻⁵ |
| 4000–8000 feet | FL 2 | 13.26 × 10⁻² | 7.44 × 10⁻³ | 6.68 × 10⁻⁴ | 2.38 × 10⁻⁴ | 1.04 × 10⁻⁴ | 3.77 × 10⁻⁵ | 1.84 × 10⁻⁵ |
| 8000–12,000 feet | FL 3 | 12.65 × 10⁻² | 8.48 × 10⁻³ | 13.84 × 10⁻⁴ | 7.06 × 10⁻⁴ | 2.79 × 10⁻⁴ | 7.43 × 10⁻⁵ | 9.29 × 10⁻⁶ |
| 12,000–18,000 feet | FL 4 | 9.04 × 10⁻² | 17.19 × 10⁻³ | 31.64 × 10⁻⁴ | 8.97 × 10⁻⁴ | 4.75 × 10⁻⁴ | 6.33 × 10⁻⁴ | 5.27 × 10⁻⁵ |
Table 8.
Test Statistics for different altitude levels.
| Fight Level Group | Rank | Test Statistic | ||
|---|---|---|---|---|
| Chi-Square | df | p Value | ||
| FL 1 | 2.28 | 23.68 | 27 | 0.03 < 0.05 |
| FL 2 | 1.57 | |||
| FL 3 | 2.57 | |||
| FL 4 | 3.57 | |||
Table 9.
Frequency of categorized dropout at different ranges.
| Range | Frequency of Occurrence per Flight Hour | ||||||
|---|---|---|---|---|---|---|---|
| Group 1 | Group 2 | Group 3 | Group 4 | Group 5 | Group 6 | Group 7 | |
| Within 20 NM, A | 12.72 × 10⁻² | 5.83 × 10⁻³ | 4.28 × 10⁻³ | 3.53 × 10⁻⁴ | 2.29 × 10⁻⁴ | 9.55 × 10⁻⁵ | 3.04 × 10⁻⁵ |
| 20–50 NM, B | 12.77 × 10⁻² | 5.88 × 10⁻³ | 3.93 × 10⁻⁴ | 3.50 × 10⁻³ | 2.11 × 10⁻⁴ | 7.99 × 10⁻⁵ | 2.81 × 10⁻⁵ |
| 50–80 NM, C | 12.74 × 10⁻² | 5.79 × 10⁻³ | 3.78 × 10⁻³ | 3.38 × 10⁻⁴ | 2.24 × 10⁻⁴ | 8.35 × 10⁻³ | 3.25 × 10⁻⁵ |
| 80–120 NM, D | 12.75 × 10⁻² | 5.77 × 10⁻³ | 3.30 × 10⁻⁴ | 3.31 × 10⁻⁴ | 2.17 × 10⁻⁴ | 8.11 × 10⁻⁵ | 3.12 × 10⁻⁵ |
Table 10.
Friedman test statistics for ranges.
| Range Group | Rank | Test Statistic | ||
|---|---|---|---|---|
| Chi-Square | df | p Value | ||
| Range A | 2.85 | 2.49 | 27 | 0.47 > 0.05 |
| Range B | 2.57 | |||
| Range C | 2.71 | |||
| Range D | 1.88 | |||
Table 11.
Frequency of categorized dropout as different ranges.
| Zone | Frequency of Occurrence per Flight Hour | ||||||
|---|---|---|---|---|---|---|---|
| Group 1 | Group 2 | Group 3 | Group 4 | Group 5 | Group 6 | Group 7 | |
| Zone A | 12.67 × 10⁻² | 5.38 × 10⁻³ | 3.52 × 10⁻⁴ | 3.59 × 10⁻⁴ | 2.72 × 10⁻⁴ | 1.31 × 10⁻³ | 2.23 × 10⁻⁵ |
| Zone B | 12.63 × 10⁻² | 5.10 × 10⁻³ | 3.85 × 10⁻⁴ | 3.00 × 10⁻⁴ | 1.89 × 10⁻⁴ | 2.33 × 10⁻⁵ | 3.75 × 10⁻⁵ |
| Zone C | 12.64 × 10⁻² | 5.12 × 10⁻³ | 3.57 × 10⁻⁴ | 3.63 × 10⁻⁴ | 2.68 × 10⁻⁴ | 1.32 × 10⁻⁵ | 2.42 × 10⁻⁵ |
| Zone D | 12.64 × 10⁻² | 5.34 × 10⁻³ | 3.56 × 10⁻⁴ | 3.87 × 10⁻⁴ | 2.31 × 10⁻⁴ | 3.26 × 10⁻⁵ | 2.73 × 10⁻⁵ |
Table 12.
Friedman test statistics for heading effects.
| Fight Level Group | Rank | Test Statistic | ||
|---|---|---|---|---|
| χ-Square | df | p Value | ||
| Zone A | 2.71 | 0.4286 | 3 | 0.93 > 0.05 |
| Zone B | 2.57 | |||
| Zone C | 2.28 | |||
| Zone D | 2.42 | |||
© 2018 by the authors. Licensee MDPI, Basel, Switzerland. This article is an open access article distributed under the terms and conditions of the Creative Commons Attribution (CC BY) license (http://creativecommons.org/licenses/by/4.0/).
Share and Cite
MDPI and ACS Style
Tabassum, A.; Semke, W. UAT ADS-B Data Anomalies and the Effect of Flight Parameters on Dropout Occurrences. Data 2018, 3, 19. https://doi.org/10.3390/data3020019
AMA Style
Tabassum A, Semke W. UAT ADS-B Data Anomalies and the Effect of Flight Parameters on Dropout Occurrences. Data. 2018; 3(2):19. https://doi.org/10.3390/data3020019
Chicago/Turabian StyleTabassum, Asma, and William Semke. 2018. "UAT ADS-B Data Anomalies and the Effect of Flight Parameters on Dropout Occurrences" Data 3, no. 2: 19. https://doi.org/10.3390/data3020019