Interactive Data Framework and User Interface for Wisconsin’s Oversize-Overweight Vehicle Permits


1
Department of Software Engineering, Jordan University of Science and Technology, Irbid 22110, Jordan
2
Department of Civil and Environmental Engineering, University of Wisconsin-Milwaukee, Milwaukee, WI 53211, USA
*
Author to whom correspondence should be addressed.
†
Former Address: Department of Computer Science, University of Wisconsin-Milwaukee, Milwaukee, WI 53211, USA.
Data 2018, 3(2), 20; https://doi.org/10.3390/data3020020
Submission received: 13 April 2018
/
Revised: 7 May 2018
/
Accepted: 13 June 2018
/
Published: 15 June 2018
Abstract
:With continuing increases in the number of Oversize-Overweight (OSOW) vehicle permits issued in recent years, the management and analysis of OSOW permit data is becoming more inefficient and time-consuming. Large quantities of archived OSOW permit data are held by Departments of Transportation (DOTs) across the United States, and manual extraction and analysis of this data requires significant effort. In this paper, the authors present a new framework for analyzing Wisconsin’s historic OSOW permit program data. This framework provides an interactive, web-based interface to query the OSOW permit data, link OSOW records to geospatial data features, and dynamically visualize query results. The web-based interface offers scalability and broad accessibility to the data across different DOT divisions, and use cases. Furthermore, a user survey and heuristic evaluation of the interface demonstrate the project’s utility, and identify goals for future system development.
1. Introduction
This paper explores the current state of Oversize-Overweight (OSOW) permit vehicle data management systems, as well as the means by which users interact with OSOW permit program data. OSOW permits are issued by states to allow vehicles exceeding size and weight limits to operate on public roads. Recent years have seen the development of OSOW permit data systems integrated with Geographic Information Systems (GIS) to some degree [1,2]. The primary goal of OSOW enterprise data management systems is to facilitate permit issuance to freight carriers; however, historical data is often not available in a format that can be easily analyzed or displayed geospatially. This presents a problem due to the increased interest in recent years in understanding the history, effects, and future of OSOW permit programs on the economy and the physical highway infrastructure [3,4,5,6,7].
Various transportation infrastructure studies and applications were developed to serve different purposes regarding the analysis of OSOW vehicle routing. Examples include applications and tools developed to help the transportation industry and traveling public in future planning and route selection [8,9], studies to investigate OSOW trucks’ impact on infrastructure deterioration [10], investigations of OSOW truck permit fees/cost versus infrastructure (pavement/bridge) damage [11,12,13,14,15,16,17], asset management studies including evaluations of the connectivity/interdependency between infrastructure quality/capacity and economy health/growth [18,19,20], and studies of the OSOW impact on economy and infrastructure in terms of commerce, safety and congestion, and pavement/bridge damage [21].
The goal of this paper is to understand how people interact with OSOW data user interfaces in their current form, understand how civil engineers and transportation professionals perceive current OSOW data management system designs, consolidate user feedback into a set of requirements, prototype alternate OSOW user interface designs, and solicit feedback about the prototypes from potential users.
A secondary goal of building this interactive framework is to apply the principles of multi-staged interaction design. Interaction design consists of four main activities: establishing requirements, designing alternatives, prototyping, and evaluating the new design with the user base. Consequently, in this paper, the authors explore the evaluation of human interaction behaviors for specific types of OSOW data user interfaces, and suggest various changes in OSOW data user interface design to increase user satisfaction.
2. OSOW Data Framework Design Phases
2.1. Phase 1
The initial phase of the project focused on understanding the effects of OSOW vehicles on pavements in Wisconsin by mapping a long-term dataset of single-trip OSOW truck permits, identifying highway segments of interest, and analyzing pavement performance using the AASHTOWare Pavement ME Design [22].
The OSOW permit data and analyses described in this paper stem from previous research conducted in Wisconsin relating to the mapping of OSOW permits for the development of axle load spectra (ALS) data for pavement design and analysis [23,24,25]. OSOW permit data from the Wisconsin Department of Transportation (WisDOT) was only available in text-based route descriptions. However, the data inputs of the AASHTOWare Pavement ME Design software require site-specific ALS, which requires the ability to identify the precise set of OSOW vehicles that travelled along a specific highway segment. Therefore, a significant portion of this phase was devoted to mapping the OSOW permits dataset. Because route information from WisDOT’s OSOW permit management system was only available as textual route descriptions, scripts and algorithms were developed using Visual Basic for Applications (VBA) scripting and ArcGIS software to map the permit routes onto a digital map of Wisconsin’s highway network. A custom network topology was built to facilitate the mapping of the text-based permit routes to the geospatial highway network. Route text parsing routines in VBA extracted the necessary data from the route descriptions, and a depth-first network search algorithm traversed each permit’s route based on the route text. Output data included tables linking each individual OSOW permit to the specific highway segments—an average length of ~1 mile (~1.61 km)—each permit travelled on, as well as linking each OSOW permit to the specific intersections it travelled through. This dataset provides the foundation for the user interface and query capabilities described in this paper.
The authors have written this paper to be accessible to readers unfamiliar with OSOW permit programs, as well as OSOW permit specialists and researchers. However, constraints necessitate the omission of some background details regarding OSOW programs, the dataset, and the route processing algorithms. Users are encouraged to consult Titi et al. [23], Latifi [24], and Coley et al. [25] for further information.
2.2. Phase 2
Following the development of the geospatially enabled OSOW permits database, the project’s second phase consisted of the collection of design requirements and the development of an application framework and user interface (UI) to query and display the data from Phase 1. This was accomplished by determining the user base for this data, soliciting information from end users via semi-structured interviews and field studies, identifying the workflows and use cases involved when interacting with an OSOW data analysis system, and generating requirements based on the user feedback and analysis of use cases. These initial evaluations were used to develop a prototype UI, which was presented to a selection of end users for initial testing and evaluation. This phase also emphasized the consideration of alternative OSOW UIs based on the user requirements.
In this paper, the authors provide an in-depth discussion of how the prototype framework version was realized. This includes an explanation of the prototype framework with reference to various design principles, an overview of the user interaction methods the new design supports, and a discussion of the added functionalities provided by the new design as compared with previous methods of accessing historic OSOW permit data.
2.3. Phase 3
The final phase of the project consisted of the deployment, evaluation, and ongoing improvement of the new framework. Following a testing period, the framework was deployed on a server and made accessible to the full final set of end users through its web UI. The authors then evaluated the framework via two evaluation methods: questionnaires and heuristic evaluations. The user feedback and insights gained from this evaluation process informed design changes and improvements, and additional features were deployed via an agile software development process.
3. Design Theory and Interface Goals
In this section the authors discuss the design and development of the prototype OSOW query framework and interface in detail. The OSOW UI system was developed to consist of several different interface components, each of which will provide distinct functionalities to users. In the initial conceptualization phase of the design process, the authors identified four principal use case scenarios to be implemented:
- Manage system users
- Import processed data via an automated migration capability
- Query data based on vehicle characteristics
- Query data based on specific highway segments, intersections, or turning movements.
The authors engaged in preliminary discussions with a small group of end users at WisDOT to establish this core set of requirements to guide the agile development of the prototype interface. The authors combined information gleaned in these discussions with various design principles and guidelines to identify the specific interaction styles the new UI design would support. The following subsections provide more detail about each functionality implemented in the prototype UI, with consideration of the workflow and usability improvements over previous methods implemented at WisDOT to conduct OSOW permit program analysis in the absence of a data analysis framework.
3.1. Managing System Users
An administrator page should contain the ability to add, update, and delete user accounts, as well as to assign users to a specific User Group. User Groups can be added or created on the administrator page based on organizational and tracking needs. Access to the administrator page is restricted to predefined administrator accounts.
3.2. Importing Processed Data
A data migration page should provide the ability to transfer the preprocessed permit results from a local Access database into the SQL Server database. This page allows users to upload a database containing additional permit records to be migrated to the SQL server, which are then uploaded and inserted as a background process. The page also shows the data uploads history log. This page is only available to predefined administrator accounts.
3.3. Querying Permits Based on Vehicle Characteristics
For any query conducted on the OSOW permits database, the query results should be able to be filtered and restricted based on multiple characteristics of the permit records, such as issued date, vehicle dimensions and weight, and the carrier ID of the party the permit was issued to. This functionality is included on both the Query Permits page and the Query Turning Movements page.
3.4. Querying Permits Geospatially
Two separate functionalities are required to query the OSOW permit vehicles based on the geospatial features they travelled on, in tandem with querying records based on vehicle and permit characteristics. The primary Query Permits page allows users to click on a specific highway segment—or sequence of segments—on the dynamic map, which can be used to return permit results showing only permits that travelled on that segment. Similarly, the Query Turning Movements page provides users the ability to query OSOW permit vehicles that travelled through a particular intersection—or which made a specific turning movement at that intersection—with permit results including a sortable description of the individual turning movement made by each permit vehicle at that intersection for further analysis.
3.5. Design Principles and Guidelines Applied
The authors considered five interface design principles while developing the prototype OSOW query interface: visibility, feedback, consistency, constraint, and affordance. Each of these principles was evaluated in turn, including specific examples of how different parts of the interface adhere to these principles. In addition, there were supplemental guidelines separate from the five main design principles that the authors identified and applied to their design. This section concludes with a brief listing of those guidelines, and how they were used in the proposed OSOW query interface.
3.5.1. Visibility
While the interface presents a new way of visualizing data, several of the elements of the user interface were modeled after standard UI designs which users will be familiar with. For example, the buttons will look like and behave like physical buttons and the navigation bar has a similar layout to other, commonly used web applications. Buttons on the interface will be clearly labeled with the function of the button. The tabular result component will be well formatted to be visible to users at a moderate distance.
3.5.2. Feedback
The authors intentionally designed the interface to provide users with feedback in several ways. The buttons on the user interface will appear to push in when they are tapped, giving the user a visual cue that they have pushed the button successfully. When a user makes a query, the waiting icon will be displayed until the results are displayed. When a user clicks on any segment/intersection on the map, a detailed popup window will be shown to convey more information about the desired segment/intersection.
3.5.3. Consistency
As previously stated, several of the buttons on the interface will be carried over from previous engineering systems so that the user does not have to re-learn those symbols. All of the pages in the OSOW query system interfaces have similar visual styles, following a set color theme, typeface, and icon set, and thus, keeping the system consistent between pages.
3.5.4. Constraint
The interface performs data type and format validation on certain controls so the user cannot accidentally make a search without providing the correct format of the search criteria (e.g., dates must be in mm/dd/yyyy format). Messages for inputs that fail validation are displayed and intelligible.
3.5.5. Affordance
For the both query pages style of interface, the main screen has page numbers and scroll bars to guide users through viewing results. The embedded maps have clear zoom and pan controls to enable users to alter the displayed map area intuitively.
3.6. Other Guidelines
Error messages will conform to Shneiderman’s rules [26] in the following ways:
- The error messages will not include excessively negative terms such as “FATAL”
- The authors avoided using ALL CAPS to display an error message
- The messages will be intuitive to users and will not contain unnecessary engineering jargon on the main interface (however, the administrator users’ management interface will include more detailed messages)
- Messages displayed on the screens will be concise and easy to read. In cases where longer text is necessary on pages, the text will be shown in a scroller format to avoid having multiple-line or paragraph text.
There will be no part of the interface where the meaning of an element is dependent solely on its color. There will always be at least one other way to identify the control or data element aside from color, to account for users who may be color-blind.
3.7. Interaction Styles
In addition to the five main design principles and other helpful design guidelines, the authors considered the types of user interaction styles that could occur in a web application. There are four primary interaction styles that users could invoke: instructing, conversing, manipulating, and exploring. The proposed interface primarily utilizes the instructing interaction style, but also employs the conversing style where appropriate. The other two styles (manipulating and exploring) are used to a much lesser extent, and therefore, will not be discussed.
3.7.1. Instructing
The instructing interaction style is the approach in which a user issues a command to the system and the system responds appropriately. Instructing is the interaction style most commonly found in the proposed OSOW query interface. There are many examples where this style can be found. The primary means for users to issue commands to the OSOW interface is via tapping one of the various buttons on the command interfaces. Available commands that the user can issue via the interface include searching for permits, exporting the permits returned from a query to an Excel spreadsheet, and an image of the dynamically displayed map. In addition, the administrator user management page has multiple buttons related to user management, such as to delete, add, and update users.
3.7.2. Exploring
The exploring interaction style involves users moving within a virtual space, exploring, and learning new things. An exploration-based OSOW query interface was identified as being somewhat counterintuitive, since the authors desired an interface that users could learn quickly. The theme across the pages, where each page contains a similar look and feel, is loosely based on the exploring interaction style, but only to a minor extent. Overall, this interaction style was not identified as a priority.
4. OSOW Data System Framework Components
As shown in Figure 1, the framework consists of multiple components that perform data import and processing, host data on a server, dynamically query the processed data, and display query results and dynamically generated map visualizations via client web browsers.
4.1. Core Component
The ASP.NET (C#.NET) application serves as the framework’s core which imports processed data from local Access databases, migrates data into the SQL Server, and hosts functions to process data in response to user queries (in addition to its role in generating and hosting the web client UI code). It acts as a middle tier to communicate between entities through parameterized SQL queries, return the results, and perform analyses used to generate the dynamic map components.
Two essential functionalities implemented in this component include generating dynamic CSS and JavaScript consumed by the web interface layer to display the map visualizations, and exporting query results data for user download as Excel files.
4.2. Web Interface Component
This component implements an ASP.NET backend web application to generate controls and process user input, provide the HTML, CSS, and JavaScript code for the UI design, perform client-side field validation, and interface with the CartoDB JavaScript Application Programming Interface (API).
4.3. Database Component
The database component includes the storage of the processed data imported from the Access database in an SQL Server instance. The SQL Server database was designed with consideration of entity relationships as well as index optimization to increase efficiency and provide molecularity for the whole framework while querying the database records in response to user input. A graphical representation of the OSOW data was constructed, and Entity Relationships (ERs) were developed between the database tables.
4.4. Map Component
A third-party web-based API provided by CartoDB was used to visualize results from queries on a dynamic map. This provides the ability for users to visualize OSOW truck permit data in a way that would reflect multiple features on the map as layers. A multi-layered CartoDB map was integrated into the developed framework to visualize the locally processed query results. The API calls and the hosted base maps were configured to make the maps interactive and clickable to display segment IDs and intersection IDs for any segment/intersection in the map. Significantly, the authors were able to display the relative number of permits by highway segment on the highways map by passing a dynamically constructed CSS text string to the API to assign line weights to individual segment IDs based on the results of the user’s query. This visualization allows users to immediately see trends and patterns based on the results of the queries.
Due to the long string length used when injecting a custom CSS code, the authors had to develop a creative work-around in order to avoid length limits and error messages from the API when passing information assigning each of the over 14,000 line features a line weight. A work-around was developed by adopting regular expressions to limit the amount of CSS passed through the Ajax calls to the CartoDB API.
5. Results and Discussion
To evaluate the developed framework, the authors deployed the web application to WisDOT users. As previously described, this framework allows users to conduct both simple and complex queries on the historical WisDOT OSOW permits data set. Furthermore, the framework automatically generates dynamic maps showing the relative frequency of permits along the highway network based on the results of the user queries. It also includes the ability to query for permits that travel along a particular segment or through a particular segment.
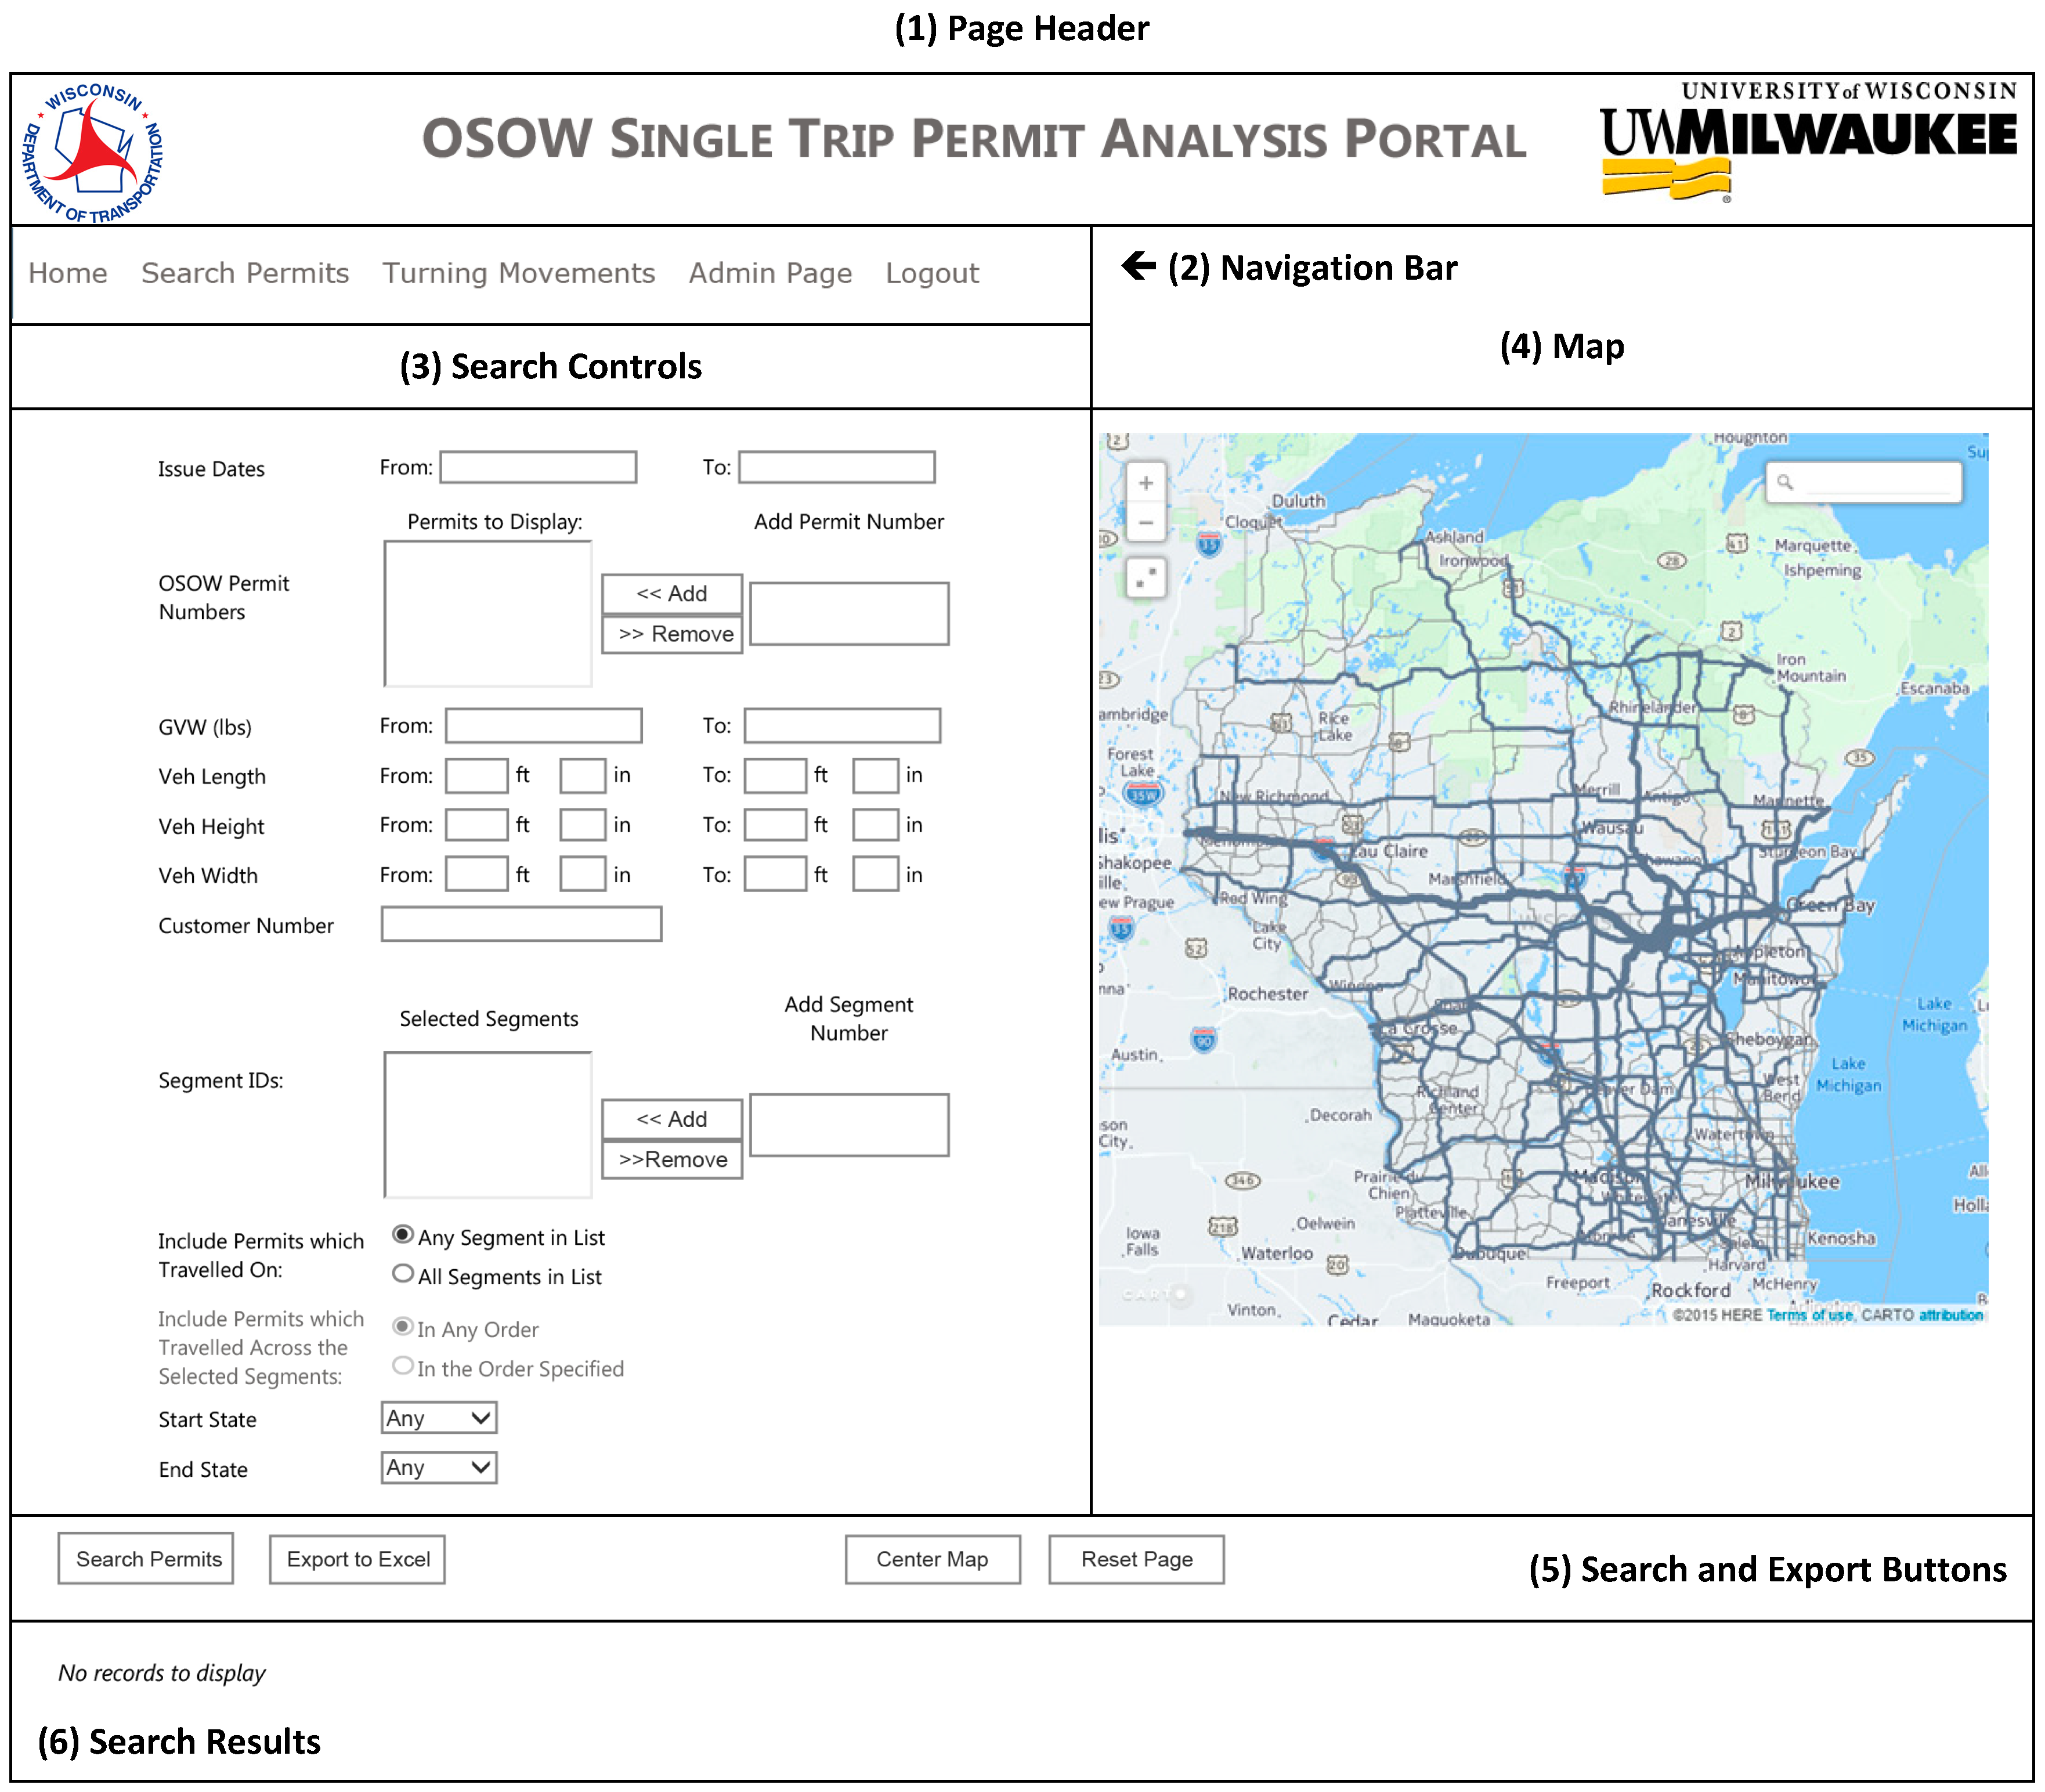
As shown in Figure 2, the interface is divided into six graphical zones; the map area is implemented using Ajax via a third-party API from CartoDB. The result section shows the returned data as a table and can be exported to an Excel spreadsheet using the export to Excel button. Users can also export a dynamic image using the image export button.
Different search criteria can be used to query the database based on the user’s input in the search control section. The search parameters fields include multiple aspects of the permit records, and allow ranges to be input with an upper bound, lower bound, or both included. Dates can be input in mm/dd/yyyy format or selected via a pop-up date selector.
If users wish to pull up records for specific permits, they can search by the OSOW Permit Numbers to limit results to a single permit, or up to 5 permits, for display on the integrated map. OSOW Permit Numbers can be obtained from other sources or as the result of a previous query.
Results can be limited by vehicle characteristics including Gross Vehicle Weight (GVW), vehicle length, vehicle height, and vehicle width. Each of these criteria can be entered as minimums, maximums, or both, in order to create detailed queries using multiple criteria. Furthermore, the interface accepts dimensional information in feet-inches format and converts it to the inches-only values used in the database.
Searching by Customer Number will limit results to permits obtained by a particular customer, which requires users to enter the Customer Number. The Customer Number can be obtained from previous query results, or from other sources.
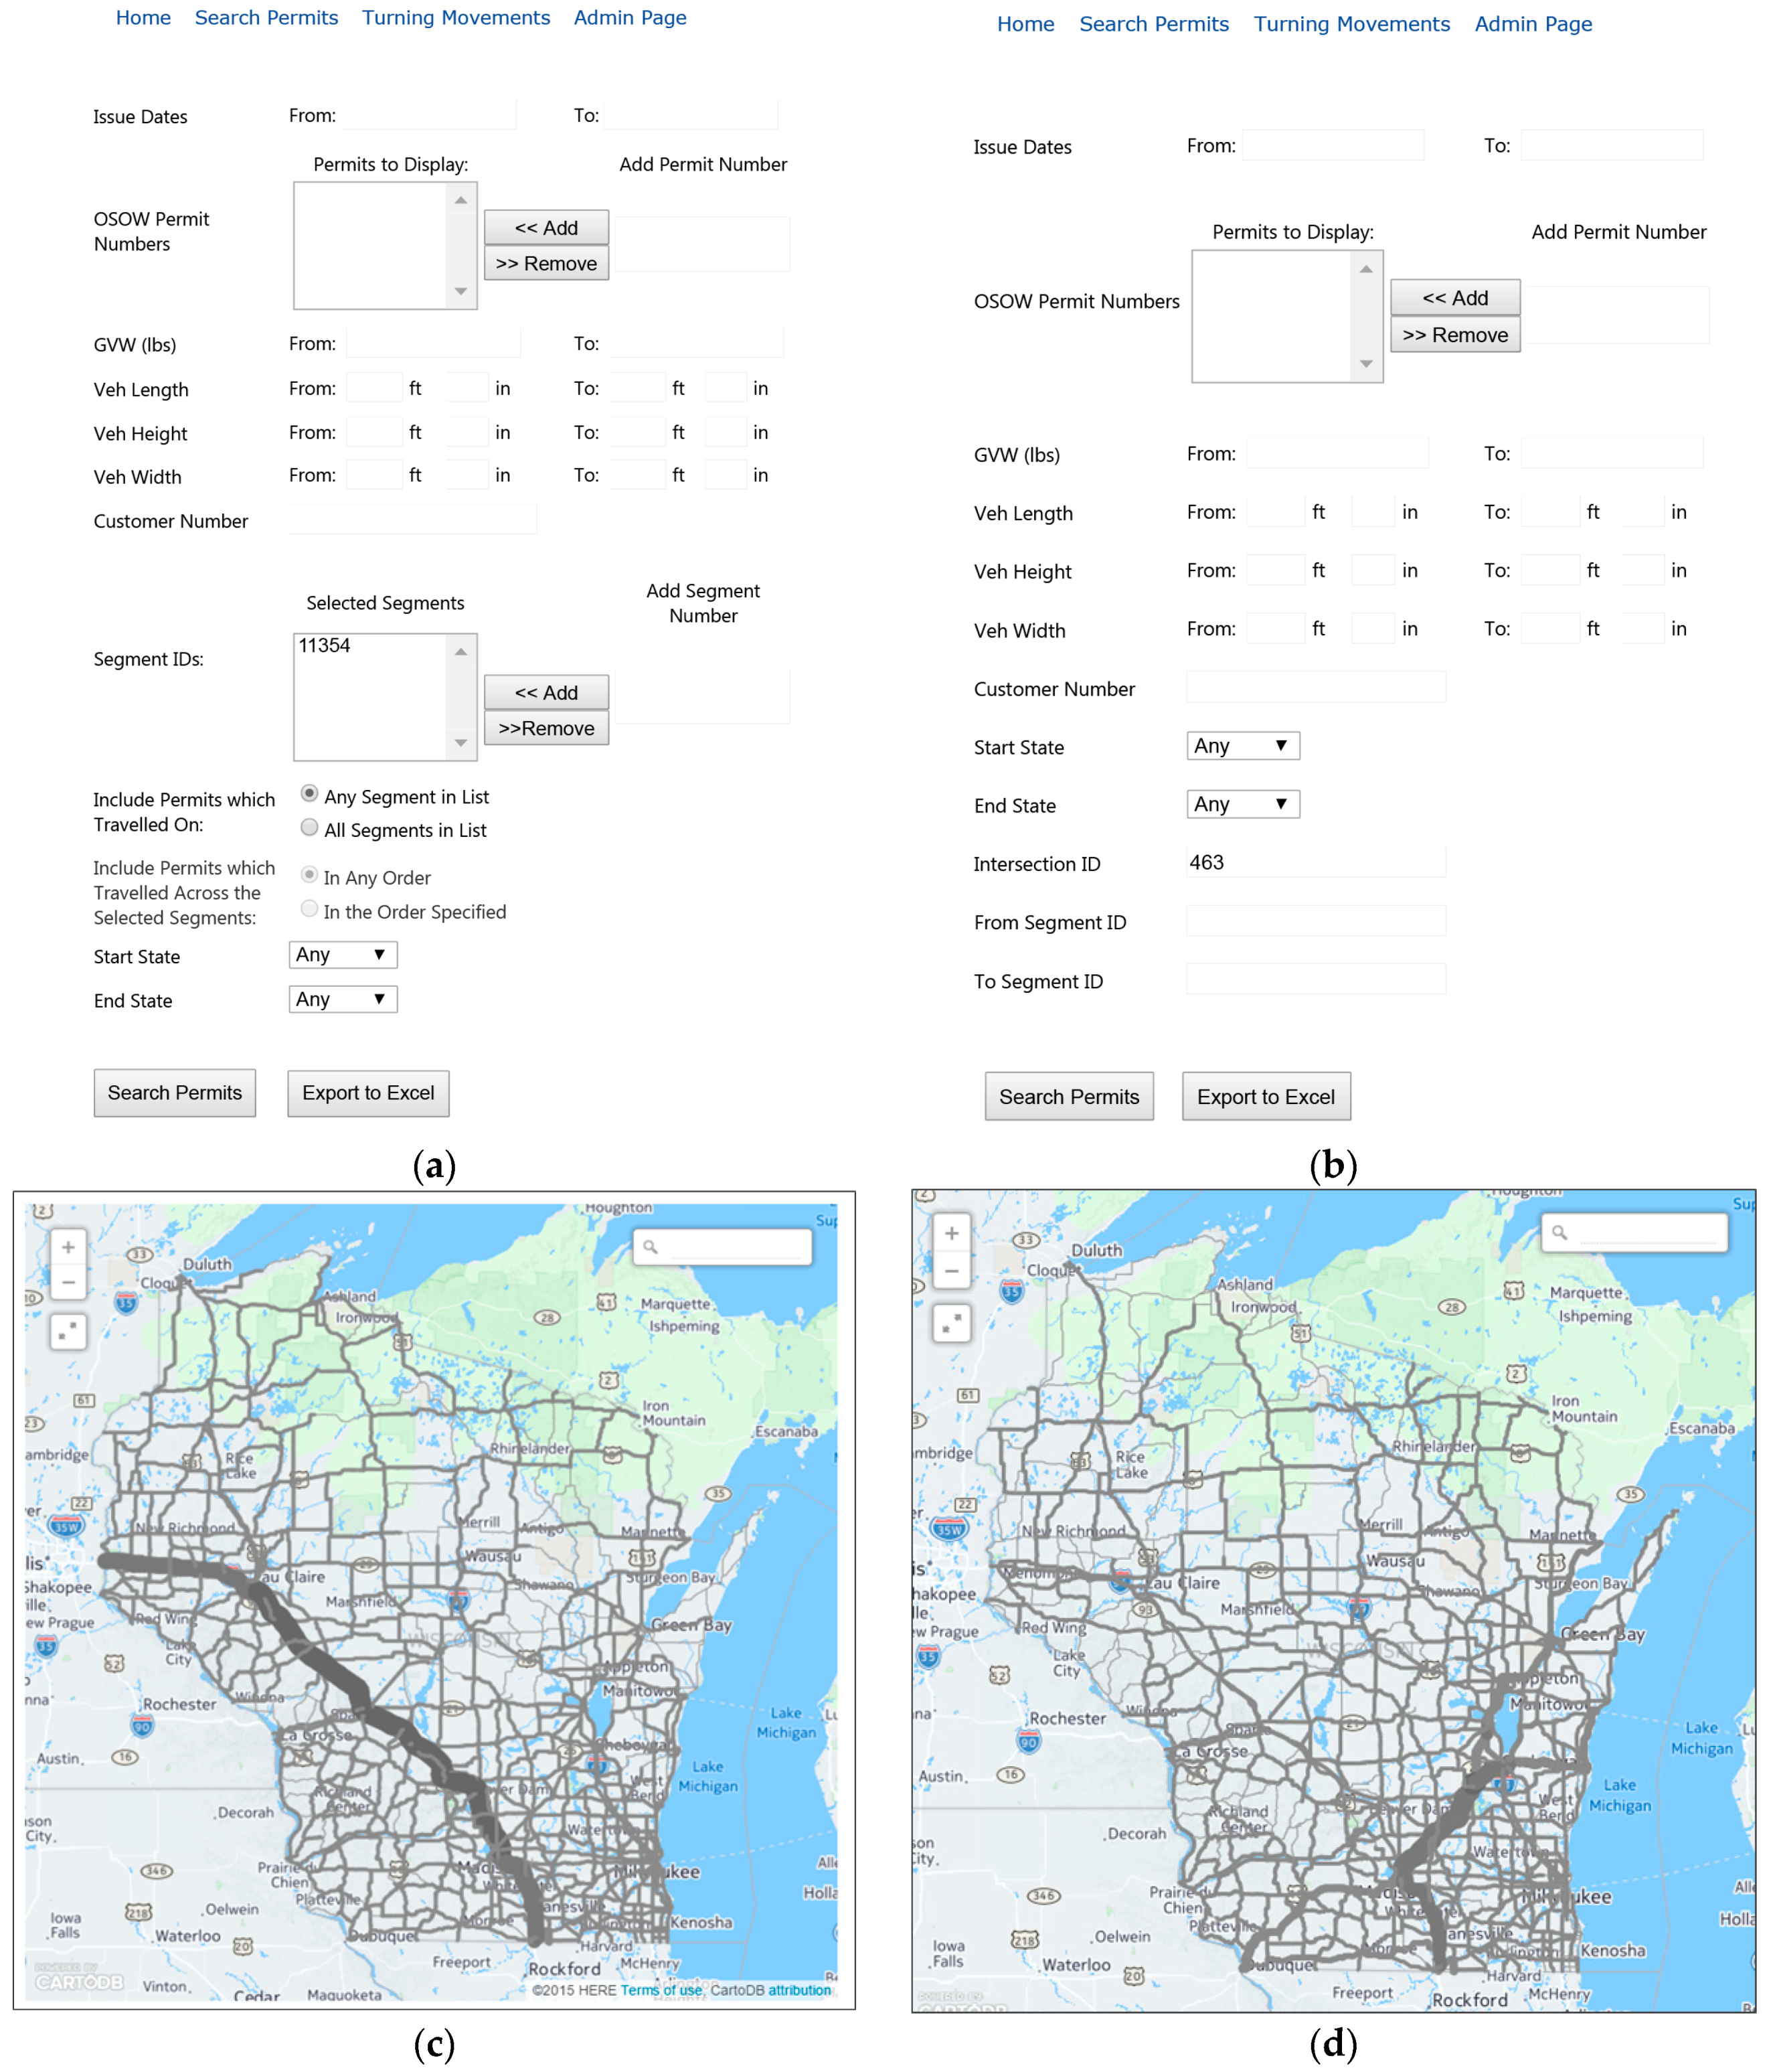
Searching by Segment ID (only on “Search Permits” page) lets users search by Segment ID (see Figure 3); the value of the Segment ID is obtained from the map, or can be obtained by other means, as it correlates to segment identifiers used in other WisDOT GIS systems. Using the integrated map controls, users can zoom to the segment of interest then click on the segment of interest and copy or note the Segment ID number in the pop-out box. A Highway Designation value displayed in the pop-out box refers to the most significant highway number on concurrently signed routes. If multiple Segment IDs are entered, users can select the radio button options to conduct a search in one of three ways:
- Return permits which travelled on at least one of the Segment IDs.
- Return permits which travelled across all of the segments IDs at some point, in any order along the permit’s route.
- Return permits which travelled across all of the segment IDs in the specific order specified.
Searching by Start State or End State allows users to search by a permit’s start state or end state (or both) using pull-down lists. Selecting “Non-WI” as a start or end state will limit results to permits that began or ended (respectively) in a state other than Wisconsin.
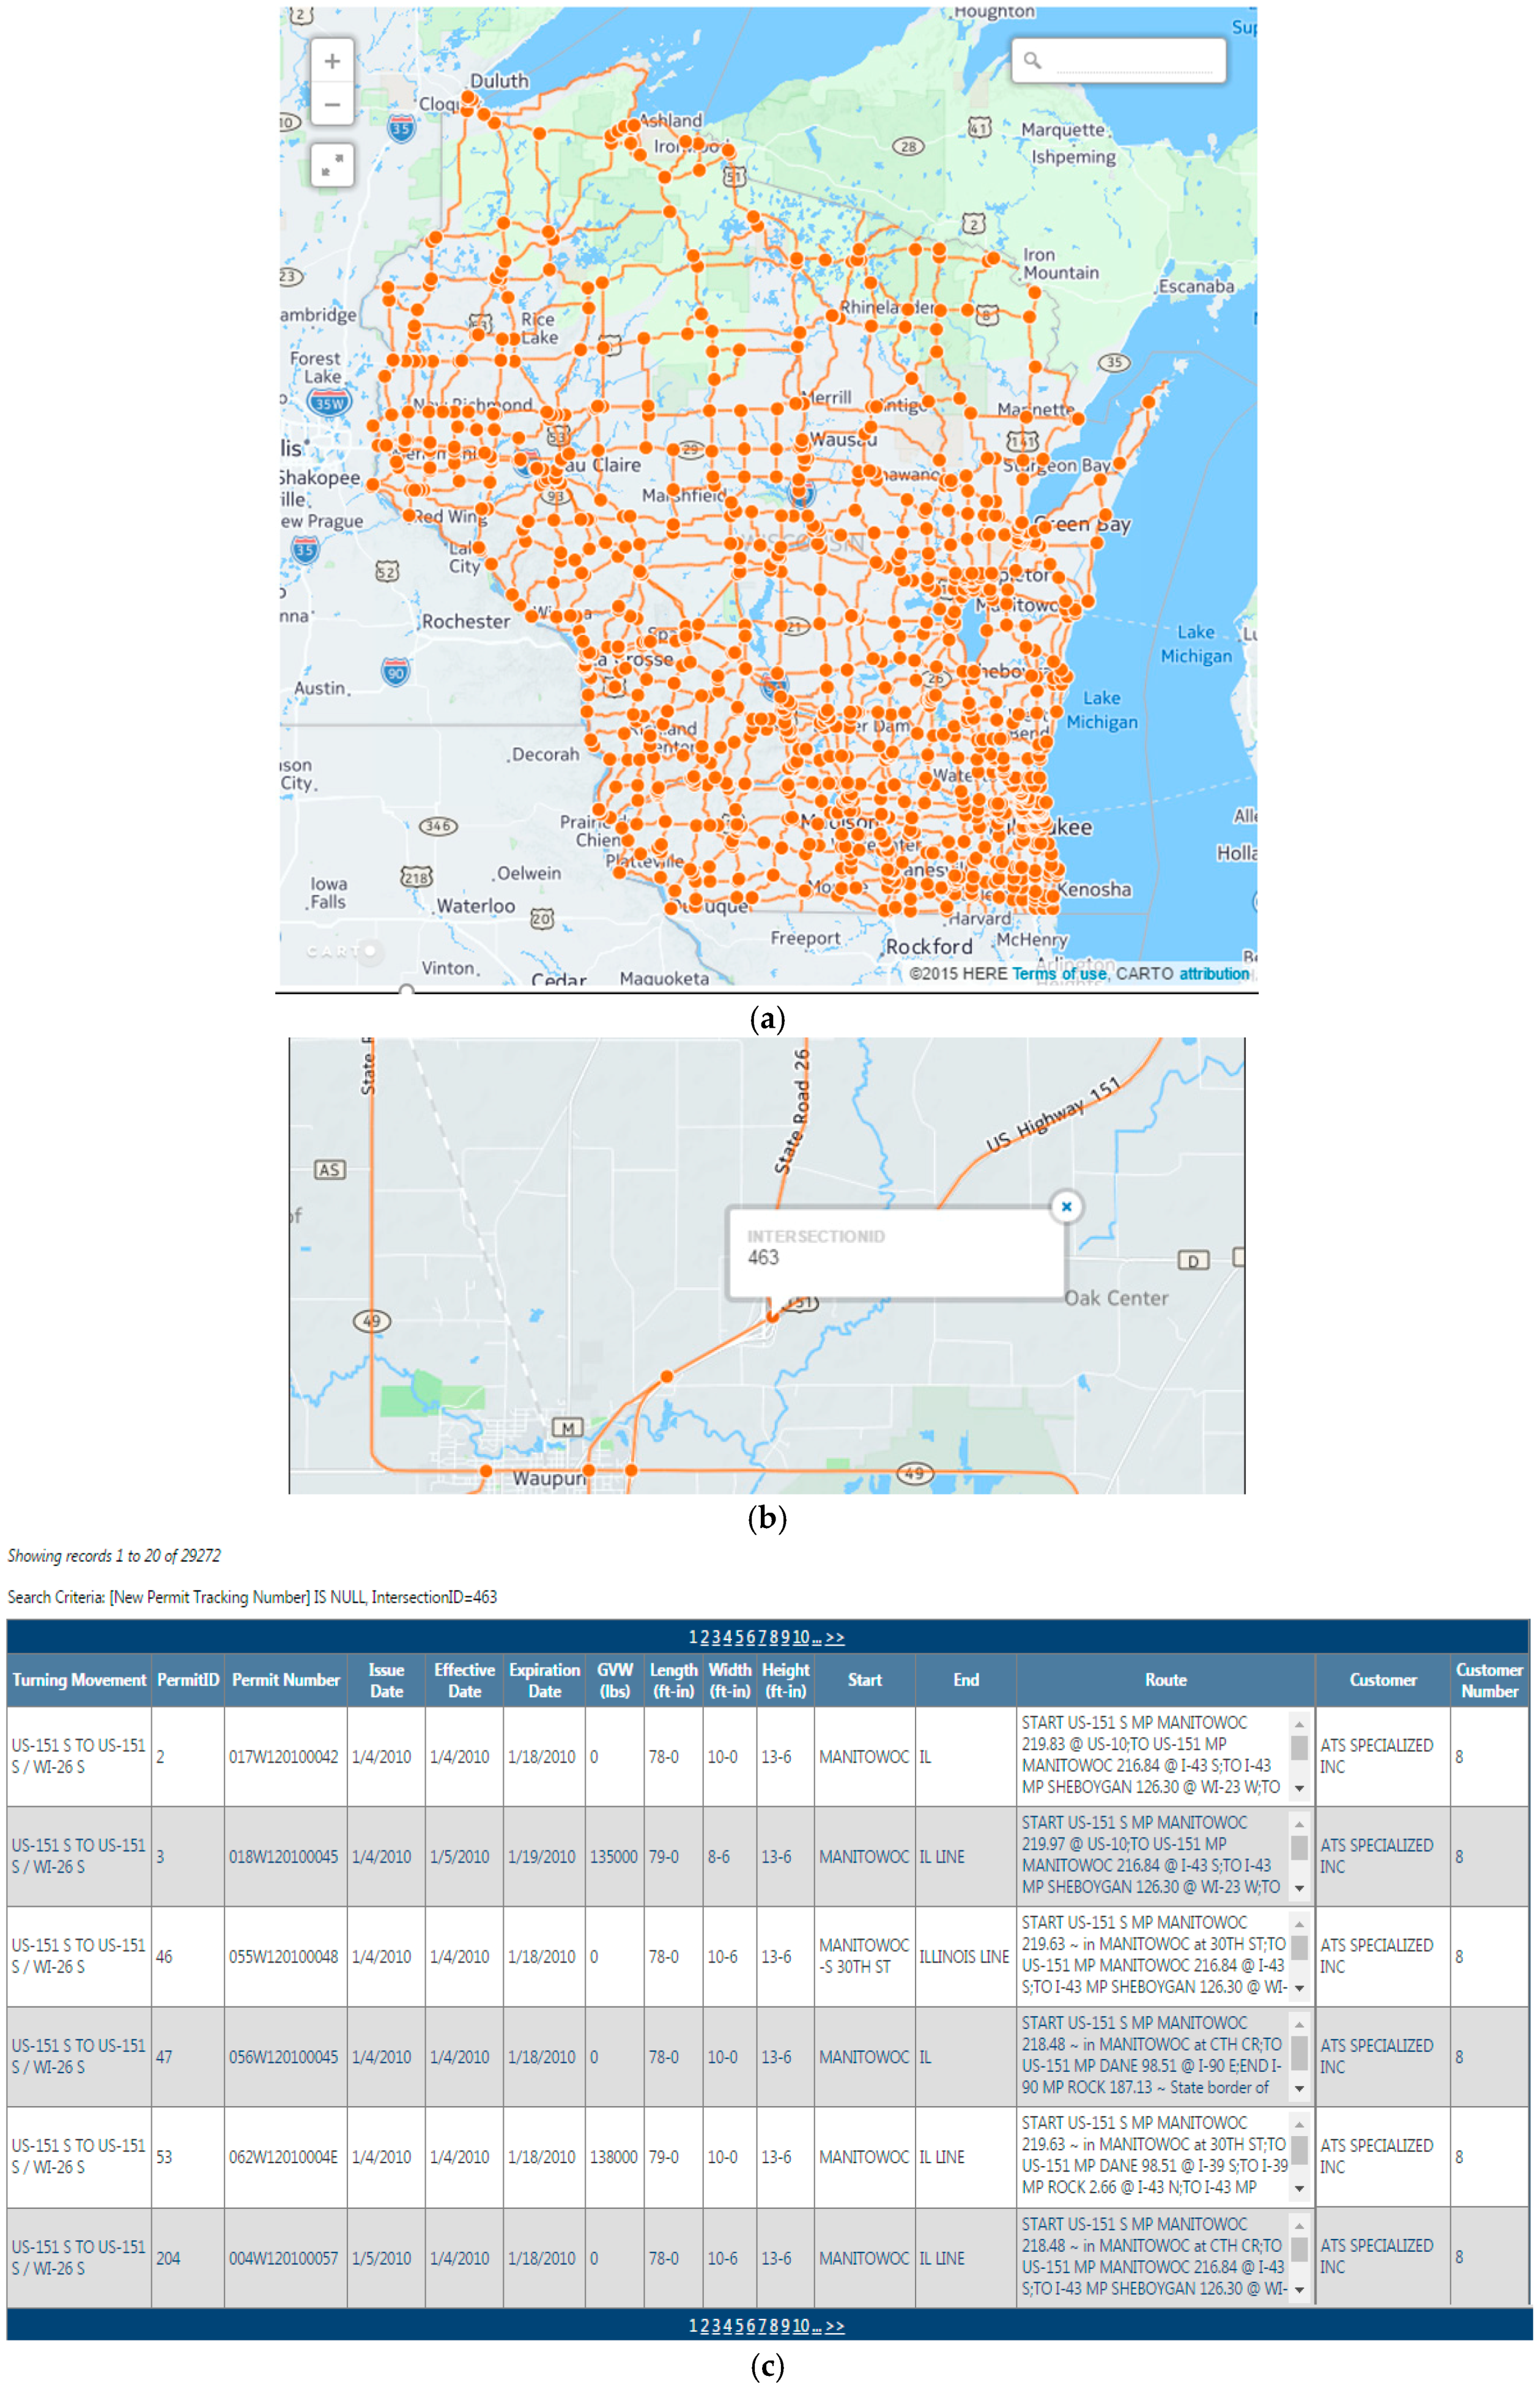
The Turning Movement page includes criteria specific to a physical intersection (see Figure 4). For example, a typical four-way intersection has twelve possible turning movements—four approach directions, with three departure options each: left, right, or straight. Users click on a map displaying all the intersection points in order to determine the Intersection ID to be used as a query parameter. Alternatively, users can enter one or both of the approach segment’s Segment ID and/or the departure segment’s Segment ID. The results for intersection-level searches are especially valuable for DOT users, as a primary challenge in OSOW permitting and highway design is ensuring that OSOW vehicles are able to physically navigate intersections. Furthermore, turning movements are inherently directional; by querying an intersection using only an approach or departure Segment ID, permits travelling in one direction along that route can be isolated. Additional requirements and usage notes for these fields include:
- The selected segment(s) must be adjacent to (touching) the intersection point of interest.
- The Intersection ID field must be empty when one or both of these fields are used.
- Using both the From Segment ID and To Segment ID fields limits results to permits which made a specific turning movement.
- Results can be further analyzed based on turning movements by exporting the data to Microsoft Excel and filtering the “Turning Movement” field in the spreadsheet.
5.1. Viewing and Working with Results
To let users dynamically filter, sort, and edit the query results, the authors determined that the most efficient option is often to allow users to download the list of permits and then open the results using Microsoft Excel software. This allows users to use Excel’s built-in filter functions to sort results and perform more advanced filters of the returned data than are possible using the query interface. Furthermore, users can take advantage of Excel’s built-in chart creation capabilities and statistics functions in order to conduct analyses of the query results, such as creating graphics showing permit vehicle trends over time. The use of desktop software to perform further operations or analyses of the returned query results was determined to be optimal given the wide-ranging use cases of this data across various WisDOT divisions, which would have specifically expanded the project scope if implemented into the web application.
5.2. Visualizing Results in the OSOW Query Portal
5.3. Implementation of Framework in OSOW Program and Freight Operations
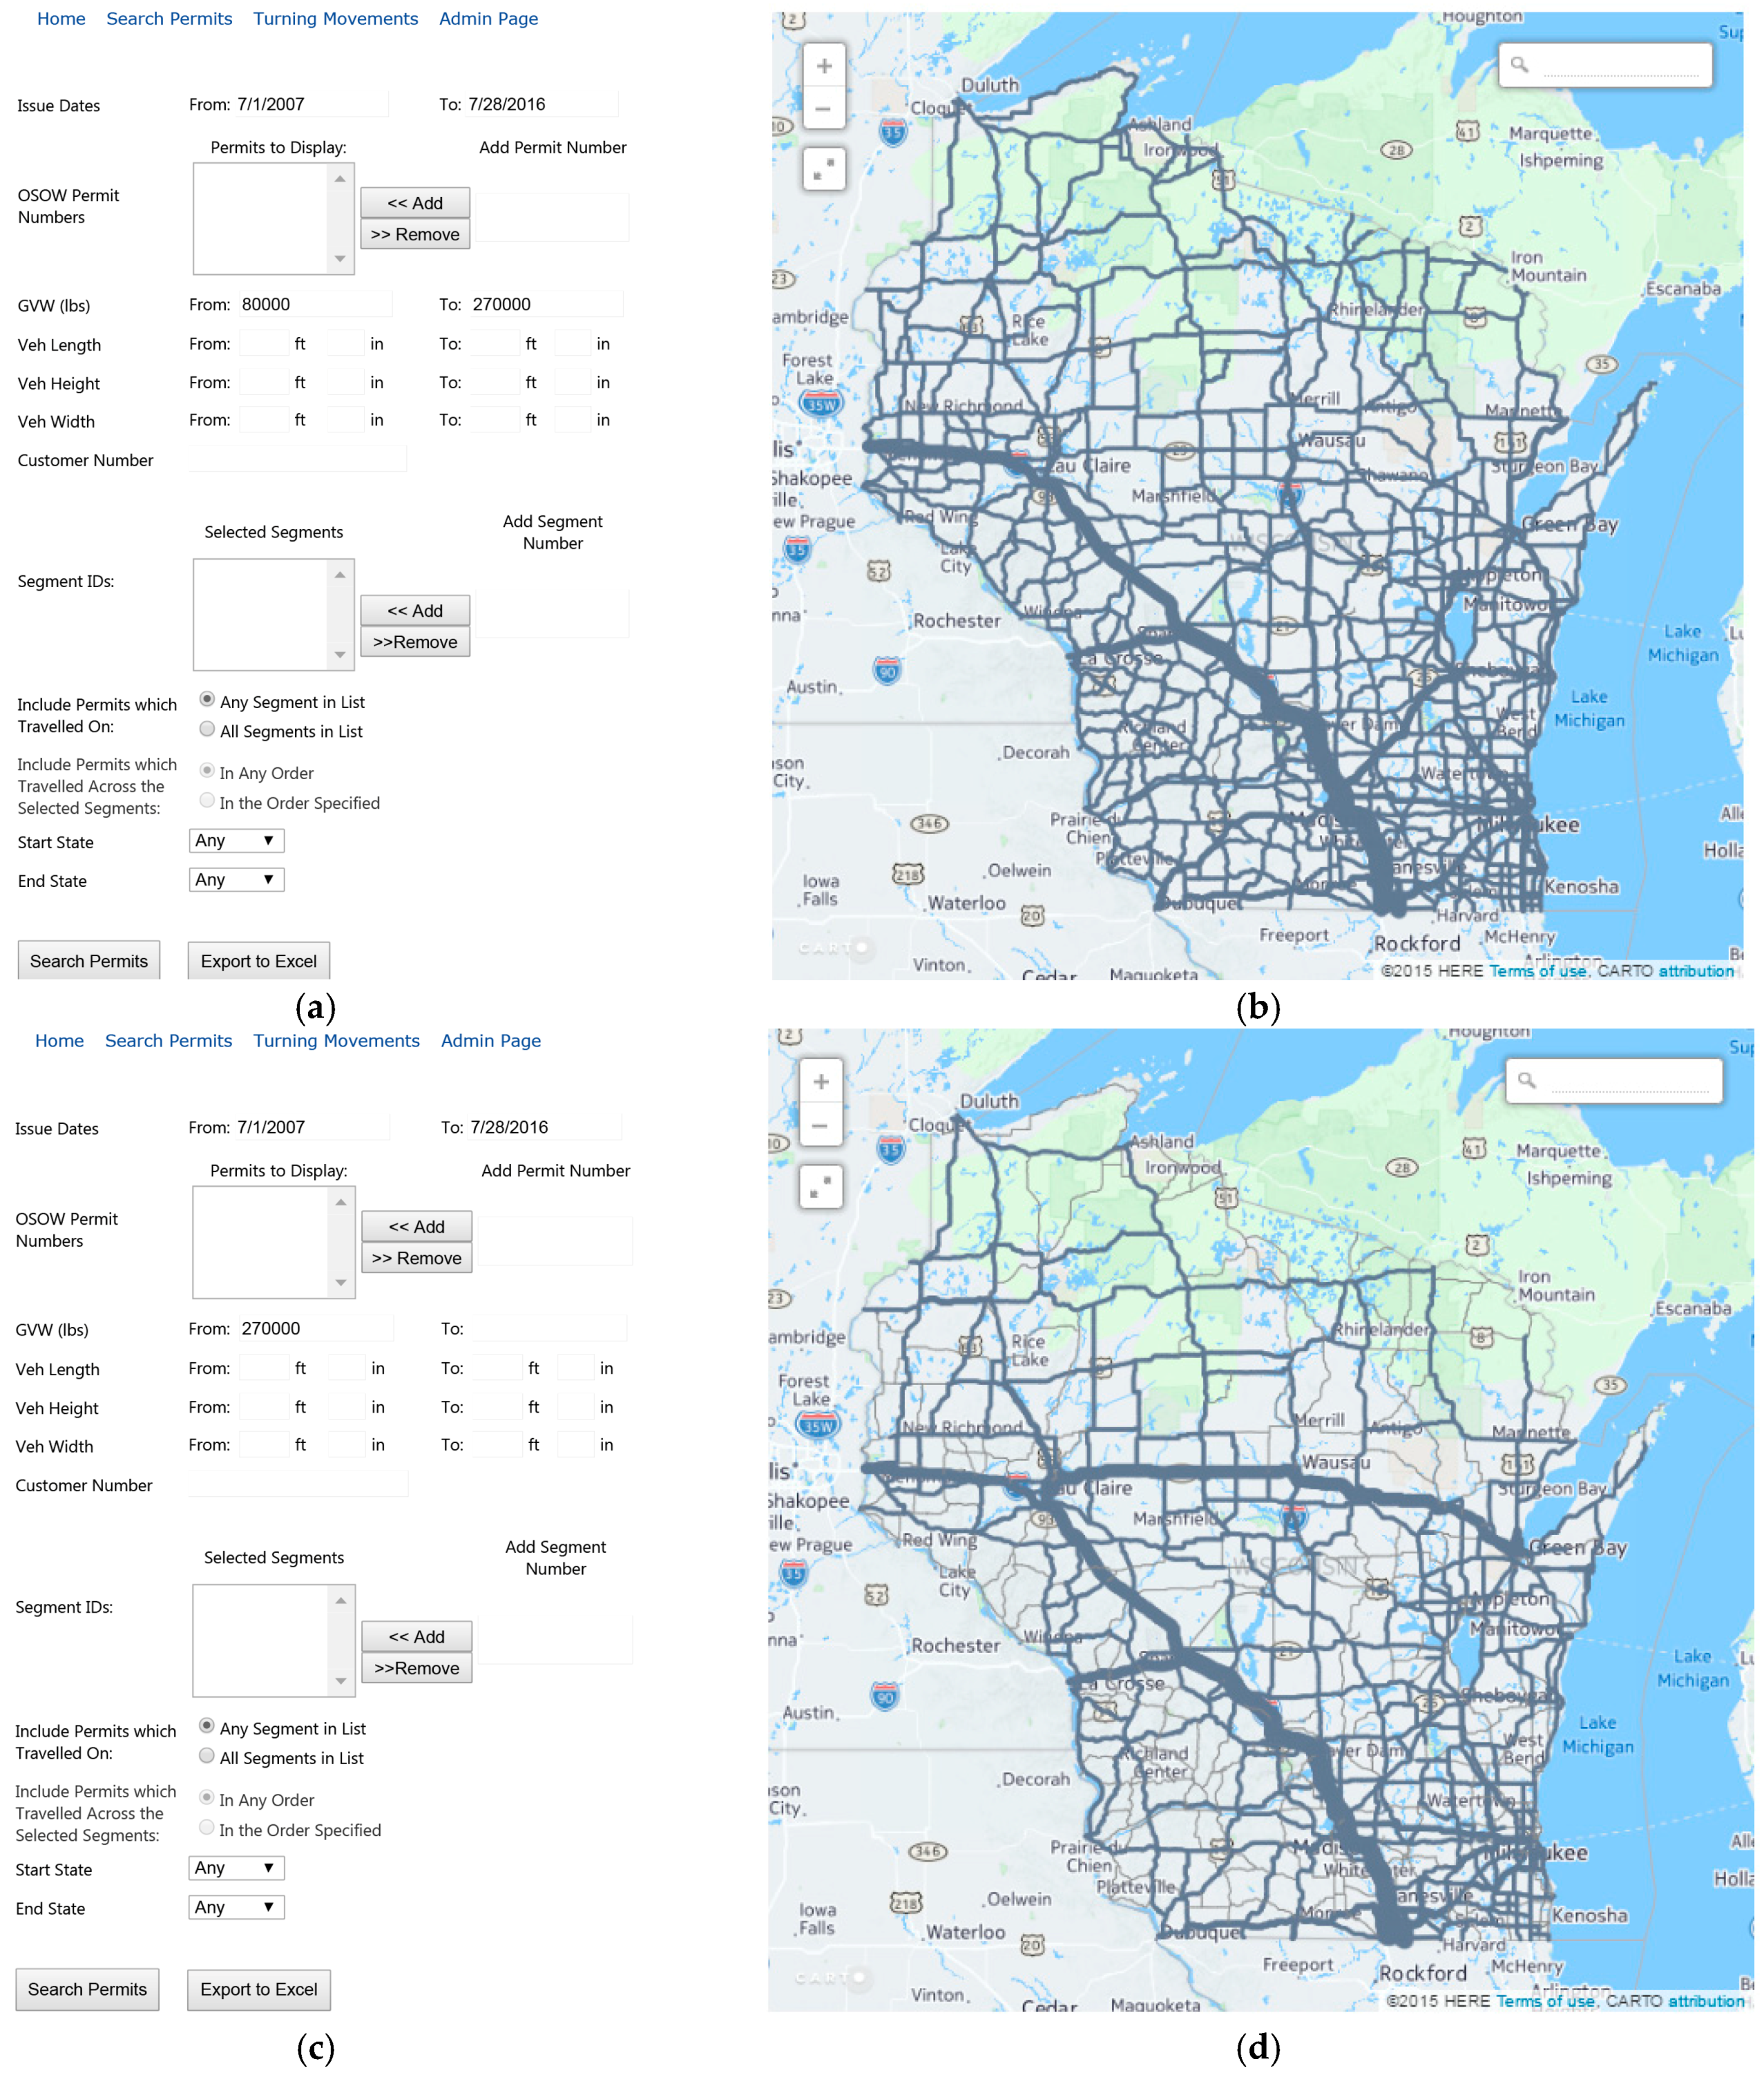
Figure 5 shows the results of sample queries, which visualize the patterns of OSOW vehicle movements using criteria that may be of interest to civil engineers and transportation planners. Figure 5a–d demonstrate the use of time-dependent and weight-dependent queries, which can be useful in evaluating recent trends; furthermore, OSOW vehicles above a certain weight (for example, >270,000 lbs. in Wisconsin refers to Super Heavy Load (SHL) [27]) are often subject to increased permitting requirements and additional engineering analyses before permit issuance, which makes isolating these vehicles’ routes especially important. Similarly, Figure 6a–d demonstrate how results can be generated based on permits’ origin and destination states, which is of interest to transportation planners and freight analysts.
5.4. Heuristic Evaluations
One of the methods employed herein to evaluate the OSOW prototype interface is through the use of heuristics assessed by reviewers. The authors conducted internal reviews on the prototyped UI based on the original design goals, and with reference to the use cases identified in the project conceptualization phase; this included reviewing components and functionalities developed by different individuals in order to facilitate a more objective review. The authors took special care to evaluate the system objectively, with particular emphasis on identifying areas which may be improved.
The evaluation criteria applied to the design consisted of seven key heuristics, in accordance with Nielsen’s [28] requirements: (1) visibility of system state; (2) match between system and the real world; (3) user control and freedom; (4) consistency and standards; (5) aesthetic and minimalist design; (6) help users recognize, diagnose, and recover from errors; and (7) help and documentation.
For each heuristic, the authors assigned a numerical score from 1 to 10 that best described how they felt the prototyped application met the given metric. A score of 1 meant that there was no evidence supporting that they met the heuristic, and a score of 10 means the team felt the design went above and beyond what was required to meet the metric. A score of 7 should be treated as average, and scores below 7 should represent a need for improvement.
Note that the heuristic evaluation was performed at a system level; in other words, all of the components of the OSOW interface were looked at comprehensively, as one unit. In addition to this approach, the authors also conducted a subsystem review. The benefit of a subsystem review is that it allows the authors to deeply focus on one component at a time; on the other hand, interaction between subsystem components would not be easily reviewed with this approach.
Each heuristic category contains multiple subcategories. Numerical values are assigned to these sub-criteria. The overall score for the top-level criteria is the arithmetic average of the sub-criteria scores, rounded to the nearest integer.
A summary of the heuristic evaluation results is presented in Table 1. Based on the project requirements, the authors were generally satisfied with the ability of the OSOW interface to visualize the data, as well as to provide a user-friendly interface. Although the visibility review went well, some potential areas for improvements were noted, leading to multiple interface changes in response to this user feedback. For instance, some labels were rewritten to enhance their clarity to users, and additional external documentation has been provided to users as a reference. Another potential solution that may be implemented in the future is the addition of detailed tool-tip texts on all fields. A second issue detected during the users’ review was that the search button was not temporarily disabled while the SQL Server was processing a query, which may take up to 10 s for queries returning large results sets. To address this issue, a pop-up spinning-wheel overlay has been added to the UI to disable the controls and to clearly communicate to the users that the query is processing on the servers. As more user feedback is received, further changes will likely be made in the future; the agile approach of this project allows for the frequent deployment of application updates in order to ensure continual improvement.
For the match between System and the Real-World evaluation criteria, the team identified areas in which additional development effort could improve overall functionality. For example, the authors were aware of a need for appropriate icon images for an Admin button; however, the constraints of the low-fidelity prototype necessitated that improvements such as this would need to be deferred until later design iterations.
Consistency and Standards were held as priorities during the design process, and as such, similar colors, fonts, sizes, and spacing were used across the control interfaces. This was identified as a strong point during the review, as this assists in improving system learnability.
After evaluating the Aesthetic and Minimalist Design criteria, the authors worked to make sure only information that is relevant is shown on the interface; however, there are some minor improvements that could be made. For instance, it was identified that the functionality of the “Export Excel” and “Export Image” buttons may be unclear to some users. Additional clarification in the form of informational messages could be used to explain how these buttons relate to the data.
Helpful error messages are an important aspect to the OSOW interface, and are something that traditional applications may lack. Adding error messages and showing them to the users can be helpful, but these messages need to contain information that is relevant to the user. The authors must ensure that all error messages are clear and concise so that the users understand the situation, and provide advice for what the user should do next. For instance, if the user entered an invalid OSOW permit number, the message needs to inform users their search criteria does not apply to valid results, and that the user should try entering a different OSOW number. If an error occurs with the system that the user cannot fix, the system should tell the him/her that it is a service issue, and that they should notify the system administrator for additional troubleshooting.
The provision of additional help for users was not emphasized during the first design cycle, as the agile development approach supported addressing usability issues directly via changes to the application. The primary goal was to create functionality, allow users to test the functionality, and then revise the deployed application to ensure its continual improvement. As a result, this heuristic was scored lower than the others. The authors did not create a “Help” button on their user interface, as an offline user manual was developed and distributed to authorized users to provide additional background information and use case examples. The authors plan to consider prototyping online help and tutorial information as part of the next design cycle.
5.5. Other Considerations in Heuristic Evaluation
With the results of the heuristic evaluation in mind, the authors recognize that the design is broadly functional, with some aspects that could be improved to increase the quality of the user experience. The use of a self-review in the heuristic evaluation helped give the authors additional insight into their design, but also required additional efforts in order to maintain an objective standard. An aspect of the self-review process that the authors found more difficult—particularly because they were reviewing their own design—is the scoring process. The authors recognized a potential tendency to score themselves higher than a third-party expert review might, due to personal attachment to the project. Keeping the possibility of bias in mind, the authors intentionally selected numerical values that they thought an outside reviewer would actually select. Therefore, there are few scores of “10” on the heuristics and their sub-criteria, and some sections received low ratings. This is especially true with the Help and Documentation heuristics. Nonetheless, the use of a self-evaluated heuristic assessment assisted the authors in better understanding the human-computer interactions provided by the interface, and the results will be used to improve future design iterations.
5.6. User Questionnaire
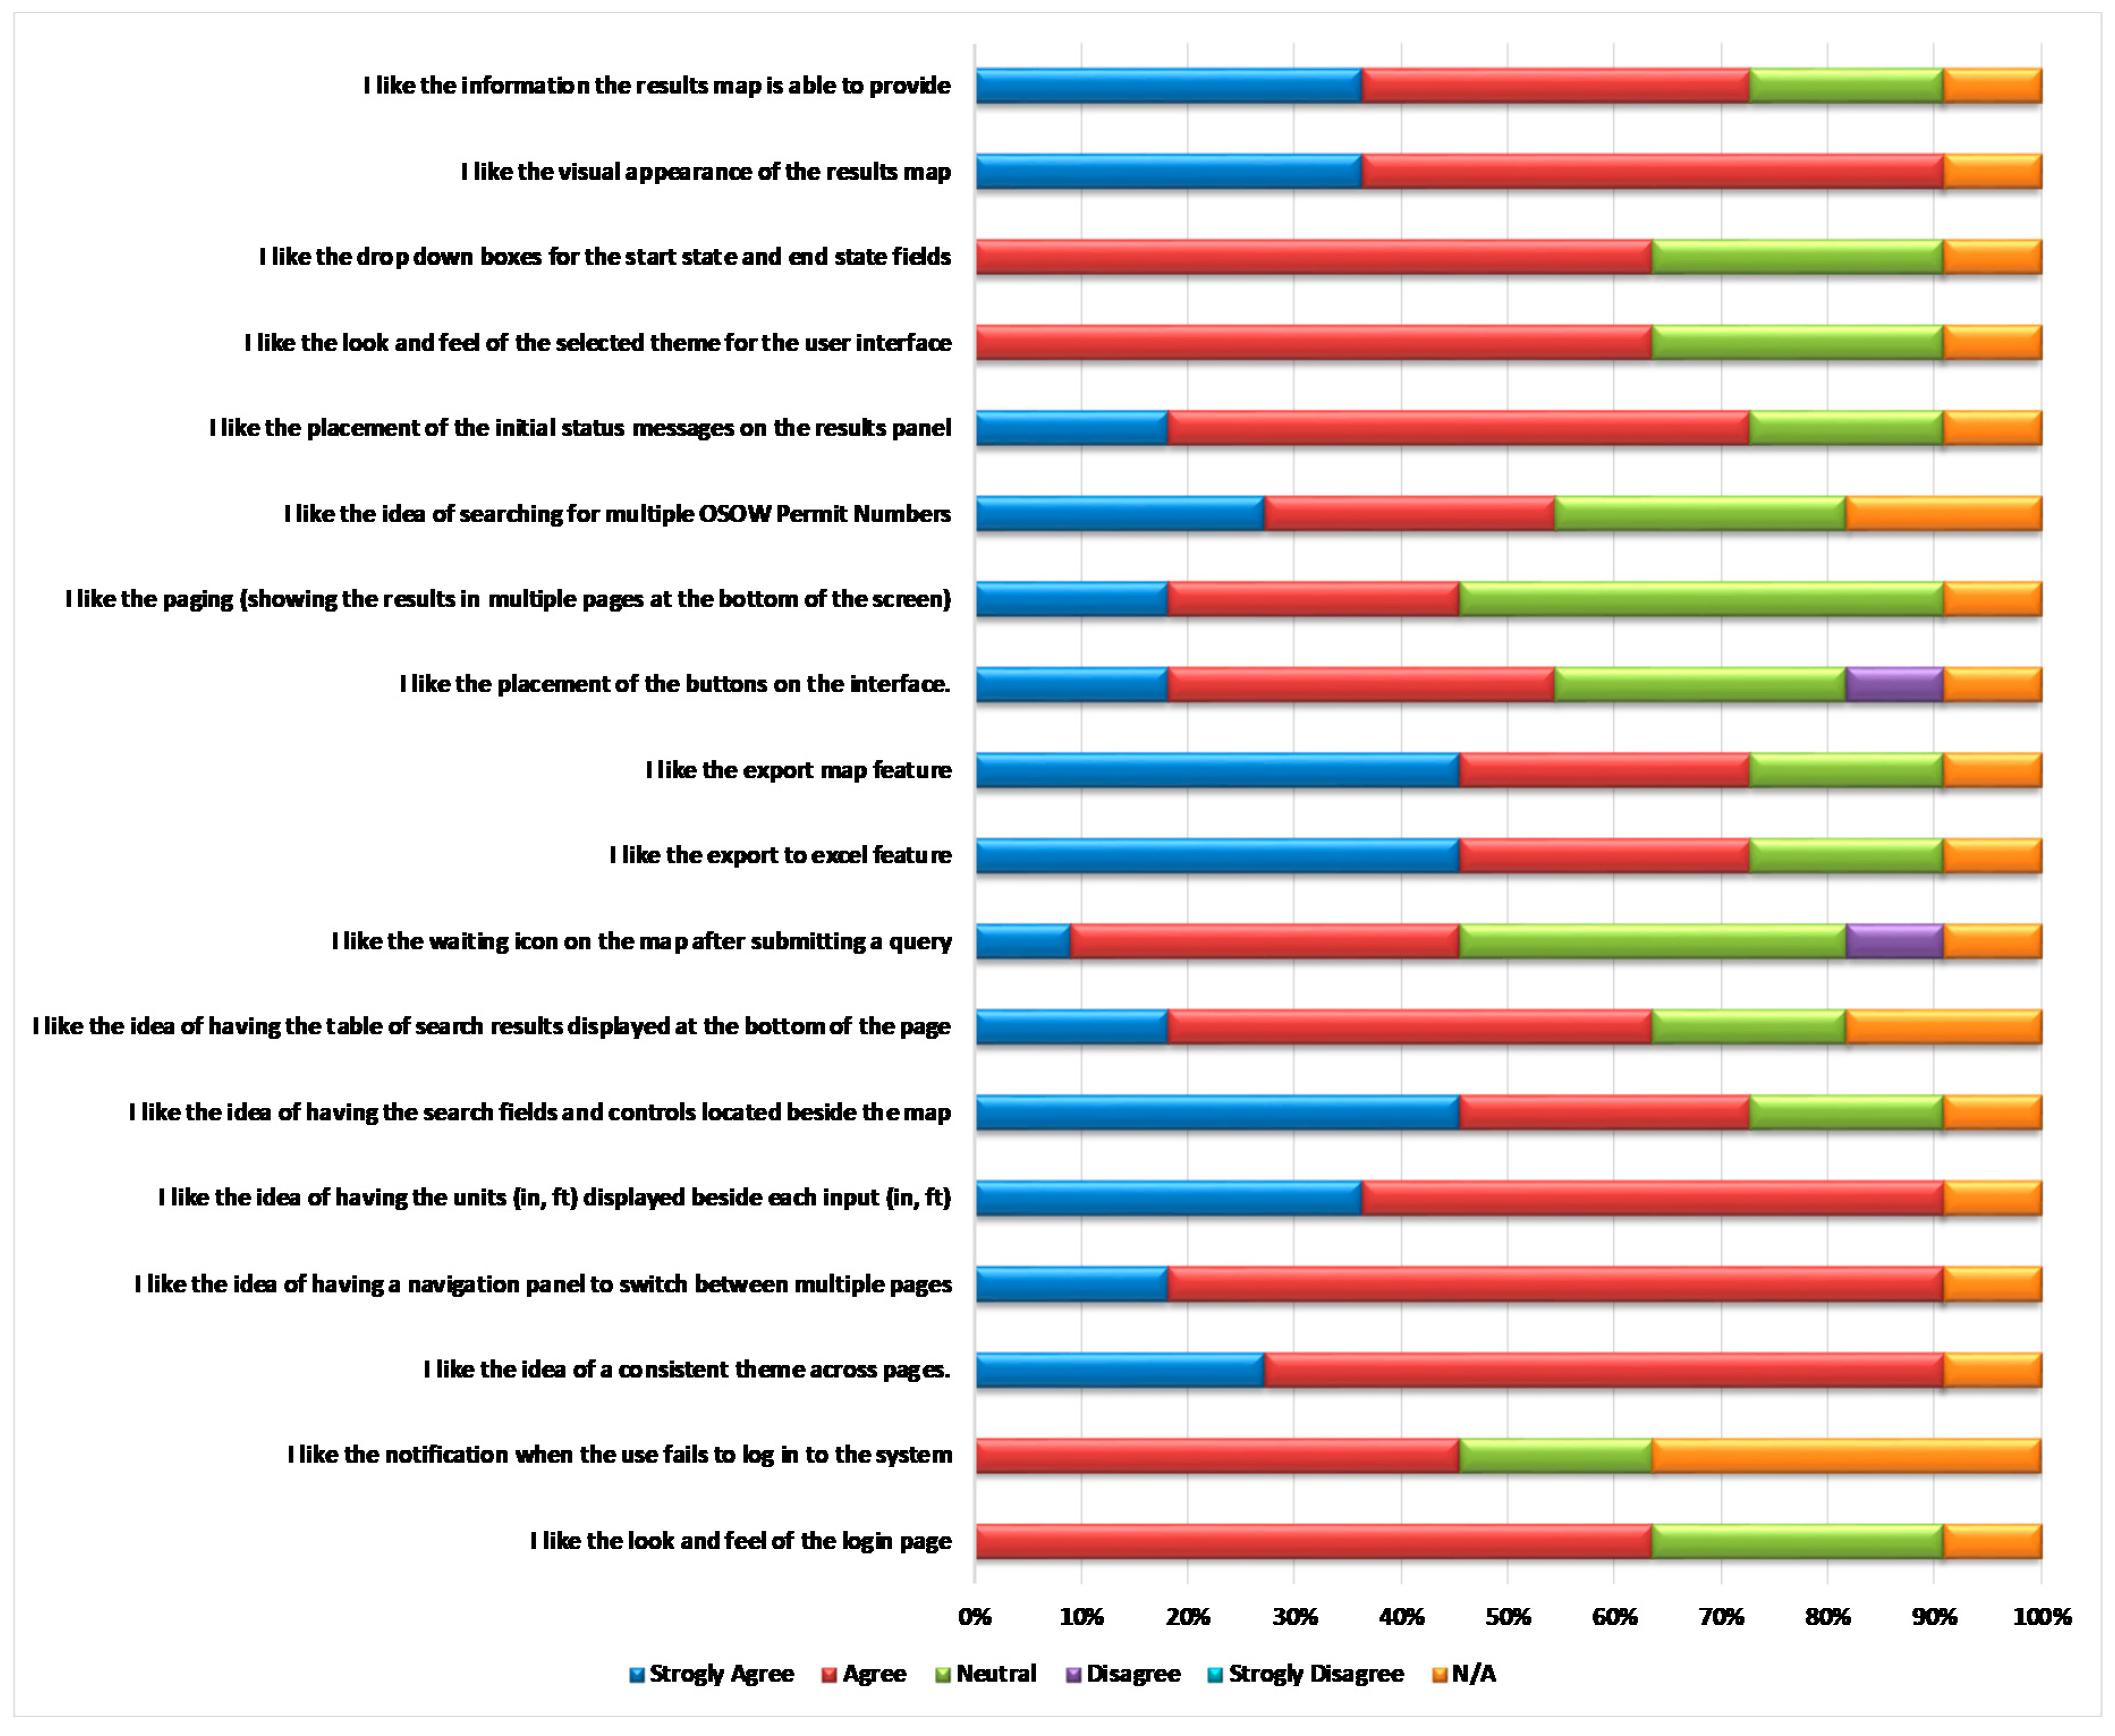
In addition to the heuristic evaluation, a selection of existing OSOW interface users and non-users was provided with a web-based questionnaire. The goal of the questionnaire was to obtain quantitative feedback from the users, since the results from the usability test itself was primarily qualitative in nature. The majority of the questions on the survey were written to use five-point Likert scales (ranging from strongly agree to strongly disagree), with the intention to find out how participants felt about specific aspects of the prototype interface. The questions that users were asked via the post-test questionnaire, as well as a graphical representation of the responses, are provided in Figure 7.
The overall feedback on the components of the new OSOW framework was generally positive, and user satisfaction was apparent during the usability test. An example item from the user feedback evaluation was that multiple users desired a date picker (where users will be able to pick the data without typing the data manually) when entering date as input, which was not originally provided in the first prototype. This was subsequently added in the next release version.
6. Uniqueness
As the authors designed and developed the OSOW permit query framework, their primary goal was to provide features and data analysis capabilities that would be useful to all interested DOT users. Prior to the deployment of this framework, the historical permit records were only viewable in data table format; furthermore, there was no consistent or easy way to isolate the permits that travelled through a particular intersection or on a particular highway segment. Queries could be conducted on permit attributes, but the permit route text was inconsistent, and as such even text matching within the route texts to isolate permits based on highway features was next to impossible.
As such, the primary contribution of this project to the users’ workflows is to allow historical permit data to be queried not only on permit or vehicle attributes, but also on the highway segments and intersections travelled on by the permit vehicles. Furthermore, the ability to instantly visualize the density of permits along the statewide network provides an immediate indication to users of where the permits returned by the queries are concentrated. The ability to instantly export query results to Excel, and also to export a copy of the dynamically generated map, are additional features that provide value to users. The comprehensive functionalities of the OSOW permit query framework have not only expanded, simplified, and improved the ability to conduct searches on the historical permits data, but have also provided new means of accessing this data which can be used in a multitude of ways across users and technical roles.
7. Deployment and Impact
The OSOW vehicle permit query portal was implemented and deployed by WisDOT in late 2015, and has been continually refined through early 2018. The portal, using the extensive OSOW permit application database, identifies historical route and system corridor activity. The data query application allows for both operational assessments for new permit application considerations as well as analyses, which provide valuable planning benefits for future system improvement projects. During the implementation period of the OSOW query framework, WisDOT has reviewed the designated statewide OSOW highway network, and this work has produced measurable changes in departmental policy. The total mileage of designated OSOW truck routes has been trimmed from 5784 to 4230 miles, and the number of relevant OSOW truck route intersections has been correspondingly reduced from 269 to 175. These reductions in systemwide OSOW vehicle accommodations will benefit the public by precluding unnecessary investments to sustain higher design standards on less-utilized OSOW permit routes, while still meeting the operational needs of industry. WisDOT users have reported to the authors that this tool is now used regularly by both operations and planning divisions to provide accurate insights into OSOW permit route histories, which are already informing new policy and infrastructure planning efforts.
8. Conclusions
In this paper, the authors have studied the problem of providing user-friendly access to historical OSOW permit data. The authors demonstrated that a highly functional web-based OSOW query interface could provide a valuable resource for engineers and DOT officials in analyzing OSOW data and assisting in the use of OSOW data for engineering studies, such as pavement performance evaluations and analyses of bridge infrastructure. The nature of the new proposed framework provides a distributed, automated way to query the existing OSOW permits data, and visualizes the results in both tabular data format and dynamically generated maps. The use of an agile software development approach allowed the authors to continually improve the deployed web application, and the results of the heuristic and survey evaluations demonstrate the usability of the deployed interface.
Significantly, the data management and visualization framework discussed in this paper could be applied to any historical OSOW permit dataset containing route information, even if the route information is only in text format. As this project continues, the authors plan to further automate the text parsing and route processing components that provide the data inputs for the OSOW query framework described in this paper. By converting text-based route descriptions into geospatially enabled route paths, historical permit can be viewed geospatially. The ability to look back in time at many years’ data can prove valuable, even if newer permit issuance platforms provide data visualization capabilities for more recently issued permits. This framework and the specific tools provided by the OSOW query interface support the enhanced use of OSOW permit data in pavement design and analysis, bridge engineering, and permit program management, which can ultimately provide significant returns for organizations involved in OSOW permit program management.
Author Contributions
A.S. programmed the OSOW portal interface and the module that adds future data to the database. N.C. developed and programmed the database and brought the tens of thousands of data entries to approximately 98% reliability. H.H.T. was the PI for the funded research projects, developed the idea, supervised and guided the research and implementations work.
Funding
This research was funded in part by the National Center for Freight & Infrastructure Research & Education (CFIRE) under sub award number 995B750 and by Wisconsin Department of Transportation (WisDOT) under project number 0801-12-25. The PI for both funded projects is Hani H. Titi.
Acknowledgments
The authors thank the staff of the Wisconsin DOT for their assistance in acquiring and interpreting permit data, especially Kathleen Nichols, Edward Lalor, Daniel Mulder, Laura Fenley, and Bill Wondrachek. The authors thank Paul Trombino III, Iowa DOT Director for his help and support. The authors would like to acknowledge the effort of Alise Fitzsimmons in reviewing the manuscript.
Conflicts of Interest
The authors declare no conflict of interest.
References
- Adams, T.; Malaikrisanachalle, S.; Blazquez, C.; Vonderhoe, A.P. GIS-Based Oversize/Overweight Vehicle Routing System; Technical Report 0092-45-19; Department of Civil and Environmental Engineering, University of Wisconsin-Madison: Madison, WI, USA, 2002. [Google Scholar]
- Adams, T.; Perry, E.; Schwartz, A.; Gollnik, B.; Kang, M.; Bittner, J.; Wagner, S. Aligning Oversize/Overweight Permit Fees with Agency Costs: Critical Issues; National Center for Freight and Infrastructure Research and Education (CFIRE): Madison, WI, USA, 2013. [Google Scholar]
- Federal Highway Administration (FHWA). MAP-21 Comprehensive Truck Size and Weight Limits Study. Available online: http://ops.fhwa.dot.gov/freight/sw/map21tswstudy/index.htm (accessed on 14 June 2018).
- Federal Highway Administration (FHWA). Commercial Vehicle Size and Weight Program. Available online: http://ops.fhwa.dot.gov/Freight/sw/overview/index.htm (accessed on 14 June 2018).
- Federal Highway Administration (FHWA). Comprehensive Truck Size and Weight Limits Study: Compliance Comparative Analysis Technical Report; U.S. Department of Transportation: Washington, DC, USA, 2015.
- Federal Highway Administration (FHWA). Maine-Vermont Interstate Highway Heavy Truck Pilot Program: 6-Month Report. Available online: http://ops.fhwa.dot.gov/freight/sw/reports/me_vt_pilot_2012/ (accessed on 14 June 2018).
- Federal Highway Administration (FHWA). FHWA Vehicle Types. Available online: http://www.fhwa.dot.gov/policy/ohpi/vehclass.htm (accessed on 14 June 2018).
- New York State Department of Transportation Oversize/Overweight Vehicle Pre-Screening Tool (OS/OW PST). Available online: https://www.dot.ny.gov/gisapps/osowscreen (accessed on 14 June 2018).
- North Carolina Department of Transportation. The NCDOT ARPS Internet Permit Application System. Available online: https://connect.ncdot.gov/business/trucking/Pages/overpermits.aspx (accessed on 14 June 2018).
- Dey, K.C.; Chowdhury, M.; Pang, W.; Putman, B.J.; Chen, L. Estimation of Pavement and Bridge Damage Costs Caused by Overweight Trucks. J. Transp. Res. Rec. 2014, 2411, 62–71. [Google Scholar] [CrossRef]
- Dey, K.C.; Chowdhury, M.; Wiecek, M.; Dunning, A. Infrastructure Damage-Cost-Recovery Fee for Overweight Trucks: Tradeoff Analysis Framework. ASCE J. Transp. Eng. 2015, 141. [Google Scholar] [CrossRef]
- Prozzi, J.; Murphy, M.; Loftus-Otway, L.; Banerjee, A.; Kim, M.; Wu, H.; Prozzi, J.P.; Hutchison, R.; Harrison, R.; Walton, C.M.; et al. Oversize/Overweight Vehicle Permit Fee Study; Report No. FHWA/TX-13/0-6736-2; Prepared for the Center for Transportation Research; University of Texas: Austin, TX, USA, 2012. [Google Scholar]
- Ahmed, A.; Lavrenz, S.; Labi, S. Highway User Fees for Overweight Trucks: Consequences of Deviations from the 4th Power Law. Int. J. Sustain. Transp. 2015, 10, 567–577. [Google Scholar] [CrossRef]
- Everett, S.; Athigakunagorn, A.; Roshandeh, A.M.; Labi, S.; Sinha, K. A Geographic Information Systems (GIS) Tool for Enhancing Overweight-Vehicle Permitting Administration. J. Transp. Res. Board 2015, 2478, 75–81. [Google Scholar] [CrossRef]
- Virginia Transportation Research Council. A Review of the Current Overweight Permit Fee Structure in Virginia (HB 1551). 2015. Available online: http://www.fairfaxfederation.org/committees/Transportation/081125OverweightPermitFeeStructureReportEdited.pdf (accessed on 14 June 2018).
- Zhao, J.; Tabatabai, H. Analysis of Permit Loads in Wisconsin; Report No. WHRP 09-03; Wisconsin Department of Transportation: Madison, WI, USA, 2009.
- Tabatabai, H.; Titi, H.H.; Zhao, J. Probabilistic Assessment of Load Effects on Bridges due to Various Classes of Heavy Trucks. J. Eng. Struct. 2017, 140, 189–198. [Google Scholar] [CrossRef]
- Moloney, M.; McKenna, T.; Fitzgibbon, K.; McKeogh, E. Quality data for strategic infrastructure decisions in Ireland. Infrastruct. Asset Manag. 2017, 4, 40–49. [Google Scholar] [CrossRef]
- Dawson, R.; Walsh, C.; Purnell, P.; Rogers, C. Briefing: Infrastructure business models, valuation and innovation for local delivery. Infrastruct. Asset Manag. 2015, 1, 66–67. [Google Scholar] [CrossRef]
- Simpson, D.; Harris, N. Briefing: An Integrated Approach to Asset Management System IT Selection and Implementation. Infrastruct. Asset Manag. 2017, 4, 83–86. [Google Scholar] [CrossRef]
- Ohio Department of Transportation. Impacts of Permitted Trucking on Ohio’s Transportation System and Economy. Final Report, Columbus, OH; 2009. Available online: https://www.dot.state.oh.us/Divisions/Legislative/Documents/ImpactsofPermittedTrucking-Web.pdf (accessed on 14 June 2018).
- American Association of State Highway and Transportation Officials (AASHTO). AASHTOWare Pavement ME Design Software; AASHTO: Washington, DC, USA, 2018. [Google Scholar]
- Titi, H.H.; Coley, N.; Latifi, V.; Matar, M. Characterization of Overweight Permitted Truck Routes and Loads in Wisconsin. Transp. Res. Rec. J. Transp. Res. Board 2014, 2411, 72–81. [Google Scholar] [CrossRef]
- Latifi, V. Evaluation of Pavement Performance Due to Overload Single Trip Permit Truck Traffic in Wisconsin. Master’s Thesis, University of Wisconsin, Milwaukee, WI, USA, 2014. [Google Scholar]
- Coley, N.; Titi, H.H.; Latifi, V. Mapping Overweight Vehicle Permits for Pavement Engineering Applications. J. Transp. Eng. 2016, 142. [Google Scholar] [CrossRef]
- Shneiderman, B. Designing the User Interface: Strategies for Effective Human-Computer Interaction; Pearson Education India: Delhi, India, 2010. [Google Scholar]
- Wisconsin Department of Transportation (WisDOT). Oversize-Overweight Permits. Available online: http://www.dot.wisconsin.gov/business/carriers/osowgeneral.htm (accessed on 14 June 2018).
- Nielsen, J. 10 Usability Heuristics for User Interface Design; Nielsen Norman Group.: Fremont, CA, USA, 1995. [Google Scholar]
Figure 1.
Architecture of the OSOW Permit Query Portal framework.

Figure 2.
User interface page layout.

Figure 3.
Sample query input and output. (a) Sample Query to find permits which travelled on at some point during their route through segment ID = 11354; (b) Sample Query to find permits which travelled on at some point during their route through intersection ID = 463; (c) Results visualized on the map based on the query conducted in (a); (d) Results visualized on the map based on the query conducted in (b).

Figure 4.
Querying results using Intersection ID and viewing tabular results. (a) Intersection and turning movement searches; (b) Intersection ID value from the integrated map by clicking on the intersection point on the map; (c) Tabular results displayed in the lower half of the window.
Figure 4.
Querying results using Intersection ID and viewing tabular results. (a) Intersection and turning movement searches; (b) Intersection ID value from the integrated map by clicking on the intersection point on the map; (c) Tabular results displayed in the lower half of the window.

Figure 5.
Sample output for use cases involving time ranges, weight ranges, and origin/destination states. (a) Search for vehicles load weight between 80,000 lb and 270,000 lb. Over Weight (OW), in the period 2015–2016; (b) Results visualized for all Over Weight vehicles between 80,000 lb. and 270,000 lb. in the period 2015–2016; (c) Search for vehicles load weight greater than 270,000 lb. Super Heavy Load (SHL), in the period 2007–2016; (d) Results visualized for all Super Heavy vehicles between above 270,000 lb. in the period 2007–2016.

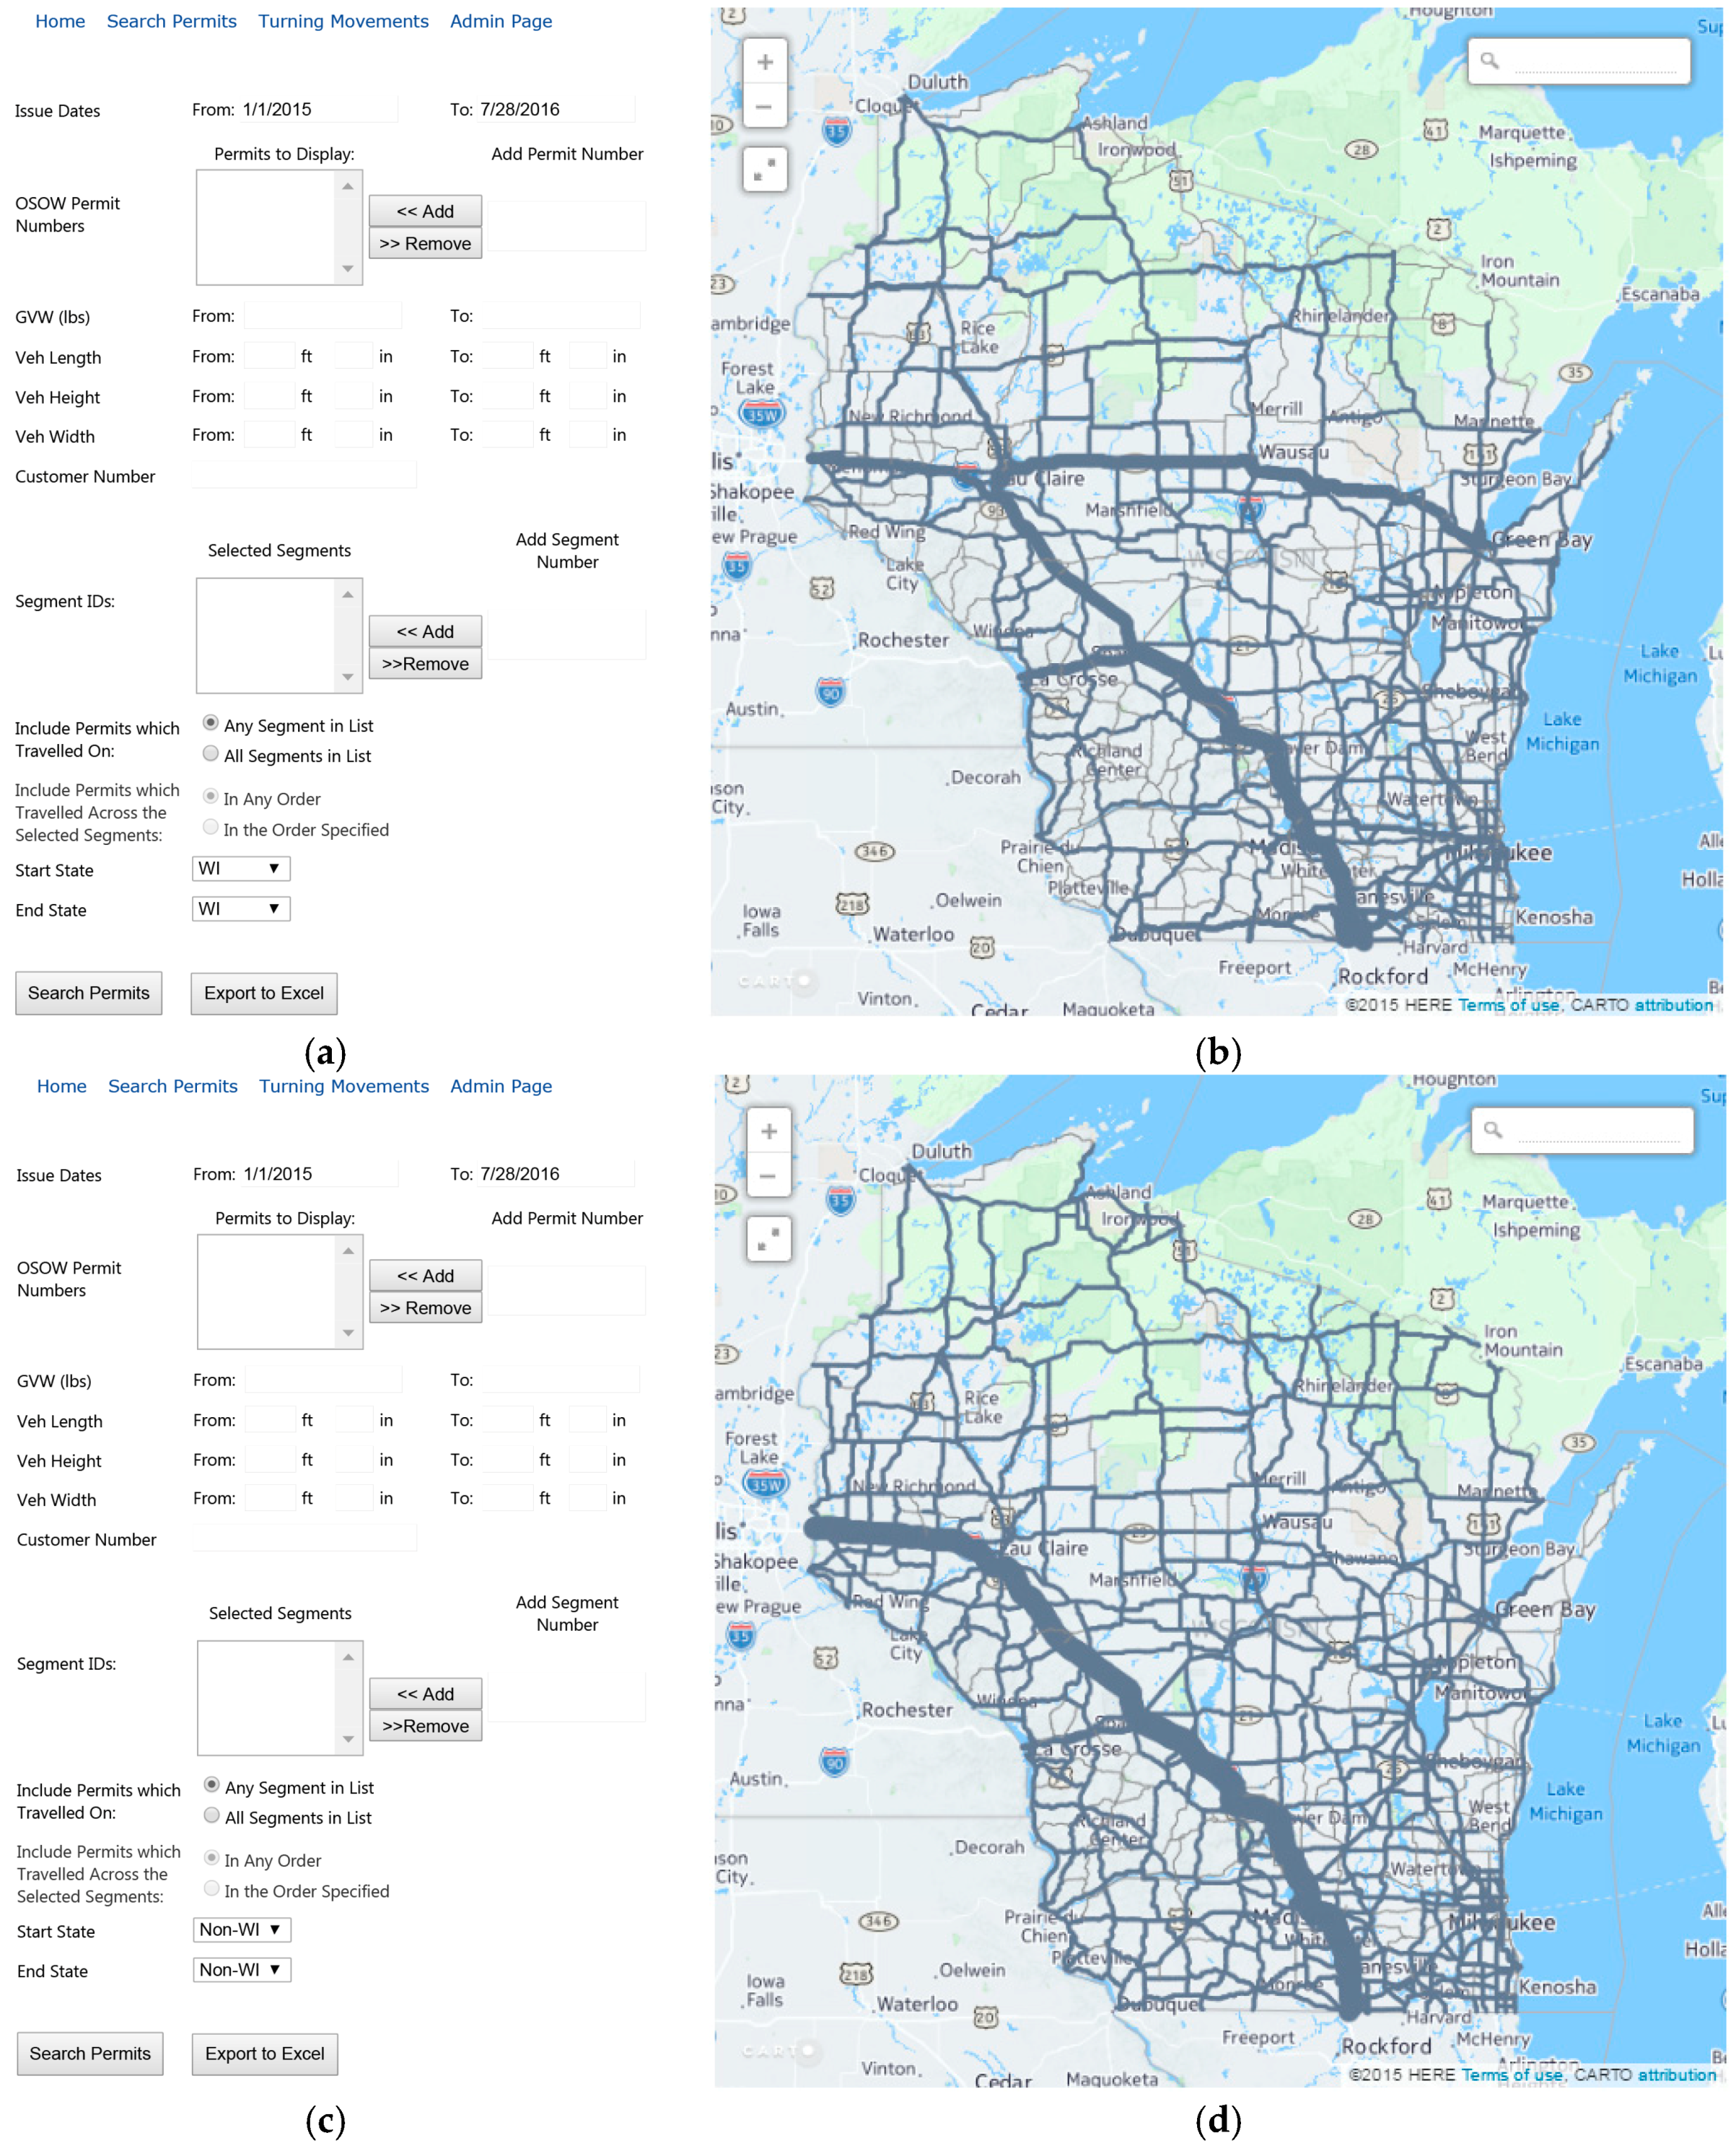
Figure 6.
Sample output for use cases involving time ranges, weight ranges, and origin/destination states. (a) Search for all the in-state routes (starts and ends in state of Wisconsin); (b) Results visualized for all in-state routes (starts and ends in state of Wisconsin) permits generated; (c) Search for all the Out-of-state routes (starts and ends out of State of Wisconsin); (d) Results visualized for all out-of-state routes (starts and ends out of State of Wisconsin).

Figure 7.
Post-Test Questionnaire Summary Results.


Table 1.
Heuristic Evaluations of the OSOW Query Interface.
| Evaluation Criteria | OSOW System Design Feature | Score | Comments | Final Score |
|---|---|---|---|---|
| Visibility of System State | Consistent UI design across the system | 8 | [+] Page headers are consistent on all pages. [+] Navigation buttons on are consistent across all pages. [+] The search results interface is consistent. [−] The search and export buttons are all consistent across pages. [−] Choice of color and font for results, labels and error messages are consistent across pages and within the page itself [−] The map position and format are consistent across pages | 8 |
| Selected page can be distinguished among unselected pages | 8 | [+] In the navigation bar panel, a selected page has different color than the other unselected pages. | ||
| Error messages appear in the same place(s) across the system | 9 | [+] All messages appear above search controls | ||
| Naming convention in the system consistent with the user's task domain | 7 | [+] The system messages used in the OSOW system are clear and consistent with the users’ tasks domain. [+] Some key terms, such as “vehicle length” are clearly defined | ||
| Match Between System and the Real World | Icons are concrete and familiar across the system | 7 | [+] The labels for the system icons and buttons consistent with the actions used for emergency, maintenance, and disabilities are consistent with. [−] Need an icon for the Admin/Superuser button. | 7 |
| User Control and Freedom | Users can not select more than one task simultaneously | 9 | [+] The system separates functionalities and prevented the user to select more than one task at the same time. [−] User interface is not designed to support simultaneous button presses. | 7.5 |
| The user cannot enter over maximum limit of the data input. User cannot enter out of range data. | 6 | [+] Start State and End State selection controls only shows existing states available for searching. [−] There is no way to prevent a user from typing in a non-existent OSOW Permit Number. | ||
| Consistency and Standards | Font type and size are consistent in all system screens | 9 | [+] The font type and size used in all pages are using the standard font characteristics used for the same action domain. [+] Messages shown on status display use same font size. [−] Font sizes differ between status display and the search export buttons. | 9 |
| System theme consistent in all system screens. | 9 | [+] The system theme which is used in the pages are consistent in all system screens for control interfaces. | ||
| Icons and buttons are consistent in all system screens | 9 | [+] Same search and export buttons used for both search pages. [+] Same map interface used across pages. [+] Same search fields/controls used in the search pages. | ||
| Aesthetic and Minimalist Design | Only essential information is shown to the user. Irrelevant information is kept to a minimum. | 7 | [+] Only show status messages on control interfaces that are relevant to the current or most recently completed task. -Pressing search button should result in displaying the results according to the search criteria [−] Consider grouping service and admin buttons into a single button that would cause a menu to appear. This is because primary users would not be interested in these features. | 7 |
| Labels are brief, familiar, and descriptive. | 7 | [+] The labels for the system icons and buttons consistent with the actions used. [−] Need more clarity on what “Export Excel” and “Export image” buttons do. | ||
| Help Users Recognize, Diagnose, and Recover from Errors | Error messages worded in a way so that users would not take the blame. | 8 | [+] The system error messages are friendly to the user and don’t use tough word or impropriate punctuations. [−] Reconsider usage of all caps in status interface, although it helps with readability. | 9 |
| Error messages are grammatically and syntactically correct | 10 | The system messages on all interfaces use valid English phrases. | ||
| Error messages does not contain any exclamation marks in them. | 10 | [+] The system error messages are friendly to the user and don’t use tough word or impropriate punctuations. | ||
| Error messages inform the users the cause of the error. | 8 | [+] The system messages inform the user the reason of the error happens [−] Need to ensure messages inform the user what to do next (such as enter a valid number within range between x-XX). | ||
| Help and Documentation | Help information is visible. | 1 | [−] Interfaces do not contain a button called “Help”. [−] Authors focused on trying to make system as intuitive as possible without the aid of a manual or online documentation. | 3.6 |
| Help information is easy to search. | 9 | [+] A well written documentation was provided to help people use the framework. | ||
| Help information should not be too large. | 1 | [−] The manual was precise and on the point how to use the framework with steps. |
© 2018 by the authors. Licensee MDPI, Basel, Switzerland. This article is an open access article distributed under the terms and conditions of the Creative Commons Attribution (CC BY) license (http://creativecommons.org/licenses/by/4.0/).
Share and Cite
MDPI and ACS Style
Shatnawi, A.S.; Coley, N.; Titi, H.H. Interactive Data Framework and User Interface for Wisconsin’s Oversize-Overweight Vehicle Permits. Data 2018, 3, 20. https://doi.org/10.3390/data3020020
AMA Style
Shatnawi AS, Coley N, Titi HH. Interactive Data Framework and User Interface for Wisconsin’s Oversize-Overweight Vehicle Permits. Data. 2018; 3(2):20. https://doi.org/10.3390/data3020020
Chicago/Turabian StyleShatnawi, Ahmed S., Nicholas Coley, and Hani H. Titi. 2018. "Interactive Data Framework and User Interface for Wisconsin’s Oversize-Overweight Vehicle Permits" Data 3, no. 2: 20. https://doi.org/10.3390/data3020020