Candidate Genes for Aggressiveness in a Natural Fusarium culmorum Population Greatly Differ between Wheat and Rye Head Blight


Abstract
:
1. Introduction
2. Materials and Methods
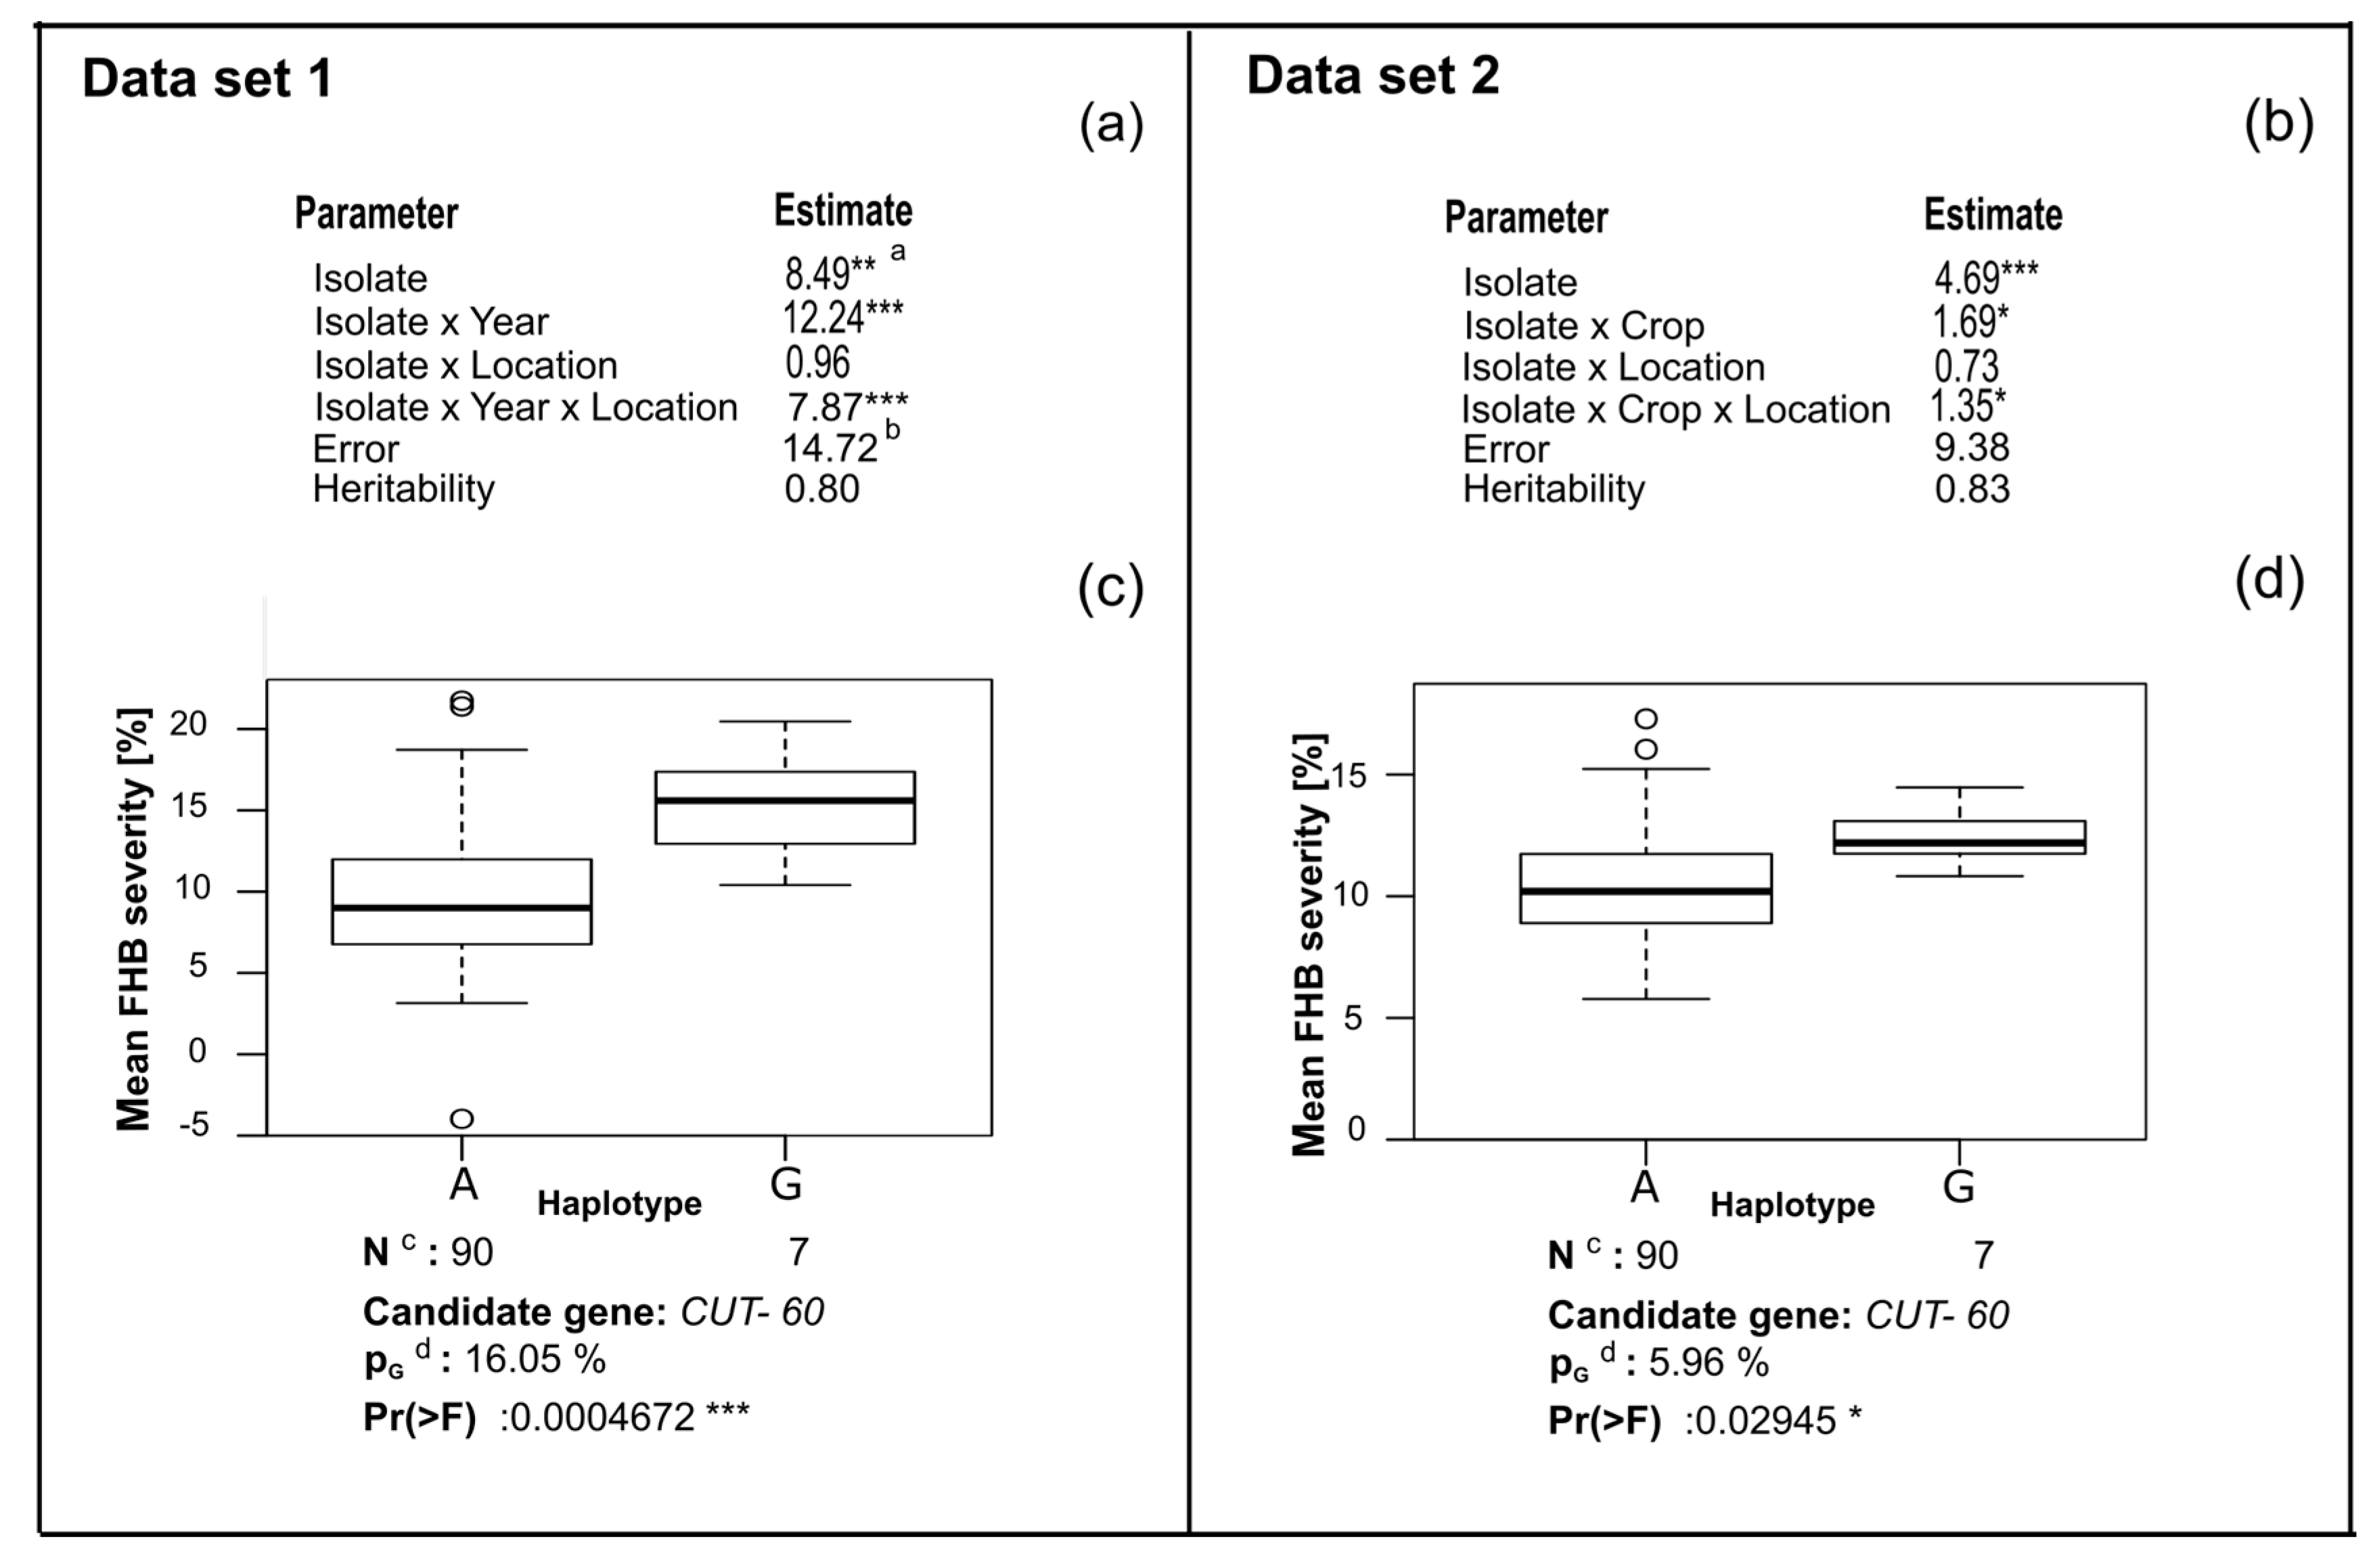
- Data set 1: Rye 2015 + 2016 across 2 locations per yearyijn = μ + Isoi + Yearj + Lock + (Year × Loc)jk + (Year × Loc × Rep)jkn + (Iso × Year)ij + (Iso × Loc)ik + (Iso × Year × Loc)ijk + (Year × Loc × Block)ikm + eijkmn,
- Data set 2: Rye & wheat 2015 across 2 locationsyijn = μ + Isoi + Cropl + Lock + (Crop × Loc)lk + (Crop × Year)jk + (Crop × Loc × Rep)lkn + (Iso × Crop)il + (Iso × Loc)ik + (Iso × Crop × Loc)ilk + (Crop × Loc × Rep × Block)iklm + eilknm,
3. Results
4. Discussion
4.1. Analysis of Phenotypic Data
4.2. Candidate Gene Association Mapping
4.3. CUT Gene Is Associated with Aggressiveness in Rye
4.4. Location of the SNP
5. Conclusions
Supplementary Materials
Acknowledgments
Author Contributions
Conflicts of Interest
References
- Parry, D.W.; Jenkinson, P.; McLeod, L. Fusarium Ear Blight (Scab) in small-grain cereals—A review. Plant Pathol. 1995, 44, 207–238. [Google Scholar] [CrossRef]
- Desjardins, A.E.; Proctor, R.H. Molecular biology of Fusarium mycotoxins. Int. J. Food Microbiol. 2007, 119, 47–50. [Google Scholar] [CrossRef] [PubMed]
- Nganje, W.E.; Kaitibie, S.; Wilson, W.W.; Leistritz, F.L.; Bangsund, D.A. Economic Impacts of Fusarium Head Blight in Wheat and Barley: 1993–2001; North Dakota State University: Fargo, ND, USA, 2004; ISBN 5907900075. [Google Scholar]
- Bateman, G.L. The contribution of ground-level inoculum of Fusarium culmorum to ear blight of winter wheat. Plant Pathol. 2005, 54, 299–307. [Google Scholar] [CrossRef]
- McMullen, M.; Jones, R.; Gallenberg, D. Scab of wheat and barley: A re-emerging disease of devastating impact. Plant Dis. 1997, 81, 1340–1348. [Google Scholar] [CrossRef]
- Lewandowski, S.M.; Bushnell, W.R.; Evans, C.K. Distribution of mycelial colonies and lesions in field-grown barley inoculated with Fusarium graminearum. Phytopathology 2006, 96, 567–581. [Google Scholar] [CrossRef] [PubMed]
- Walter, S.; Nicholson, P.; Doohan, F.M. Action and reaction of host and pathogen during Fusarium head blight disease. New Phytol. 2010, 185, 54–66. [Google Scholar] [CrossRef] [PubMed]
- Kazan, K.; Gardiner, D.M.; Manners, J.M. On the trail of a cereal killer: Recent advances in Fusarium graminearum pathogenomics and host resistance. Mol. Plant Pathol. 2012, 13, 399–413. [Google Scholar] [CrossRef] [PubMed]
- Goswami, R.S.; Kistler, H.C. Heading for disaster: Fusarium graminearum on cereal crops. Mol. Plant Pathol. 2004, 5, 515–525. [Google Scholar] [CrossRef] [PubMed]
- Kimura, M.; Tokai, T.; O’Donnell, K.; Ward, T.J.; Fujimura, M.; Hamamoto, H.; Shibata, T.; Yamaguchi, I. The trichothecene biosynthesis gene cluster of Fusarium graminearum F15 contains a limited number of essential pathway genes and expressed non-essential genes. FEBS Lett. 2003, 539, 105–110. [Google Scholar] [CrossRef]
- VanderplanK, J.E. Disease Resistance in Plants, 2nd ed.; Academic Press: New York, NY, USA, 1984. [Google Scholar]
- Miedaner, T.; Schilling, A.G.; Geiger, H.H. Competition effects among isolates of Fusarium culmorum differing in aggressiveness and mycotoxin production on heads of winter rye. Eur. J. Plant Pathol. 2004, 110, 63–70. [Google Scholar] [CrossRef]
- Cumagun, C.J.R.; Miedaner, T. Segregation for aggressiveness and deoxynivalenol production of a population of Gibberella zeae causing head blight of wheat. Eur. J. Plant Pathol. 2004, 110, 789–799. [Google Scholar] [CrossRef]
- Castiblanco, V.; Marulanda, J.J.; Würschum, T.; Miedaner, T. Candidate gene based association mapping in Fusarium culmorum for field quantitative pathogenicity and mycotoxin production in wheat. BMC Genet. 2017, 18, 49. [Google Scholar] [CrossRef] [PubMed]
- Cumagun, C.J.R.; Bowden, R.L.; Jurgenson, J.E.; Leslie, J.F.; Miedaner, T. Genetic mapping of pathogenicity and aggressiveness of Gibberella zeae (Fusarium graminearum) toward wheat. Phytopathology 2004, 94, 520–526. [Google Scholar] [CrossRef] [PubMed]
- Becher, R.; Miedaner, T.W.S. Biology, diversity, and management of FHB causing Fusarium species in small-grain cereals. In Agricultural Applications, 2nd ed.; Kempken, F., Ed.; The Mycota XI. Springer: Berlin/Heidelberg, Germany, 2013; pp. 199–241. [Google Scholar]
- Cuomo, C.A.; Güldener, U.; Xu, J.-R.; Trail, F.; Turgeon, B.G.; Di Pietro, A.; Walton, J.D.; Ma, L.-J.; Baker, S.E.; Rep, M.; et al. The Fusarium graminearum genome reveals a link between localized polymorphism and pathogen specialization. Science 2007, 317, 1400–1402. [Google Scholar] [CrossRef] [PubMed]
- King, R.; Urban, M.; Hammond-Kosack, M.C.U.; Hassani-Pak, K.; Hammond-Kosack, K.E. The completed genome sequence of the pathogenic ascomycete fungus Fusarium graminearum. BMC Genom. 2015, 16, 544. [Google Scholar] [CrossRef] [PubMed]
- Kwon, J.M.; Goate, A.M. The candidate gene approach. Alcohol Res. Health 2000, 24, 164–168. [Google Scholar] [PubMed]
- Collins, F.S.; Guyer, M.S.; Chakravarti, A. Variations on a theme: Cataloging human DNA sequence variation. Science 1997, 278, 1580–1581. [Google Scholar] [CrossRef] [PubMed]
- Talas, F.; Würschum, T.; Reif, J.C.; Parzies, H.K.; Miedaner, T. Association of single nucleotide polymorphic sites in candidate genes with aggressiveness and deoxynivalenol production in Fusarium graminearum causing wheat head blight. BMC Genet. 2012, 13, 14. [Google Scholar] [CrossRef] [PubMed]
- Talas, F.; Kalih, R.; Miedaner, T.; McDonald, B.A. Genome-wide association study identifies novel candidate genes for aggressiveness, deoxynivalenol production, and azole sensitivity in natural field populations of Fusarium graminearum. Mol. Plant-Microbe Interact. 2016, 29, 417–430. [Google Scholar] [CrossRef] [PubMed]
- Scherm, B.; Balmas, V.; Spanu, F.; Pani, G.; Delogu, G.; Pasquali, M.; Migheli, Q. Fusarium culmorum: Causal agent of foot and root rot and head blight on wheat. Mol. Plant Pathol. 2013, 14, 323–341. [Google Scholar] [CrossRef] [PubMed]
- Food and Agriculture Organization of the United Nations (FAOSTAT). Data Crops. Available online: http://www.fao.org/faostat/en/#data/QC (accessed on 26 November 2017).
- Miedaner, T.; Caixeta, F.; Talas, F. Head-blighting populations of Fusarium culmorum from Germany, Russia, and Syria analyzed by microsatellite markers show a recombining structure. Eur. J. Plant Pathol. 2013, 137, 743–752. [Google Scholar] [CrossRef]
- Talas, F.; Parzies, H.K.; Miedaner, T. Diversity in genetic structure and chemotype composition of Fusarium graminearum sensu stricto populations causing wheat head blight in individual fields in Germany. Eur. J. Plant Pathol. 2011, 131, 39–48. [Google Scholar] [CrossRef]
- Mazur, P.; Schmidt, J.J. Interactions of cooling velocity, temperature, and warming velocity on the survival of frozen and thawed yeast. Cryobiology 1968, 5, 1–17. [Google Scholar] [CrossRef]
- Utz, H.F. PLABSTAT; Version 2N; A Computer Program for the Computation of Variances and Covariances; Institute of Plant Breeding, Seed Science, and Population Genetics, University of Hohenheim: Stuttgart, Germany, 2007. [Google Scholar]
- Bernal-Vasquez, A.M.; Utz, H.F.; Piepho, H.P. Outlier detection methods for generalized lattices: A case study on the transition from ANOVA to REML. Theor. Appl. Genet. 2016, 129, 787–804. [Google Scholar] [CrossRef] [PubMed]
- Stram, D.O.; Lee, J.W. Variance components testing in the longitudinal mixed effects model. Biometrics 1994, 50, 1171–1177. [Google Scholar] [CrossRef] [PubMed]
- Piepho, H.-P.; Möhring, J. Computing heritability and selection response from unbalanced plant breeding trials. Genetics 2007, 177, 1881–1888. [Google Scholar] [CrossRef] [PubMed]
- Gilmour, A.R.; Gogel, B.J.; Cullis, B.R.; Thompson, R. ASReml User Guide Release 3.0; VSN International Ltd.: Hemel Hempstead, UK, 2009. [Google Scholar]
- Rampitsch, C.; Day, J.; Subramaniam, R.; Walkowiak, S. Comparative secretome analysis of Fusarium graminearum and two of its non-pathogenic mutants upon deoxynivalenol induction in vitro. Proteomics 2013, 13, 1913–1921. [Google Scholar] [CrossRef] [PubMed]
- Lysenko, A.; Urban, M.; Bennett, L.; Tsoka, S.; Janowska-Sejda, E.; Rawlings, C.J.; Hammond-Kosack, K.E.; Saqi, M. Network-based data integration for selecting candidate virulence associated proteins in thecereal infecting fungus Fusarium graminearum. PLoS ONE 2013, 8, e67926. [Google Scholar] [CrossRef] [PubMed]
- Wang, C.; Zhang, S.; Hou, R.; Zhao, Z.; Zheng, Q.; Xu, Q.; Zheng, D.; Wang, G.; Liu, H.; Gao, X.; et al. Functional analysis of the kinome of the wheat scab fungus Fusarium graminearum. PLoS Pathog. 2011, 7, e1002460. [Google Scholar] [CrossRef] [PubMed]
- Gu, Q.; Chen, Y.; Liu, Y.; Zhang, C.; Ma, Z. The transmembrane protein FgSho1 regulates fungal development and pathogenicity via the MAPK module Ste50-Ste11-Ste7 in Fusarium graminearum. New Phytol. 2015, 206, 315–328. [Google Scholar] [CrossRef] [PubMed]
- Zheng, D.; Zhang, S.; Zhou, X.; Wang, C.; Xiang, P.; Zheng, Q.; Xu, J.-R. The FgHOG1 pathway regulates hyphal growth, stress responses, and plant infection in Fusarium graminearum. PLoS ONE 2012, 7, e49495. [Google Scholar] [CrossRef] [PubMed]
- Nasmith, C.G.; Walkowiak, S.; Wang, L.; Leung, W.W.Y.; Gong, Y.; Johnston, A.; Harris, L.J.; Guttman, D.S.; Subramaniam, R. Tri6 is a global transcription regulator in the phytopathogen Fusarium graminearum. PLoS Pathog. 2011, 7, e1002266. [Google Scholar] [CrossRef] [PubMed]
- Lanver, D.; Mendoza-Mendoza, A.; Brachmann, A.; Kahmann, R. Sho1 and Msb2-related proteins regulate appressorium development in the smut fungus Ustilago maydis. Plant Cell 2010, 22, 2085–2101. [Google Scholar] [CrossRef] [PubMed]
- Blümke, A.; Falter, C.; Herrfurth, C.; Sode, B.; Bode, R.; Schäfer, W.; Feussner, I.; Voigt, C.A. Secreted fungal effector lipase releases free fatty acids to inhibit innate immunity-related callose formation during wheat head infection. Plant Physiol. 2014, 165, 346–358. [Google Scholar] [CrossRef] [PubMed]
- Voigt, C.A.; Schäfer, W.; Salomon, S. A secreted lipase of Fusarium graminearum is a virulence factor required for infection of cereals. Plant J. 2005, 42, 364–375. [Google Scholar] [CrossRef] [PubMed]
- HelmholtzZentrum München. Fusarium graminearum Genome Database. Available online: https://www.helmholtz-muenchen.de/ibis/institute/groups/fungal-microbial-genomics/resources/fgdb/index.html (accessed on 26 November 2017).
- Yu, J.; Pressoir, G.; Briggs, W.H.; Vroh Bi, I.; Yamasaki, M.; Doebley, J.F.; McMullen, M.D.; Gaut, B.S.; Nielsen, D.M.; Holland, J.B.; et al. A unified mixed-model method for association mapping that accounts for multiple levels of relatedness. Nat. Genet. 2006, 38, 203–208. [Google Scholar] [CrossRef] [PubMed]
- Aulchenko, Y.S.; Ripke, S.; Isaacs, A.; van Duijn, C.M. GenABEL: An R library for genome-wide association analysis. Bioinformatics 2007, 23, 1294–1296. [Google Scholar] [CrossRef] [PubMed]
- R Development Core Team. R: A Language and Environment for Statistical Computing [Computer Software]; The R Foundation for Statistical Computing: Vienna, Austria, 2016. [Google Scholar]
- GenABEL Package. Available online: http://www.genabel.org/packages/GenABEL (accessed on 26 November 2017).
- Paradis, E.; Claude, J.; Strimmer, K. APE: Analyses of phylogenetics and evolution in R language. Bioinformatics 2004, 20, 289–290. [Google Scholar] [CrossRef] [PubMed]
- Ape: Analyses of Phylogenetics and Evolution. Available online: https://cran.r-project.org/web/packages/ape/index.html (accessed on 26 November 2017).
- Tabor, H.K.; Risch, N.J.; Myers, R.M. Candidate-gene approaches for studying complex genetic traits: Practical considerations. Nat. Rev. Genet. 2002, 3, 391–397. [Google Scholar] [CrossRef] [PubMed]
- Wilson, L.M.; Whitt, S.R.; Ibáñez, A.M.; Rocheford, T.R.; Goodman, M.M.; Buckler, E.S. Dissection of maize kernel composition and starch production by candidate gene association. Plant Cell 2004, 16, 2719–2733. [Google Scholar] [CrossRef] [PubMed]
- Weber, A.; Clark, R.M.; Vaughn, L.; de Jesús Sánchez-Gonzalez, J.; Yu, J.; Yandell, B.S.; Bradbury, P.; Doebley, J. Major regulatory genes in maize contribute to standing variation in Teosinte. Genetics 2007, 177, 2349–2359. [Google Scholar] [CrossRef] [PubMed]
- Huang, X.; Wei, X.; Sang, T.; Zhao, Q.; Feng, Q.; Zhao, Y.; Li, C.; Zhu, C.; Lu, T.; Zhang, Z.; et al. Genome-wide association studies of 14 agronomic traits in rice landraces. Nat. Genet. 2010, 42, 961–967. [Google Scholar] [CrossRef] [PubMed]
- Le Gouis, J.; Bordes, J.; Ravel, C.; Heumez, E.; Faure, S.; Praud, S.; Galic, N.; Remoué, C.; Balfourier, F.; Allard, V.; et al. Genome-wide association analysis to identify chromosomal regions determining components of earliness in wheat. Theor. Appl. Genet. 2012, 124, 597–611. [Google Scholar] [CrossRef] [PubMed]
- Atwell, S.; Huang, Y.S.; Vilhjalmsson, B.J.; Willems, G.; Horton, M.; Li, Y.; Meng, D.; Platt, A.; Tarone, A.M.; Hu, T.T.; et al. Genome-wide association study of 107 phenotypes in Arabidopsis thaliana inbred lines. Nature 2010, 465, 627–631. [Google Scholar] [CrossRef] [PubMed]
- Miedaner, T.; Schilling, A.G. Genetic variation of aggressiveness in individual field populations o Fusarium graminearum and Fusarium culmorum tested on young plants of winter rye. Eur. J. Plant Pathol. 1996, 102, 823–830. [Google Scholar] [CrossRef]
- Talas, F.; Kalih, R.; Miedaner, T. Within-field variation of Fusarium graminearum isolates for aggressiveness and deoxynivalenol production in wheat head blight. Phytopathology 2011, 102, 128–134. [Google Scholar] [CrossRef] [PubMed]
- McDonald, B.A.; Linde, C. Pathogen population genetics, evolutionary potential, and durable resistance. Ann. Rev. Phytopathol. 2002, 40, 349–379. [Google Scholar] [CrossRef] [PubMed]
- Dale, A.L.; Lewis, K.J.; Murray, B.W. Sexual reproduction and gene flow in the pine pathogen Dothistroma septosporum in British Columbia. Phytopathology 2010, 101, 68–76. [Google Scholar] [CrossRef] [PubMed]
- Miedaner, T.; Gang, G.; Geiger, H.H. Quantitative-genetic basis of aggressiveness of 42 isolates of Fusarium culmorum for winter rye head blight. Plant Dis. 1996, 80, 500–504. [Google Scholar] [CrossRef]
- Campbell, K.A.; Lipps, P.E. Allocation of resources: Sources of variation in fusarium head blight screening nurseries. Phytopathology 1998, 88, 1078–1086. [Google Scholar] [CrossRef] [PubMed]
- Lannou, C. Variation and selection of quantitative traits in plant pathogens. Ann. Rev. Phytopathol. 2012, 50, 319–338. [Google Scholar] [CrossRef] [PubMed]
- Doohan, F.M.; Brennan, J.; Cooke, B.M. Influence of climatic factors on Fusarium species pathogenic to cereals. Eur. J. Plant Pathol. 2003, 109, 755–768. [Google Scholar] [CrossRef]
- Van Eeuwijk, F.A.; Mesterhazy, A.; Kling, C.I.; Ruckenbauer, P.; Saur, L.; Bürstmayr, H.; Lemmens, M.; Keizer, L.C.P.; Maurin, N.; Snijders, C.H.A. Assessing non-specificity of resistance in wheat to head blight caused by inoculation with European strains of Fusarium culmorum, F. graminearum and F. nivale using a multiplicative model for interaction. Theor. Appl. Genet. 1995, 90, 221–228. [Google Scholar] [CrossRef] [PubMed]
- Miedaner, T.; Perkowski, J. Correlations among Fusarium culmorum head blight resistance, fungal colonization and mycotoxin contents in winter rye. Plant Breed. 1996, 115, 347–351. [Google Scholar] [CrossRef]
- Cook, R.J. Fusarium diseases of wheat and other small grains in North America. In Fusarium: Diseases, Biology, and Taxonomy; Pennsylvania State University Press: University Park, PA, USA, 1981; pp. 39–52. [Google Scholar]
- Mesterhazy, A. A laboratory method to predict pathogenicity of Fusarium graminearum in field and resistance of wheat to scab. Acta Phytopathol. Acad. Sci. Hung. 1984, 19, 205–218. [Google Scholar]
- Snijders, C.H.A.; Van Eeuwijk, F.A. Genotype x strain interactions for resistance to Fusarium head blight caused by Fusarium culmorum in winter wheat. Theor. Appl. Genet. 1991, 81, 239–244. [Google Scholar] [CrossRef] [PubMed]
- Stukenbrock, E.; McDonald, B. The origins of plant pathogens in agro-ecosystems. Ann. Rev. Phytopathol. 2008, 46, 75–100. [Google Scholar] [CrossRef] [PubMed]
- Urban, M.; King, R.; Andongabo, A.; Maheswari, U.; Pedro, H.; Kersey, P.; Hammond-Kosack, K. First draft genome sequence of a UK strain (UK99) of Fusarium culmorum. Genome Announc. 2016, 4, e00771-16. [Google Scholar] [CrossRef] [PubMed]
- Rep, M.; Kistler, H.C. The genomic organization of plant pathogenicity in Fusarium species. Curr. Opin. Plant Biol. 2010, 13, 420–426. [Google Scholar] [CrossRef] [PubMed]
- Miedaner, T.; Reinbrecht, C.; Lauber, U.; Schollenberger, M.; Geiger, H.H. Genotype-environment interaction on deoxynivalenol accumulation and resistance to Fusarium head blight in rye, triticale, and wheat. Plant Breed. 2001, 120, 97–105. [Google Scholar] [CrossRef]
- Langevin, F.; Eudes, F.; Comeau, A. Effect of trichothecenes produced by Fusarium graminearum during Fusarium head blight development in six cereal species. Eur. J. Plant Pathol. 2004, 110, 735–746. [Google Scholar] [CrossRef]
- Arseniuk, E.; Góral, T.; Czembor, H.J. Reaction of triticale, wheat and rye accessions to graminaceous Fusarium spp. infection at the seedling and adult plant growth stages. Euphytica 1993, 70, 175–183. [Google Scholar] [CrossRef]
- Braverman, J.M.; Hudson, R.R.; Kaplan, N.L.; Langley, C.H.; Stephan, W. The hitchhiking effect on the site frequency spectrum of DNA polymorphisms. Genetics 1995, 140, 783–796. [Google Scholar] [PubMed]
- Mackay, T.F.C.; Stone, E.A.; Ayroles, J.F. The genetics of quantitative traits: Challenges and prospects. Nat. Rev. Genet. 2009, 10, 565–577. [Google Scholar] [CrossRef] [PubMed]
- Kolattukudy, P.E. Plant waxes. Lipids 1970, 5, 259–275. [Google Scholar] [CrossRef]
- Jeffree, C.E. Structure and ontogeny of plant cuticles. In Plant Cuticles: An Integrated Functional Approach; Kerstiens, G., Ed.; BIOS Scientific Publishers Ltd.: Oxford, UK, 1996; pp. 33–82. [Google Scholar]
- Pascholati, S.F.; Deising, H.; Leiti, B.; Anderson, D.; Nicholson, R.L. Cutinase and non-specific esterase activities in the conidial mucilage of Colletotrichum graminicola. Physiol. Mol. Plant Pathol. 1993, 42, 37–51. [Google Scholar] [CrossRef]
- Francis, S.A.; Dewey, F.M.; Gurr, S.J. The role of cutinase in germling development and infection by Erysiphe graminis f.sp. hordei. Physiol. Mol. Plant Pathol. 1996, 49, 201–211. [Google Scholar] [CrossRef]
- Kolattukudy, P.E. Enzymatic penetration of the plant cuticle by fungal pathogens. Ann. Rev. Phytopathol. 1985, 23, 223–250. [Google Scholar] [CrossRef]
- Maiti, I.B.; Kolattukudy, P.E. Prevention of fungal infection of plants by specific inhibition of cutinase. Science 1979, 205, 507–508. [Google Scholar] [CrossRef] [PubMed]
- Rogers, L.M.; Flaishman, M.A.; Kolattukudy, P.E. Cutinase gene disruption in Fusarium solani f.sp. pisi decreases its virulence on pea. Plant Cell 1994, 6, 935–945. [Google Scholar] [CrossRef] [PubMed]
- Crowhurst, R.N.; Binnie, S.J.; Bowen, J.K.; Hawthorne, B.T.; Plummer, K.M.; Rees-George, J.; Rikkerink, E.H.A.; Templeton, M.D. Effect of disruption of a cutinase gene (cutA) on virulence and tissue specificity of Fusarium solani f.sp. cucurbitae race 2 Toward Cucurbita maxima and C. moschata. Mol. Plant-Microbe Interact. 1997, 10, 355–368. [Google Scholar] [CrossRef] [PubMed]
- Kang, Z.; Buchenauer, H. Cytology and ultrastructure of the infection of wheat spikes by Fusarium culmorum. Mycol. Res. 2000, 104, 1083–1093. [Google Scholar] [CrossRef]
- Wanjiru, W.M.; Zhensheng, K.; Buchenauer, H. Importance of cell wall degrading enzymes produced by Fusarium graminearum during infection of wheat heads. Eur. J. Plant Pathol. 2002, 108, 803–810. [Google Scholar] [CrossRef]
- Gui, Y.J.; Zhang, W.Q.; Zhang, D.D.; Zhou, L.; Short, D.P.G.; Wang, J.; Ma, X.F.; Li, T.G.; Kong, Z.Q.; Wang, B.L.; et al. A Verticillium dahliae extracellular cutinase modulates plant immune responses. Mol. Plant-Microbe Interact. 2018, 31, 260–273. [Google Scholar] [CrossRef] [PubMed]
- Stahl, D.J.; Schäfer, W. Cutinase is not required for fungal pathogenicity on pea. Plant Cell 1992, 4, 621–629. [Google Scholar] [CrossRef] [PubMed]
- Blein, J.-P.; Coutos-Thévenot, P.; Marion, D.; Ponchet, M. From elicitins to lipid-transfer proteins: A new insight in cell signalling involved in plant defence mechanisms. Trends Plant Sci. 2002, 7, 293–296. [Google Scholar] [CrossRef]
- Yoshida, M.; Kawada, N.; Tohnooka, T. Effect of row type, flowering type and several other spike characters on resistance to Fusarium head blight in barley. Euphytica 2005, 141, 217–227. [Google Scholar] [CrossRef]
- Juenger, T.E.; Sen, S.; Stowe, K.A.; Simms, E.L. Epistasis and genotype-environment interaction for quantitative trait loci affecting flowering time in Arabidopsis thaliana. Genetica 2005, 123, 87–105. [Google Scholar] [CrossRef] [PubMed]
- Gillespie, J.H.; Turelli, M. Genotype-environment interactions and the maintenance of polygenic variation. Genetics 1989, 121, 129–138. [Google Scholar] [PubMed]
- Jeffree, C.E. The fine structure of the plant cuticle. In Biology of the Plant Cuticle; Riederer, M., Müller, C., Eds.; Blackwell: Oxford, UK, 2006; pp. 11–125. [Google Scholar]
- Ji, X.; Jetter, R. Very long chain alkylresorcinols accumulate in the intracuticular wax of rye (Secale cereale L.) leaves near the tissue surface. Phytochemistry 2008, 69, 1197–1207. [Google Scholar] [CrossRef] [PubMed]
- Tulloch, A.P.; Hoffman, L.L. Epicuticular waxes of Secale cereale and Triticale hexaploid leaves. Phytochemistry 1974, 13, 2535–2540. [Google Scholar] [CrossRef]
- Harris, L.J.; Balcerzak, M.; Johnston, A.; Schneiderman, D.; Ouellet, T. Host-preferential Fusarium graminearum gene expression during infection of wheat, barley, and maize. Fungal Biol. 2016, 120, 111–123. [Google Scholar] [CrossRef] [PubMed]
- Kämper, J.T.; Kämper, U.; Rogers, L.M.; Kolattukudy, P.E. Identification of regulatory elements in the cutinase promoter from Fusarium solani f.sp. pisi (Nectria haematococca). J. Biol. Chem. 1994, 269, 9195–9204. [Google Scholar] [PubMed]


| Name | No. of Isolates | Origin | Host | Year of Sampling |
|---|---|---|---|---|
| 7D | 10 | Entringen, Germany | Winter Wheat | 2008 |
| 8D | 12 | Herrenberg, Germany | Winter Wheat | 2008 |
| 9D | 11 | Nufringen, Germany | Winter Wheat | 2008 |
| R | 19 | Novgorod, Russia | Winter Wheat | 1994 |
| S | 26 | Coastal mountains, Syria | Spring wheat | 2007 |
| INT | 22 | International | Different cereals | 1952–1995 |
| Rres v4.0 Annotation a | Gene | No. of SNPs b | Function and References |
|---|---|---|---|
| Genes encoding transcription factors | |||
| FGRRES_08811 | EFTU | 1 | Elongation factor 1α elicits an immune response in the host (Pathogen Associated Molecular Pattern, PAMP) and was identified as differentially secreted [33] |
| Genes encoding proteins involved in signal transduction | |||
| FGRRES_06878 | CMK1 | 1 | Predicted virulence associated protein [34], probable CMK1/2 protein kinase type I [35] |
| FGRRES_16491 | STE11 | 1 | Belongs to MAPK module regulating fungal development and pathogenicity in F. graminearum [36] |
| FGRRES_08531 | Erf2 | 1 | Associated with aggressiveness [21] |
| FGRRES_09612 | HOG1 | 3 | Regulates hyphal growth, stress responses and plant infection in F. graminearum [37] |
| FGRRES_16251 | TRI6 | 2 | Global transcription regulator in F. graminearum associated with affected severity in F. culmorum [38] |
| Genes encoding membrane proteins | |||
| FGRRES_05633 | MSB2 | 3 | Transmembrane sensor that regulates invasive growth and plant infection in fungi [36,39] |
| Genes encoding secreted proteins | |||
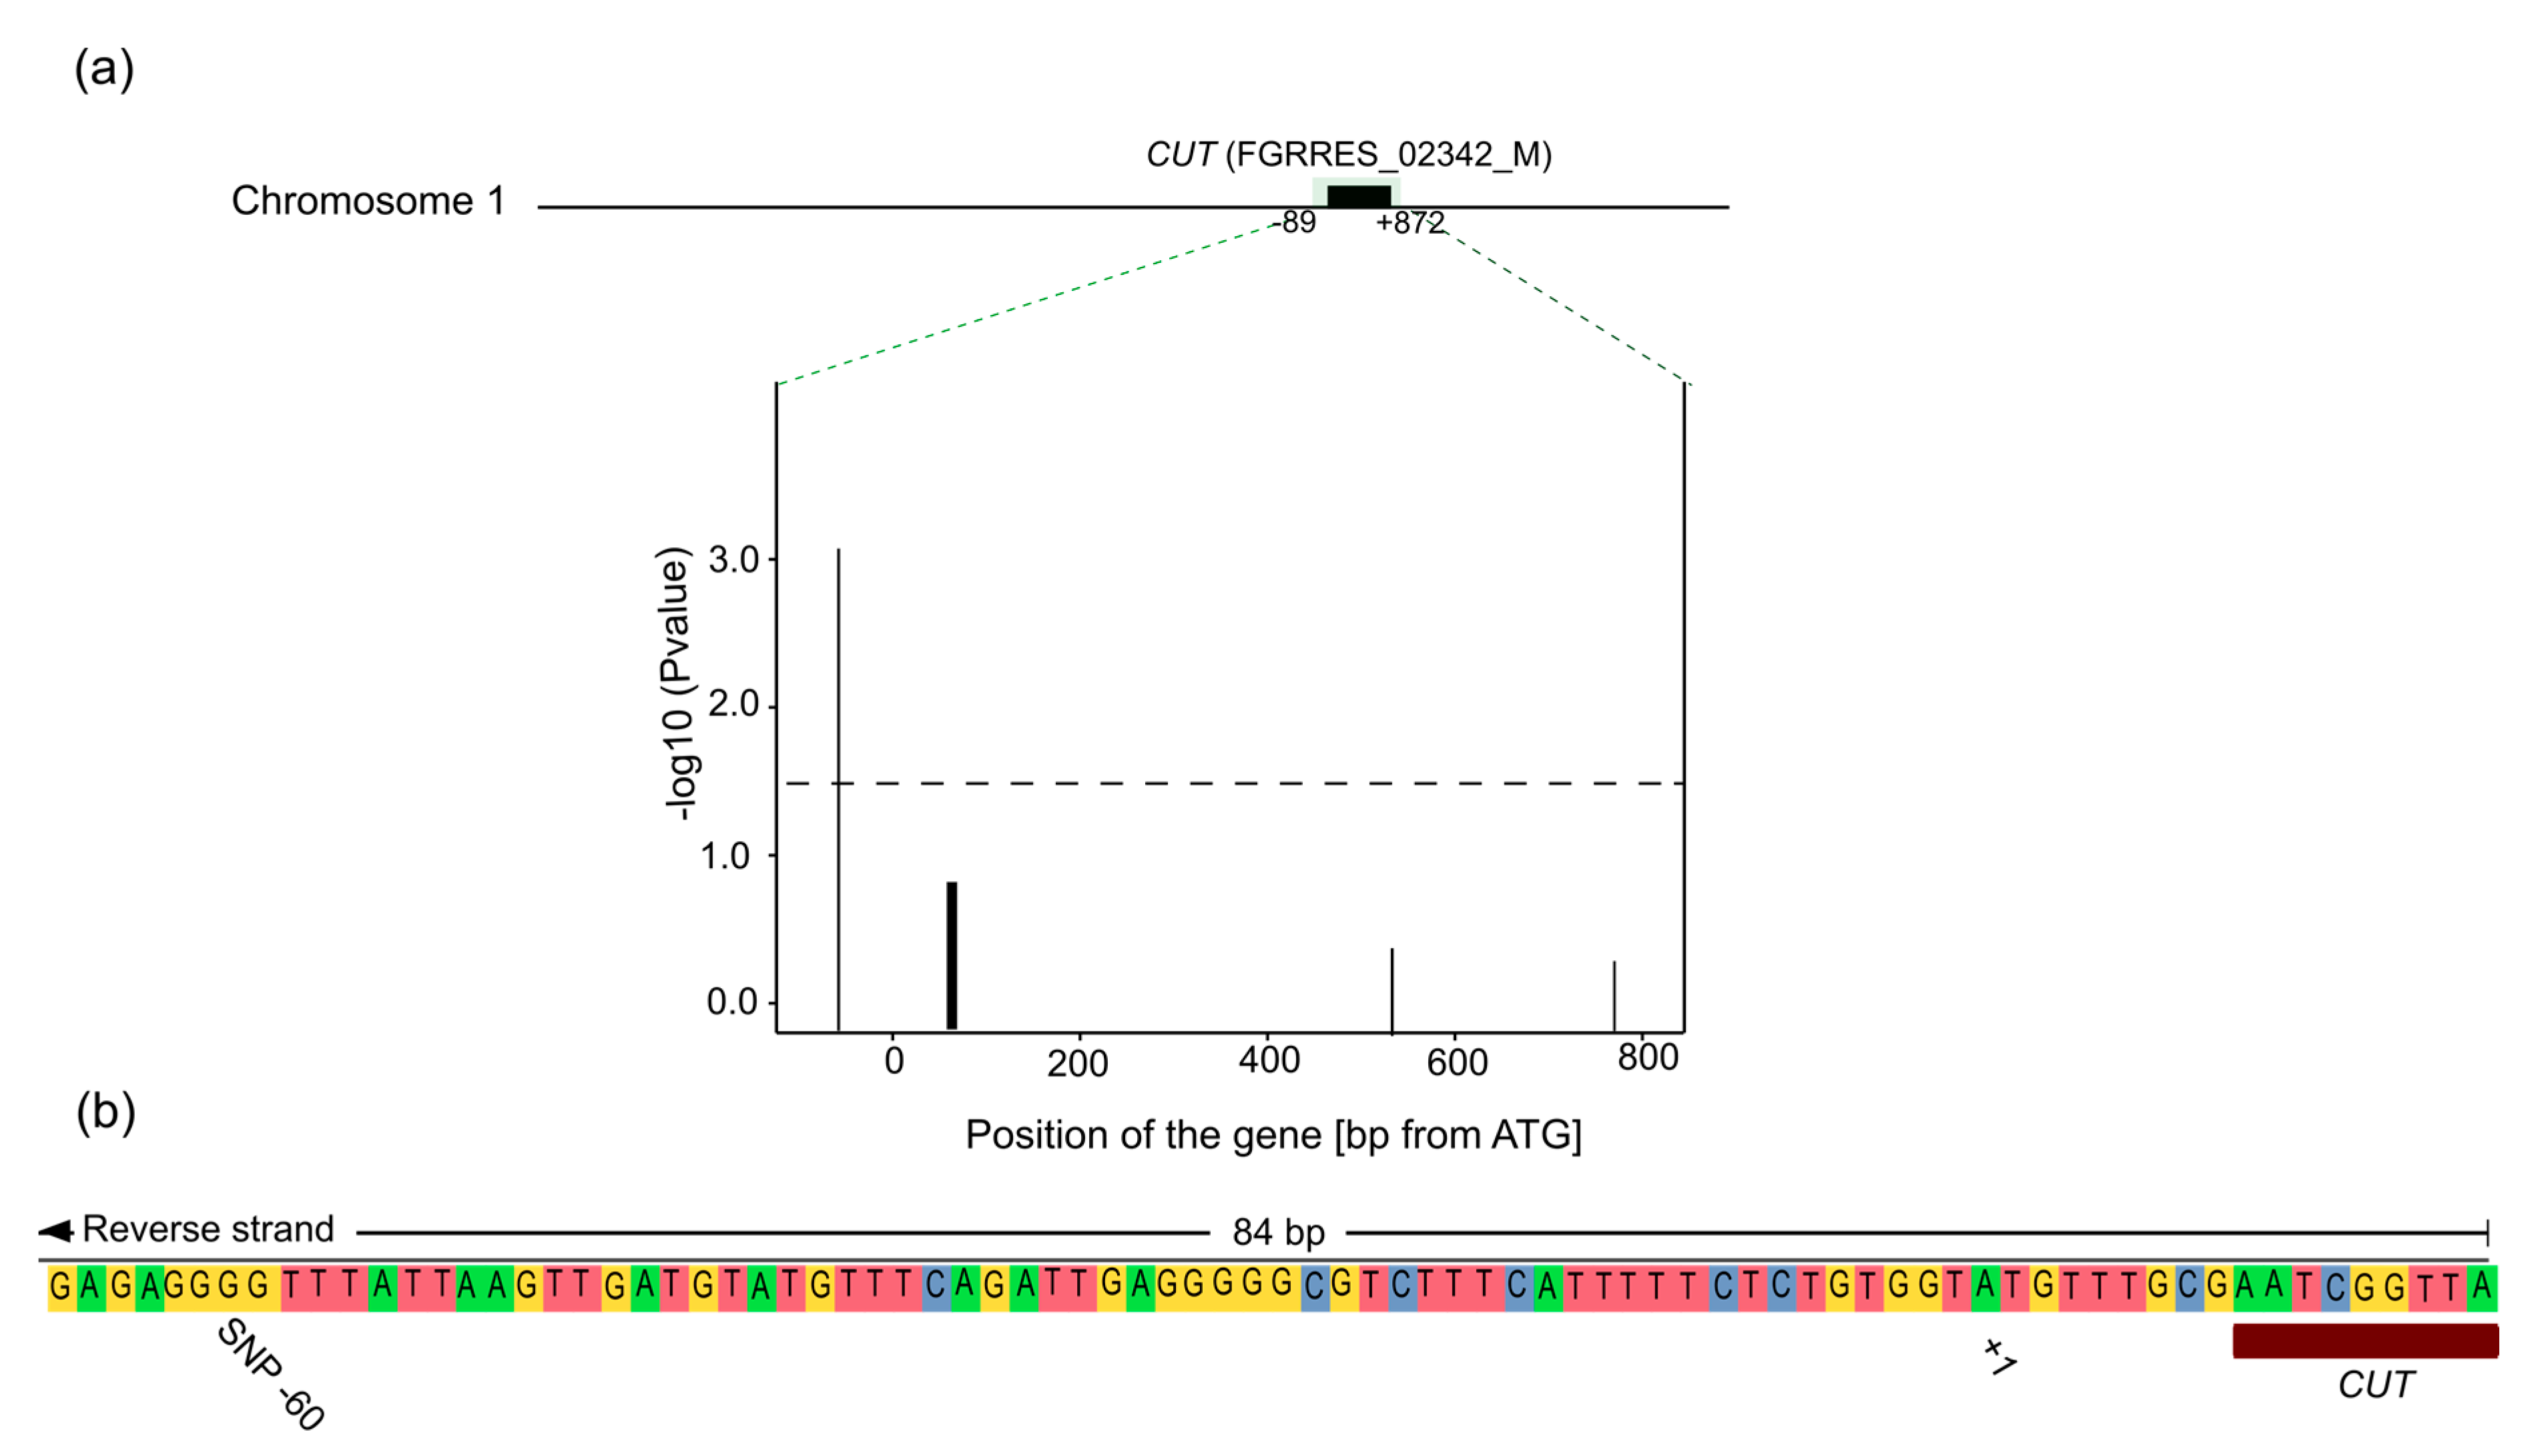
| FGRRES_02342_M | CUT | 17 | Predicted cutinase, required to penetrate the host cuticle [33] |
| FGRRES_05906 | FGL1 | 4 | Secreted fungal effector lipase [40,41] |
| FGRRES_00838 | HSP70 | 1 | Involved in heat-shock response and found to be secreted differentially under pathogenicity conditions in F. graminearum [33] |
| Environment | Mean FHB Rating | |
|---|---|---|
| Mean (%) | Isolate Range (%) | |
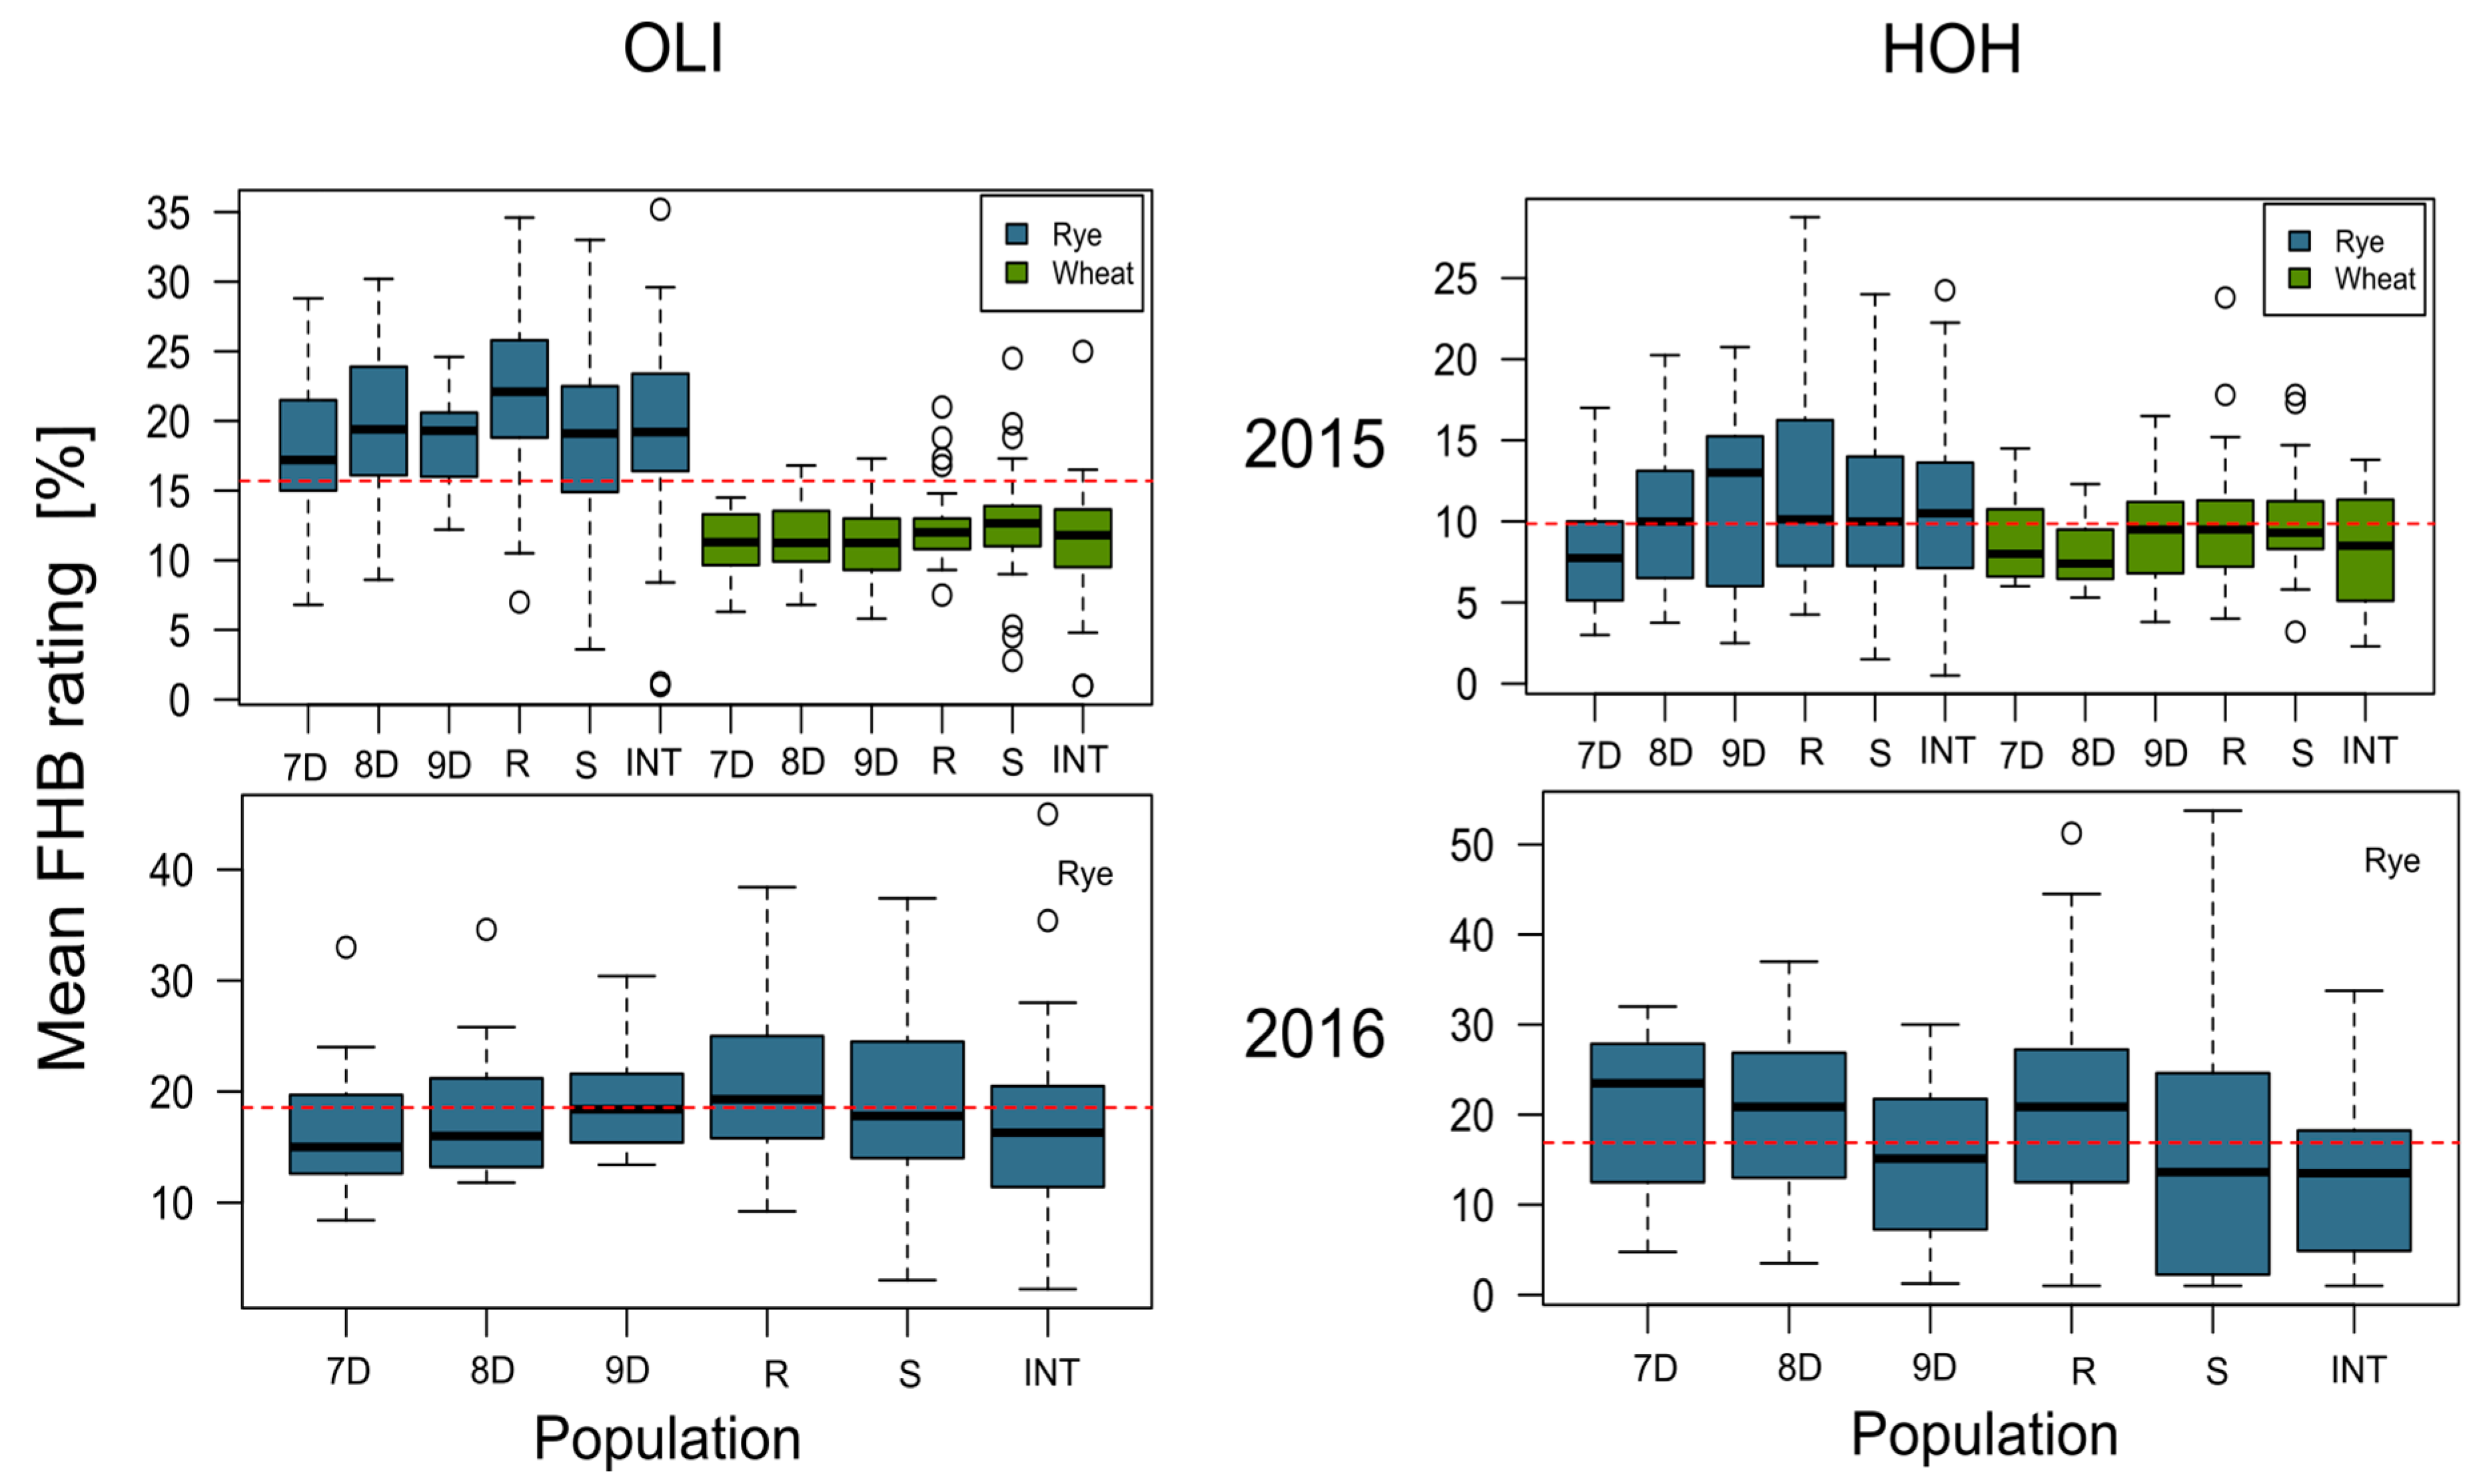
| 2015—Hohenheim | 11.01 | 0.50–32.25 |
| 2015—Oberer Lindenhof | 19.36 | 1.00–35.20 |
| 2016—Hohenheim | 11.16 | 0.66–41.66 |
| 2016—Oberer Lindenhof | 17.88 | 2.20–45.00 |
| Combined | 14.85 | 0.50–45.00 |
© 2018 by the authors. Licensee MDPI, Basel, Switzerland. This article is an open access article distributed under the terms and conditions of the Creative Commons Attribution (CC BY) license (http://creativecommons.org/licenses/by/4.0/).
Share and Cite
Castiblanco, V.; Castillo, H.E.; Miedaner, T. Candidate Genes for Aggressiveness in a Natural Fusarium culmorum Population Greatly Differ between Wheat and Rye Head Blight. J. Fungi 2018, 4, 14. https://doi.org/10.3390/jof4010014
Castiblanco V, Castillo HE, Miedaner T. Candidate Genes for Aggressiveness in a Natural Fusarium culmorum Population Greatly Differ between Wheat and Rye Head Blight. Journal of Fungi. 2018; 4(1):14. https://doi.org/10.3390/jof4010014
Chicago/Turabian StyleCastiblanco, Valheria, Hilda Elena Castillo, and Thomas Miedaner. 2018. "Candidate Genes for Aggressiveness in a Natural Fusarium culmorum Population Greatly Differ between Wheat and Rye Head Blight" Journal of Fungi 4, no. 1: 14. https://doi.org/10.3390/jof4010014
APA StyleCastiblanco, V., Castillo, H. E., & Miedaner, T. (2018). Candidate Genes for Aggressiveness in a Natural Fusarium culmorum Population Greatly Differ between Wheat and Rye Head Blight. Journal of Fungi, 4(1), 14. https://doi.org/10.3390/jof4010014