
Comparison of Primers for the Detection of Phytophthora (and Other Oomycetes) from Environmental Samples

1
Phytophthora Science and Management, Harry Butler Institute, Murdoch 6150, Australia
2
School of Biological Science, University of Canterbury, Christchurch 8401, New Zealand
*
Author to whom correspondence should be addressed.
J. Fungi 2022, 8(9), 980; https://doi.org/10.3390/jof8090980
Submission received: 8 July 2022
/
Revised: 4 September 2022
/
Accepted: 8 September 2022
/
Published: 19 September 2022
Abstract
:Many oomycetes are important plant pathogens that cause devastating diseases in agricultural fields, orchards, urban areas, and natural ecosystems. Limitations and difficulties associated with isolating these pathogens have led to a strong uptake of DNA metabarcoding and mass parallel sequencing. At least 21 primer combinations have been designed to amplify oomycetes, or more specifically, Phytophthora species, from environmental samples. We used the Illumina sequencing platform to compare 13 primer combinations on mock communities and environmental samples. The primer combinations tested varied significantly in their ability to amplify Phytophthora species in a mock community and from environmental samples; this was due to either low sensitivity (unable to detect species present in low concentrations) or a lack of specificity (an inability to amplify some species even if they were present in high concentrations). Primers designed for oomycetes underestimated the Phytophthora community compared to Phytophthora-specific primers. We recommend using technical replicates, primer combinations, internal controls, and a phylogenetic approach for assigning a species identity to OTUs or ASVs. Particular care must be taken if sampling substrates where hybrid species could be expected. Overall, the choice of primers should depend upon the hypothesis being tested.
1. Introduction
Many oomycetes are significant plant pathogens in agricultural fields, orchards, urban environments, and natural ecosystems [1,2]. Some of the most important pathogens of natural ecosystems belong to the genus Phytophthora [3]. The impacts post-introduction of these pathogens to naïve ecosystems have resulted in irreversible changes to plant species composition [4]. Many historical introductions accompanied the global expansion of agriculture with colonisation, while more recent introductions follow the plants-for-planting trade [5,6,7]. Endemic oomycetes are likely to have a more benign role within coevolved vegetation and play a role in shaping plant distribution [8].
Isolation of oomycetes as pathogens from diseased material is relatively straightforward, but isolation from soil is a complicated process [9]. Recovering oomycetes from rhizosphere soil (or other plant material) involves covering the material with water and floating bait leaves on top; motile zoospores swim to the surface and infect the bait, which are then plated onto selective media. Phytophthora is commonly isolated using this method, and antimicrobials may be included in the media to suppress the growth of Pythium [10]. A sample may include several Phytophthora species, but only the dominant species are usually isolated [11]. Sarker et al. [11] demonstrated competitive exclusion, whereby the species that rapidly produce sporangia were most frequently isolated. Due to low recoveries and lack of reproducibility, this methodology is unsuitable for studying community ecology and dynamics [11].
Alternatively, DNA metabarcoding and mass parallel sequencing has emerged as a technology suitable for such studies [12,13,14], and has been embraced by oomycete researchers (Table 1) with varying success. Early studies using generic ITS primers detected a limited number of oomycetes [15], while studies using the Phytophthora-specific primers developed by [16] have detected numerous species in a range of environments [17,18]. These studies have enriched knowledge on oomycete biology and ecology, providing baseline data [19] or a more nuanced analysis of environmental filtering [20].
The first metabarcoding papers on Phytophthora published in 2013 used the 454 pyrosequencing platform [15,21]. Recent publications have used Illumina or Pac Bio platforms. Based on a literature search, 21 different primer combinations have been used in various studies, all purported to be Phytophthora or oomycete-specific (Table 1). Legeay et al. [22] compared three primer sets and found genus-specific primers developed by Scibetta et al. [16] to be a reliable tool for the qualitative description of environmental Phytophthora communities. However, a more comprehensive comparison testing for reproducibility, specificity, and sensitivity is required of the different primer sets using a single sequencing platform.
In the current study, we compared 13 of the 21 primer combinations using the Illumina sequencing platform. The study was conducted in four separate Illumina runs over three years, expanding to compare newly published primer sets. We compared several primers in each run but always included those of Scibetta et al. [16], as adapted for metabarcoding by Català et al. [23]. We tested mock communities created from known DNA concentrations across the Phytophthora phylogeny and previously characterised environmental samples. Amplification was conducted in triplicate, and the replicates were given individual barcodes to determine the importance of replication in the amplification step of the process. The purpose of this study was to answer the following questions: (1) Are the primers specific to oomycetes and/or Phytophthora? (2) Are the reads obtained related to the amount of DNA? (3) Do the primers successfully amplify environmental samples? (4) Are technical replicates necessary?
2. Materials and Methods
2.1. Mock Communities and Environmental Samples
Isolates were grown on ½ PDA, and DNA was extracted from mycelia using Quick DNA™ Fungal/Bacterial MiniPrep kit. DNA concentration was determined using Qbit kits (Invitrogen Qubit™ dsDNA HS Assay Kit). Mock Phytophthora communities were created using 1 μL of DNA from each species regardless of the DNA concentration. There was over a 200 X difference between the highest and the lowest concentrations. Species included were from across the Phytophthora phylogeny [24]. Three mock communities were generated: the first, containing DNA of 50 species, was used for the first two metabarcoding runs; the second community, with 66 species, was used in the third run; and the third mock community, with 61 species, was used in the fourth run (Figure S1). Additionally, environmental DNA (eDNA) samples previously determined to contain various Phytophthora species were also amplified alone (runs 1–4) and together with the mock communities (runs 2–4). Individual eDNA samples from the study of Khdair et al. [25] collected from parks in Perth, Western Australia were combined to generate four eDNA mixes (E1–4) expected to contain 16, 16, 26, and 32 species, respectively.

Table 1.
A summary of metabarcoding studies in chronological order conducted to determine diversity or community dynamics of oomycetes.
Table 1.
A summary of metabarcoding studies in chronological order conducted to determine diversity or community dynamics of oomycetes.
| Publication | Gene Region 1 | Primer Set 2 | Study Location and Scale | Number of Samples | Sequencing Platform | % Oom | % Phyt | Species Detected |
|---|---|---|---|---|---|---|---|---|
| Coince et al. [15] | O-ITS | P14 | France: Beech forest | 20 root samples 20 soil samples | 454 | 0.8% | 2 Pythium 2 Phytophthora | |
| Vannini et al. [21] | O-ITS | P3 | Italy: Chestnut forests in the Latium region | 10 soil samples | 454 | 78% | 15 Phytophthora 18 oomycetes | |
| Català et al. [23] | P-ITS | P4 | Spain: Forests and plantations in northern Spain | 24 soil samples 15 water samples | 454 | >99% | 35 | |
| Sapkota and Nicolaisen [26] | O-ITS | P14 | Denmark: Agricultural field and carrots showing symptoms | 26 soil samples 11 carrot samples | 454 | 95% | 2 Phytophthora 65 oomycete | |
| Agler et al. [27] | O-ITS | P15 | Germany: Phyllosphere of wild Arabidopsis thaliana populations | 5 sites, two harvests | Illumina | na | Genus only | |
| Prigigallo et al. [28] | P-ITS | P4 | Italy: Soil and root samples from 8 potted nurseries | 8 pooled samples | 454 | >99% | 25 Phytophthora | |
| Riit et al. [29] | O-ITS | P1 3 | Estonia: Plant nurseries and surrounds | 20 soil samples | Illumina | 25% | Genus only | |
| Burgess et al. [19] Burgess et al. [30] | P-ITS | P4 | Australia: 5 states, soil samples from natural ecosystems | 640 soil samples | 454 | >99% | 68 | |
| Català et al. [17] | P-ITS | P4 | Spain: Two oak forests in eastern Spain | 23 soil samples 10 root samples | 454 | >99% | 13 Phytophthora | |
| Cerri et al. [31] | O-ITS | P14 | Italy: 5 freshwater ecosystems, some with reed dieback | 96 root, rhizosphere and soil samples | 454 | 88% | 523 OTUs 4 | |
| Bose et al. [32] | P-ITS | P4 | South Africa: Four sites from Eucalyptus and Acacia plantations and adjacent forests; soil samples | 120 soil samples | 454 | >99% | 32 Phytophthora | |
| Redondo et al. [20] | P-ITS | P16 | Sweden: 96 sites in 16 rivers over 2 years | 192 water samples (filtered) | PacBio | 74% | 36 Phytophthora | |
| Gómez et al. [33] | O-ITS | P3 | Spain: Declining oak | 52 soil samples | Illumina | 50% | 178 ASVs 5 | |
| Legeay et al. [22] | P-ITS | P11 | Mock Community: 24 species of Phytophthora and other fungi, eukaryotes, and bacteria | Mock communities | Illumina | >99% | 19 Phytophthora | |
| Legeay et al. [22] | P-ITS | P11 | France: Rhizosphere soil | 8 eDNA samples | Illumina | 95% | 7 Phytophthora | |
| Legeay et al. [22] | O-ITS | P17 | Mock Community: 24 species of Phytophthora and other fungi, eukaryotes, and bacteria | Mock communities | Illumina | 100% | 21 Phytophthora | |
| Legeay et al. [22] | O-ITS | P17 | France: Rhizosphere soil | 8 eDNA samples | Illumina | 97% | 1 Phytophthora | |
| Legeay et al. [22] | O-RAS 6 | P18 | Mock Community: 24 species of Phytophthora and other fungi, eukaryotes, and bacteria | Mock communities | Illumina | 100% | 22 Phytophthora | |
| Mora-Sala et al. [34] | P-ITS | P4 | Spain: 6 Quercus ilex stands in 3 regions | 150 soil samples 365 bait leaves | 454 | >99% | 37 Phytophthora | |
| Redekar et al. [35] | O-ITS | P3 | USA: Recycled irrigation water in a nursery across 12 months | 302 water filters | Illumina | 6% | 48 Phytophthora >50 oomycetes | |
| Redekar et al. [35] | O-ITS | P3 | USA: Recycled irrigation water in a nursery across 12 months | 82 bait leaves | Illumina | 55% | 26 Phytophthora 21 oomycetes | |
| Riddell et al. [18] | P-ITS | P4 | Britain: 14 gardens/amenity woodland sites | 140 soil samples | Illumina | >99% | 35 Phytophthora | |
| Sapp et al. [36] | O-cox2 | P13 | Spain: Andalusia, 22 trees in declining oak stands | 66 root samples | Illumina | n/a 7 | n/a 7 | |
| Foster et al. [37] | O-ITS | P14 | USA: Microbiome of roots of three cultivars of Rhododendron grown under different conditions in four nurseries | 120 root balls | Illumina | n/a | 3 Phytophthora 4 Pythium | |
| Green et al. [38] | P-ITS | P4 | Britain: 14 gardens/amenity woodland sites | 140 soil samples | Illumina | >99% | 23 Phytophthora | |
| Khdair et al. [25] | P-ITS | P4 | Australia: Parks and gardens in one city | 236 soil samples | 454 | >99% | 44 Phytophthora | |
| Legeay et al. [39] | P-ITS | P11 | French Guiana: Two sites in rainforest; 10 plots and up to 10 host families at each plot | 93 soil samples 264 bait leaves | Illumina | >99% | 6 Phytophthora | |
| Maciá-Vicente et al. [40] | O-cox2 | P19 | Germany: Naturally co-occurring Brassicaceae | 146 soil and root samples | Illumina | n/a | 951 ASVs | |
| Noel et al. [41] | O-ITS | P3 | USA: Soyabean rhizosphere communities (roots) 4 genotypes, 4 plots, and 6 replicates | 362 rhizosphere samples | Illumina | 20% of ASVs | 86% Pythium 3% Phytophthora | |
| Redekar et al. [42] | O-ITS | P3 | USA: Recycled irrigation water in a nursery across 12 months | 168 water ilters and leaf baits | Illumina | 50% | 32 Phytophthora >50 oomycetes | |
| Riddell et al. [43] | P-ITS | P4 | Britain:Phytophthora in water samples in juniper woodland (rain traps and rivers) over 12 months | 36 pooled water samples (filtered) | Illumina | >99% | 14 Phytophthora | |
| Bose et al. [44] | P-ITS | P4 | South Africa: Four sites from Eucalyptus and Acacia plantations and adjacent forests, root samples | 120 root samples | 454 | >99% | 27 Phytophthora | |
| Fiore-Donno and Bonkowski [45] | O-ITS | P20 | Germany: 3 established biodiversity sites; 50 grassland and 50 forest at each | 300 soil samples | Illumina | 96% | 31% known species | |
| Gyeltshen et al. [46] | P-ITS | P4 | Australia: Topsoil stockpiles (3) and adjacent forest | 42 bulk root samples from 20 plants species | Illumina | >99% | 23 Phytophthora | |
| Khaliq et al. [47] | P-ITS | P4 | Australia: Altitude survey, 3 roads, 20 sites per road, sample at disturbed edge and 50 m into natural vegetation | 120 pooled root samples | Illumina | >99% | 25 Phytophthora | |
| Landa et al. [48] | P-ITS | P4 | Britian: 14 sites—9 disturbed, 5 undisturbed | 132 soil samples | Illumina | 100% | 62 Phytophthora | |
| Landa et al. [48] | O-cox1 | P5 | Britian: 14 sites—9 disturbed, 5 undisturbed | 132 soil samples | Illumina | 71% | 11% | 52 Phytophthora |
| Marčiulynienė et al. [49] | O-ITS | P14 8 | Lithuania: 5 different tree species in 7 bare root forest nurseries | 350 root samples 350 soil samples | PacBio | 1.5% | 2 Phytophthora 33 oomycete | |
| Rossmann et al. [50] | O-ITS | P15 | Norway: Soil from internationally shipped plants | 73 soil samples (before and after enrichment) | Illumina | 72% | 5% | Genus only |
| Green et al. [51] | P-ITS | P4 | Britain: Water and root samples from nurseries | 400 water and root samples | Illumina | na | na | 63 Phytophthora |
1 O = oomycete-specific, P = Phytophthora-specific; 2 see Table 2; 3 used the correct ITS1oo primer [52], but reported sequence in published manuscript as that ascribed to P1 in Table 2; 4 no attempt was made to assign OTUs to species level; 5 only some ASVs were identified to species level; 6 primers failed to amplify eDNA; 7 Materials and Methods state ‘after subtraction of non-oomycete taxa’, but no percentage supplied, 8 PCR1 only with ITS6 and ITS4.
2.2. Comparison of Primer Combination
Thirteen primer combinations (primer sets) were compared across four Illumina metabarcoding runs (Table 2). All runs included the well-defined Phytophthora-specific primer set (P4) [16] used previously by our laboratory [19,30,32,65]. Primers included those that amplify the internal transcribed spacer (ITS), cytochrome oxidase subunit 1 (coxI), cytochrome oxidase subunit 2 (cox2), and the 40S ribosomal protein S10 (rps10) gene regions.
No-template negative PCR controls were included each time a PCR reaction was set up, and for nested PCR protocols, these were carried forward to the second round in the same manner as for the samples. If a band was visualised in these negative PCR controls, the products were discarded. The first-round PCR was conducted in triplicate (technical replicates), and replicates were assigned a unique barcode. In the first metabarcoding run, four primer combinations (P1–4) were compared using DNA from mock community MIX1 and two eDNA samples (E1 and E2), resulting in 36 amplicons, each uniquely barcoded. In the second run, two primer combinations (P4–5) were compared using DNA from mock community MIX1, two separate eDNA samples (E1 and E2), and one eDNA sample (E1) spiked with mock community MIX1, resulting in 24 amplicons, each uniquely barcoded. In the third run, six primer combinations were compared (P4, P6–10; P8 and P9 failed to amplify) using DNA from mock community MIX2, one eDNA sample (E3) and the same eDNA sample spiked with mock community MIX2, resulting in 36 amplicons, each uniquely barcoded. In the fourth run, four primer combinations were compared (P4, P11–13; P12 failed to amplify) using DNA from the mock community MIX3, one eDNA sample (E4), and the same eDNA sample spiked with mock community MIX3, resulting in 27 amplicons, each uniquely barcoded. All mixes were made in a ratio of eDNA to MIX of 20:1.
PCR conditions differed between primer sets. The PCRs for primer sets P1, P2, P3, P7, P9, and P12 were performed in 25 μL-volume tubes containing 12.5 μL of PCR buffer KAPA HiFi HotStart ReadyMix (KAPA Biosystems, Wilmington, MA, USA), 8 μL of PCR grade water, 1 μM of each primer, and 2.5 ul μL of genomic DNA. PCR cycling conditions were 94 °C for 2 min, 30 cycles of 95 °C for 20 s, 60 °C for 25 s, and 72 °C for 1 min, before a final 72 °C for 7 min and holding at 4 °C. The PCRs for primer set 13 were performed in 25 μL-volume tubes containing 12.5 μL of PCR buffer KAPA HiFi HotStart ReadyMix (KAPA Biosystems), 6.5 μL of PCR grade water, 1 μM of each primer,1 ul of Bovine Serum Album10 mg/mL (Fisher Biotech, Perth, Australia), and 3 μL of genomic DNA. PCR cycling conditions were 94 °C for 4 min, 36 cycles of 95 °C for 40 s, 55 °C for 40 s, and 72 °C for 1 min, before a final 72 °C for 5 min and holding at 4 °C. The PCRs for primer sets P5, P6, P8, and P10 were performed in 25 μL-volume tubes containing 12.5 μL of PCR buffer KAPA HiFi HotStart ReadyMix (KAPA Biosystems), 7.5 μL of PCR grade water, 1 μM of each primer and 2.5 μL of genomic DNA (first round) or 2.5 μL of the PCR1 product. The mix was the same for P4 and P11, except that 32.5 μL of genomic DNA was used in the first round. PCR cycling conditions for P4, P6, P8, and P11 were 94 °C for 2 min, 30 cycles of 95 °C for 20 s, 60 °C for 25 s, and 72 °C for 1 min, before a final 72 °C for 7 min, and holding at 4 °C. PCR cycling conditions for P5 were 95 °C for 5 min, 35 cycles of 94 °C for 40 s, 52 °C for 40 s, and 72 °C for 1 min, before a final 72 °C for 10 min and holding at 4 °C. PCR cycling conditions for P10 for PCR1 were 94 °C for 2 min, 35 cycles of 94 °C for 30 s, 59 °C for 45 s, and 72 °C for 1 min, before a final 72 °C for 10 min and holding at 4 °C; and for PCR2, they were 94 °C for 2 min, 30 cycles of 95 °C for 20 s, 60 °C for 25 s, and 72 °C for 1 min, before a final 72 °C for 7 min and holding at 4 °C
Amplicon library preparation was performed according to recommended protocols (Illumina Demonstrated Protocol: 16S Metagenomic Sequencing Library Preparation) with some exceptions. PCR products were visualised on 1% agarose gels and pooled based on DNA concentrations as quantified using Qbit kits. Uniquely indexed libraries were pooled for the sequencing run, which was performed on Illumina MiSeq using 500-cycle V2 chemistry (250 bp paired-end reads) following the manufacturer’s recommendations.
2.3. Bioinformatic Analysis
Paired-end reads were merged using USEARCH v10 [66] with a minimum overlap length of 50 bp with no gaps allowed in the merged alignments. Only forward reads were used for Primer sets P1 and P5. Sequence deconvolution, such as quality control and clustering, was also carried out using USEARCH v10. Specifically, sequences less than 200 bp and of low mean quality (<20) were removed. Sequences that passed quality control were clustered into operational taxonomic units (OTUs) with a similarity threshold of 99%.
Blast searches were conducted in Geneious Prime® 2019.2.3 (https://www.geneious.com), and OTUs identified during the bioinformatic analysis were divided into two folders; oomycetes and non-oomycetes. No further analysis was conducted on the non-oomycete reads. Oomycetes were divided into Phytophthora and other oomycetes. Where possible, species identity was assigned to all Phytophthora OTUs using phylogenetic analysis and a curated Phytophthora database in Geneious. This was performed by assigning an OTU to one of the 12 phylogenetic clades recognised within the genus and then creating sequence alignments, including the sequence of the type isolates of all described species (as designated by Abad et al. [24]) using the MAFFT algorithm in Geneious. Also included in these alignments were the sequences of isolated but as-yet-undescribed species from Australia and sequences recognised as putative new species in other Australian metabarcoding studies [19]. A simple phylogenetic analysis was conducted using Geneious tree builder. Species identity was assigned to an OTU if the sequence identity was >99 identical and fell into a strongly supported terminal clade with a known taxon. Other oomycetes were only identified to the genus level, except for Phytopythium litorale, which had been included in the mock communities. The hybrid P. × alni was included in the mock community and could be distinguished in the ITS1 gene region based on the amplification of both parental alleles.
2.4. Statistical Analysis
All analyses were conducted using R 4.1.0 (https://www.R-project.org/). To determine how sensitive and quantitative each primer set was, we compared the number of reads of each species found in the species mix ‘mock’ communities to the DNA concentration of each species using a negative binomial generalised linear model with function glm.nb. Our response was the number of reads, and our predictors were DNA concentration (log-transformed) and primer set. Each run was analysed separately. Function ‘emmeans’ was used to run post hoc pairwise comparisons of primer sets. Model assumptions were verified by visually inspecting residuals for assumptions of normality and homoscedasticity [67].
We used the Bray–Curtis dissimilarity index to calculate dissimilar values from OTU relative abundance data to determine differences in the community composition of oomycete communities from different primer sets on environmental samples and among replicates. Bray-Curtis dissimilarity values were calculated with the vegdist function in package vegan [68]. Communities were visualised using the nonmetric multidimensional scaling (NMDS) function ‘metaMDS’. To test for community differences across the primers, environmental samples, and replicates, permutational multivariate analysis of variance (PERMANOVA) using the function adonis was used in package vegan [68]. Run (i.e., 1–4) was a factor used as a ‘strata’ to control for different run and sequencing conditions. The null hypothesis of a PERMANOVA is that the centroids of the groups are equivalent for all groups. We repeated the above steps using the Jaccard dissimilarity index to calculate dissimilarly values from OTU presence–absence data.
To compare how well primers worked on environmental samples, we also compared alpha diversity (i.e., species richness). Each run was analysed separately. We conducted linear models using function ‘lm’ where alpha diversity was the response and primer set was the predictor. Model assumptions were verified by visually inspecting residuals for assumptions of normality and homoscedasticity [67].
To determine whether spiking of environmental samples with species mix ‘mock’ communities improved sequence results, we conducted nonparametric paired t-tests using function wilcox.test (i.e., Wilcoxon signed-rank test) between the percentage of reads of environmental communities and the percentage of reads of environmental sampled spiked mock communities. A nonparametric test was used as the assumption of normality failed with our response (i.e., percentage of reads).
3. Results
3.1. Phytophthora Detection in Mock Communities
In run 1, DNA concentration (z-value = 16.34, p < 0.001) was a significant indicator of sequence number. However, each primer differed in the amount of sequences generated from the mock community (p < 0.001). P4 performed the best and P1 performed the worst as a function of DNA concentration (Figure S2A). In run 2, DNA concentration (z-value = 7.809, p < 0.001) was a significant indicator of sequence number. However, P5 significantly differed to P4 in the amount of sequences generated from the mock community (P5 z-value = −3.989, p < 0.001). P4 performed better than P5 as a function of DNA concentration (Figure S2B). In run 3, DNA concentration (z-value = 7.352, p < 0.001) was a good indicator of sequence number. Primers differed in the amount of sequences generated from the mock community (p < 0.001); specifically, Primers P4 and P6 (z-ratio = 3.698, p = 0.012) and Primers P6 and P7 differed significantly (z-ratio = −3.949, p = 0.0005) between each other (Figure S2C). In Run 4, DNA concentration (z-value = 3.414, p < 0.001) was a good indicator of sequence number. However, primers preformed similarly and did not differ between each other (p = 0.652) (Figure S2D).
Overall, for the mock communities, there was a positive correlation between DNA concentration and the number of reads in the sample for many of the primer sets based upon the ITS gene region (P1–P4, P8) (Table 3). The correlation was weak for ITS primer sets P6 and P11, the cox primers sets P5 and P13, and the rps10 primer set P10 (Table 3, Figure 1).
The primer sets differed in their ability to amplify species within the mock communities. Primer set P4 could amplify 77–94% of species across the four runs (Table 3). ITS primers sets P2, P3, and P7 produced similar results, successfully amplifying most of the species in the mock community (Table 3). ITS primer set P1 amplified 76% of species, ITS primer set P11 amplified 56% of the species, cox1 primer set P5 amplified 50% of species, cox2 primer set P13 amplified 77% of the species, and rps10 primer set P10 amplified 84% of species (Table 3).
For the primer sets based upon the ITS gene region (P1–P4, P6, P8, P11), the inability to detect some cryptic species is because they have an identical sequence for the short fragment of the gene region amplified (Figure 2, Figures S3–S6). These species were (a) P. alticola and P. boodjera, (b) P. citricola and P. plurivora, (c) P. gregata and P. gibbosa, and (d) P. versiformis and P. quercina. Based on phylogeny, it should be possible to distinguish these species using the primer sets for other gene regions (P5, P10, and P13), and indeed both P. gregata and P. gibbosa were detected using all these primer pairs, P. versiformis and P. quercina were also detected using primer sets P10 and P13 (Figure 2, Figures S3 and S5), and P. citricola and P. plurivora were detected by primer set P10 (Figure S4). However, P5 and P10 could not pick up several other species from the mock community, so the lack of detection of the closely related species may not be based on the specificity of the primers but on primer sensitivity. The hybrid P. × alni could be recognised by primer sets based on the ITS gene region as both ITS alleles amplified and closely matched P. uniformis, a species not included in the mock community. However, while they could be correctly assigned to P. × alni in a mock community, this would not be possible for an environmental sample as the ITS1 sequence of the P. × alni alleles cannot be separated from that of P. uniformis.
3.2. Phytophthora Detection in eDNA Samples Spiked with the Mock Community
eDNA samples were spiked with the mock community in runs 2–4 (Figures S4–S6). As expected, when eDNA samples were spiked with the mock community, the primer sets that were specific to oomycetes when used with eDNA samples alone were specific when these samples were spiked; these were primer sets P4, P6, and P10. For primer set P7, only 2.4% of reads were from oomycetes; for the cox1 primer, this was 83%; while for the cox2 primer set P13, it was 98.5%.
Mock community MIX1 and eDNA sample E1 share 13 Phytophthora species, so the total number of species possible to detect is 53 (Figure S4). Primer set P4 detected 46 species but missed 6 species from the mock community and 1 from the eDNA sample (Table 3, Figure S4). Primer set P5 detected only 25 species; 25 were missed from the mock community and 5 from the eDNA sample (Table 3, Figure S4). Mock community MIX2 and eDNA sample E3 share 25 Phytophthora species, so the total number possible to detect is 67 (Figure S4). Primer set P4 detected 57 species but missed 10 species from the mock community and 2 from the eDNA sample (Table 3, Figure S5). Primer set P5 detected only 30 species; 37 were missed from the mock community and 10 from the eDNA sample (Table 3, Figure S5). Primer set P7 (even though only 2.4% of reads were oomycete) detected 41 Phytophthora species, but missed 26 species from the mock community and 3 from the eDNA sample (Table 3, Figure S5). Primer set P10 detected 51 species, but missed 16 species from the mock community and two from the eDNA sample (Table 3, Figure S4). Mock community MIX3 and eDNA sample E4 share 30 species, so the total number possible to detect is 64 species (Table 3, Figure S6). Primer set P4 detected 38 species, but missed 22 from the mock community and 9 from the eDNA sample. Primer set P11 detected 36 species but missed 24 from the mock community and 10 from the eDNA sample. Primer set P13 detected 48 species, but missed 12 from the mock community and 7 from the eDNA sample.
In most cases, the Phytophthora species not detected were present at the lower concentrations (<1% of the Phytophthora DNA in the mock community) (Figures S3–S6). The exception for this is the P5 primer set (cox1 gene region) which failed to amplify several species present in a higher concentration (Figure S4), P6 primer set, which did not amplify numerous species from clades 4, 5, 8, 9 and 10 (Figure S5) and primer set P11, which gave poor amplification of species in clades 6–8 (Figure S6).
3.3. Phytophthora Detection in eDNA Samples
For eDNA samples, the primer sets differed considerably in the percentage of reads that could be attributed to Phytophthora (and/or oomycetes). Primer sets P4, P6, P10, and 11 are highly specific and only amplify oomycetes (>99.9% of reads), with primer set P4 primarily targeting only Phytophthora (Table 3). Primer set P5 does target oomycetes (40% for sample E1 and 60% for sample E2) but also amplified algal and some plant DNA, while primer sets P1, P2, P3, and P7 are not specific, with oomycetes accounting for less than 1% of the total read number in the environmental samples. For primer set P13, 3.25% of the reads were oomycete. For both these cox primer pairs, P5 and P13, fewer of the reads were from oomycetes when amplifying the eDNA sample alone than when spiked, so it appears that while being specific, they are less sensitive when faced with low levels of oomycete DNA in an eDNA sample.
Of the 16 Phytophthora species previously detected from sample E1, 11 were detected by primer set P4 in run 1 and 15 in run 2; the other primer sets only detected between 2–4 species each (Table 3, Figures S3 and S4). Of the 16 Phytophthora species previously detected in sample E2, 13 were detected by primer set P4 in run 1 and 11 in run 2; primer set P2 detected 7 species, primer set P3 detected 3 species, P5 detected 3 species, while primer set P1 failed to detect any Phytophthora species in the sample (Table 3, Figures S3 and S4). Of the 26 Phytophthora species previously detected from sample E3 (used for run 3), 23 were detected by primer set P4, 16 by primer set P6, 11 by primer set P7, and 10 by primer set P10 (Table 3, Figure S5). Of the 33 Phytophthora species previously detected from sample E3, 29 were detected by primer set P4, 23 by primer set P11, and 13 by primer set P13 (Table 3, Figure S6).
Community composition from the relative abundance data differed depending on the primer used (F9,56 = 7.889, R2 = 0.56, p = 0.0001) and among the different environmental samples (F3,56 = 3.748, R2 = 0.09, p = 0.001). Replicates did not differ from each other (F2,56 = 0.839, R2 = 0.01, p = 0.558) (Figure 3A). Community composition from the presence absence data differed depending on the primer used (F9,56 = 8.290, R2 = 0.59, p = 0.0001) and among the different environmental samples (F3,56 = 4.672, R2 = 0.11, p = 0.001). The interaction between primer and sample was also significant (F4,56 = 4.145, R2 = 0.13, p = 0.001). Replicates did not differ from each other (F2,56 = 0.452, R2 = 0.007, p = 0.896) (Figure 3B).
In addition to community composition, we also compared alpha diversity (i.e., species richness) among the primers. In run 1, P4 resulted in the highest alpha diversity (t-value = 8.705, p < 0.001) compared to all other primer sets (Figure 4). Alpha diversity of P1, P2, and P3 (p > 0.05) did not differ among each other. In run 2, P5 resulted in lower alpha diversity than P4 (t-value = −4.983, p < 0.001; Figure 4). In run 3, P4 and P6 resulted in similar estimates of alpha diversity (t-ratio = 0.378, p = 0.98) and P7 and P10 resulted in similar estimates of alpha diversity (t-ratio = 1.246, p = 0.618). Overall, P4 and P6 resulted in higher alpha diversities than P7 and P10 (Figure 4). In run 4, P4 and P11 resulted in similar estimates of alpha diversity (t-value = −0.055, p = 0.958); however, P13 produced much lower estimates in comparison to P4 and P11 (t-value = −4.00, p < 0.001; Figure 4).
3.4. Technical Replicates
For the mock communities, technical replicates generally amplified the same species. Additionally, there was no significant difference between technical replicates for the environmental samples (Figure 3). However, while the differences between replicates were not significant, there were differences between samples, particularly in the relative proportion of reads assigned to each species. For example, Table 4 presents the relative proportion of reads for each Phytophthora species detected across the three replicates for eDNA sample E3. Individual replicates all failed to detect some species; this differed so that when combined, a greater number of species were detected (Table 4). Overall, while the dominant species were found in all replicates, the percent of total reads varied considerably (Table 4).
4. Discussion
4.1. Comparison of Primers
The primer pairs tested, which had all previously been used to study oomycete communities, varied greatly in their ability to amplify Phytophthora species in a mock community and from environmental samples. Each of the four Illumina sequencing runs included a mock community. We deliberately used a range of DNA concentrations (200 × difference between highest and lowest concentration) to test the limits of detection of the primers and determine if there was any relationship between DNA concentration and the number of reads. Using nested PCR on these mock communities, DNA concentration was a good indicator of read number for the Phytophthora-specific primers of Scibetta et al. [16]; for the remaining primers, the relationship was poor. This was due to either low sensitivity (an inability to detect species present in low concentrations) or a lack of specificity (an inability to amplify some species even if they were present in high concentrations). The number of rDNA copies varied widely among fungi, ranging from about 14 to 1442 copies [69]. A similar variation could be expected in ITS copy numbers between Phytophthora species, and this would impact the relative quantification of the species.
Overall, the ITS primers detected more species than those based on other gene regions. In general, most of the primers tested amplified most species in the mock community, but some primers also failed to amplify whole clades from within the Phytophthora phylogeny, in particular the ITS primers P6 [70] and the cox1 primers [48]. When there was a background of other organisms (eDNA spiked with a mock community), most of the primers amplified the same Phytophthora species as they had for the mock community alone, with a slight decrease in sensitivity.
Several studies have also included mock communities, although never with as many species. Català et al. [23] mixed similar DNA concentrations of eight species and found that the reads obtained for one species, P. plurivora, were much lower than expected. Legeay et al. [22] generated a mock community of 25 species, including two hybrids, with and without a background community of other microorganisms, and tested these with three primers. Amplification was different between the primer sets; P. plurivora was preferentially amplified, and other species were completely missing depending on the primer set used. The mock community of Sapkota and Nicolaisen [26] included seven species with the DNA mixed in different ratios; two species failed to amplify, and the number of reads correlated poorly with DNA concentration. Riddell et al. [18] used two mock communities—one with 15 species, the other with 10 species—to compare two sequence analysis tools (Bowtie and Swarm). Swarm correctly detected more species from the mock community, but Bowtie produced fewer false positives.
The most successful assays used a nested approach to amplify environmental DNA. The primers designed by Scibetta et al. [16] are Phytophthora-specific. Of the purported oomycete-specific primer pairs, the ITS primers (P6) used for direct sequencing of eDNA samples (not metabarcoding) by Dickie et al. [70] and the rps10 primers of Martin et al. [71] only amplified oomycetes in environmental samples. The other ITS primers tested (P2, P3, and P7) are not specific, and <1% of the reads could be assigned to oomycetes. For the cox1 primers [48] and cox2 primers [36], 40% and 3% of the reads in environmental samples, respectively, could be assigned to oomycetes.
Foster et al. [58] designed oomycete-specific primers for rps10 gene regions and tested these on a mock community containing 24 oomycete species and diverse environmental samples in a single PCR round. These primers detected 23 species in the mock community, and oomycetes accounted for 99% of the reads amplified from the environmental samples. We were unsuccessful in amplifying environmental samples using a single PCR, and thus used a nested approach with the PRV primers of Martin et al. [59] in the first round and the new oomycete specific rps10 primers of Foster et al. [58] in the second round. In our study, using the nested approach, the rps10 primers amplified 83% of the Phytophthora species in the mock community. In their recent publication, the authors of [58] amended the PRV primers to sequence the oomycete database. If we had used the amended PRV primers in the first round, we might have amplified more species from the mock community.
The Phytophthora-specific primers designed by Scibetta et al. [16] are used in a nested PCR for environmental samples. Most studies use the species-specific primers first (Table 1); however, Legeay et al. [22] and Legeay et al. [39] use the specific primers second. When compared directly, the amplification across the Phytophthora phylogeny was superior when the specific primers were used first (P4).
Landa et al. [48] compared the Phytophthora-specific primers designed by Scibetta et al. [16], P4, and primers for cox1 gene region, P5, on 132 environmental DNA samples from disturbed sites in the UK. For the ITS primers, 93% of the reads were Phytophthora, and 20 species and 21 unknown phylotypes were detected; while for the cox1 primers, 71% of the reads were assigned to oomycetes, 16% to Phytophthora, and 12 species and 17 unknown Phytophthora phylotypes were detected by Landa et al. [48]. The results were in agreement only from two locations. Similarly, in the current study, using the cox1 primers, 40% of reads were assigned to oomycetes and 7.5% to Phytophthora. However, in two environmental samples, the cox1 amplification only detected 25% of the Phytophthora species found using the P4 ITS primers.
4.2. Technical Replicates
A small amount of target DNA within a sample (as is the case for Phytophthora DNA within environmental samples) can lead to PCR stochasticity during metabarcoding [72]. PCR replication (technical replicates) is seen as the way to maximise diversity detection as it offsets replicate variability and maximises diversity detection. In a very detailed study, Alberdi et al. [14] reported considerable diversity differences between PCR replicates from each environmental sample resulting from PCR stochasticity and/or accumulation of PCR and sequencing errors. They compared different approaches for combining the data: in the additive approach, the sequences from the three PCR replicates were added together; in the restrictive approach, only sequences present in two of the three replicates were included. The additive approach increases the likelihood of detecting rare taxa, while the restrictive approach reduces the chance of incorporating artificial sequences and results in lower diversity. We have used the additive approach in the current study.
4.3. Hybrid Species
While all primers have their strengths and weaknesses, none of them can likely provide a perfect mirror of the true oomyete community. Good experimental design, laboratory practices, and bioinformatics workflow all increase the reliability of results; however, there is one type of organism that cannot be detected by metabarcoding; hybrid species. This is particularly important for Phytophthora and other oomycetes, especially if water sampling is involved. As demonstrated in the current study, the hybrid P. alni could be assigned in the mock community because one of the alleles produced closely matched P. uniformis, one of the hybrid’s known parents [73,74]. However, these taxa could not be separated in an environmental sample where both P. × alni and P. uniformis could be present. This inability to detect hybrids will be the case for all environmental samples and is particularly important for water samples. Clade 6 Phytophthora species have an aquatic lifestyle and are abundantly recovered from water [35,75,76]. They readily hybridise, and hybrids characterised to date contain the mitochondrial DNA of one parent at the nuclear DNA of two [77,78,79]. The hybrids are often stable and undergoing concerted evolution [78]. Amplifying a multicopy gene such as ITS results in the alleles of the two parent species and mixed alleles with signatures of both parents [78]. Thus, in a metabarcoding study based on ITS locus, the ASVs from a hybrid could be assigned to two known species and additional ‘unknown species’. Only a single parent species will be detected if a mitochondrial gene is amplified. We recommend that the results from metabarcoding of Phytophthora from water should be treated with caution. Similarly, while hybrids from other Phytophthora clades may not be dominant in a particular environment, there are common pathogens of agricultural fields and nurseries, for example, within the P. cryptogea complex in clade 8 [80] and also among species in clade 1 [81]. If metabarcoding is conducted with two loci (one nuclear and one mitochondrial) and the sample contains a known hybrid with the nuclear loci of one parent and the mitochondrial loci of another, and both parents are absent, then that hybrid could be detected in an environmental sample.
5. Conclusions
Here, based on the results and observation of the current study, we make several recommendations on treating samples once in the laboratory.
- Primers designed for oomycetes do not have the same sensitivity toward Phytophthora as the Phytophthora-specific primers. Studies that use oomycete-specific primers to study Phytophthora communities have probably underestimated Phytophthora diversity. The selection of primers is a trade-off between detecting Phytophthora or detecting oomycetes and will depend upon the study’s intent.
- Our results show that using multiple primer sets would reduce taxonomic biases and increase taxonomic coverage.
- While taking technical replicates separately through the process and assigning unique barcodes may be helpful, this could be an expensive option. We recommend conducting the PCR steps in triplicate and then combining them before adding barcodes.
- Use a phylogenetic approach to assign OTUs or ASVs to species rather than simple blast searches. By doing so, minor sequencing errors that do not influence phylogenetic placement will allow several OTUs to be assigned to the same species.
- Internal controls were not included in the current study but would be a valuable addition to any protocol. Green et al. [38] included four samples containing a mix of synthetic ‘Phytophthora’ sequences of known base composition on the plate as a check for sequence contamination. These can be synthetic reference sequences included in the initial PCR reactions as control samples to determine any cross-contamination during the amplification stage.
- Many Phytophthora species can hybridise, especially those commonly found in water. Care must be taken with metabarcoding studies as it is not possible to identify hybrids.
Supplementary Materials
The following supporting information can be downloaded at: https://www.mdpi.com/article/10.3390/jof8090980/s1, Figure S1. Phylogeny based on the ITS gene region of the Phytophthora species was used to create the mock communities. Mock community MIX1 was used for metabarcoding runs 1 and 2, mock community MIX2 was used in metabarcoding run 3, and mock community MIX3 was used in metabarcoding run 4. Species were included from all 11 clades recognised within the Phytophthora phylogeny. The DNA concentration (ng/μL) for each species is given in the columns on the right. The darker the colour, the higher the DNA concentration; Figure S2. The number of sequences produced from 10 different primers from mock communities with known DNA concentrations of oomycete species. Each point represents the concentration of an oomycete species and the number of sequences it produced. Each line represents the best-fitted line from the negative binomial generalised linear model for each primer; Figure S3. Phylogenetic representation based on ITS gene region for each Phytophthora species detected in the mock community MIX1 and the eDNA sample E1 and E2, as determined in Illumina run 1. The relative proportion of DNA of each species in MIX1 (as a percentage) and the average relative abundance of reads obtained for each species (as a percentage) are colour-coded as per the legend. The asterisk denotes those species known to be present in the eDNA sample E1 and the hashtag represents those present in sample E2; Figure S4. Phylogenetic representation based on ITS gene region of each Phytophthora species detected in the mock community MIX1, the eDNA sample E1 and E2, and the eDNA sample E1 spiked with the mock community MIX1, as determined in Illumina run 2. The relative proportion of DNA of each species in MIX1 (as a percentage) and the average relative abundance of reads obtained for each species (as a percentage) are colour-coded as per the legend. The asterisk denotes those species known to be present in the eDNA sample E1 and the hashtag those present in sample E2. Figure S5. Phylogenetic representation based on the ITS gene region of each Phytophthora species detected in the mock community MIX2, the eDNA sample E3, and the eDNA sample E3 spiked with the mock community MIX2, as determined in Illumina run 3. The relative proportion of DNA of each species in MIX2 (as a percentage) and the average relative abundance of reads obtained for each species (as a percentage) are colour-coded as per the legend. The asterisk denotes those species known to be present in the eDNA sample E3. Figure S6. Phylogenetic representation based on the ITS gene region of each Phytophthora species detected in the mock community MIX3, the eDNA sample E4 and the eDNA sample E4 spiked with the mock community MIX2 as determined in Illumina run 4. The relative proportion of DNA of each species in MIX3 (as a percentage) and the average relative abundance of reads obtained for each species (as a percentage) are colour coded as per the legend. The asterisk denotes those species known to be present in the eDNA sample E4.
Author Contributions
Conceptualisation, T.I.B.; methodology, T.I.B., D.W. and S.J.S.; validation, T.I.B., D.W. and S.J.S.; formal analysis, T.I.B. and S.J.S.; investigation, T.I.B. and D.W.; resources, T.I.B.; data analysis, T.I.B. and S.J.S., data curation, T.I.B.; writing—original draft preparation, T.I.B.; writing—review and editing, T.I.B. and S.J.S.; visualisation, T.I.B. and S.J.S. All authors have read and agreed to the published version of the manuscript.
Funding
This research received no external funding.
Institutional Review Board Statement
Not applicable.
Informed Consent Statement
Not applicable.
Data Availability Statement
OTUs from each run will be made available from Mendelay data. doi:10.17632/b4nfr67932.1.
Acknowledgments
Frances Brigg for the operation of the Illumina MiSeq platform. Felipe Albornoz, Nik Grünwald, Ana Perez Sierra, and Blanca Landa for suppling sequences of primers prior to their publication.
Conflicts of Interest
The authors declare no conflict of interest.
References
- Erwin, D.C.; Ribeiro, O.K. Phytophthora Diseases Worldwide; APS Press: St. Paul, MN, USA, 1996; p. 562. [Google Scholar]
- Fones, H.N.; Bebber, D.P.; Chaloner, T.M.; Kay, W.T.; Steinberg, G.; Gurr, S.J. Threats to global food security from emerging fungal and oomycete crop pathogens. Nat. Food 2020, 1, 332–342. [Google Scholar] [CrossRef]
- Hansen, E.M.; Reeser, P.W.; Sutton, W. Phytophthora beyond agriculture. Annu. Rev. Phytopathol. 2012, 50, 359–378. [Google Scholar] [CrossRef] [PubMed]
- Cahill, D.M.; Rookes, J.E.; Wilson, B.A.; Gibson, L.; McDougall, K.L. Turner Review No. 17. Phytophthora cinnamomi and Australia’s biodiversity: Impacts, predictions and progress towards control. Aust. J. Bot. 2008, 56, 279–310. [Google Scholar] [CrossRef]
- Scott, P.; Bader, M.; Burgess, T.I.; Hardy, G.E.S.J.; Williams, N. Global biogeography and invasion risk of the plant destroyer genus Phytophthora. Environ. Sci. Policy 2019, 101, 175–182. [Google Scholar] [CrossRef]
- Brasier, C.M. The biosecurity threat to the UK and global environment from international trade in plants. Plant Pathol. 2008, 57, 792–808. [Google Scholar] [CrossRef]
- Jung, T.; Orlikowski, L.; Henricot, B.; Abad-Campos, P.; Aday, A.G.; Aguín Casal, O.; Bakonyi, J.; Cacciola, S.O.; Cech, T.; Chavarriaga, D.; et al. Widespread Phytophthora infestations in European nurseries put forest, semi-natural and horticultural ecosystems at high risk of Phytophthora diseases. For. Pathol. 2016, 46, 134–163. [Google Scholar] [CrossRef]
- Laliberté, E.; Lambers, H.; Burgess, T.I.; Wright, S.J. Tansley Review; Phosphorus limitation, soil-borne pathogens and the coexistence of plant species in hyperdiverse forests and shrublands. New Phytol. 2015, 206, 507–521. [Google Scholar] [CrossRef]
- Burgess, T.I.; López-Villamor, A.; Paap, T.; Williams, B.; Belhaj, R.; Crone, M.; Dunstan, W.A.; Howard, K.; Hardy, G.E.S. Towards a best practice methodology for the detection of Phytophthora species in soils. Plant Pathol. 2021, 70, 604–614. [Google Scholar] [CrossRef]
- Sarker, S.R.; McComb, J.A.; Burgess, T.I.; Hardy, G.E.S. Antimicrobials in Phytophthora isolation media and the growth of Phytophthora species. Plant Pathol. 2020, 69, 1426–1436. [Google Scholar] [CrossRef]
- Sarker, S.R.; McComb, J.; Burgess, T.I.; Hardy, G.E.S. Timing and abundance of sporangia production and zoospore release influences the recovery of different Phytophthora species by baiting. Fungal Biol. 2021, 125, 477–484. [Google Scholar] [CrossRef]
- Shokralla, S.; Spall, J.L.; Gibson, J.F.; Hajibabaei, M. Next-generation sequencing technologies for environmental DNA research. Mol. Ecol. 2012, 21, 1794–1805. [Google Scholar] [CrossRef] [PubMed]
- Thomsen, P.F.; Willerslev, E. Environmental DNA–An emerging tool in conservation for monitoring past and present biodiversity. Biol. Conserv. 2015, 183, 4–18. [Google Scholar] [CrossRef]
- Alberdi, A.; Aizpurua, O.; Gilbert, M.T.P.; Bohmann, K. Scrutinizing key steps for reliable metabarcoding of environmental samples. Methods Ecol. Evol. 2018, 9, 134–147. [Google Scholar] [CrossRef]
- Coince, A.; Caël, O.; Bach, C.; Lengellé, J.; Cruaud, C.; Gavory, F.; Morin, E.; Murat, C.; Marçais, B.; Buée, M. Below-ground fine-scale distribution and soil versus fine root detection of fungal and soil oomycete communities in a French beech forest. Fungal Ecol. 2013, 6, 223–235. [Google Scholar] [CrossRef]
- Scibetta, S.; Schena, L.; Chimento, A.; Cacciola, S.O.; Cooke, D.E.L. A molecular method to assess Phytophthora diversity in environmental samples. J. Microbiol. Methods 2012, 88, 356–368. [Google Scholar] [CrossRef]
- Català, S.; Berbegal, M.; Pérez-Sierra, A.; Abad-Campos, P. Metabarcoding and development of new real-time specific assays reveal Phytophthora species diversity in holm oak forests in eastern Spain. Plant Pathol. 2017, 66, 115–123. [Google Scholar] [CrossRef]
- Riddell, C.E.; Frederickson-Matika, D.; Armstrong, A.C.; Elliot, M.; Forster, J.; Hedley, P.E.; Morris, J.; Thorpe, P.; Cooke, D.E.L.; Pritchard, L.; et al. Metabarcoding reveals a high diversity of woody host-associated Phytophthora spp. in soils at public gardens and amenity woodlands in Britain. PeerJ 2019, 7, e6931. [Google Scholar] [CrossRef]
- Burgess, T.I.; White, D.; McDougall, K.L.; Garnas, J.; Dunstan, W.A.; Català, S.; Carnegie, A.J.; Worboys, S.; Cahill, D.; Vettraino, A.-M.; et al. Distribution and diversity of Phytophthora across Australia. Pac. Conserv. Biol. 2017, 23, 150–162. [Google Scholar] [CrossRef]
- Redondo, M.A.; Boberg, J.; Stenlid, J.; Oliva, J. Functional traits associated with the establishment of introduced Phytophthora spp. in Swedish forests. J. Appl. Ecol. 2018, 55, 1538–1552. [Google Scholar] [CrossRef]
- Vannini, A.; Bruni, N.; Tomassini, A.; Franceschini, S.; Vettraino, A.M. Pyrosequencing of environmental soil samples reveals biodiversity of the Phytophthora resident community in chestnut forests. FEMS Microbiol. Ecol. 2013, 85, 433–442. [Google Scholar] [CrossRef] [Green Version]
- Legeay, J.; Husson, C.; Cordier, T.; Vacher, C.; Marcais, B.; Buée, M. Comparison and validation of Oomycetes metabarcoding primers for Phytophthora high throughput sequencing. J. Plant Pathol. 2019, 101, 743–748. [Google Scholar] [CrossRef]
- Català, S.; Pérez-Sierra, A.; Abad-Campos, P. The use of genus-specific amplicon pyrosequencing to assess Phytophthora species diversity using eDNA from soil and water in northern Spain. PLoS ONE 2015, 10, e0119311. [Google Scholar] [CrossRef] [PubMed]
- Abad, Z.G.; Burgess, T.I.; Redford, A.J.; Bienapfl, J.C.; Srivastava, S.; Mathew, R.; Jennings, K. IDphy: An International online resource for molecular and morphological identification of Phytophthora based on type specimens. Plant Dis. 2022. [Google Scholar] [CrossRef]
- Khdair, M.Y.; Barber, P.A.; Hardy, G.E.S.J.; Shaw, C.; Steel, E.J.; McMains, C.; Burgess, T.I. Association of Phytophthora with declining vegetation in an urban forest environment. Microorganisms 2020, 8, 973. [Google Scholar] [CrossRef]
- Sapkota, R.; Nicolaisen, M. An improved high throughput sequencing method for studying oomycete communities. J. Microbiol. Methods 2015, 110, 33–39. [Google Scholar] [CrossRef] [PubMed]
- Agler, M.T.; Ruhe, J.; Kroll, S.; Morhenn, C.; Kim, S.-T.; Weigel, D.; Kemen, E.M. Microbial hub taxa link host and abiotic factors to plant microbiome variation. PLoS Biol. 2016, 14, e1002352. [Google Scholar] [CrossRef] [PubMed]
- Prigigallo, M.I.; Abdelfattah, A.; Cacciola, S.O.; Faedda, R.; Sanzani, S.M.; Cooke, D.E.; Schena, L. Metabarcoding analysis of Phytophthora diversity using genus-specific primers and 454 pyrosequencing. Phytopathology 2016, 106, 305–313. [Google Scholar] [CrossRef]
- Riit, T.; Tedersoo, L.; Drenkhan, R.; Runno-Paurson, E.; Kokko, H.; Anslan, S. Oomycete-specific ITS primers for identification and metabarcoding. MycoKeys 2016, 14, 17. [Google Scholar] [CrossRef]
- Burgess, T.I.; McDougall, K.L.; Scott, P.; Hardy, G.E.S.J.; Garnas, J. Predictors of Phytophthora diversity and distribution in natural areas across diverse Australian ecoregions. Ecography 2019, 42, 594–607. [Google Scholar] [CrossRef]
- Cerri, M.; Sapkota, R.; Coppi, A.; Ferri, V.; Foggi, B.; Gigante, D.; Lastrucci, L.; Selvaggi, R.; Venanzoni, R.; Nicolaisen, M.; et al. Oomycete communities associated with reed die-back syndrome. Front. Plant Sci. 2017, 8, 1550. [Google Scholar] [CrossRef]
- Bose, T.; Wingfield, M.J.; Roux, J.; Vivas, M.; Burgess, T.I. Community composition and distribution of Phytophthora species across adjacent native and non-native forests of South Africa. Fungal Ecol. 2018, 36, 17–25. [Google Scholar] [CrossRef]
- Gómez, F.J.R.; Navarro-Cerrillo, R.M.; Pérez-de-Luque, A.; Oβwald, W.; Vannini, A.; Morales-Rodríguez, C. Assessment of functional and structural changes of soil fungal and oomycete communities in holm oak declined dehesas through metabarcoding analysis. Sci. Rep. 2019, 9, 1–16. [Google Scholar] [CrossRef] [PubMed]
- Mora-Sala, B.; Gramaje, D.; Abad-Campos, P.; Berbegal, M. Diversity of Phytophthora species associated with Quercus ilex L. in three spanish regions evaluated by NGS. Forests 2019, 10, 979. [Google Scholar] [CrossRef]
- Redekar, N.R.; Eberhart, J.L.; Parke, J.L. Diversity of Phytophthora, Pythium, and Phytopythium species in recycled irrigation water in a container nursery. Phytobiomes J. 2019, 3, 31–45. [Google Scholar] [CrossRef]
- Sapp, M.; Tyborski, N.; Linstädter, A.; López Sánchez, A.; Mansfeldt, T.; Waldhoff, G.; Bareth, G.; Bonkowski, M.; Rose, L.E. Site-specific distribution of oak rhizosphere-associated oomycetes revealed by cytochrome c oxidase subunit II metabarcoding. Ecol. Evol. 2019, 9, 10567–10581. [Google Scholar] [CrossRef]
- Foster, Z.S.L.; Weiland, J.E.; Scagel, C.F.; Grünwald, N.J. The composition of the fungal and oomycete microbiome of Rhododendron roots under varying growth conditions, nurseries, and cultivars. Phytobiomes J. 2020, 4, 156–164. [Google Scholar] [CrossRef]
- Green, S.; Riddell, C.E.; Frederickson-Matika, D.; Armstrong, A.; Elliot, M.; Forster, J.; Hedley, P.E.; Morris, J.; Thorpe, P.; Cooke, D.E.; et al. Diversity of woody-host infecting Phytophthora species in public parks and botanic gardens as revealed by metabarcoding, and opportunities for mitigation through best practice. Sibbaldia 2020, 18, 67–88. [Google Scholar] [CrossRef]
- Legeay, J.; Husson, C.; Boudier, B.; Louisanna, E.; Baraloto, C.; Schimann, H.; Marcais, B.; Buée, M. Surprising low diversity of the plant pathogen Phytophthora in Amazonian forests. Environ. Microbiol. 2020, 22, 5019–5032. [Google Scholar] [CrossRef]
- Maciá-Vicente, J.G.; Nam, B.; Thines, M. Root filtering, rather than host identity or age, determines the composition of root-associated fungi and oomycetes in three naturally co-occurring Brassicaceae. Soil Biol. Biochem. 2020, 146, 107806. [Google Scholar] [CrossRef]
- Noel, Z.A.; Chang, H.X.; Chilvers, M.I. Variation in soybean rhizosphere oomycete communities from Michigan fields with contrasting disease pressures. Appl. Soil Ecol. 2020, 150, 103435. [Google Scholar] [CrossRef]
- Redekar, N.R.; Bourret, T.B.; Eberhart, J.L.; Johnson, G.E.; Pitton, B.J.L.; Haver, D.L.; Oki, L.R.; Parke, J.L. The population of oomycetes in a recycled irrigation water system at a horticultural nursery in southern California. Water Res. 2020, 183, 116050. [Google Scholar] [CrossRef] [PubMed]
- Riddell, C.E.; Dun, H.F.; Elliot, M.; Armstrong, A.C.; Clark, M.; Forster, J.; Hedley, P.E.; Green, S. Detection and spread of Phytophthora austrocedri within infected Juniperus communis woodland and diversity of co-associated Phytophthoras as revealed by metabarcoding. For. Pathol. 2020, e12602. [Google Scholar] [CrossRef]
- Bose, T.; Wingfield, M.J.; Roux, J.; Vivas, M.; Burgess, T.I. Phytophthora species associated with roots of native and non-native trees in natural and managed forests. Microb. Ecol. 2021, 81, 122–133. [Google Scholar] [CrossRef] [PubMed]
- Fiore-Donno, A.M.; Bonkowski, M. Different community compositions between obligate and facultative oomycete plant parasites in a landscape-scale metabarcoding survey. Biol. Fertil. Soils 2021, 57, 245–256. [Google Scholar] [CrossRef]
- Gyeltshen, J.; Dunstan, W.A.; Shaw, C.; Howard, K.; Grigg, A.H.; Hardy, G.E.S.J.; Burgess, T.I. Metabarcoding shows multiple Phytophthora species associated with individual plant species: Implications for restoration. Eur. J. Plant Pathol. 2021, 159, 359–369. [Google Scholar] [CrossRef]
- Khaliq, I.; Burgess, T.I.; Hardy, G.E.S.J.; White, D.; McDougall, K.L. Phytophthora and vascular plant species distributions along a steep elevation gradient. Biol. Invasions 2021, 23, 1443–1459. [Google Scholar] [CrossRef]
- Landa, B.B.; Arias-Giraldo, L.F.; Henricot, B.; Montes-Borrego, M.; Shuttleworth, L.A.; Pérez-Sierra, A. Diversity of Phytophthora species detected in disturbed and undisturbed british soils using high-throughput sequencing targeting ITS rRNA and COI mtDNA r egions. Forests 2021, 12, 229. [Google Scholar] [CrossRef]
- Marčiulynienė, D.; Marčiulynas, A.; Lynikienė, J.; Vaičiukynė, M.; Gedminas, A.; Menkis, A. DNA-Metabarcoding of belowground fungal communities in bare-root forest nurseries: Focus on different tree species. Microorganisms 2021, 9, 150. [Google Scholar] [CrossRef]
- Rossmann, S.; Lysøe, E.; Skogen, M.; Talgø, V.; Brurberg, M.B. DNA metabarcoding reveals broad presence of plant pathogenic oomycetes in soil from internationally traded plants. Front. Microbiol. 2021, 12, e637068. [Google Scholar] [CrossRef]
- Green, S.; Cooke, D.E.L.; Dunn, M.; Barwell, L.; Purse, B.V.; Chapman, D.S.; Valatin, G.; Schlenzig, A.; Barbrook, J.; Pettitt, T.; et al. PHYTO-THREATS: Addressing threats to UK forests and woodlands from Phytophthora; identifying risks of spread in trade and methods for mitigation. Forests 2021, 12, 1617. [Google Scholar] [CrossRef]
- Riit, T.; Tedersoo, L.; Drenkhan, R.; Runno-Paurson, E.; Kokko, H.; Anslan, S. Corrigendum for: “Oomycete-specific ITS primers for identification and metabarcoding” published in MycoKeys. MycoKeys 2018, 41, 119. [Google Scholar] [CrossRef] [PubMed]
- Tedersoo, L.; Bahram, M.; Põlme, S.; Kõljalg, U.; Yorou, N.S.; Wijesundera, R.; Ruiz, L.V.; Vasco-Palacios, A.M.; Thu, P.Q.; Suija, A.; et al. Global diversity and geography of soil fungi. Science 2014, 346, 1256688. [Google Scholar] [CrossRef] [PubMed]
- Cooke, D.E.L.; Drenth, A.; Duncan, J.M.; Wagels, G.; Brasier, C.M. A molecular phylogeny of Phytophthora and related Oomycetes. Fungal Genet. Biol. 2000, 30, 17–32. [Google Scholar] [CrossRef] [PubMed]
- Choi, Y.J.; Beakes, G.W.; Glockling, S.; Kruse, J.; Nam, B.; Nigrelli, L.; Ploch, S.; Shin, H.D.; Shivas, R.G.; Telle, S. Towards a universal barcode of oomycetes–a comparison of the cox1 and cox2 loci. Mol. Ecol. Resour. 2015, 15, 1275–1288. [Google Scholar] [CrossRef]
- Znajda, N.R.; Grooters, A.M.; Marsella, R. PCR-based detection of Pythium and Lagenidium DNA in frozen and ethanol-fixed animal tissues. Vet. Dermatol. 2002, 13, 187–194. [Google Scholar] [CrossRef]
- Lievens, B.; Hanssen, I.R.M.; Vanachter, A.C.R.C.; Cammue, B.P.A.; Thomma, B.P.H.J. Root and foot rot on tomato caused by Phytophthora infestans detected in Belgium. Plant Dis. 2004, 88, 86. [Google Scholar] [CrossRef]
- Foster, Z.S.L.; Albornoz, F.E.; Fieland, V.J.; Larsen, M.M.; Jones, F.A.; Tyler, B.M.; Nguyen, H.D.T.; Burgess, T.I.; Riddell, C.; Voglmayr, H.; et al. A new oomycete metabarcoding method using the rps10 gene. Phytobiomes 2022. [Google Scholar] [CrossRef]
- Martin, F.N.; Blair, J.E.; Coffey, M.D. A combined mitochondrial and nuclear multilocus phylogeny of the genus Phytophthora. Fungal Genet. Biol. 2014, 66, 19–32. [Google Scholar] [CrossRef]
- Hudspeth, D.S.S.; Nadler, S.A.; Hudspeth, M.E.S. A COX2 molecular phylogeny of the Peronosporomycetes. Mycologia 2000, 92, 674–684. [Google Scholar] [CrossRef]
- White, T.J.; Bruns, T.; Lee, S.; Taylor, J. Amplification and direct sequencing of fungal ribosomal RNA genes for phylogenetics. In PCR Protocols: A Guide to Methods and Applications; Innes, M.A., Gelfand, D.H., Sninsky, J.J., White, T.J., Eds.; Academic Press: San Diego, CA, USA, 1990; pp. 315–322. [Google Scholar]
- Thines, M.; Zipper, R.; Schäuffele, D.; Spring, O. Characteristics of Pustula tragopogonis (syn. Albugo tragopogonis) newly occurring on cultivated sunflower in Germany. J. Phytopathol. 2006, 154, 88–92. [Google Scholar] [CrossRef]
- Drenth, A.; Wagels, G.; Smith, B.; Sendall, B.; O’Dwyer, C.; Irvine, G.; Irwin, J. Development of a DNA-based method for detection and identification of Phytophthora species. Australas. Plant Pathol. 2006, 35, 147–159. [Google Scholar] [CrossRef]
- Weir, B.S.; Paderes, E.P.; Anand, N.; Uchida, J.Y.; Pennycook, S.R.; Bellgard, S.E.; Beever, R.E. A taxonomic revision of Phytophthora Clade 5 including two new species, Phytophthora agathidicida and P. cocois. Phytotaxa 2015, 205, 21–38. [Google Scholar] [CrossRef]
- Khaliq, I.; Hardy, G.E.S.J.; White, D.; Burgess, T.I. eDNA from roots: A robust tool for determining Phytophthora communities in natural ecosystems. FEMS Microbiol. Ecol. 2018, 94, fiy048. [Google Scholar] [CrossRef]
- Edgar, R. Usearch; Lawrence Berkeley National Lab. (LBNL): Berkeley, CA, USA, 2010.
- Zuur, A.F.; Leno, E.N. A protocol for conducting and presenting results of regression-type analyses. Methods Ecol. Evol. 2016, 7, 636–645. [Google Scholar] [CrossRef]
- Oksanen, J.; Blanchet, F.G.; Friendly, M.; Kindt, R.; Legendre, P.; McGlinn, D.; Minchin, P.R.; O’Hara, R.B.; Simpson, G.L.; Solymos, P.; et al. Vegan: Community Ecology Package. Version 2.5-6. 2016. Available online: http://CRAN.R-project.org/package=vegan (accessed on 1 July 2022).
- Lofgren, L.A.; Uehling, J.K.; Branco, S.; Bruns, T.D.; Martin, F.; Kennedy, P.G. Genome-based estimates of fungal rDNA copy number variation across phylogenetic scales and ecological lifestyles. Mol. Ecol. 2019, 28, 721–730. [Google Scholar] [CrossRef] [PubMed]
- Dickie, I.A.; Wakelin, A.M.; Martínez-García, L.B.; Richardson, S.J.; Makiola, A.; Tylianakis, J.M. Oomycetes along a 120,000 year temperate rainforest ecosystem development chronosequence. Fungal Ecol. 2019, 39, 192–200. [Google Scholar] [CrossRef]
- Martin, F.N.; Albornoz, F.; Foster, Z.; Fieland, V.; Larson, M.; Jones, F.A.; Tyler, B.M.; Nguyen, H.; Voglmayr, H.; Burgess, T.I.; et al. The rps10 gene as a new barcode locus for oomycetes and its utility in metagenomics studies of environmental samples. Phytopathology 2019, 109, 101–102. [Google Scholar]
- Murray, D.C.; Coghlan, M.L.; Bunce, M. From benchtop to desktop: Important considerations when designing amplicon sequencing workflows. PLoS ONE 2015, 10, e0124671. [Google Scholar]
- Husson, C.; Aguayo, J.; Revellin, C.; Frey, P.; Ioos, R.; Marçais, B. Evidence for homoploid speciation in Phytophthora alni supports taxonomic reclassification in this species complex. Fungal Genet. Biol. 2015, 77, 12–21. [Google Scholar] [CrossRef]
- Ioos, R.; Andrieux, A.; Marçais, B.; Frey, P. Genetic characterization of the natural hybrid species Phytophthora alni as inferred from nuclear and mitochondrial DNA analyses. Fungal Genet. Biol. 2006, 43, 511–529. [Google Scholar] [CrossRef]
- Reeser, P.W.; Sutton, W.; Hansen, E.M.; Remigi, P.; Adams, G.C. Phytophthora species in forest streams in Oregon and Alaska. Mycologia 2011, 103, 22–35. [Google Scholar] [CrossRef] [PubMed]
- Hüberli, D.; Hardy, G.E.S.; White, D.; Williams, N.; Burgess, T.I. Fishing for Phytophthora from Western Australia’s waterways: A distribution and diversity survey. Australas. Plant Pathol. 2013, 42, 251–260. [Google Scholar] [CrossRef]
- Nagel, J.H.; Gryzenhout, M.; Slippers, B.; Wingfield, M.J.; Hardy, G.E.S.; Stukely, M.J.C.; Burgess, T.I. Characterization of Phytophthora hybrids from ITS clade 6 associated with riparian ecosystems in South Africa and Australia. Fungal Biol. 2013, 117, 329–347. [Google Scholar] [CrossRef] [PubMed]
- Burgess, T.I. Molecular characterization of natural hybrids formed between five related indigenous clade 6 Phytophthora species. PLoS ONE 2015, 10, e0134225. [Google Scholar] [CrossRef] [PubMed]
- Yang, X.; Richardson, P.A.; Hong, C. Phytophthora × stagnum nothosp. nov., a new hybrid from irrigation reservoirs at ornamental plant nurseries in Virginia. PLoS ONE 2014, 9, e103450. [Google Scholar] [CrossRef]
- Safaiefarahani, B.; Mostowfizadeh-Ghalamfarsa, R.; Hardy, G.E.S.; Burgess, T.I. Species from within the Phytophthora cryptogea complex and related species, P. erythroseptica and P. sansomeana, readily hybridize. Fungal Biol. 2016, 120, 975–987. [Google Scholar] [CrossRef]
- Man in’t Veld, W.A.; Rosendahl, K.C.H.M.; Hong, C. Phytophthora × serendipita sp. nov. and P. × pelgrandis, two destructive pathogens generated by natural hybridization. Mycologia 2012, 104, 1390–1396. [Google Scholar] [CrossRef] [Green Version]
Figure 1.
Relationship between the DNA concentration (ng/μL) and the proportion of reads for each Phytophthora species in the mock community (MIX2) for (A) amplification with ITS primer set P4 and (B) amplification with rps10 primer set P10. The data points are coded based on the DNA concentration as per Figure 2; the darker colours correspond to higher DNA concentration. The R2 value is for the goodness of fit based on simple linear regression.

Figure 2.
Phylogenetic representation based on ITS gene region of the Phytophthora species in the mock community MIX2. The relative proportion of DNA of each species (as a percentage) and the average relative abundance of reads obtained for each species (as a percentage) are colour-coded as per the legend.
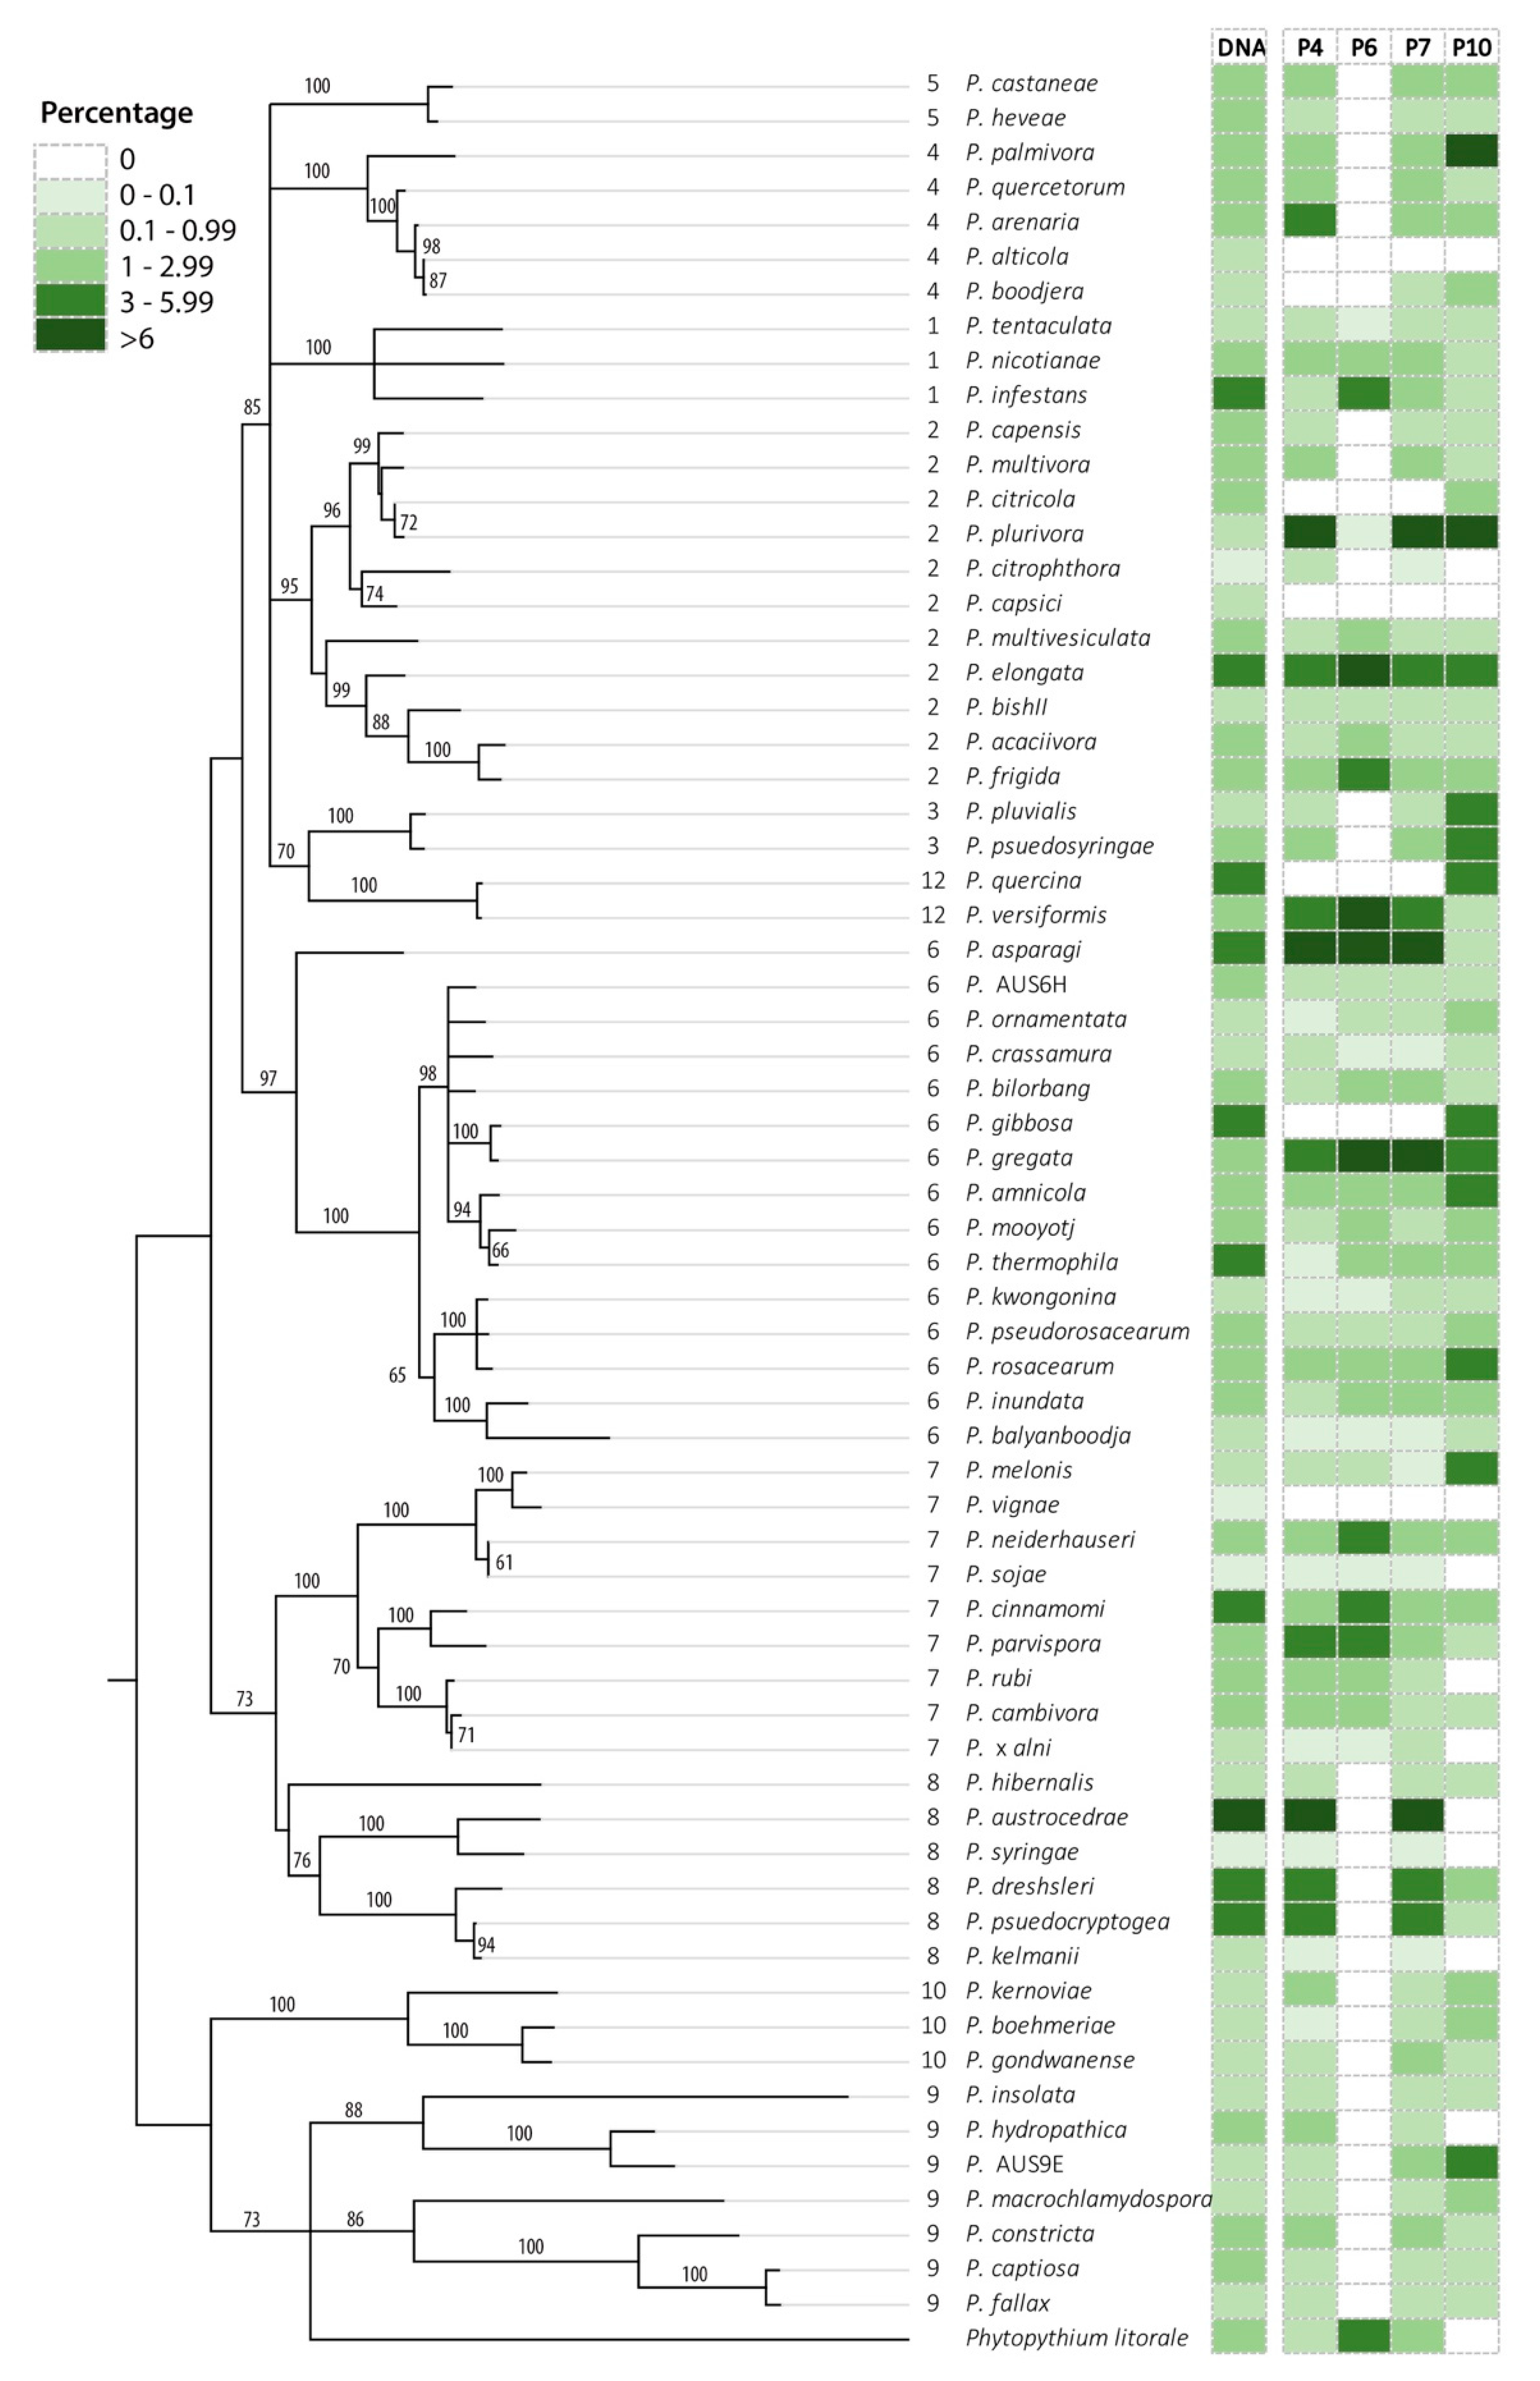
Figure 3.
The nonmetric multidimensional scaling (NMDS) plot demonstrates the community composition of environmental samples (i.e., E1–E4) amplified by 10 primer sets. Each sample was run in triplicate. Community composition from (A) relative abundance data (stress = 0.174) and (B) presence–absence data (stress = 0.173).
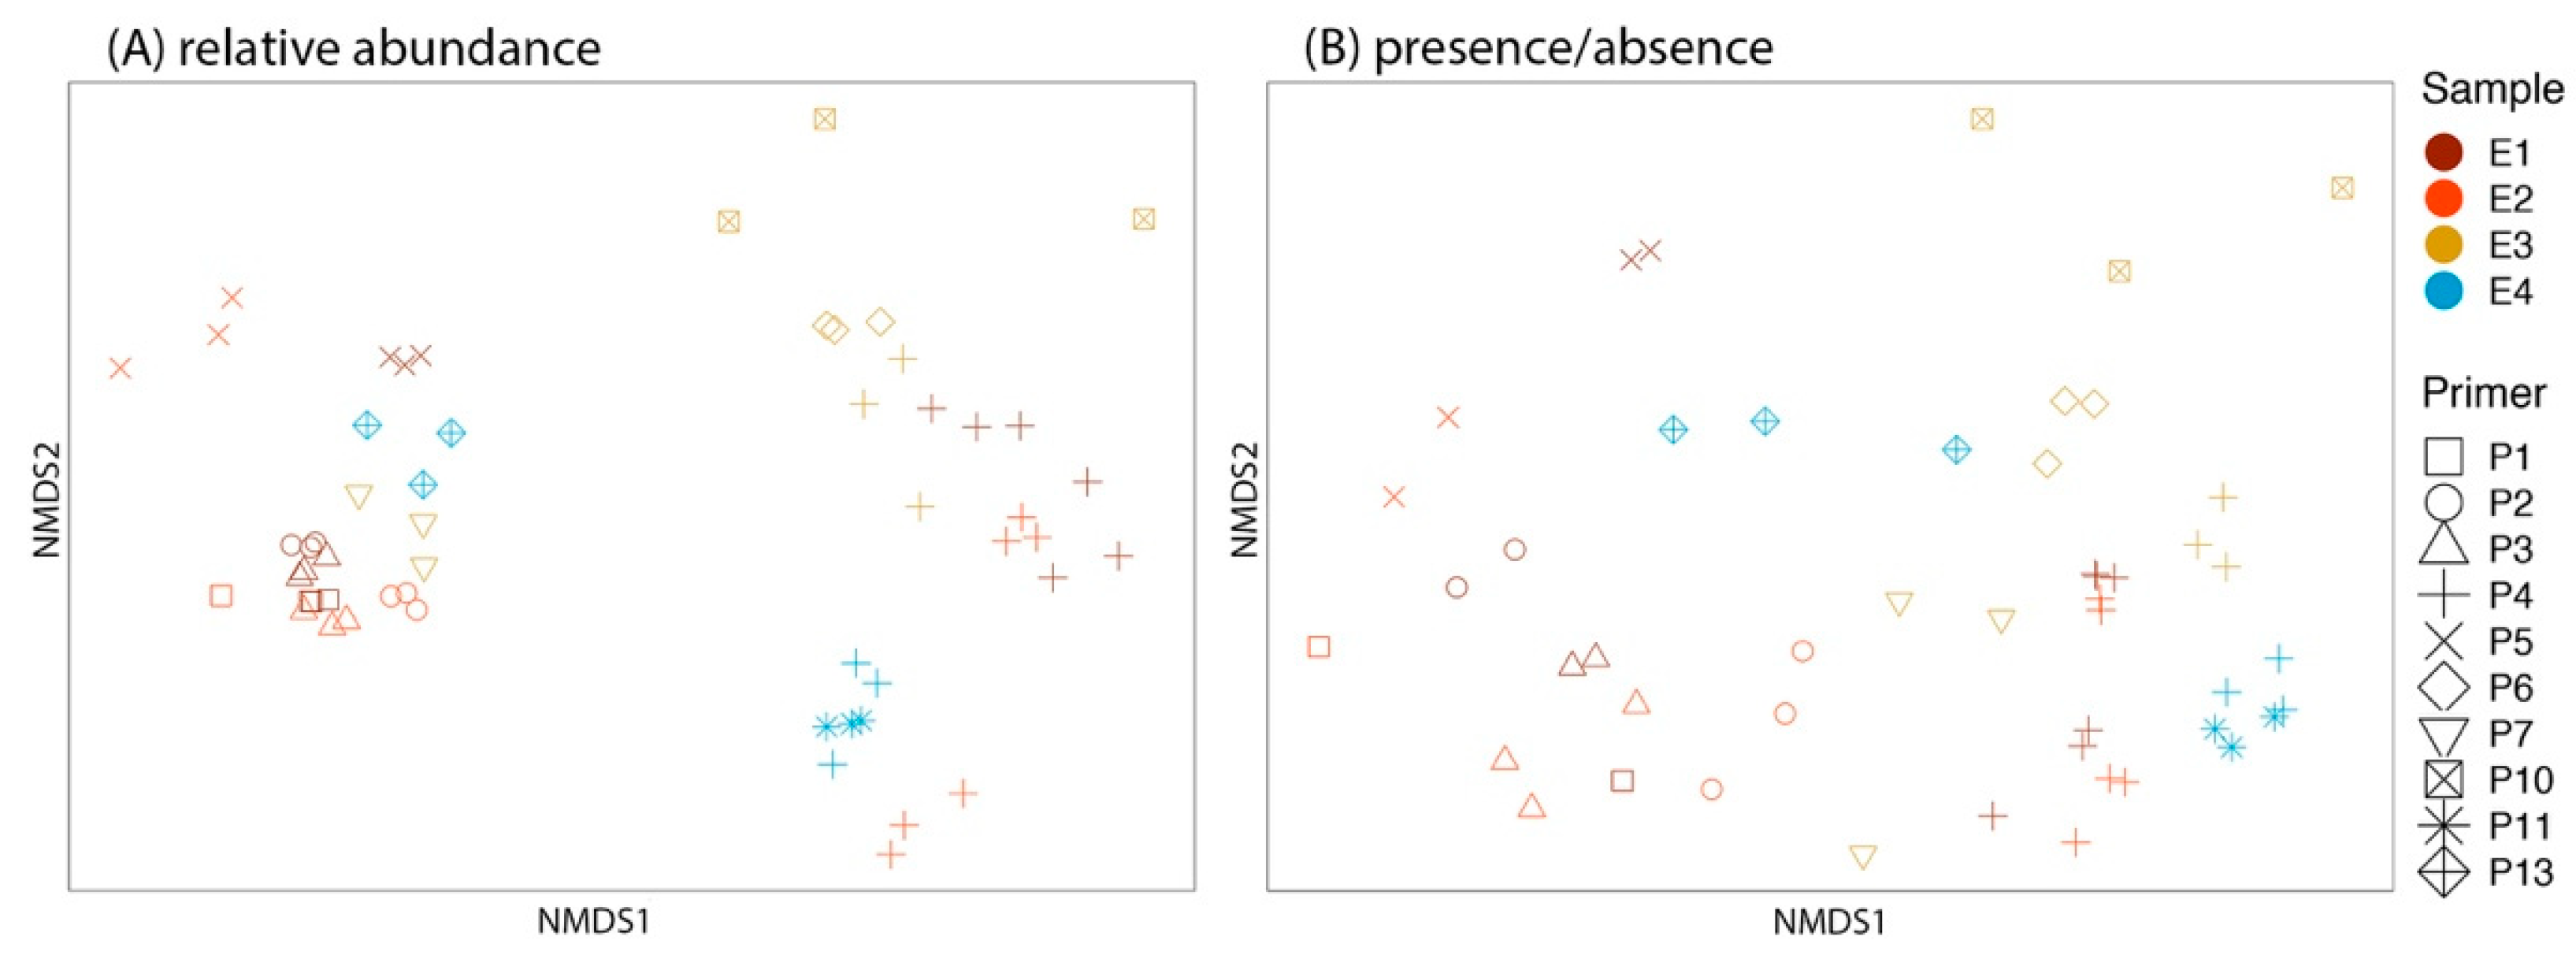
Figure 4.
Mean rarefied species richness of environmental samples (i.e., E1–E4) across three replicates for 10 different primers. Each panel demonstrates the primers used across 4 sequencing runs. Letters indicate significant differences among primers in each run (i.e., each run was analysed separately). Points represent the means ± standard deviations.
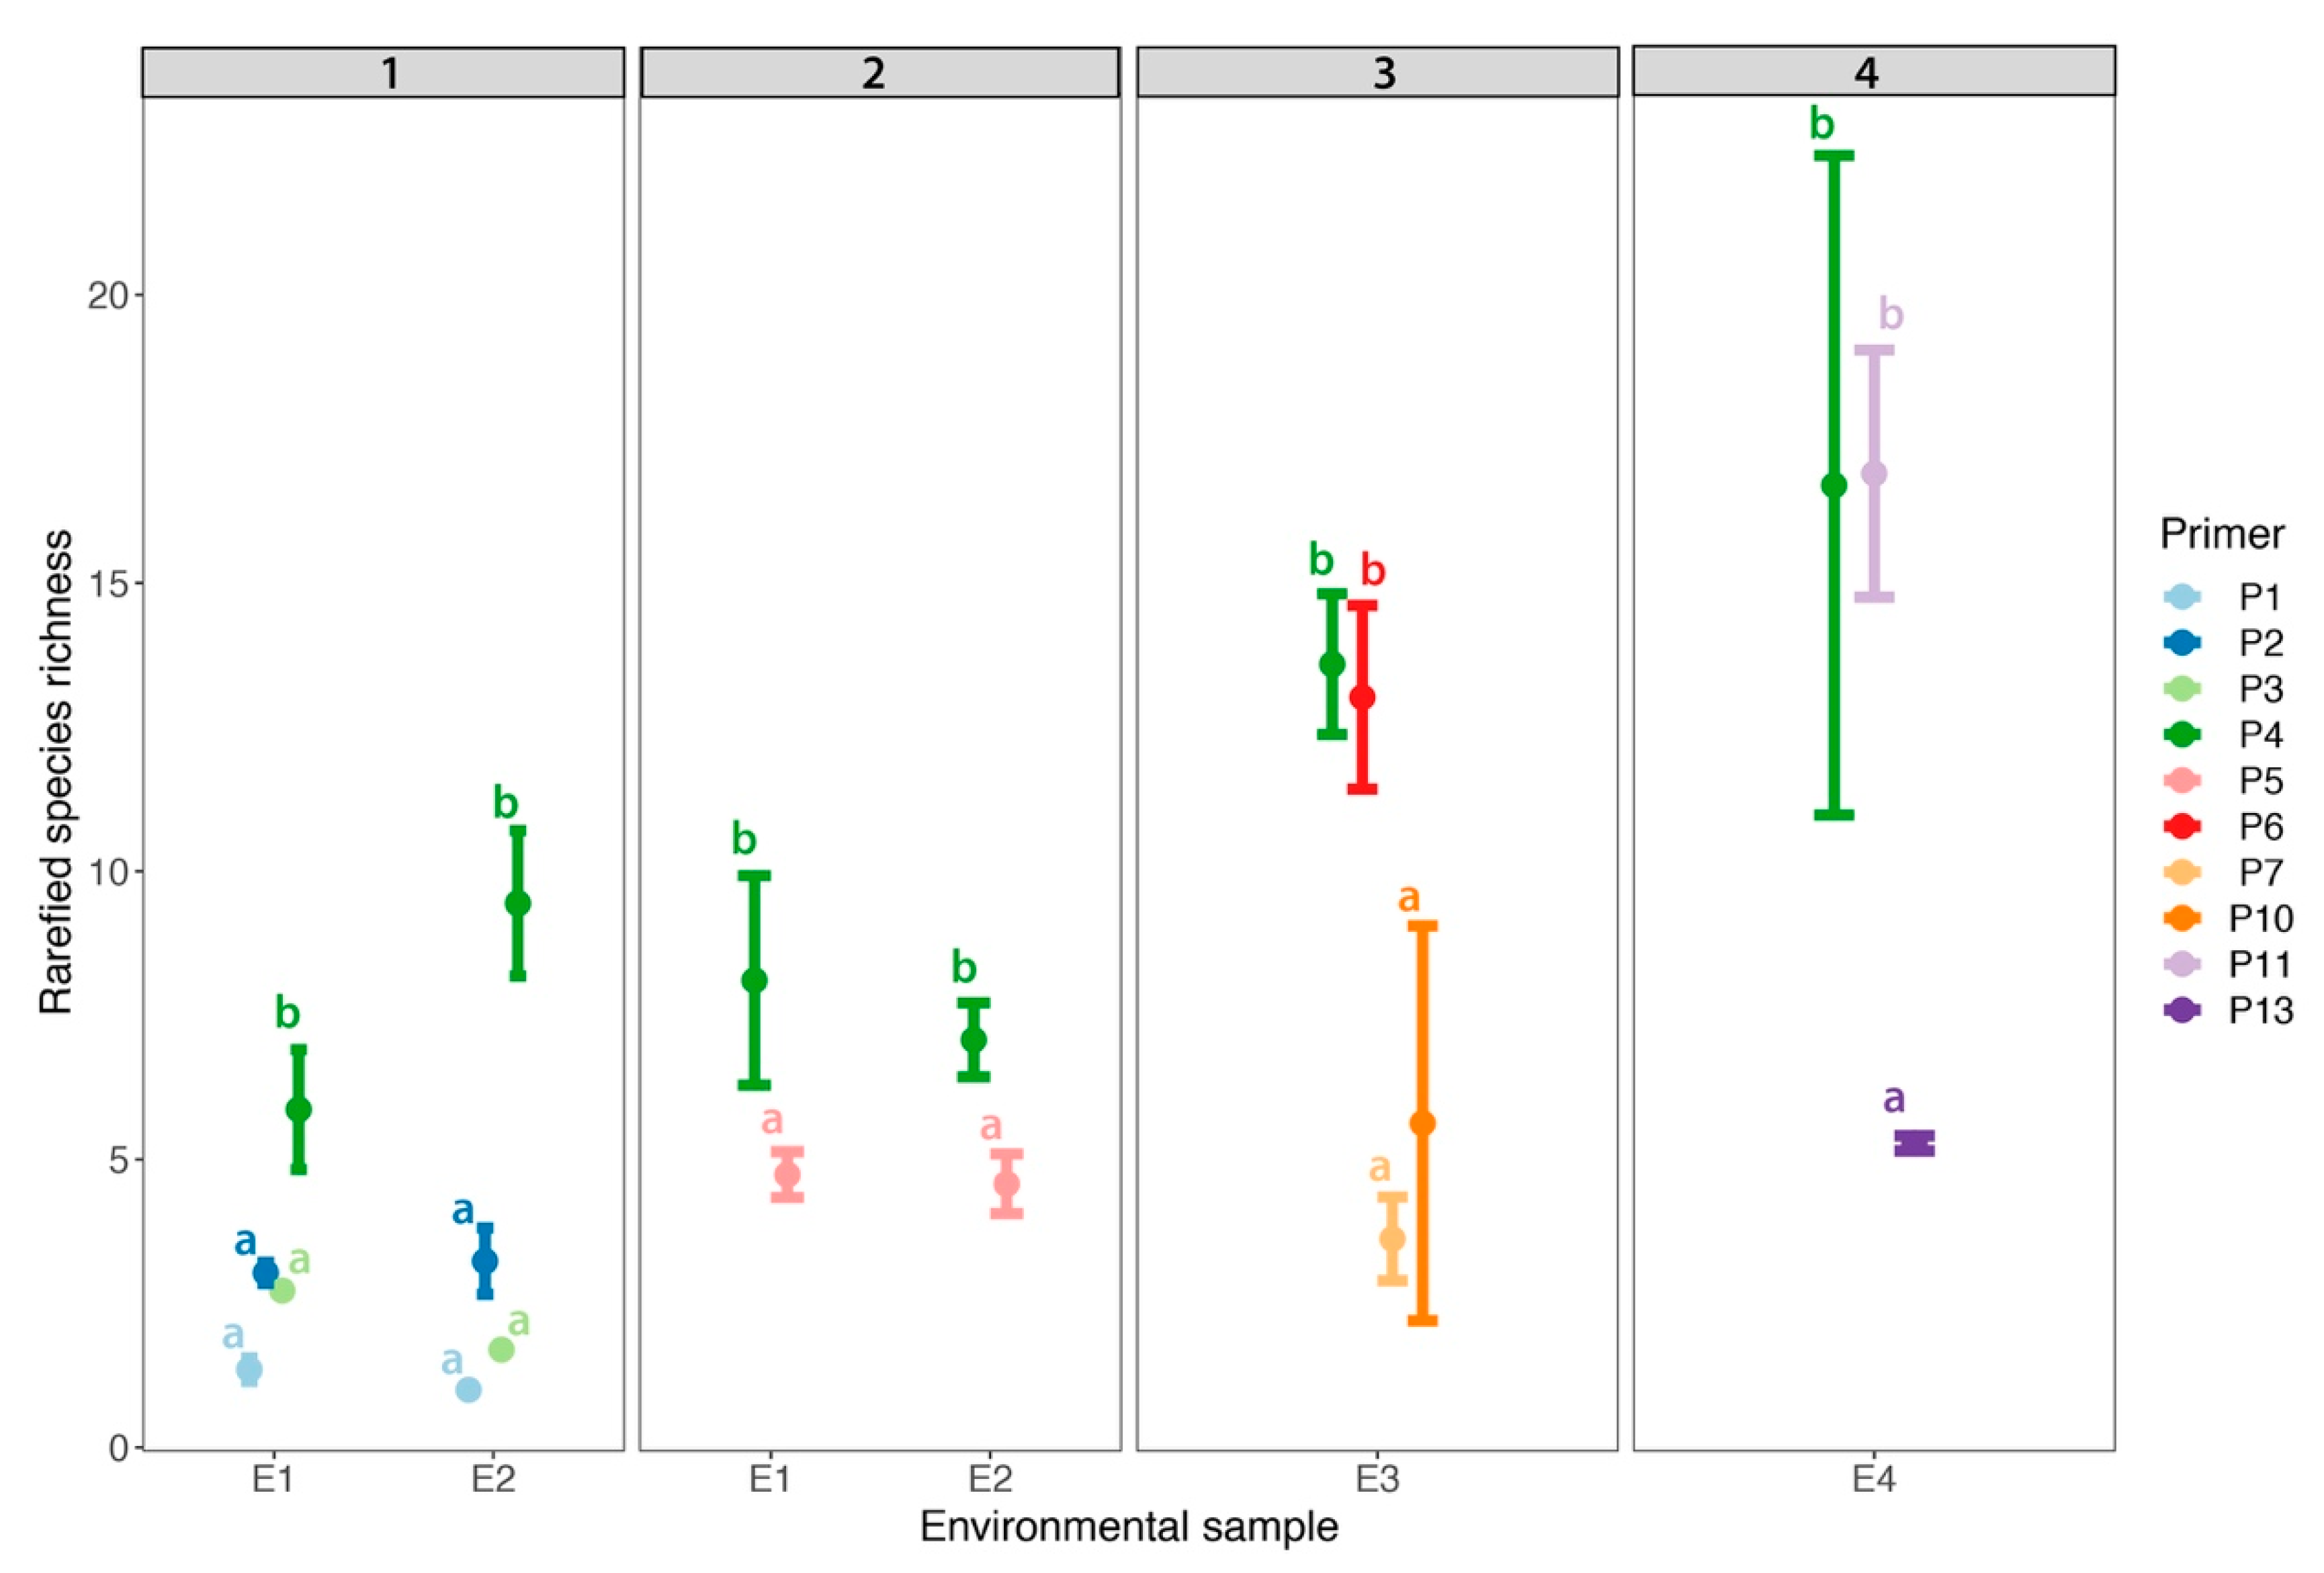
Table 2.
Details of the primers used in four separate metabarcoding runs. Primers sets were coded P1 to P21. Nested PCR was conducted for primer sets P4, P5, P6, P8, and P11. Primer sets P14–21 were not tested, but were included as they related to the studies presented in Table 1. Amplicon size including primers (size) and the annealing temperature (AT) of the PCR reaction are also provided for primers used in the current study. Primer set P4 was included in all the runs for comparison purposes.
| Code | D | Primer | Sequence | Size | AT | Run1 | Run2 | Run3 | Run4 | Reference for Primer | |
|---|---|---|---|---|---|---|---|---|---|---|---|
| P1 1 (O) | PCR1 | F | ITS1oo | #F-GGA AGG ATC ATT ACC ACA | 900 | 60 | Y | Riit et al. [29] | |||
| R | ITS4ngs | #R-GTC CTS CGC TTA TTG ATA TGC | Tedersoo et al. [53] | ||||||||
| P2 (P) | PCR1 | F | ITS1oo | #F-GGA AGG ATC ATT ACC ACA | 350 | 60 | Y | Riit et al. [29] | |||
| R | ITS7 | #R-GAG CGT TCT TCA TCG ATG TGC | Cooke et al. [54] | ||||||||
| P3 (O) | PCR1 | F | ITS6 | #F-GAA GGT GAA GTC GTA ACA AGG | 500 | 60 | Y | Cooke et al. [54] | |||
| R | ITS7 | #R-GAG CGT TCT TCA TCG ATG TGC | Cooke et al. [54] | ||||||||
| P4 (P) | PRC1 | F | 18Ph2F | GGA TAG ACT GTT GCA ATT TTC AGT | 400 | 60 | Y | Y | Y | Y | Scibetta et al. [16] |
| R | 5.8S1R | GCA RRG ACT TTC GTC CCY RC | Scibetta et al. [16] | ||||||||
| PCR2 | F | ITS6 | #F-GAA GGT GAA GTC GTA ACA AGG | 350 | 60 | Cooke et al. [54] | |||||
| R | 5.8S1R | #R-GCA RRG ACT TTC GTC CCY RC | Scibetta et al. [16] | ||||||||
| P5 1 (O) | PCR1 | F | COX1levup-F | TCA WCW MGA TGG CTT TTT TCA AC | nd | 52 | Y | Choi et al. [55] | |||
| R | COX1levlo-R | CYT CHG GRT GWC CRA AAA ACC AAA | Choi et al. [55] | ||||||||
| PCR2 | F | Hvshort-F | #F-GNA TGA AYA AYA THA GYT TYT GG | 500 | 52 | Landa et al. [48] | |||||
| R | COX1levlo-R | #R-CYT CHG GRT GWC CRA AAA ACC AAA | Choi et al. [55] | ||||||||
| P6 (O) | PCR1 | F | ITS6 | GAA GGT GAA GTC GTA ACA AGG | nd | 60 | Y | Cooke et al. [54] | |||
| R | ITS2P | GCA GCG TTC TTC ATC GAT GT | Znajda et al. [56] | ||||||||
| PCR2 | F | OOMUP18Sc | #F-TGC GGA AGG ATC ATT ACC ACA C | 350 | 60 | Lievens et al. [57] | |||||
| R | 5.8S1R | #R-GCA RRG ACT TTC GTC CCY RC | Scibetta et al. [16] | ||||||||
| P7 (O) | PCR1 | F | OOMUP18Sc | TGC GGA AGG ATC ATT ACC ACA C | 400 | 60 | Y | Lievens et al. [57] | |||
| R | ITS2P | GCA GCG TTC TTC ATC GAT GT | Znajda et al. [56] | ||||||||
| P8 2 (O) | PCR1 | F | ITS6 | GAA GGT GAA GTC GTA ACA AGG | na | 60 | Y | Cooke et al. [54] | |||
| R | 5.8S1R | GCA RRG ACT TTC GTC CCY RC | Scibetta et al. [16] | ||||||||
| PCR2 | F | OOMUP18Sc | #F-TGC GGA AGG ATC ATT ACC ACA C | na | 60 | Lievens et al. [57] | |||||
| R | 5.8S1R | #R-GCA RRG ACT TTC GTC CCY RC | Scibetta et al. [16] | ||||||||
| P9 2 (O) | PCR1 | F | rps10-F | #F-GTT GGT TAG AGY ARA AGA CT | 550 | 59 | Y | Foster et al. [58] | |||
| R | rps10-R | #R-ATR YYT AGA AAG AYT YGA ACT | Foster et al. [58] | ||||||||
| P10 (O) | PCR1 | F | PRV9-F | GTT GGT TAG AGT AAA AGA CT | na | 59 | Y | Martin et al. [59] | |||
| R | PRV9-R | GTA TAC TCT AAC CAA CTG AGT | Martin et al. [59] | ||||||||
| PCR2 | F | rps10-F | #F-GTT GGT TAG AGY ARA AGA CT | 550 | 59 | Foster et al. [58] | |||||
| R | rps10-R | #R-ATR YYT AGA AAG AYT YGA ACT | Foster et al. [58] | ||||||||
| P11 (P) | PCR1 | F | Oom18S | GCG CAT CGT GCT AGG GAT AG | nd | Y | Legeay et al. [22] | ||||
| R | ITS7 | GAG CGT TCT TCA TCG ATG TGC | Cooke et al. [54] | ||||||||
| PCR2 | F | 18Ph2F | #F-GAA GGT GAA GTC GTA ACA AGG | 400 | Scibetta et al. [16] | ||||||
| R | 5.8S1R | #R-GCA RRG ACT TTC GTC CCY RC | Scibetta et al. [16] | ||||||||
| P12 3 (O) | PCR1 | F | ITS1oo(c) | #F-GGA AGG ATC ATT ACC ACAC | Y | Riit et al. [52] | |||||
| R | ITS7 | #R-GAG CGT TCT TCA TCG ATG TGC | Cooke et al. [54] | ||||||||
| P13 (O) | PCR1 | F | Cox2hud-F | #F-GGC AAA TGG GTT TTC AAG ATC C | Y | Hudspeth et al. [60] | |||||
| R | Cox233D8r | #R-GAA TAT TCA TAR STC CAR TAC C | Sapp et al. [36] | ||||||||
| P14 (O) | PCR1 | F | ITS6 | GAA GGT GAA GTC GTA ACA AGG | Cooke et al. [54] | ||||||
| R | ITS4 | TCC TCC GCT TAT TGA TAT GC | White et al. [61] | ||||||||
| PCR2 | F | ITS6 | #F-GAA GGT GAA GTC GTA ACA AGG | Cooke et al. [54] | |||||||
| R | ITS7 | #R-GAG CGT TCT TCA TCG ATG TGC | Cooke et al. [54] | ||||||||
| P15 (O) | PCR1 | F | ITS1O | #F-CGGAAGGATCATTACCAC | Thines et al. [62] | ||||||
| R | 5.8S-O-Rev | #R-AGCCTAGACATCCACTGCTG | Agler et al. [27] | ||||||||
| P16 4 (P) | PCR1 | F | A2 | ACT TTC CAC GTG AAC CGT TTC AA | Drenth et al. [63] | ||||||
| R | I2 | GAT ATC AGG TCC AAT TGA GAT GC | Drenth et al. [63] | ||||||||
| P17 (O) | PCR1 | F | DC6 | GAG GGA CTT TTG GGT AAT CA | Cooke et al. [54] | ||||||
| R | ITS7 | GAG CGT TCT TCA TCG ATG TGC | Cooke et al. [54] | ||||||||
| PCR2 | F | Oom18S | #F-GCG CAT CGT GCT AGG GAT AG | Legeay et al. [22] | |||||||
| R | ITS7 | #R-GAG CGT TCT TCA TCG ATG TGC | Cooke et al. [54] | ||||||||
| P18 (O) | PCR1 | F | Yph1F | #F-CGA CCA TKG GTG TGG ACT TT | Weir et al. [64] | ||||||
| R | Yph2R | #R-ACG TTC TCM CAG GCG TAT CT | Weir et al. [64] | ||||||||
| P19 (O) | PCR1 | F | Cox2hud-F | #F-GGC AAA TGG GTT TTC AAG ATC C | Hudspeth et al. [60] | ||||||
| R | Cox2-RC4 | #R-TGA TTW AYN CCA CAA ATT TCR CTA CAT TG | Choi et al. [55] | ||||||||
| P20 (O) | PCR1 | F | S1777F | GGT GAA CCT GCG GAA GGA | Fiore-Donno and Bonkowski [45] | ||||||
| R | 5.8SOomR | TCT TCA TCG DTG TGC GAG C | Fiore-Donno and Bonkowski [45] | ||||||||
| PCR2 | F | S1786StraF | #F-GCG GAA GGA TCA TTA CCA C | Fiore-Donno and Bonkowski [45] | |||||||
| R | 5.8SOomR | #R-TCT TCA TCG DTG TGC GAG C | Fiore-Donno and Bonkowski [45] | ||||||||
| P21 (O) | PCR1 | F | ITS3oo | #F-AGT ATG YYT GTA TCA GTG TC | Riit et al. [52] | ||||||
| R | ITS4 | #R-TCC TCC GCT TAT TGA TAT GC | White et al. [61] |
#F = forward Illumina adaptor TCG TCG GCA GCG TCA GAT GTG TAT AAG AGA CAG; #R = reverse Illumina adaptor GTC TCG TGG GCT CGG AGA TGT GTA TAA GAG ACAG; 1 forward only analysed; 2 amplification failed for P8, amplification was only successful for the mock community for P9; 3 P12 was tested for run4, but after repeated attempts we could not produce an PCR product; 4 P16 not used in current study as amplicon is too long for Illumina.
Table 3.
Summary data for four metabarcoding runs for the mock community (MIX1–3) and the four eDNA samples (E1-E4) and for the combination of MIX1+E1 included in run 2, MIX2+E3 included in run 3 and MIX3+E4 included in run 4.
Table 3.
Summary data for four metabarcoding runs for the mock community (MIX1–3) and the four eDNA samples (E1-E4) and for the combination of MIX1+E1 included in run 2, MIX2+E3 included in run 3 and MIX3+E4 included in run 4.
| Metabarcoding Run | Run1 | Run1 | Run1 | Run1 | Run2 | Run2 | Run3 | Run3 | Run3 | Run3 | Run4 | Run4 | Run4 |
|---|---|---|---|---|---|---|---|---|---|---|---|---|---|
| Primer Combination | P1 | P2 | P3 | P4 | P4 | P5 | P4 | P6 | P7 | P10 | P4 | P11 | P13 |
| Gene Region Amplified | ITS | ITS | ITS | ITS | ITS | COX1 | ITS | ITS | ITS | RPS | ITS | ITS | COX2 |
| Sample | MIX1 | MIX1 | MIX1 | MIX1 | MIX1 | MIX1 | MIX2 | MIX2 | MIX2 | MIX2 | MIX3 | MIX3 | MIX3 |
| Average number of reads | 6 684 | 11,196 | 23,109 | 37,755 | 14,511 | 4105 | 18,942 | 8756 | 24,607 | 10,045 | 13,003 | 13,594 | 13,179 |
| Phytophthoraspecies detected | 37 | 46 | 46 | 46 | 45 | 25 | 59 | 33 | 60 | 55 | 47 | 34 | 47 |
| Species missed from MIX | 13 | 4 | 4 | 4 | 5 | 25 | 7 | 33 | 6 | 11 | 14 | 25 | 14 |
| Relationship between reads and DNA concentration | 0.613 | 0.665 | 0.613 | 0.75 | 0.732 | 0.095 | 0.650 | 0.261 | 0.526 | 0.037 | 0.385 | 0.063 | 0.143 |
| Sample | E1 | E1 | E1 | E1 | E1 | E1 | E3 | E3 | E3 | E3 | E4 | E4 | E4 |
| Average number of reads | 21,546 | 6002 | 28,349 | 12,084 | 27,587 | 6440 | 25,009 | 22,083 | 15,698 | 18,203 | 23,155 | 16,158 | 7879 |
| % Phytophthora reads | 0.02 | 0.14 | 0.06 | 100 | 99.93 | 7.49 | 100 | 99.72 | 0.17 | 41.55 | 99.73 | 87.16 | 3.25 |
| % Oomycete reads | 0.02 | 1.03 | 0.30 | 100 | 100 | 40 | 100 | 99.72 | 0.17 | 100 | 99.96 | 99.94 | 3.25 |
| Phytophthoraspecies detected | 2 | 2 | 3 | 11 | 15 | 4 | 23 | 16 | 11 | 10 | 29 | 23 | 13 |
| Species missed from eDNA sample | 14 | 14 | 15 | 5 | 1 | 11 | 3 | 10 | 15 | 16 | 3 | 9 | 19 |
| Sample | E2 | E2 | E2 | E2 | E2 | E2 | |||||||
| Average number of reads | 11,326 | 8844 | 9142 | 65,551 | 19,638 | 3957 | |||||||
| % Phytophthora reads | 0 | 0.15 | 0.04 | 77.83 | 100 | 44.21 | |||||||
| % Oomycete reads | 0 | 0.16 | 0.05 | 100 | 100 | 60.37 | |||||||
| Phytophthoraspecies detected | 0 | 7 | 2 | 13 | 11 | 3 | |||||||
| Species missed from eDNA sample | 16 | 9 | 14 | 3 | 5 | 13 | |||||||
| Sample | E1+ MIX1 | E1+ MIX1 | E3+ MIX2 | E3+ MIX2 | E3+ MIX2 | E3+ MIX2 | E4+ MIX3 | E4+ MIX3 | E4+ MIX3 | ||||
| Average number of reads | 36,097 | 3247 | 21,696 | 11,490 | 10,001 | 16,514 | 16,136 | 14,872 | 15,740 | ||||
| % Phytophthora reads | 100 | 76.44 | 99.87 | 97.56 | 2.41 | 88.05 | 99.61 | 99.41 | 99.48 | ||||
| % Oomycete reads | 100 | 83 | 100 | 99.98 | 2.42 | 100 | 99.96 | 99.90 | 99.48 | ||||
| Phytophthoraspecies detected | 46 | 25 | 57 | 30 | 41 | 51 | 38 | 36 | 48 | ||||
| Species missed from MIX | 6 | 25 | 10 | 37 | 26 | 16 | 22 | 24 | 12 | ||||
| Species missed from eDNA sample | 1 | 5 | 2 | 10 | 3 | 2 | 9 | 10 | 7 |
The mock community MIX1 is comprised of 49 species, MIX2 is comprised of 66 species, and MIX3 is comprised of 61 species; the environmental DNA samples E1 and E2 are comprised of 16 species, E3 is comprised of 26 species, and E4 is comprised of 32 species.
Table 4.
Percentage of the total number of reads of each Phytophthora species detected for three technical replicates of environmental sample E3 amplified with primers P4, P6, and P10. The average percent of reads is also given (AV). Cells are colour-coded, as per Figure 2.
Table 4.
Percentage of the total number of reads of each Phytophthora species detected for three technical replicates of environmental sample E3 amplified with primers P4, P6, and P10. The average percent of reads is also given (AV). Cells are colour-coded, as per Figure 2.
| Phytophthora Species | Clade | P4 | P4 | P4 | P4 | P6 | P6 | P6 | P6 | P10 | P10 | P10 | P10 |
|---|---|---|---|---|---|---|---|---|---|---|---|---|---|
| 1 | 2 | 3 | AV | 1 | 2 | 3 | AV | 1 | 2 | 3 | AV | ||
| P. nicotianae | 1 | 20.5 | 10.4 | 7.32 | 12.3 | 7.52 | 10.2 | 0.01 | 3.03 | ||||
| P. acaciivora | 2 | 0.01 | 11.1 | 0.01 | 2.73 | 4.88 | 4.65 | 0.01 | 1.82 | ||||
| P. capensis | 2 | 1.61 | 0.70 | 0.89 | 0.25 | ||||||||
| P. elongata | 2 | 10.9 | 0.04 | 0.02 | 3.49 | 0.03 | 0.06 | 0.01 | 0.02 | ||||
| P. multivora | 2 | 0.01 | 9.61 | 19.3 | 10.8 | 0.02 | 0.01 | ||||||
| P. plurivora | 2 | 0.03 | 0.02 | 0.25 | 0.13 | 63.9 | 0.10 | 17.9 | |||||
| P. arenaria | 4 | 5.92 | 12.9 | 8.70 | 8.84 | ||||||||
| P. boodjera | 4 | 1.39 | 0.34 | ||||||||||
| P. palmivora | 4 | 4.45 | 10.5 | 5.99 | 0.05 | 29.9 | 13.1 | ||||||
| P. amnicola | 6 | 8.38 | 6.73 | 2.29 | 5.31 | 2.25 | 8.17 | 14.6 | 10.4 | ||||
| P. asparagi | 6 | 16.5 | 7.19 | 0.04 | 7.03 | 4.68 | 13.5 | 4.37 | 5.16 | ||||
| P. bilorbang | 6 | 0.02 | 6.91 | 0.07 | 0.57 | 2.05 | 0.57 | ||||||
| P. gibbosa 1 | 6 | 23.0 | 0.03 | 6.44 | |||||||||
| P. gregata | 6 | 0.15 | 0.09 | 0.01 | 0.07 | 7.02 | 0.20 | 4.22 | 4.76 | 0.12 | 0.03 | ||
| P. inundata | 6 | 0.01 | 0.02 | 0.01 | 0.02 | 0.04 | 0.01 | ||||||
| P. moyootj | 6 | 0.01 | 0.02 | 0.01 | 0.01 | ||||||||
| P. rosacearum | 6 | 2.26 | 0.01 | 0.55 | 0.01 | 0.01 | |||||||
| P. thermophila | 6 | 0.03 | 0.06 | 3.12 | 1.96 | 0.03 | 0.01 | ||||||
| P. cambivora | 7 | 0.03 | 5.18 | 1.28 | 4.65 | 7.67 | 6.64 | 6.12 | |||||
| P. cinnamomi | 7 | 9.02 | 0.04 | 0.01 | 2.88 | 12.1 | 6.70 | 0.01 | 4.16 | 6.85 | 2.98 | ||
| P. niederhauserii | 7 | 8.07 | 7.06 | 13.2 | 10.1 | 8.52 | 15.8 | 18.8 | 15.5 | 28.2 | 12.3 | ||
| P. drechsleri | 8 | 0.01 | 0.01 | 0.01 | 0.01 | 0.05 | 0.03 | 0.03 | |||||
| P. pseudocryptogea | 8 | 0.01 | 0.02 | 7.02 | 3.08 | ||||||||
| P. syringae | 8 | 0.01 | 2.77 | 2.26 | 1.67 | ||||||||
| P. AUS12A | 12 | 15.8 | 23.1 | 27.5 | 22.7 | 44.3 | 12.7 | 42.6 | 40.9 | 99.9 | 9.87 | 34.8 | 46.4 |
| P. versiformis | 12 | 0.06 | 0.01 | 0.02 | 3.92 | 13.3 | 5.35 | 5.52 | |||||
| No. species detected | 20 | 19 | 21 | 23 | 15 | 14 | 14 | 16 | 2 | 7 | 8 | 11 | |
| No. species not detected | 6 | 7 | 5 | 3 | 11 | 12 | 12 | 10 | 24 | 17 | 16 | 15 | |
1 it is not possible to separate P. gregata and P. gibbosa with ITS primer sets P4 and P6.
Publisher’s Note: MDPI stays neutral with regard to jurisdictional claims in published maps and institutional affiliations. |
© 2022 by the authors. Licensee MDPI, Basel, Switzerland. This article is an open access article distributed under the terms and conditions of the Creative Commons Attribution (CC BY) license (https://creativecommons.org/licenses/by/4.0/).
Share and Cite
MDPI and ACS Style
Burgess, T.I.; White, D.; Sapsford, S.J. Comparison of Primers for the Detection of Phytophthora (and Other Oomycetes) from Environmental Samples. J. Fungi 2022, 8, 980. https://doi.org/10.3390/jof8090980
AMA Style
Burgess TI, White D, Sapsford SJ. Comparison of Primers for the Detection of Phytophthora (and Other Oomycetes) from Environmental Samples. Journal of Fungi. 2022; 8(9):980. https://doi.org/10.3390/jof8090980
Chicago/Turabian StyleBurgess, Treena I., Diane White, and Sarah J. Sapsford. 2022. "Comparison of Primers for the Detection of Phytophthora (and Other Oomycetes) from Environmental Samples" Journal of Fungi 8, no. 9: 980. https://doi.org/10.3390/jof8090980
Note that from the first issue of 2016, this journal uses article numbers instead of page numbers. See further details here.