Trajectories of Graphitizable Anthracene Coke and Non-Graphitizable Sucrose Char during the Earliest Stages of Annealing by Rapid CO2 Laser Heating


Abstract
:
1. Introduction
2. Materials and Methods
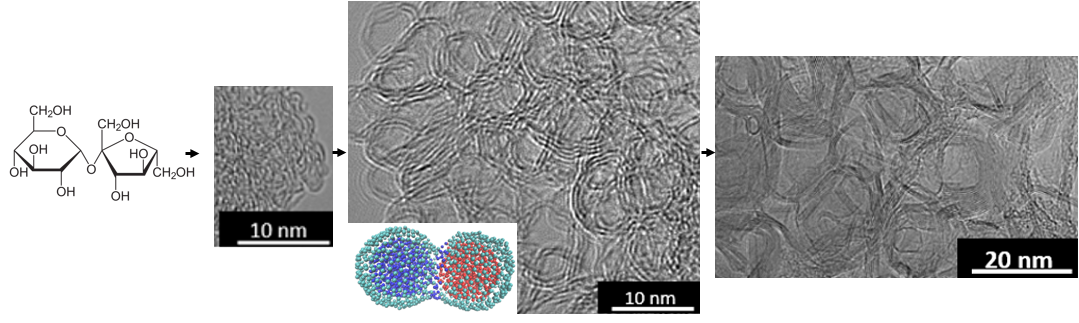
2.1. Material Selection
2.2. Carbonization
2.3. Heat-Treatment
2.3.1. Furnace
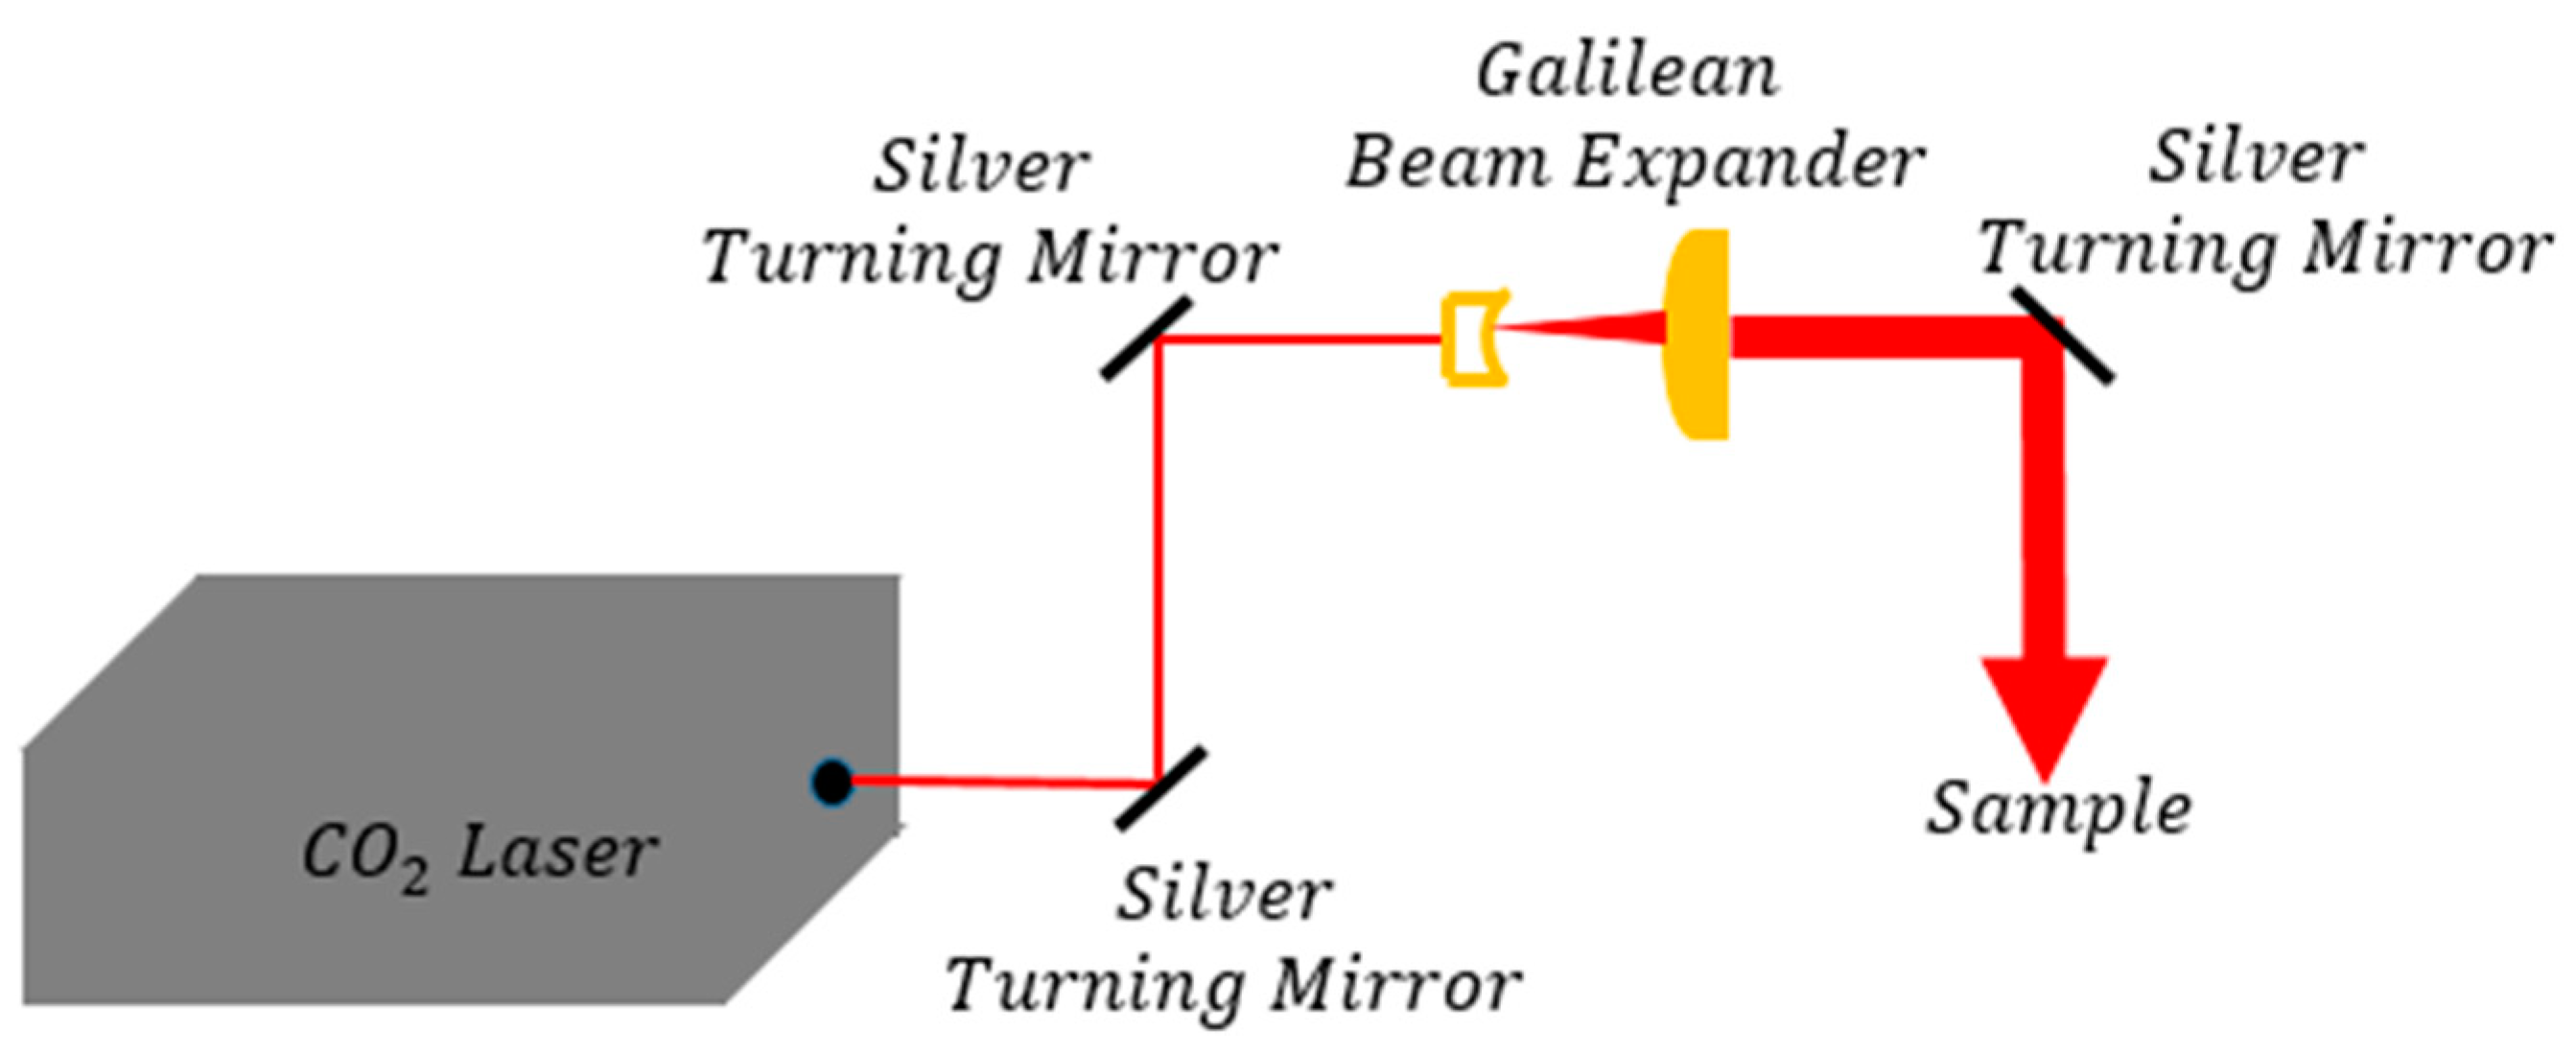
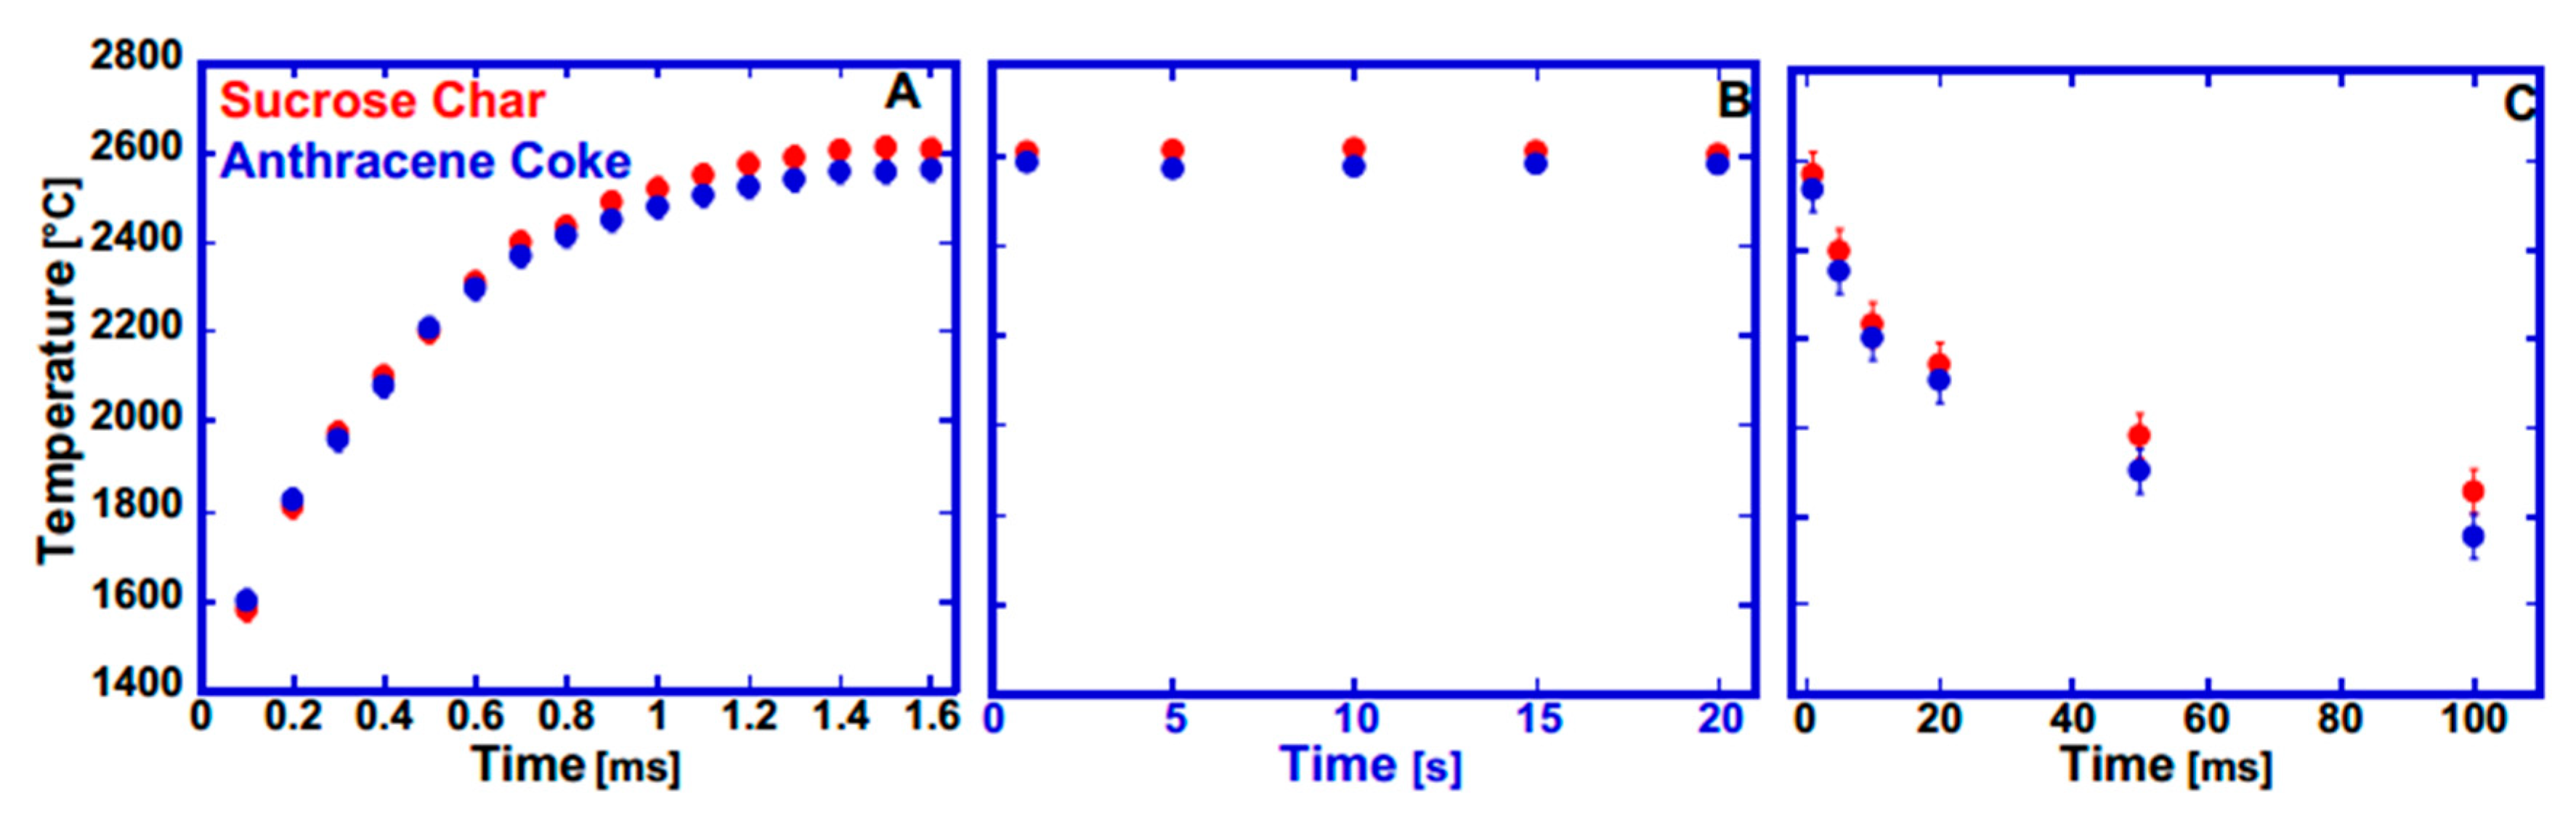
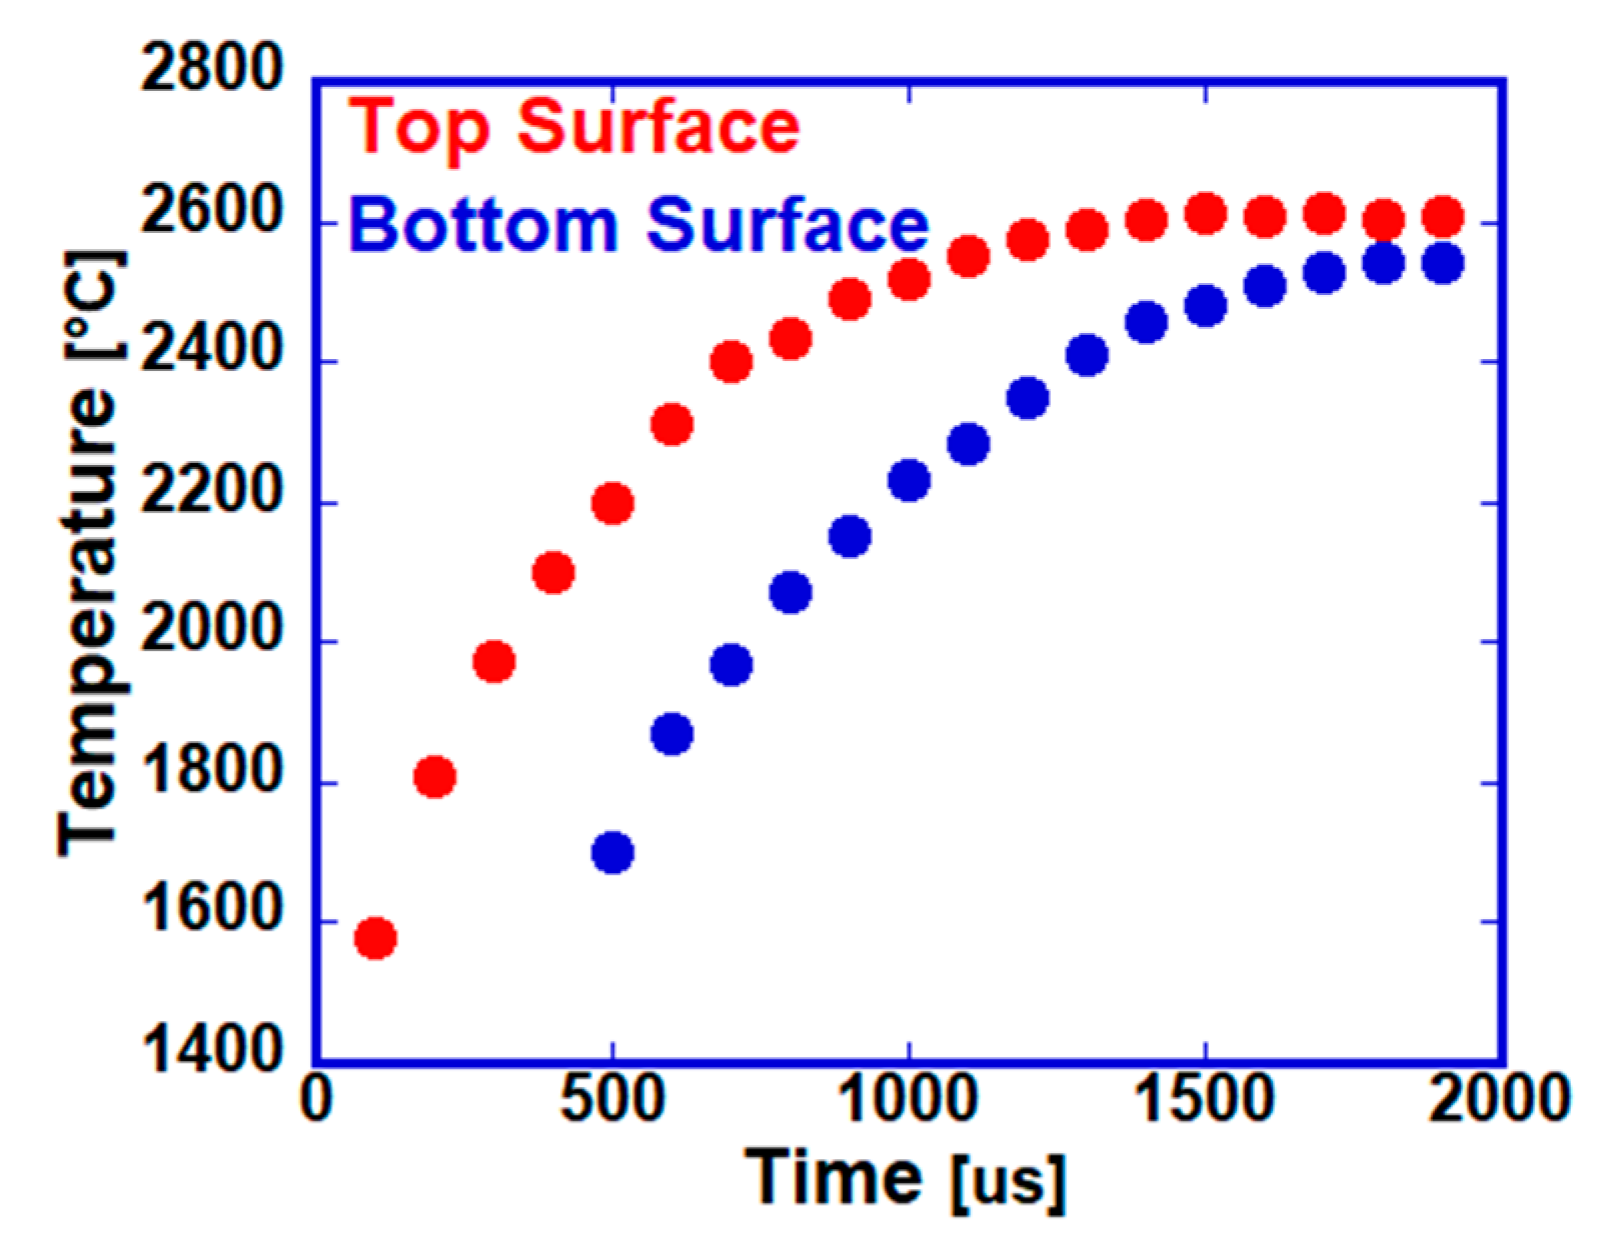
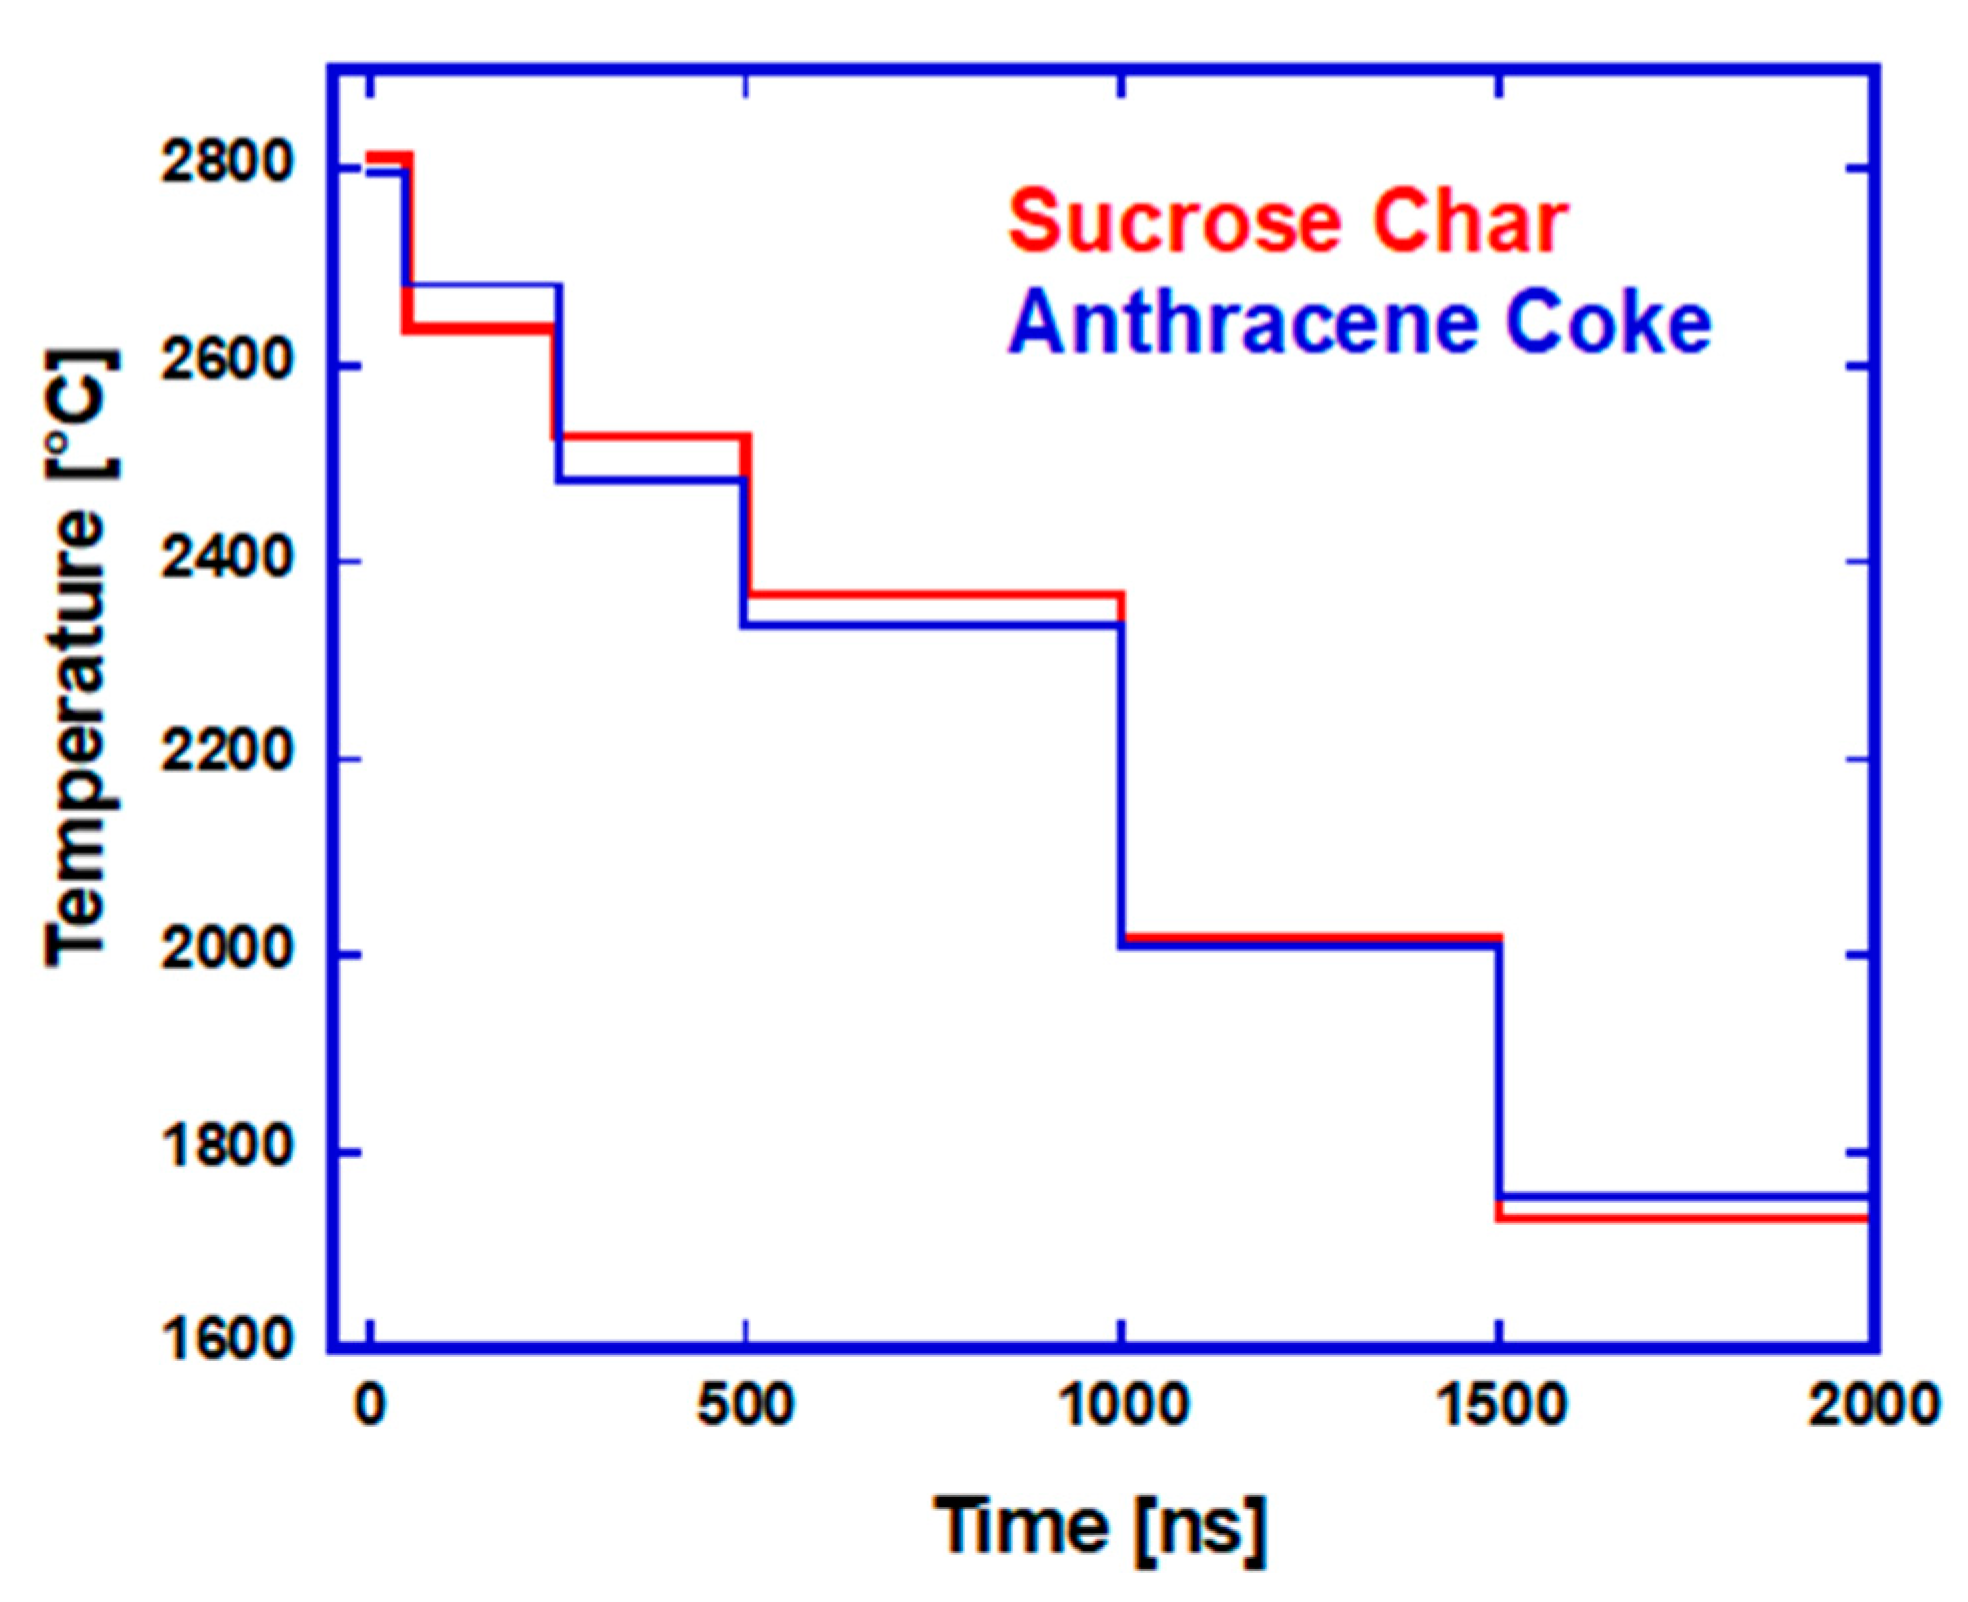
2.3.2. CO2 Laser
2.4. Characterization
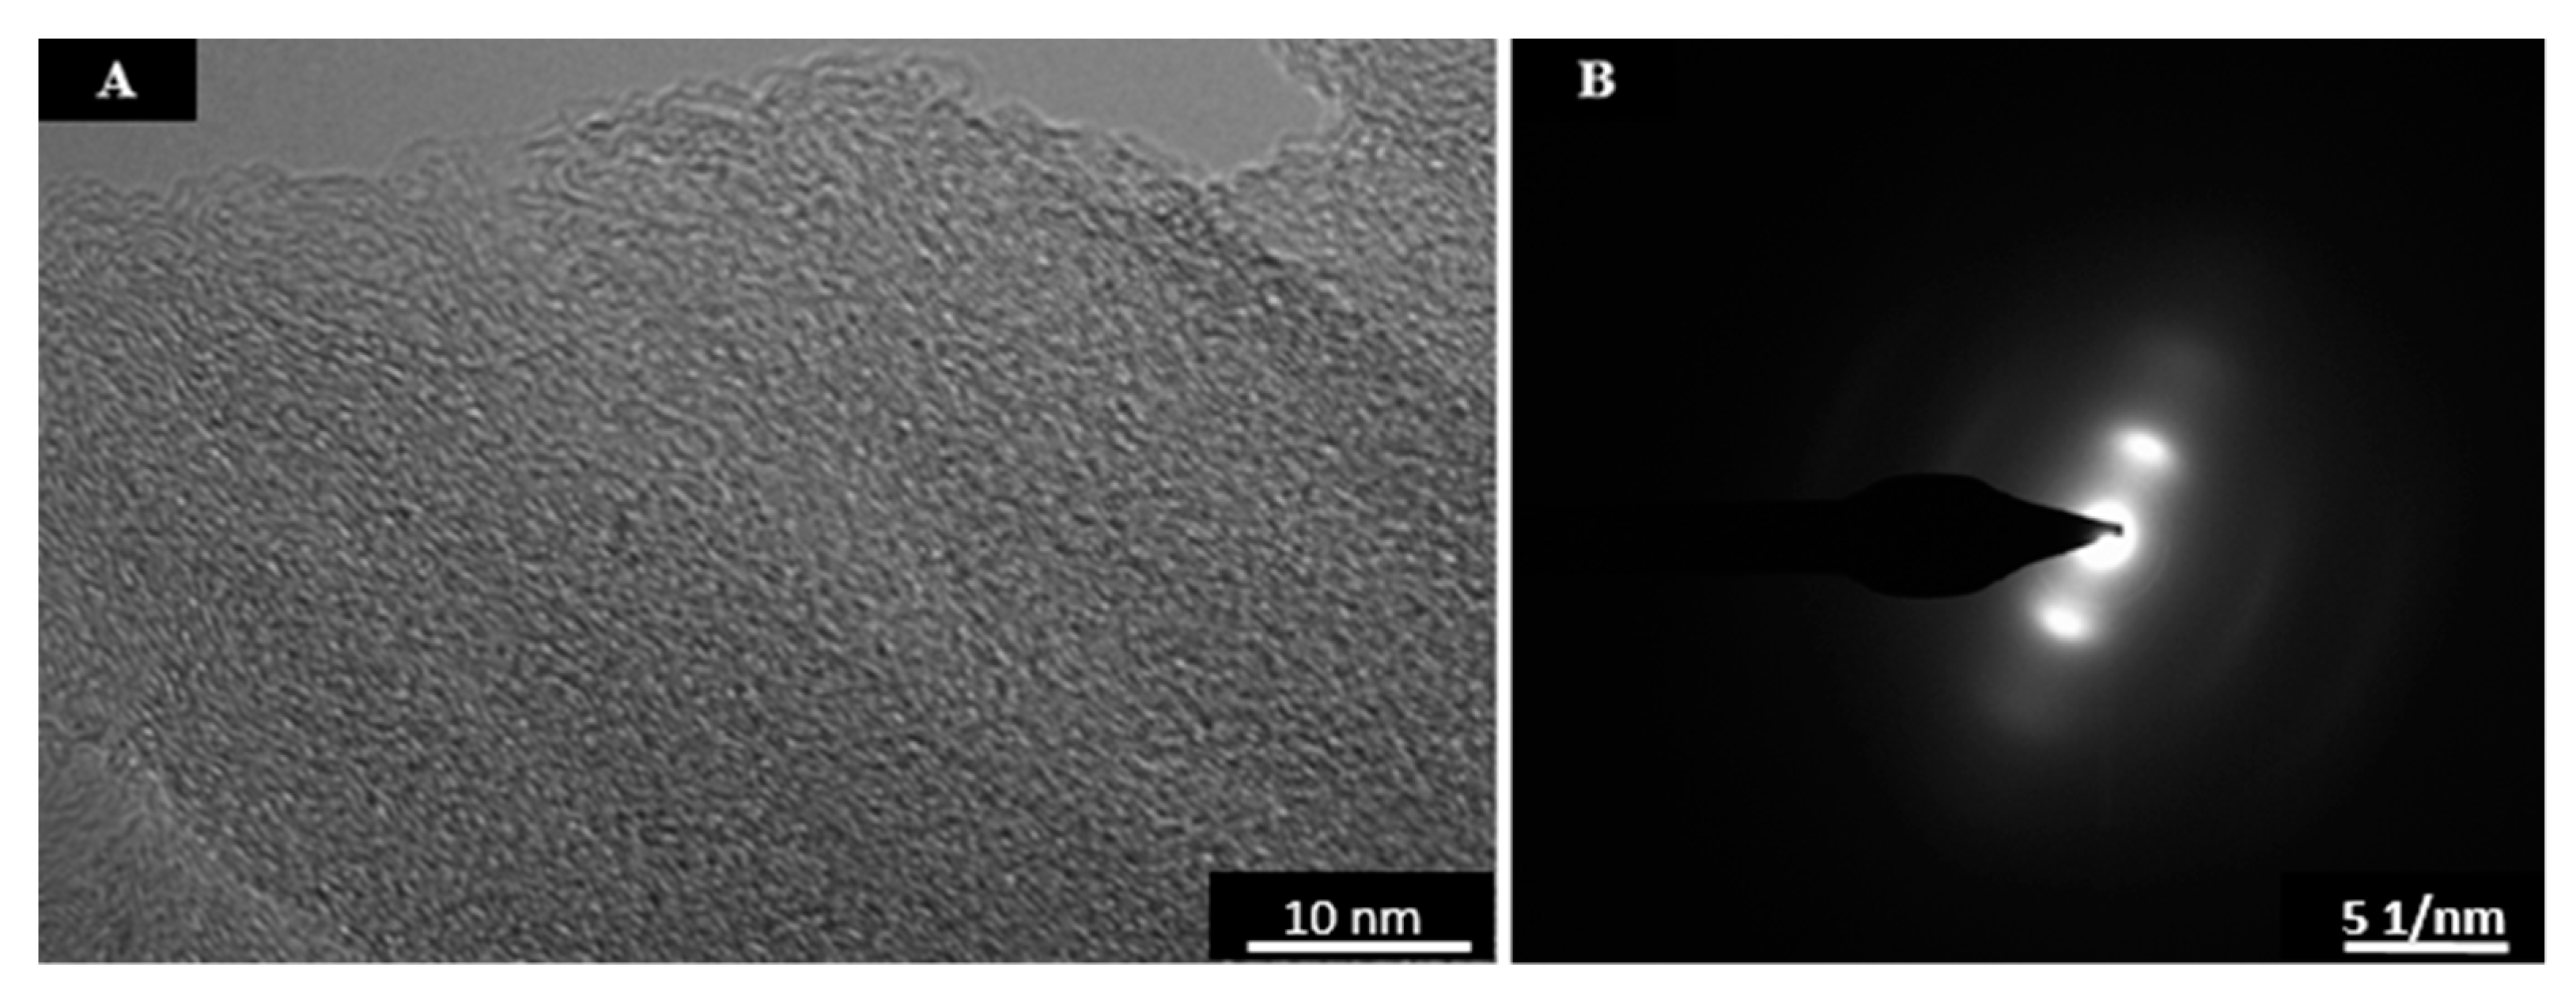
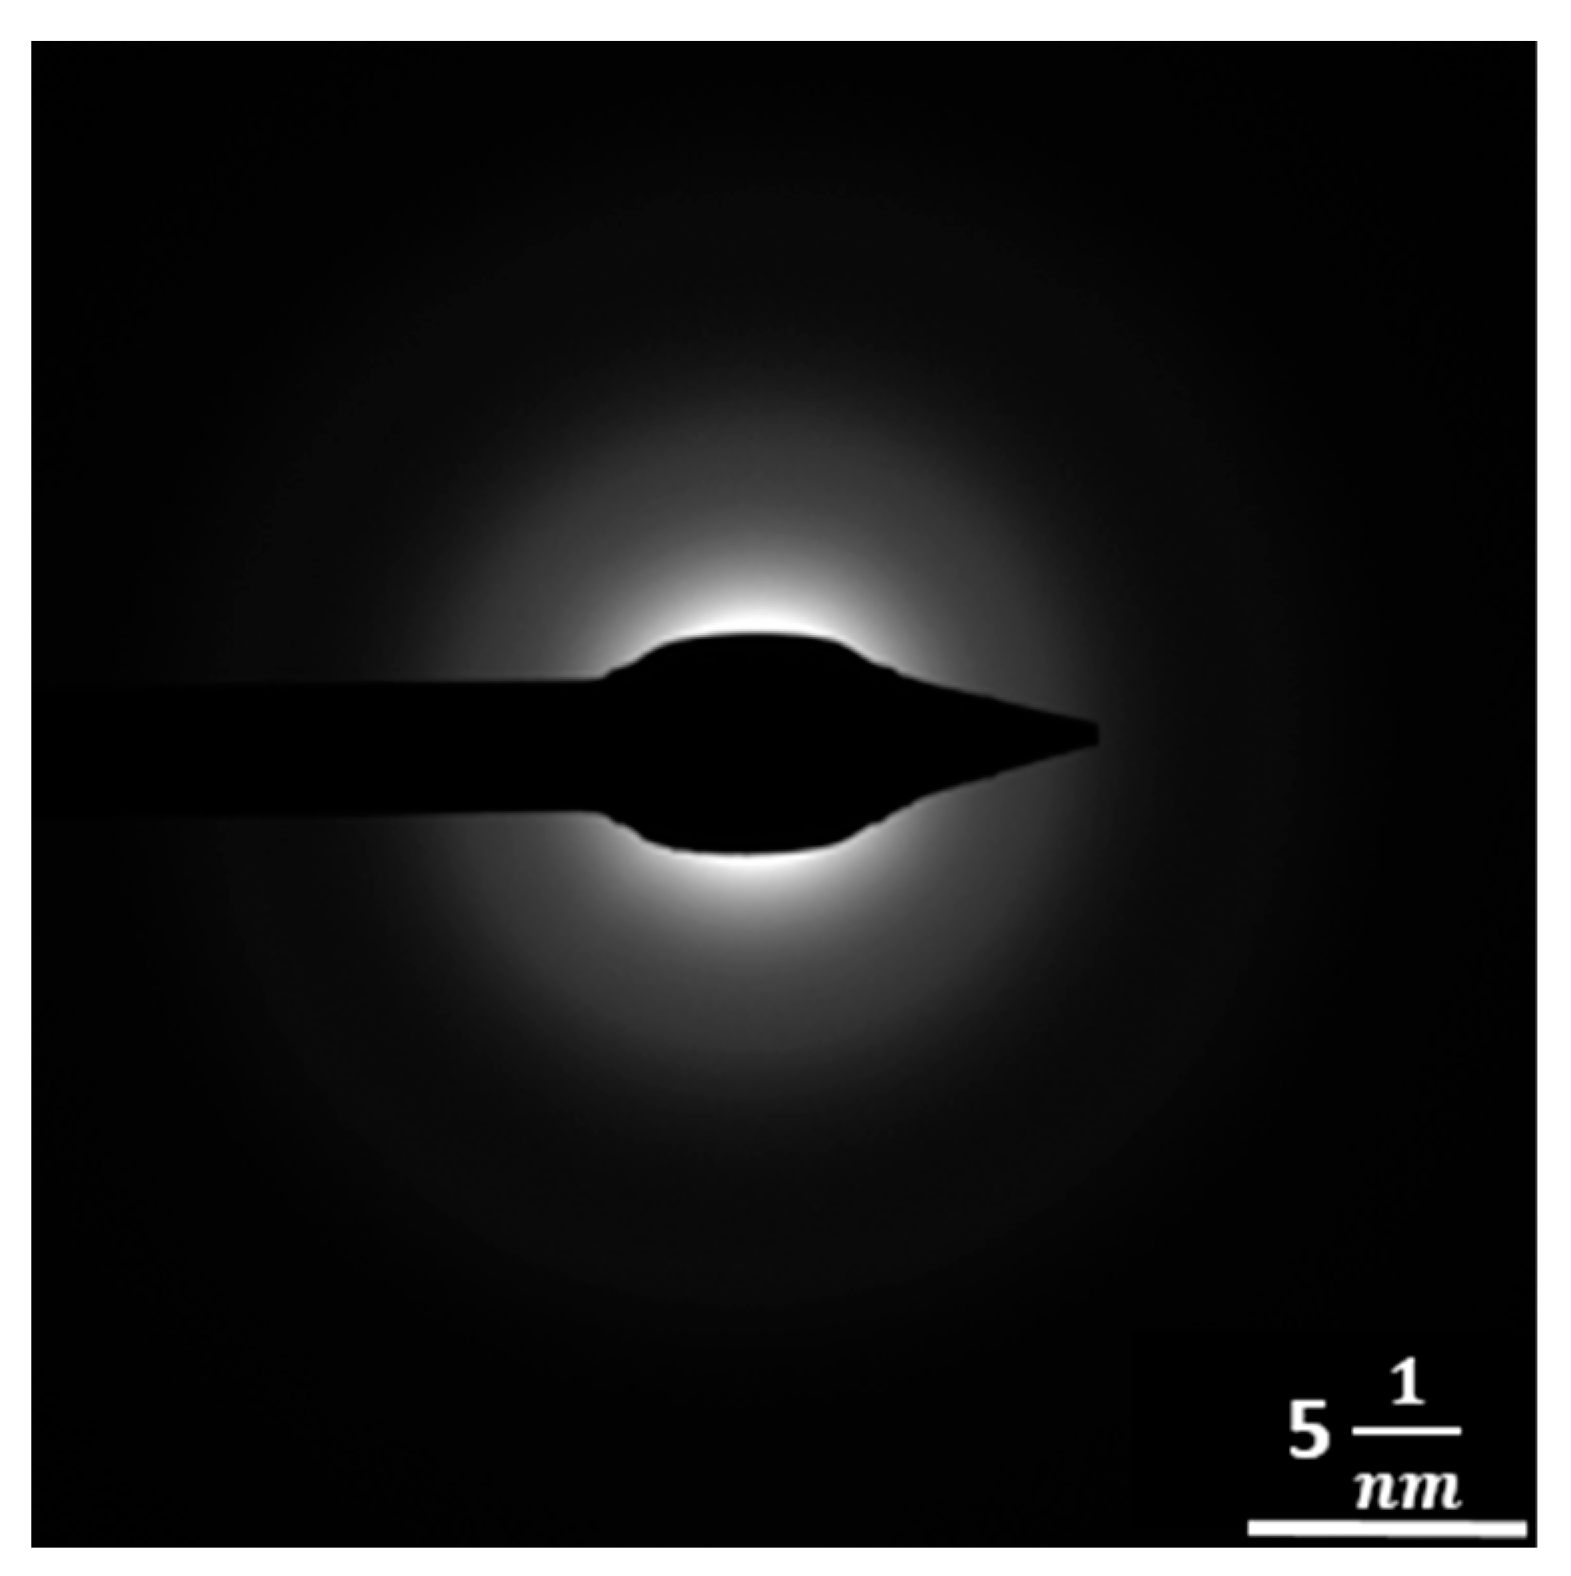
2.4.1. Diffraction
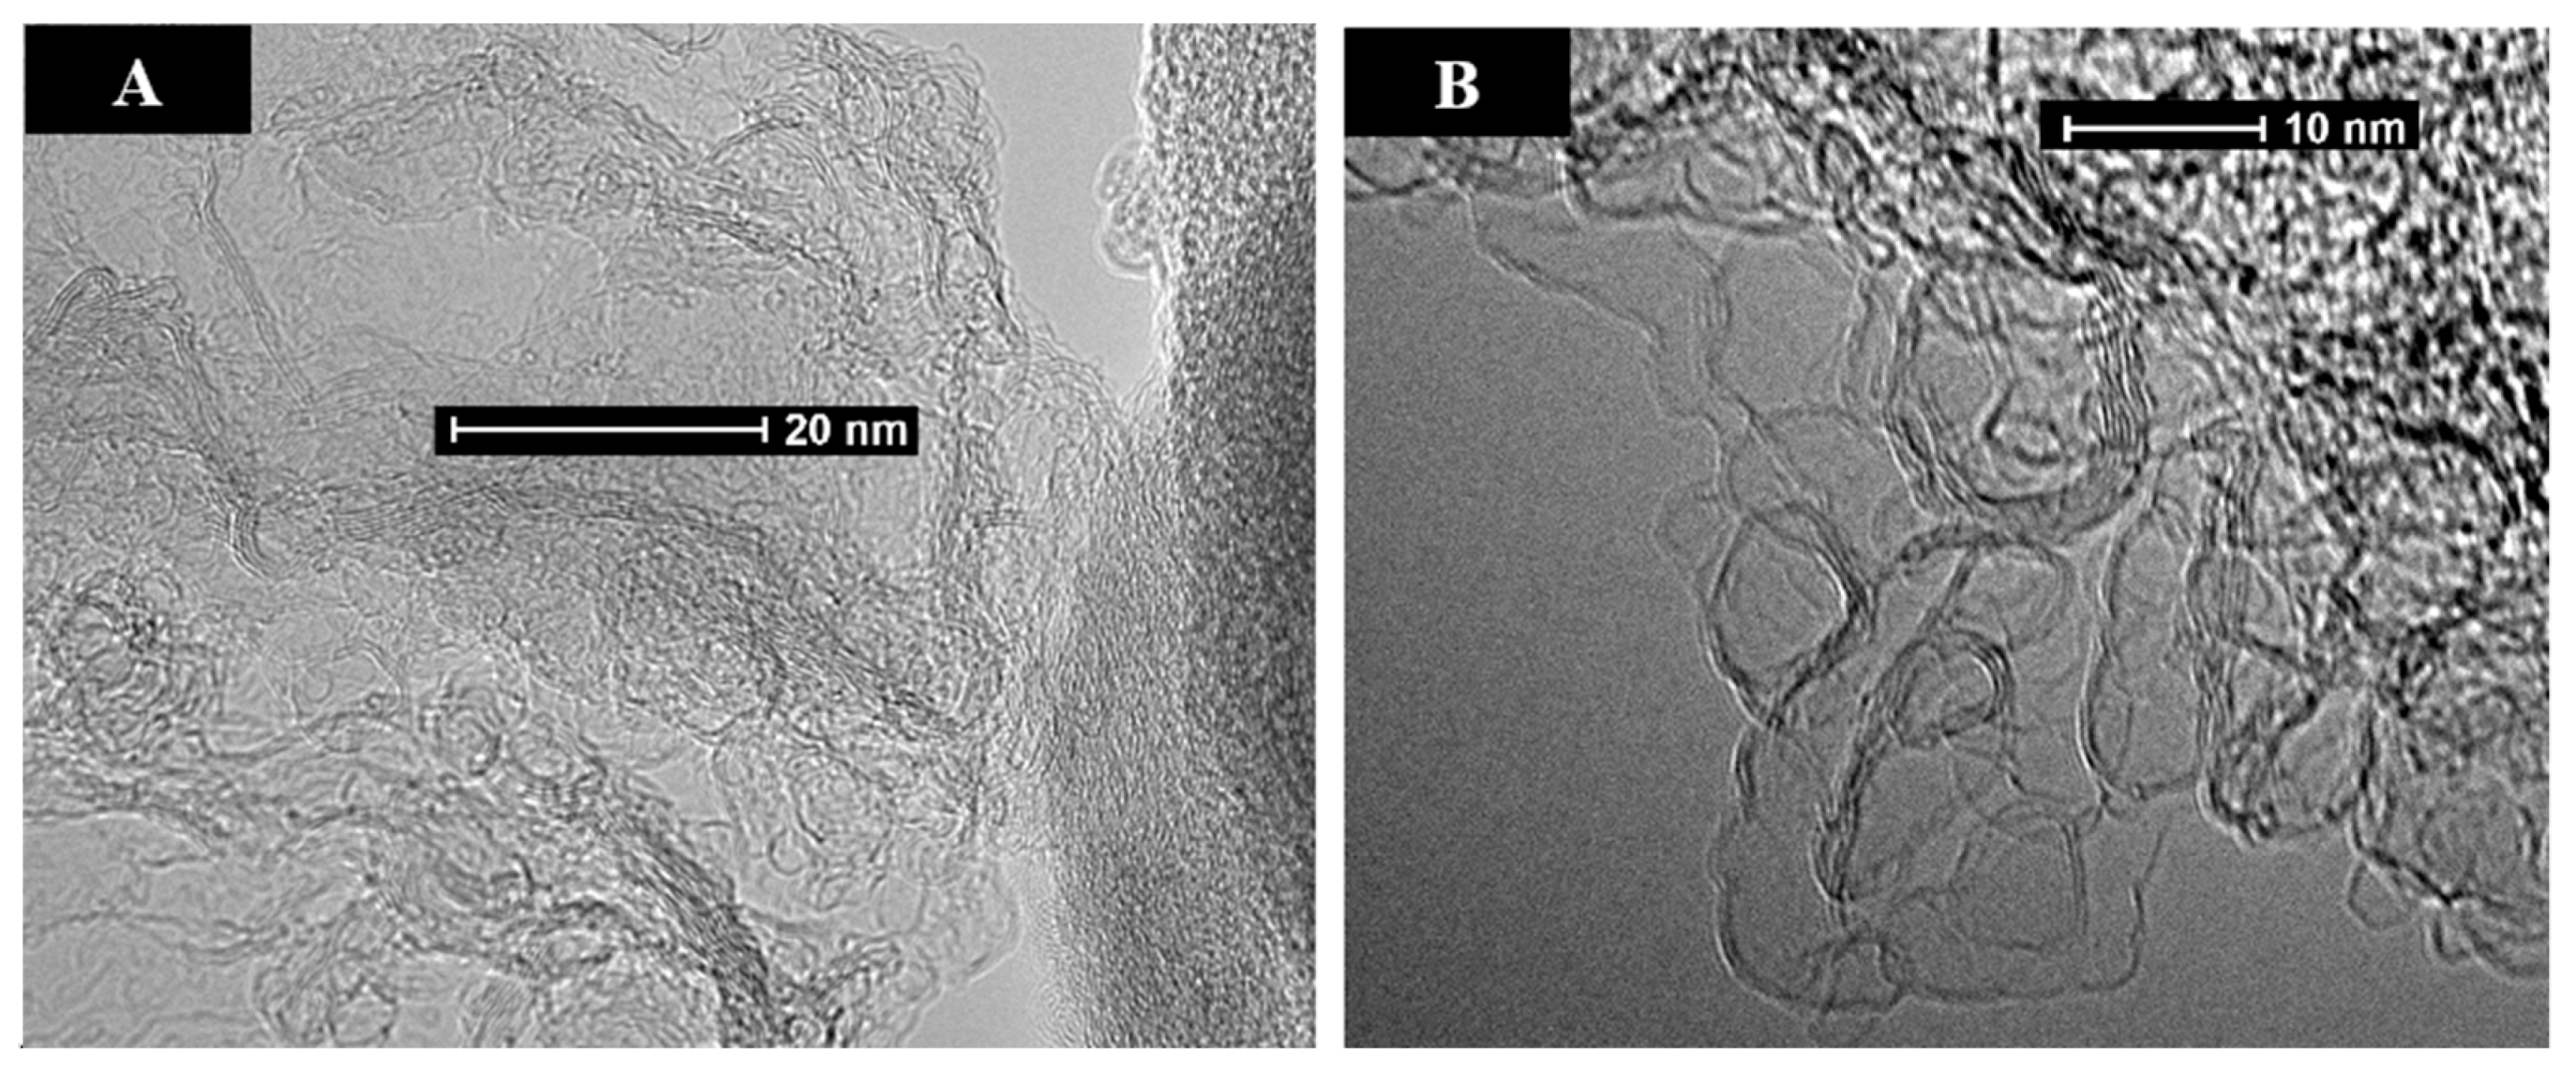
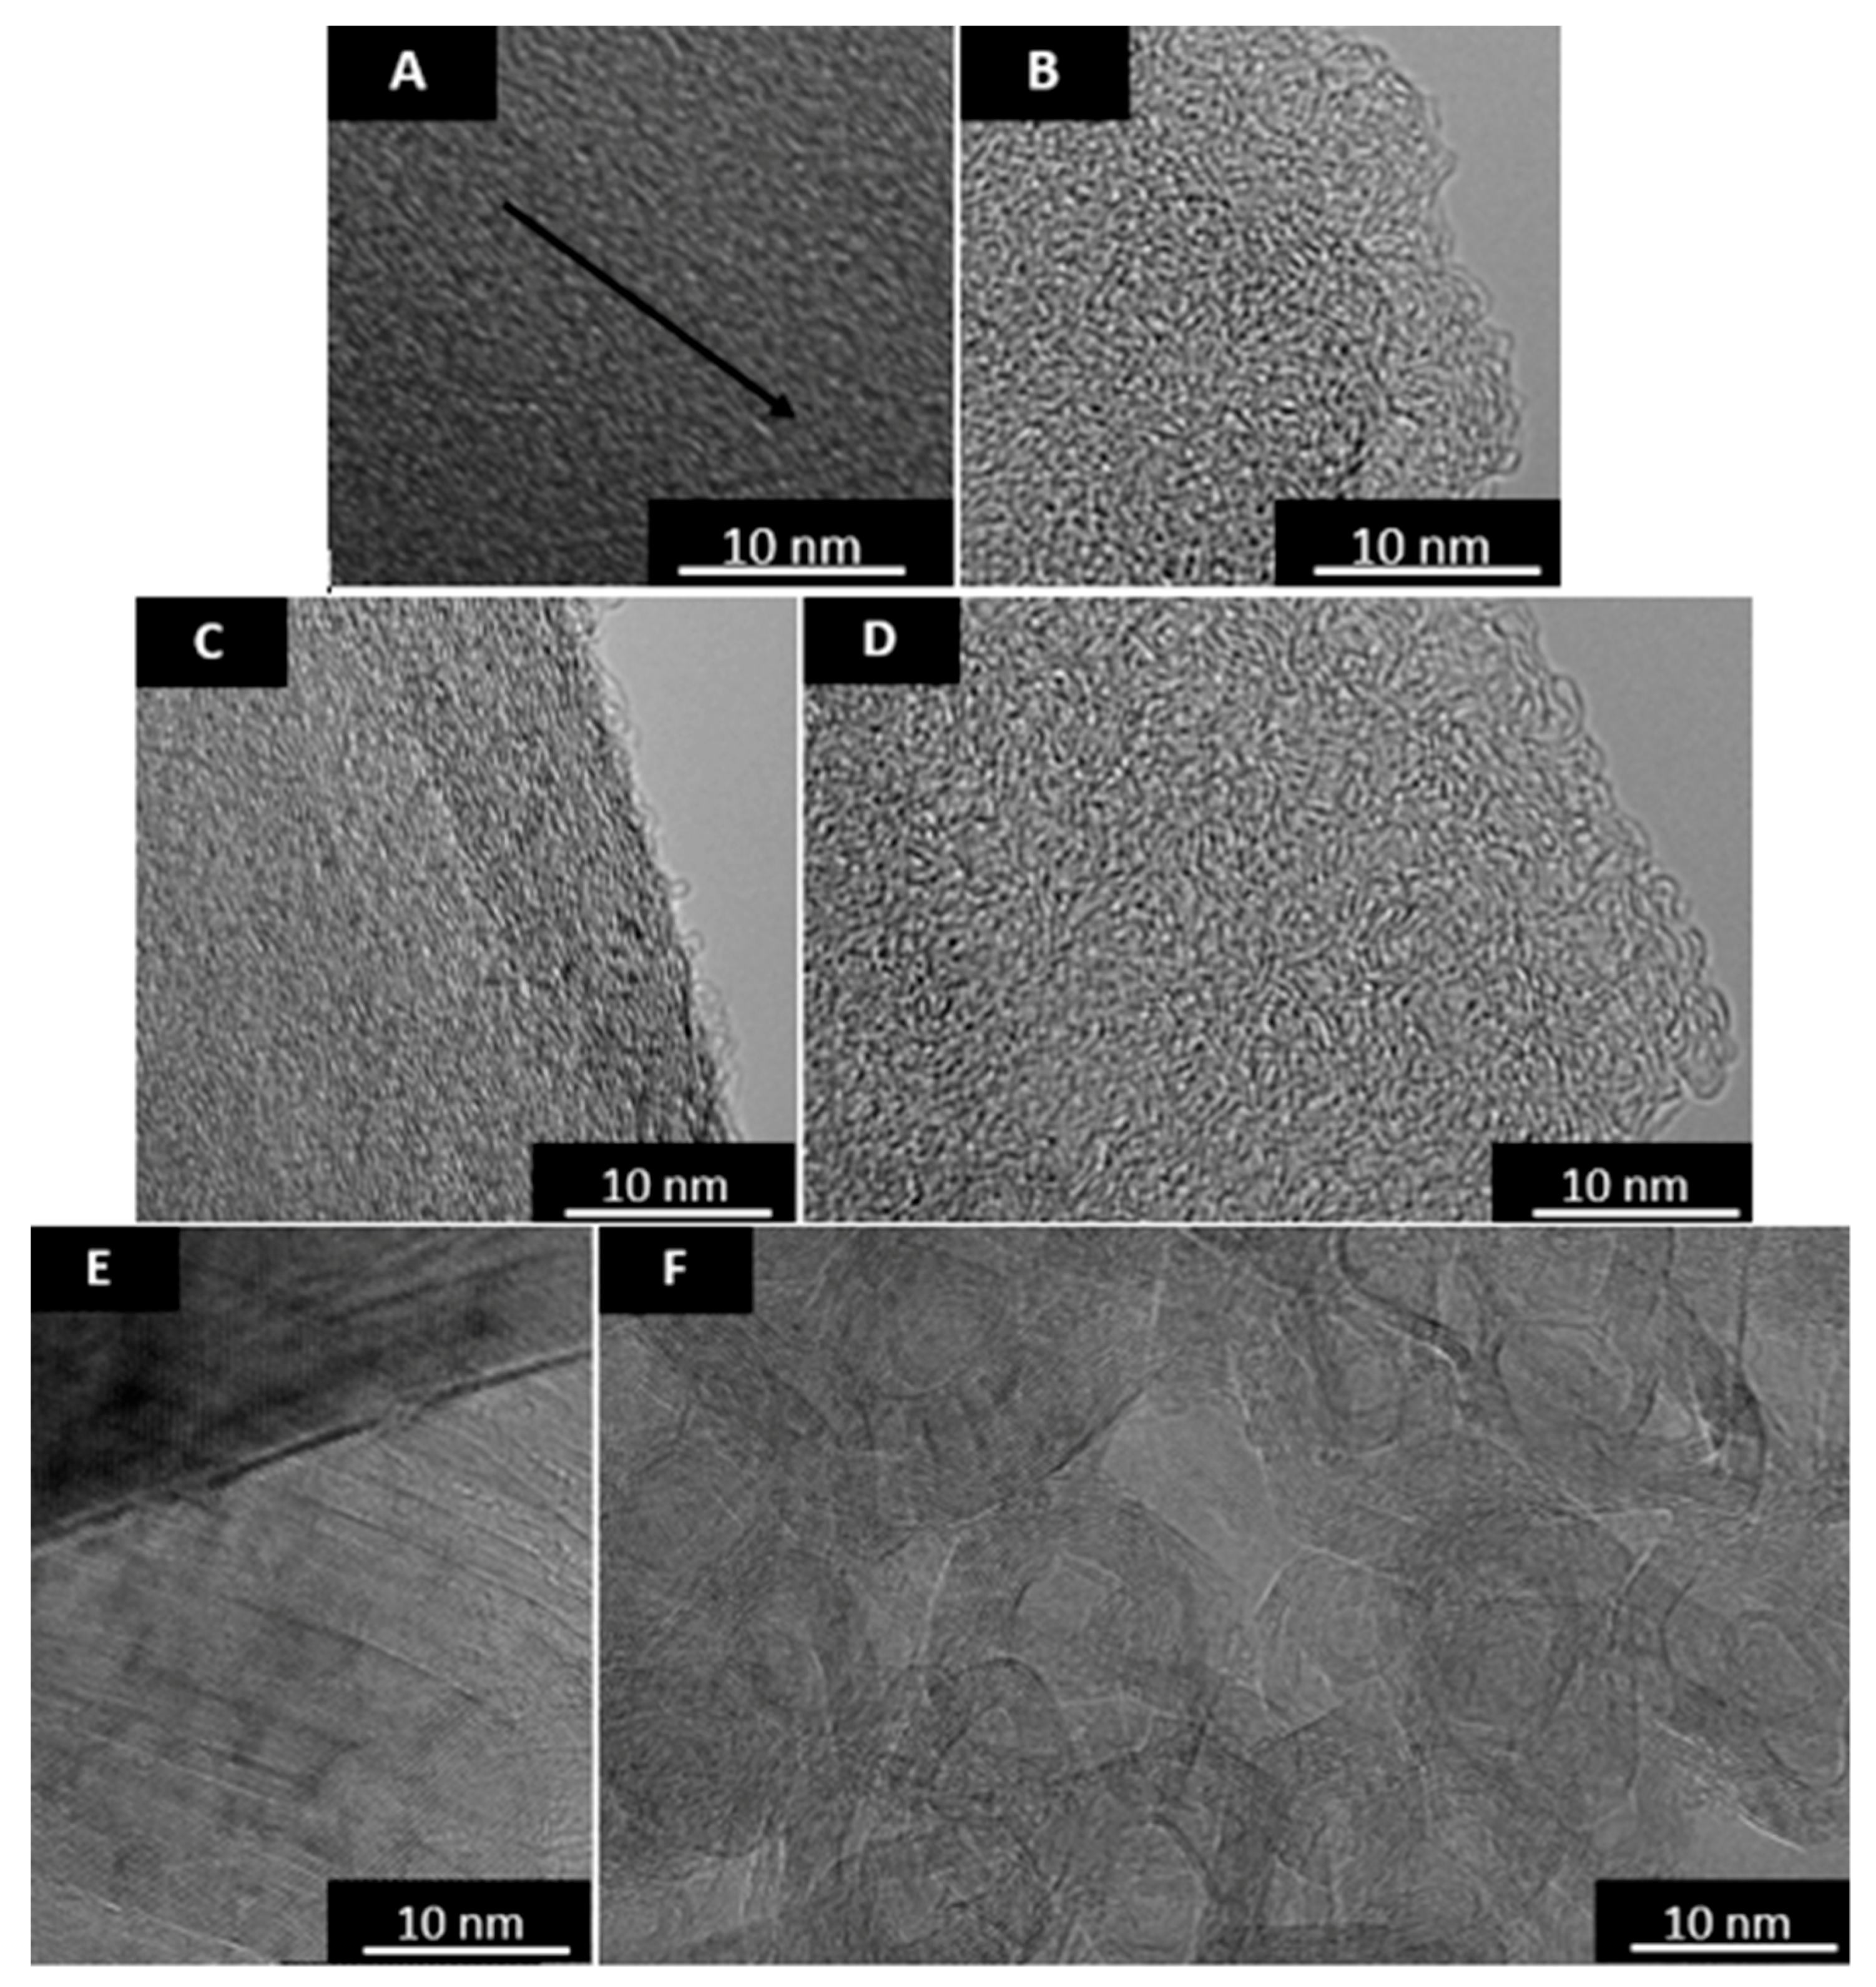
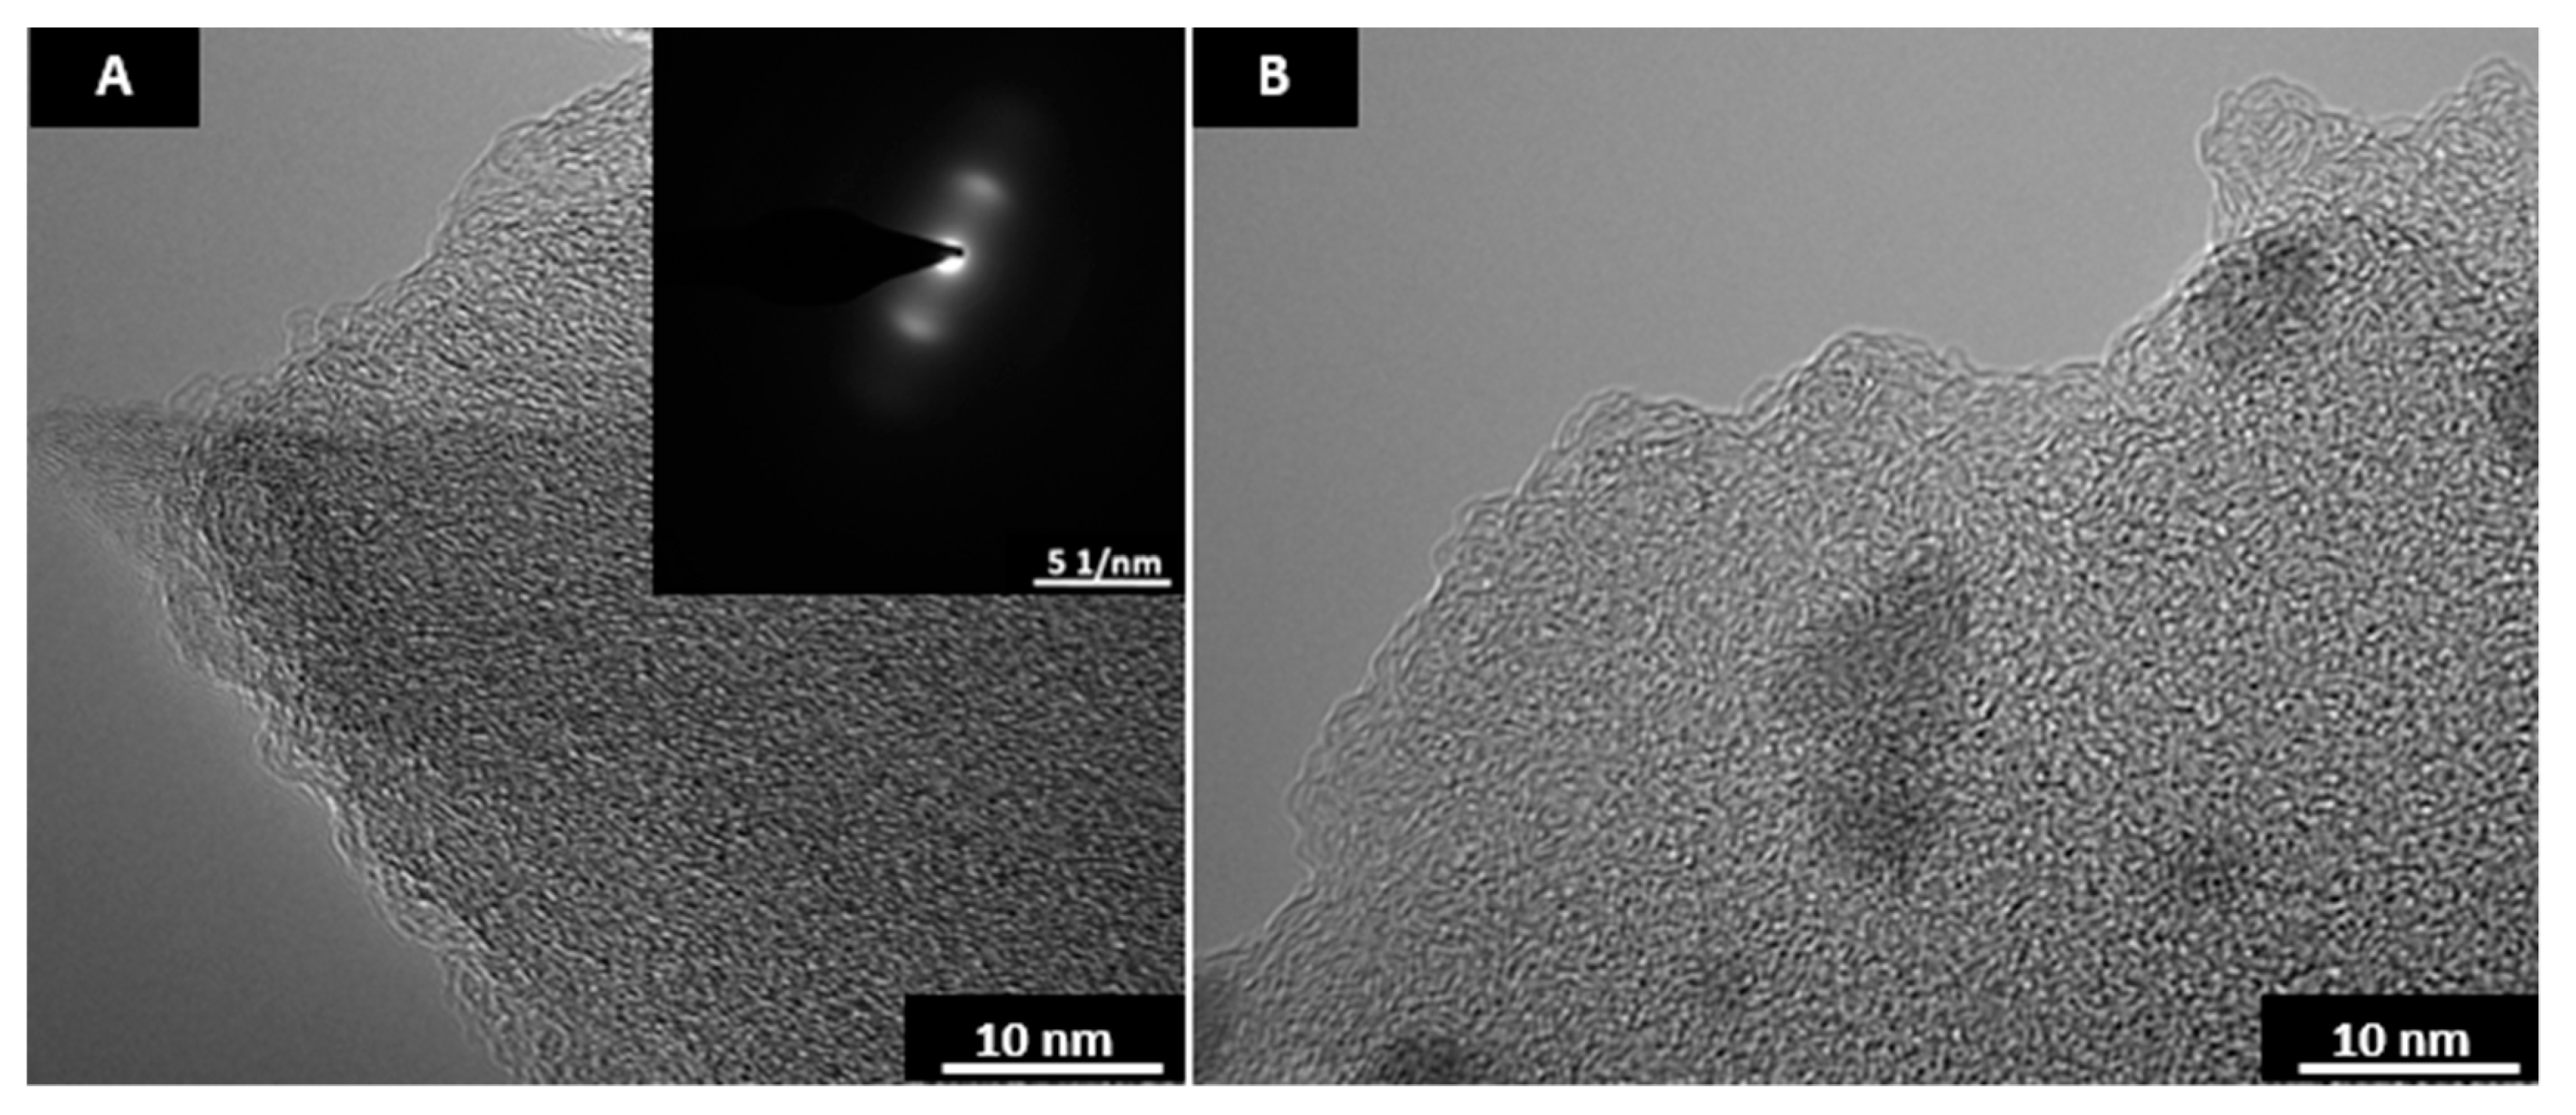
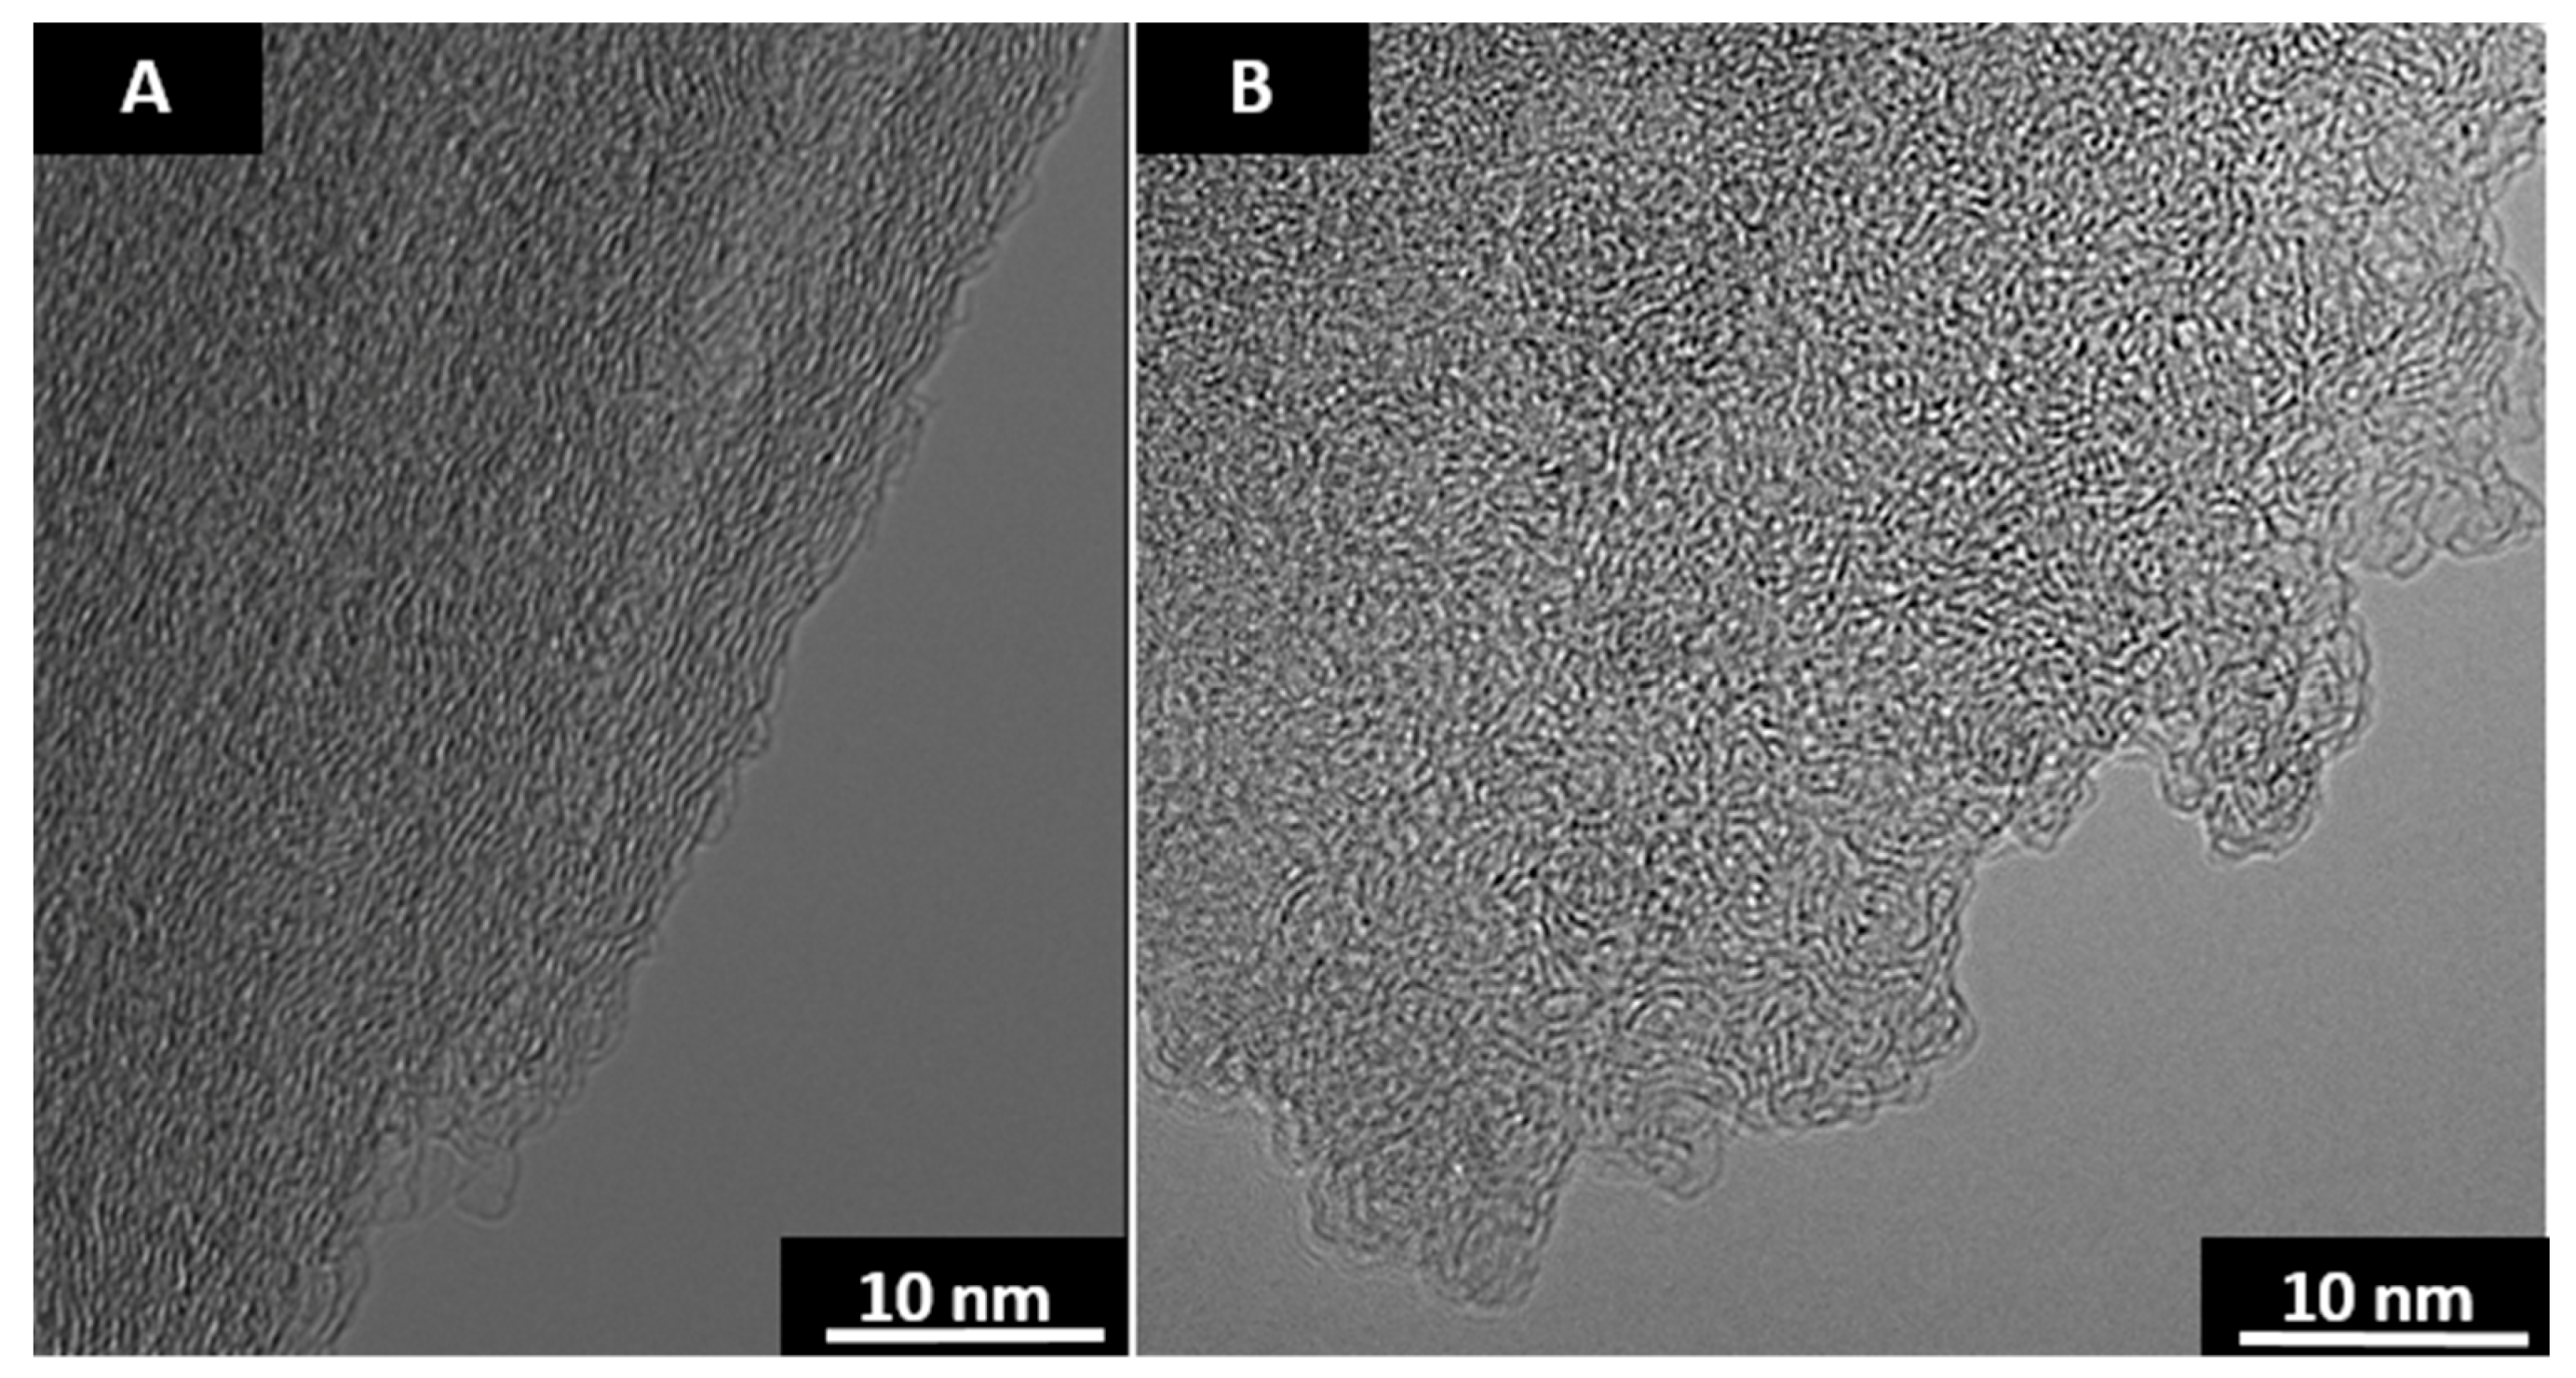
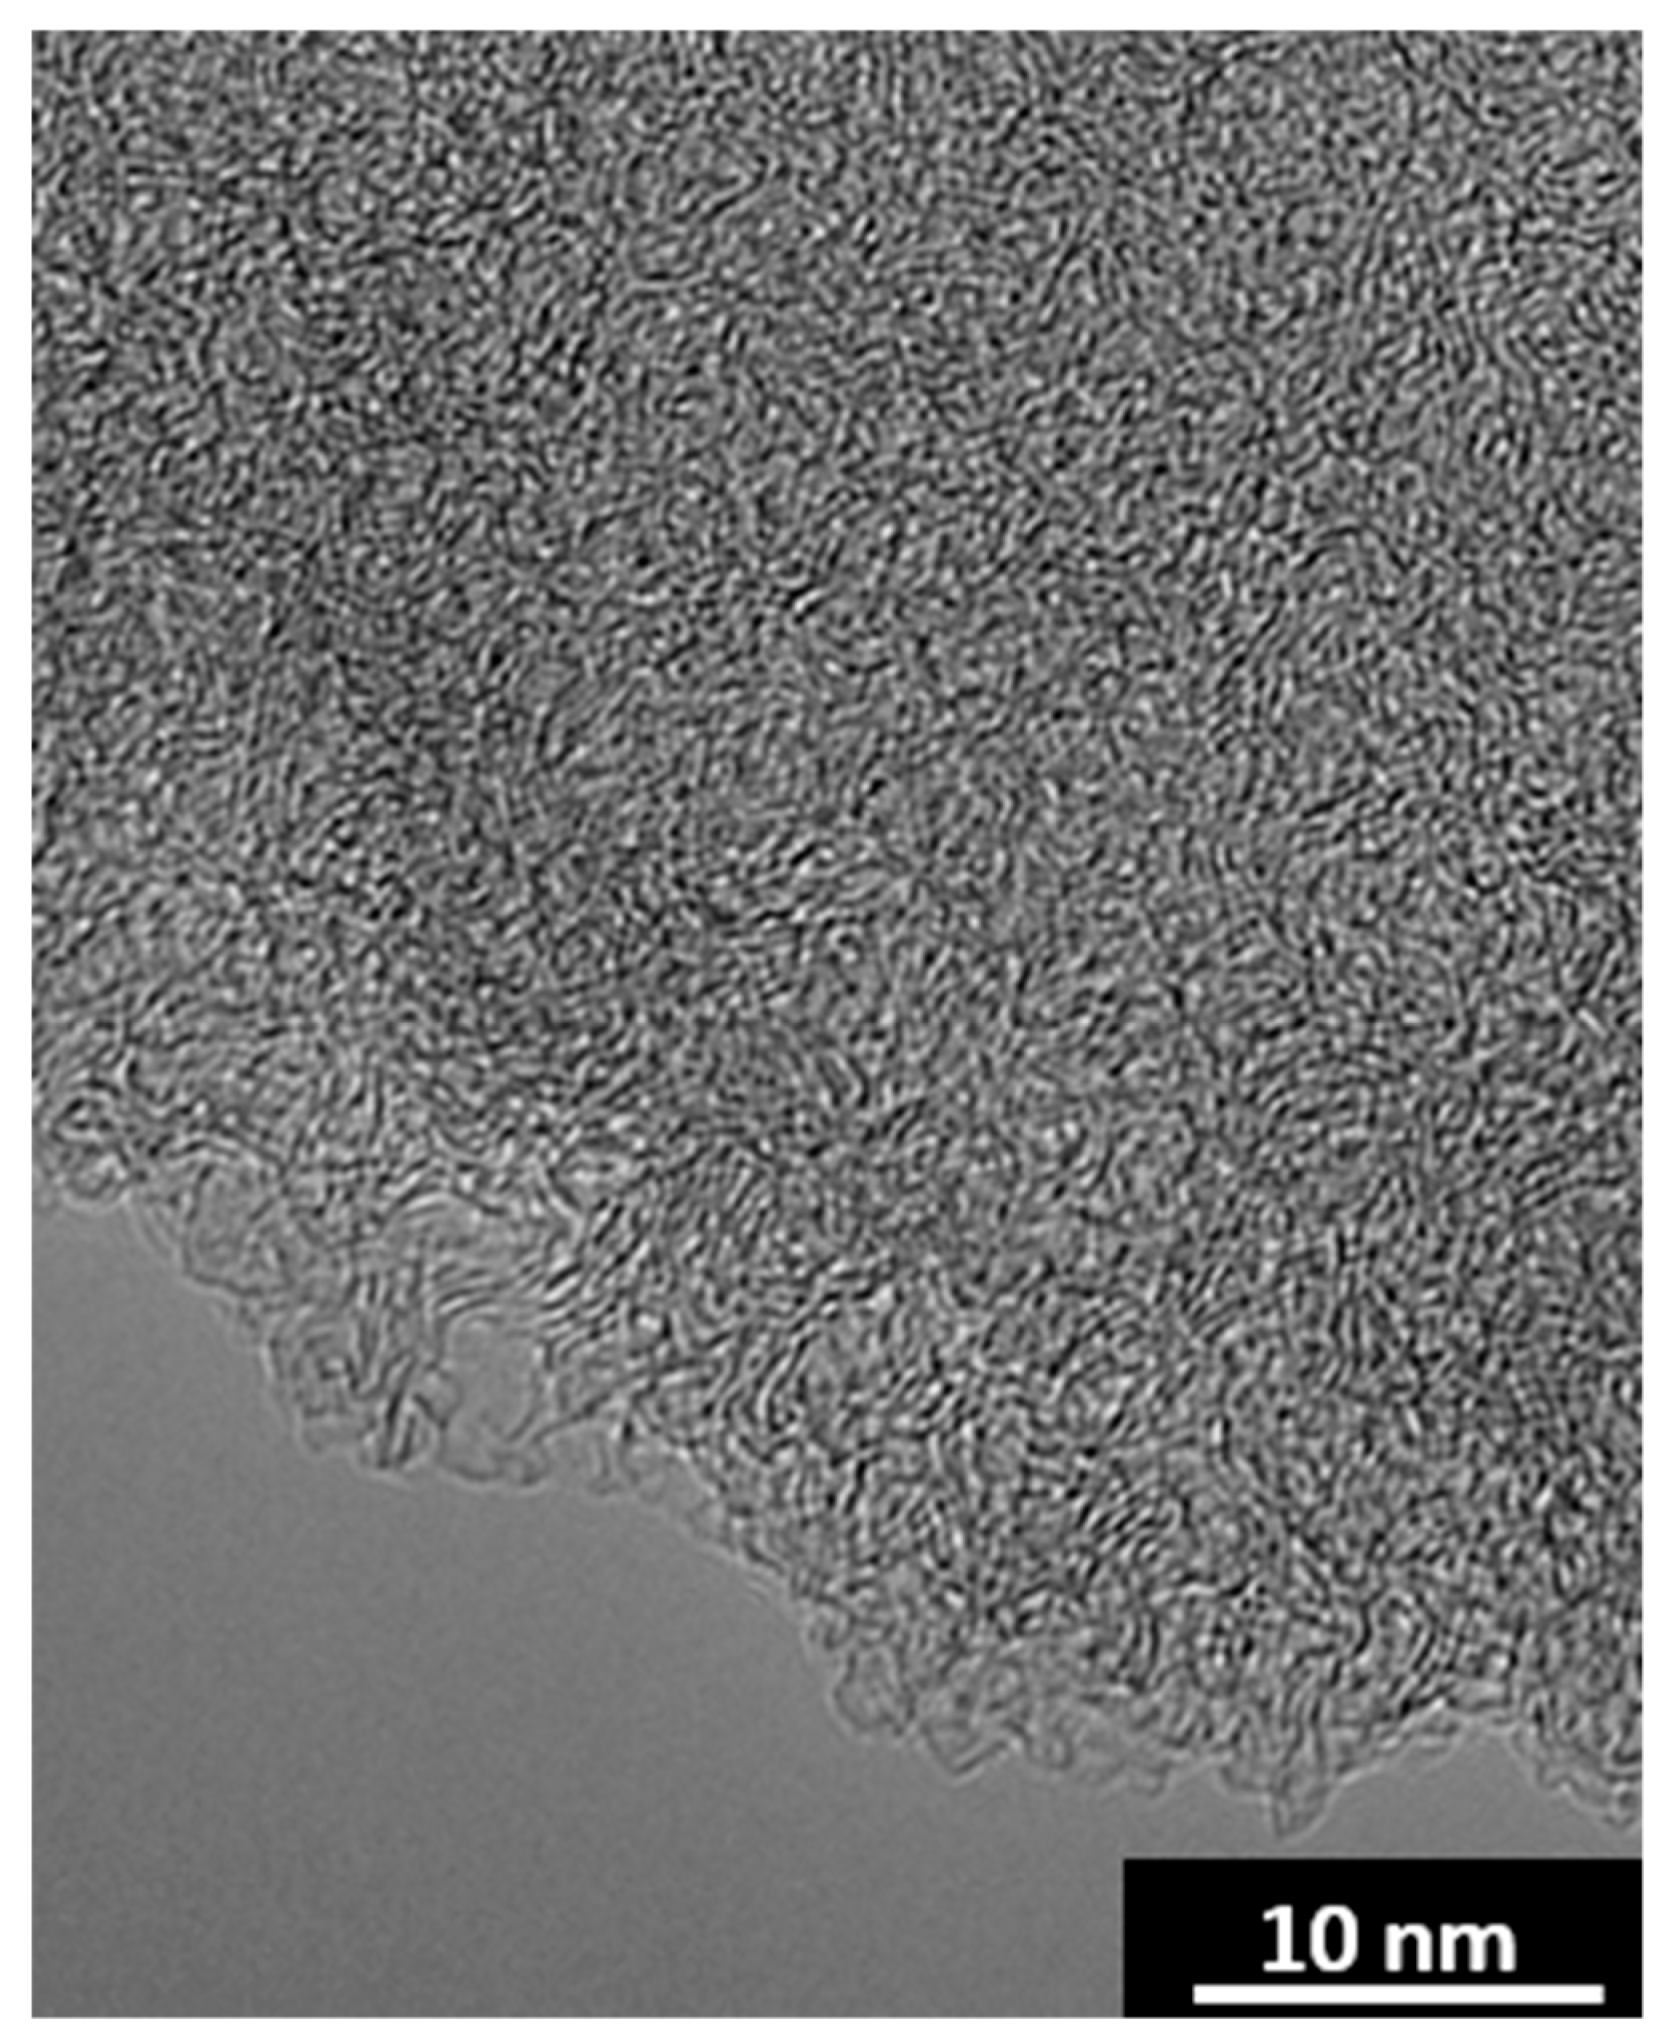
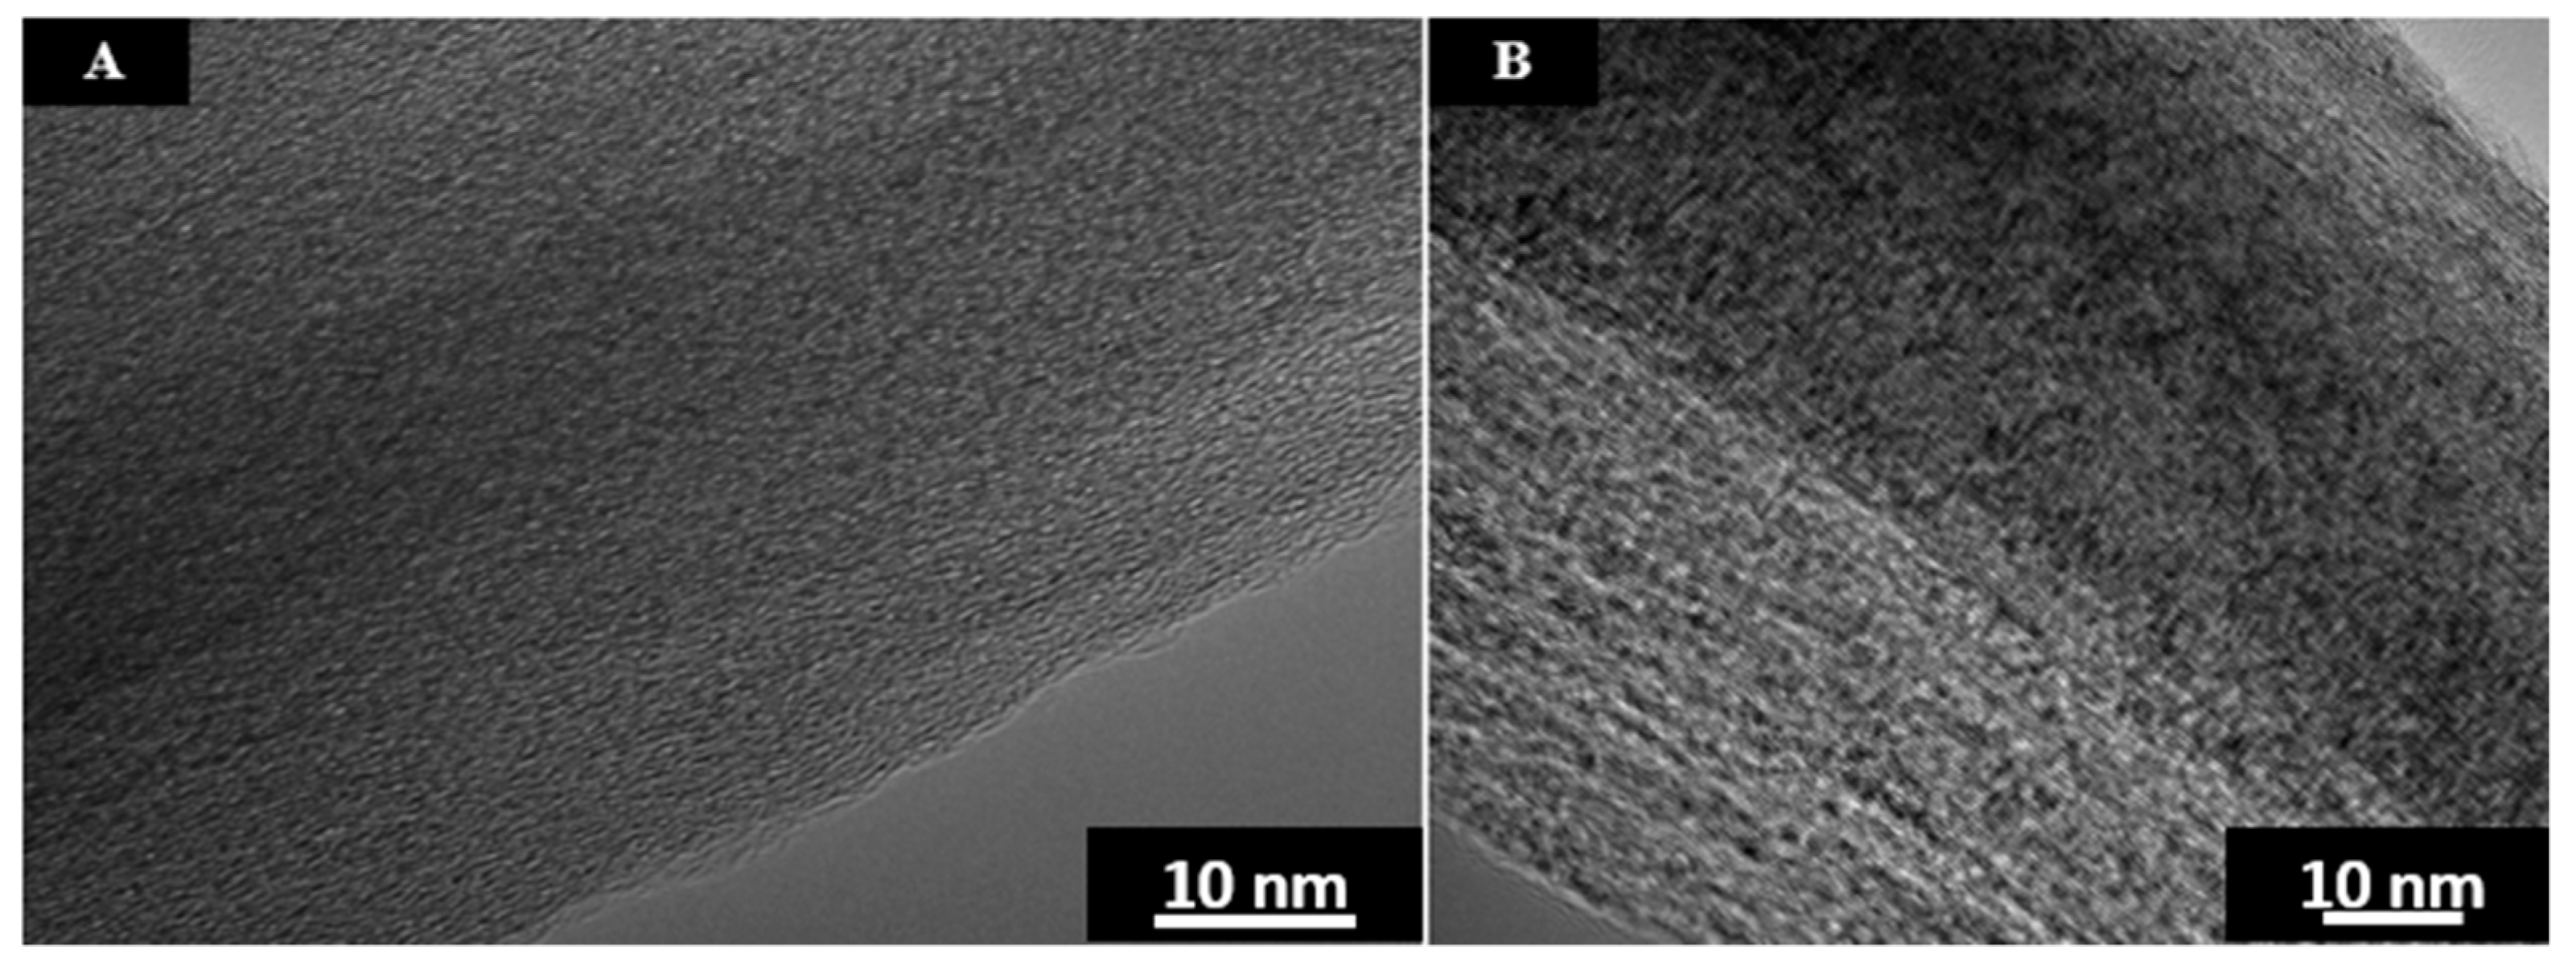
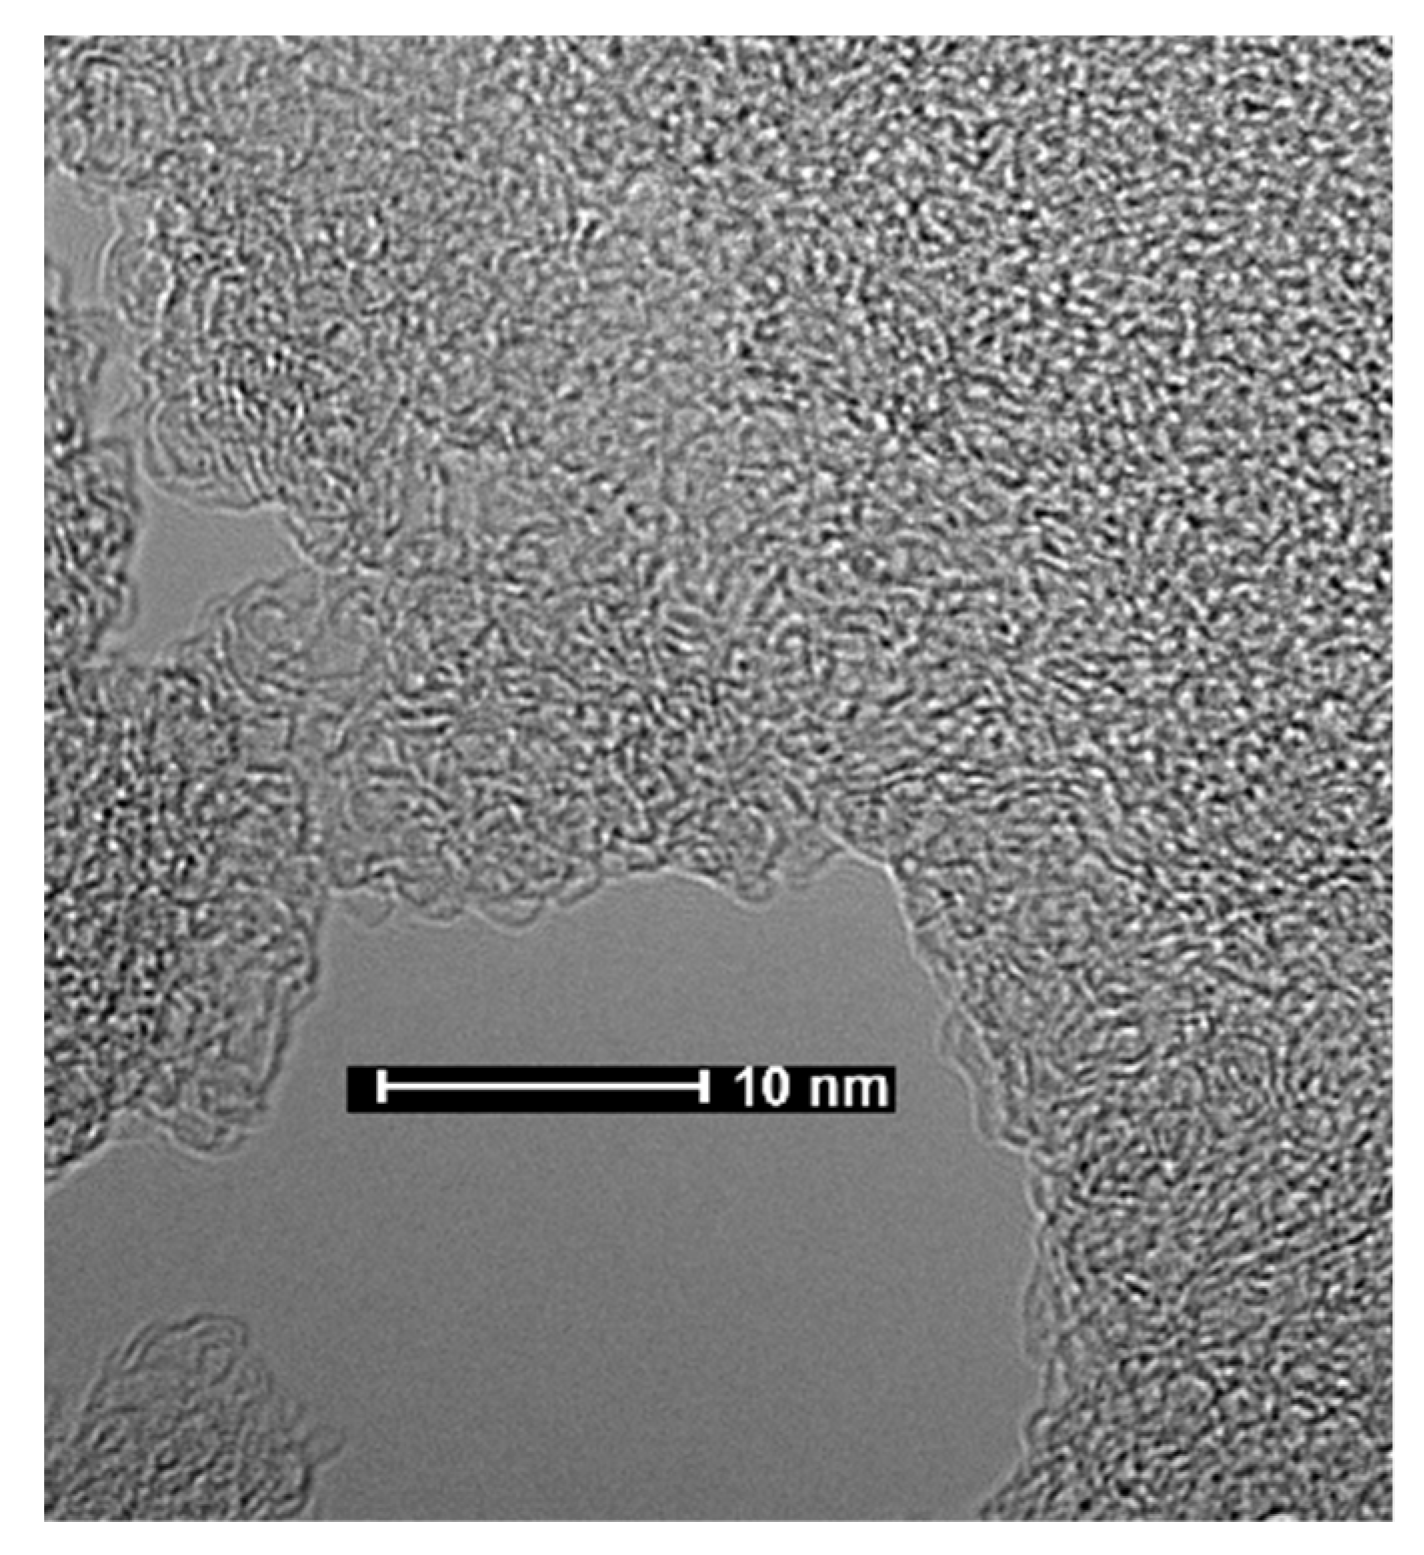
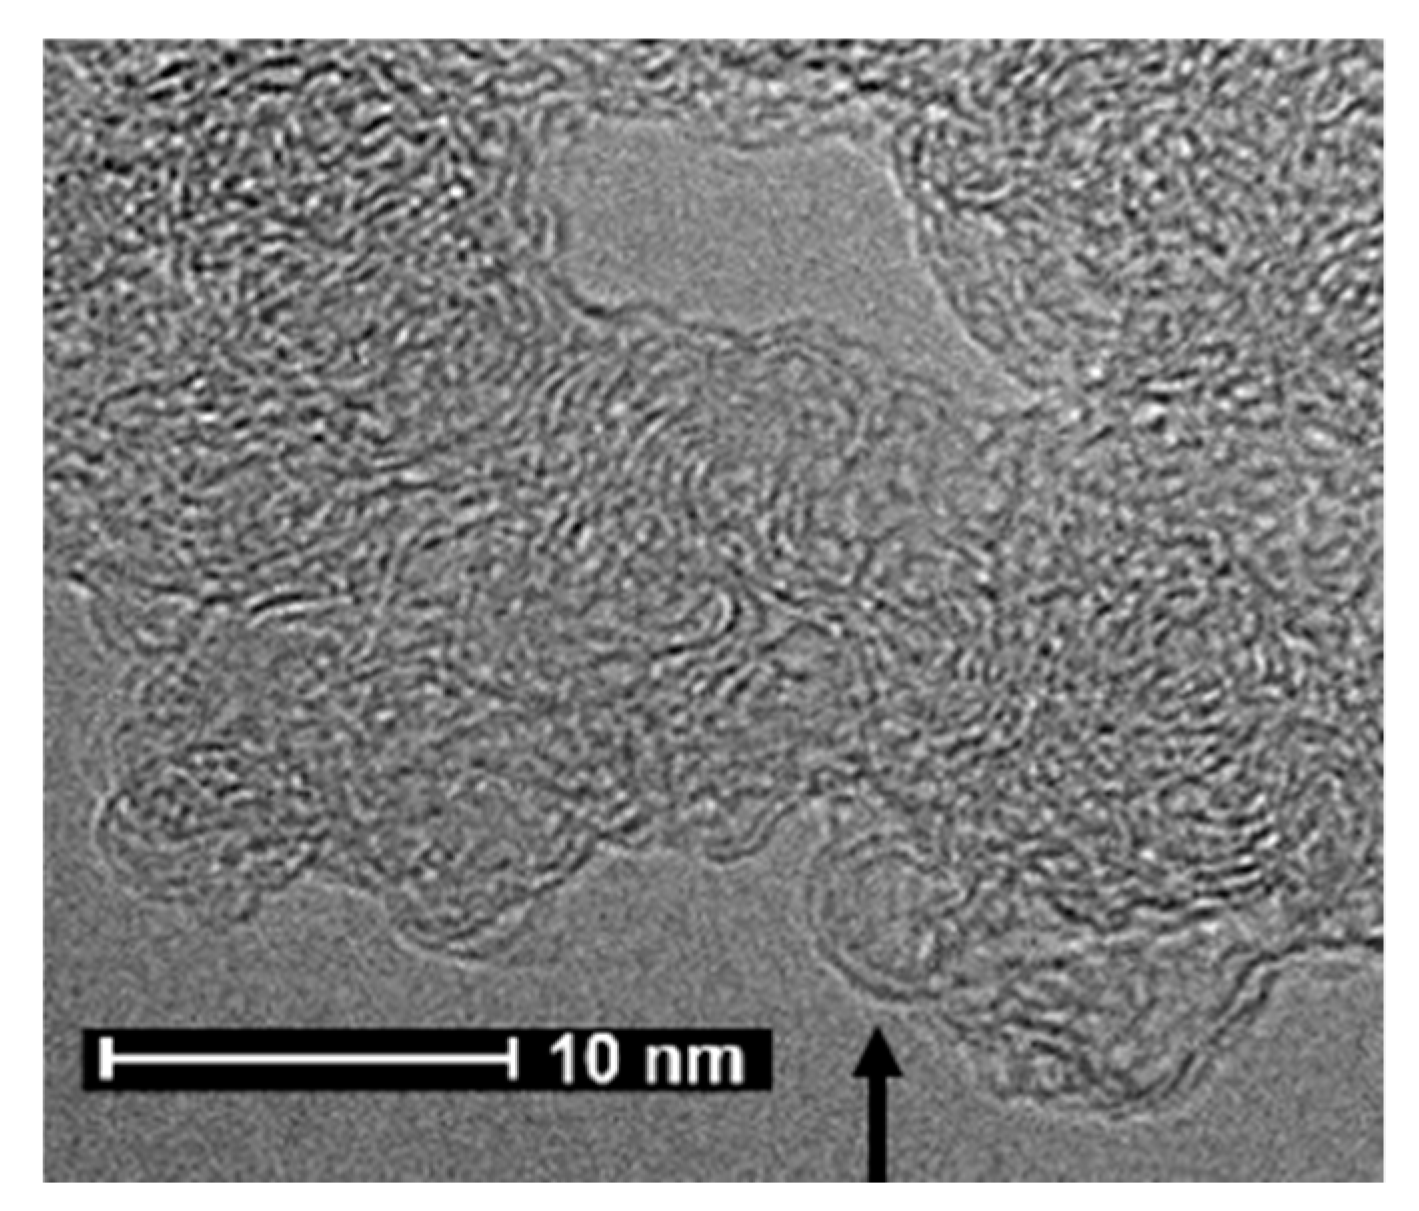
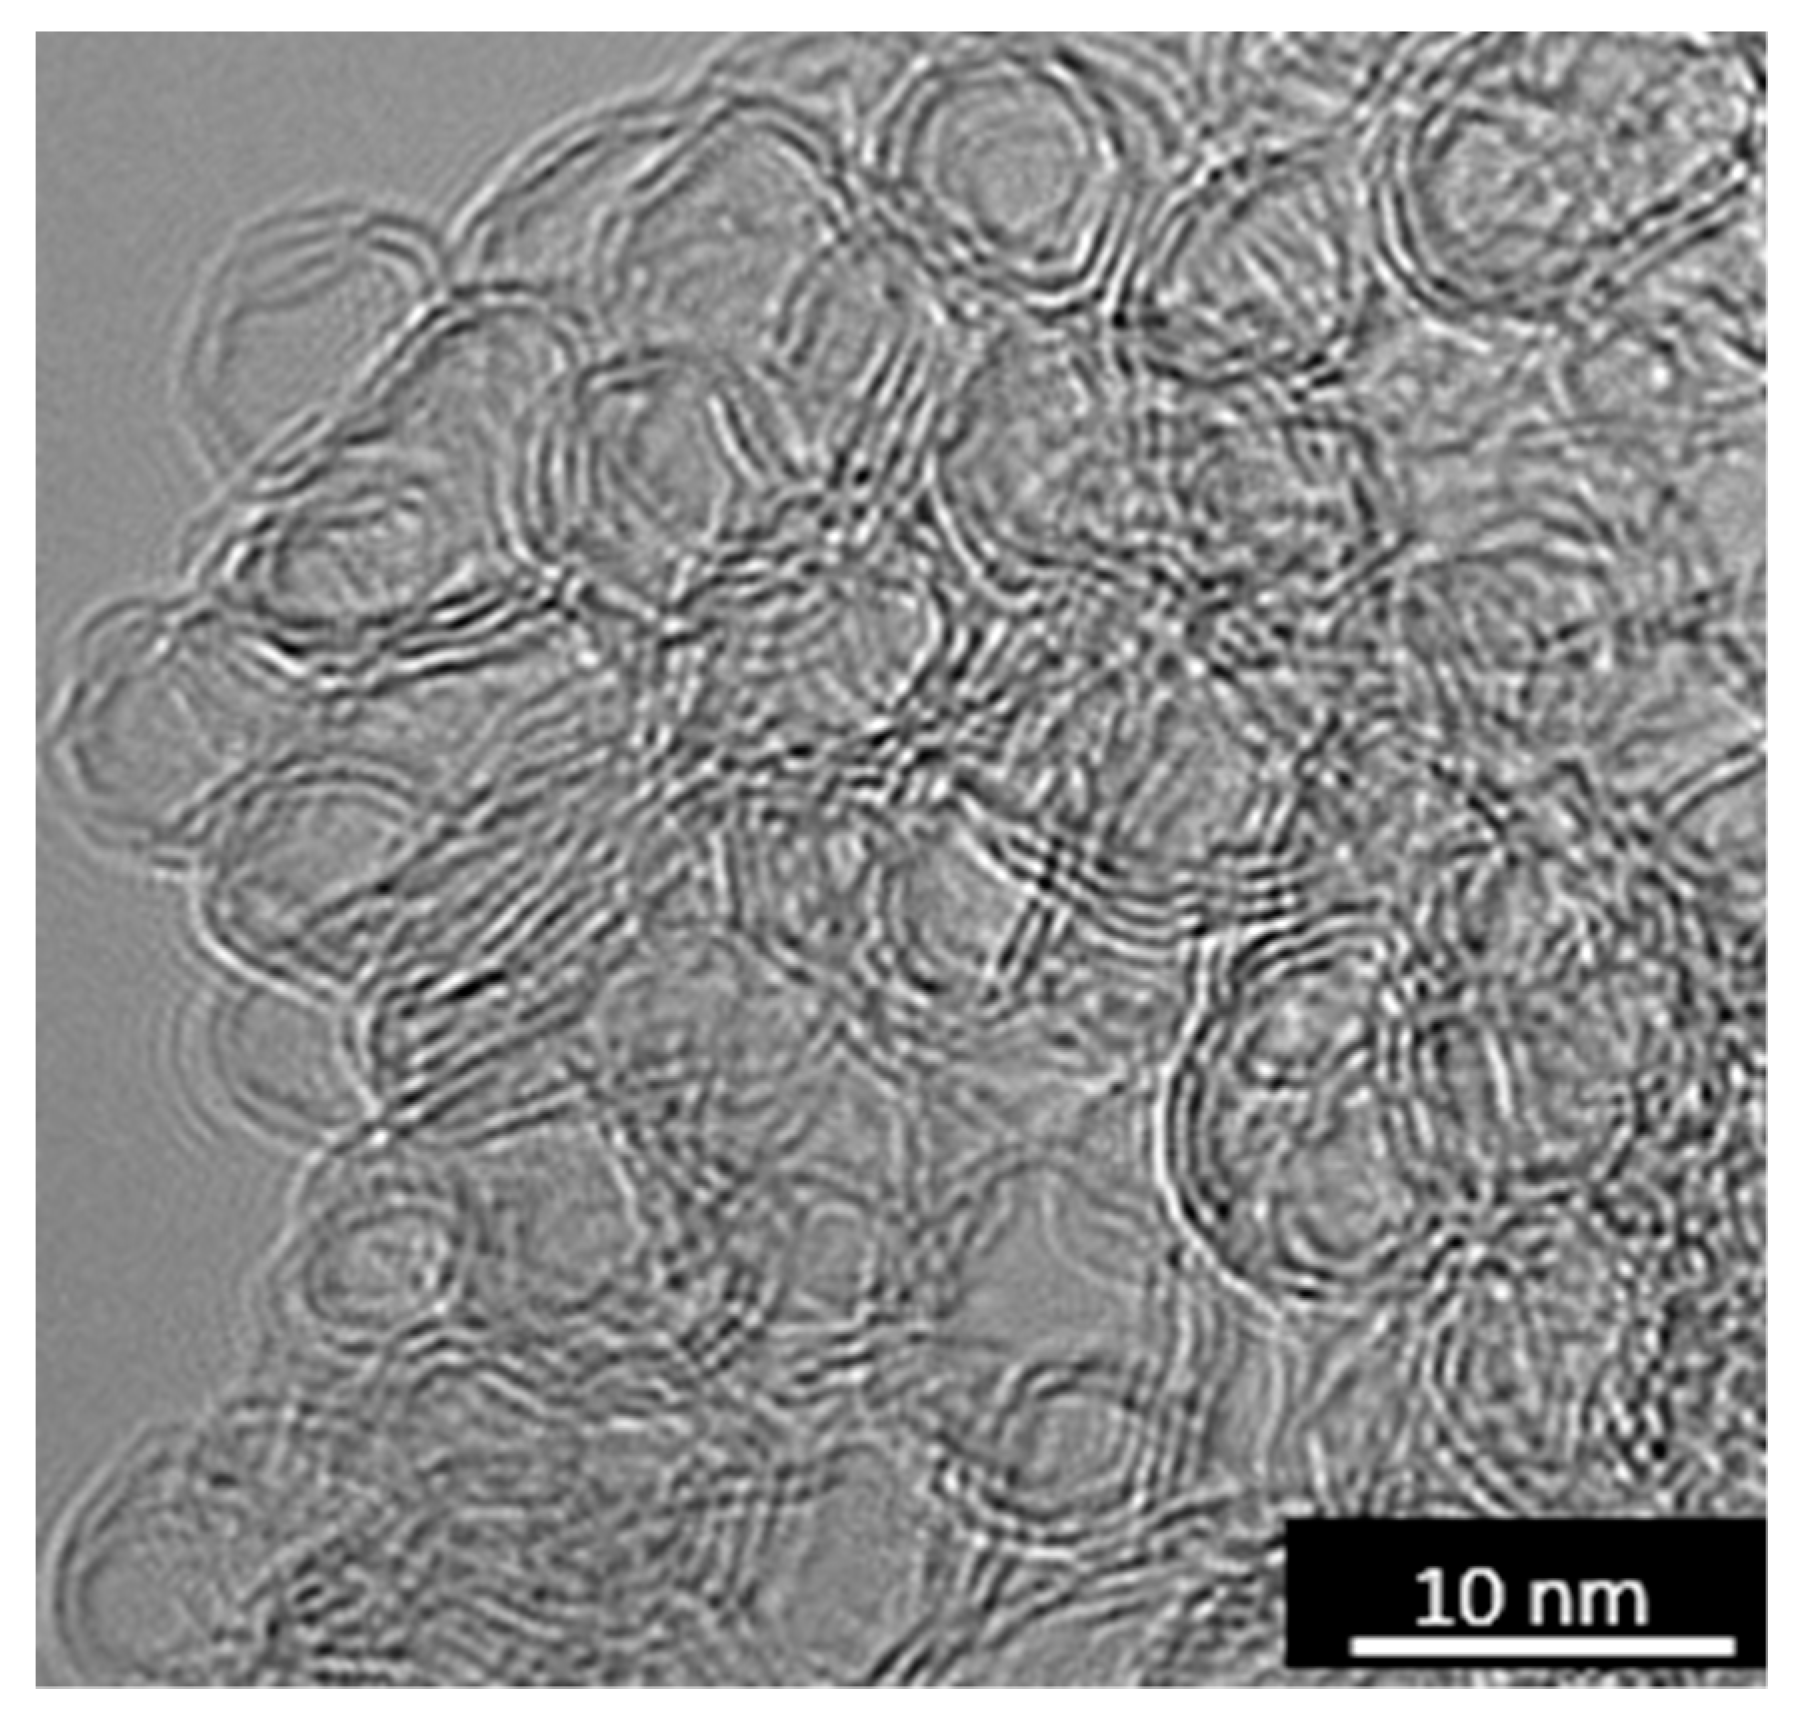
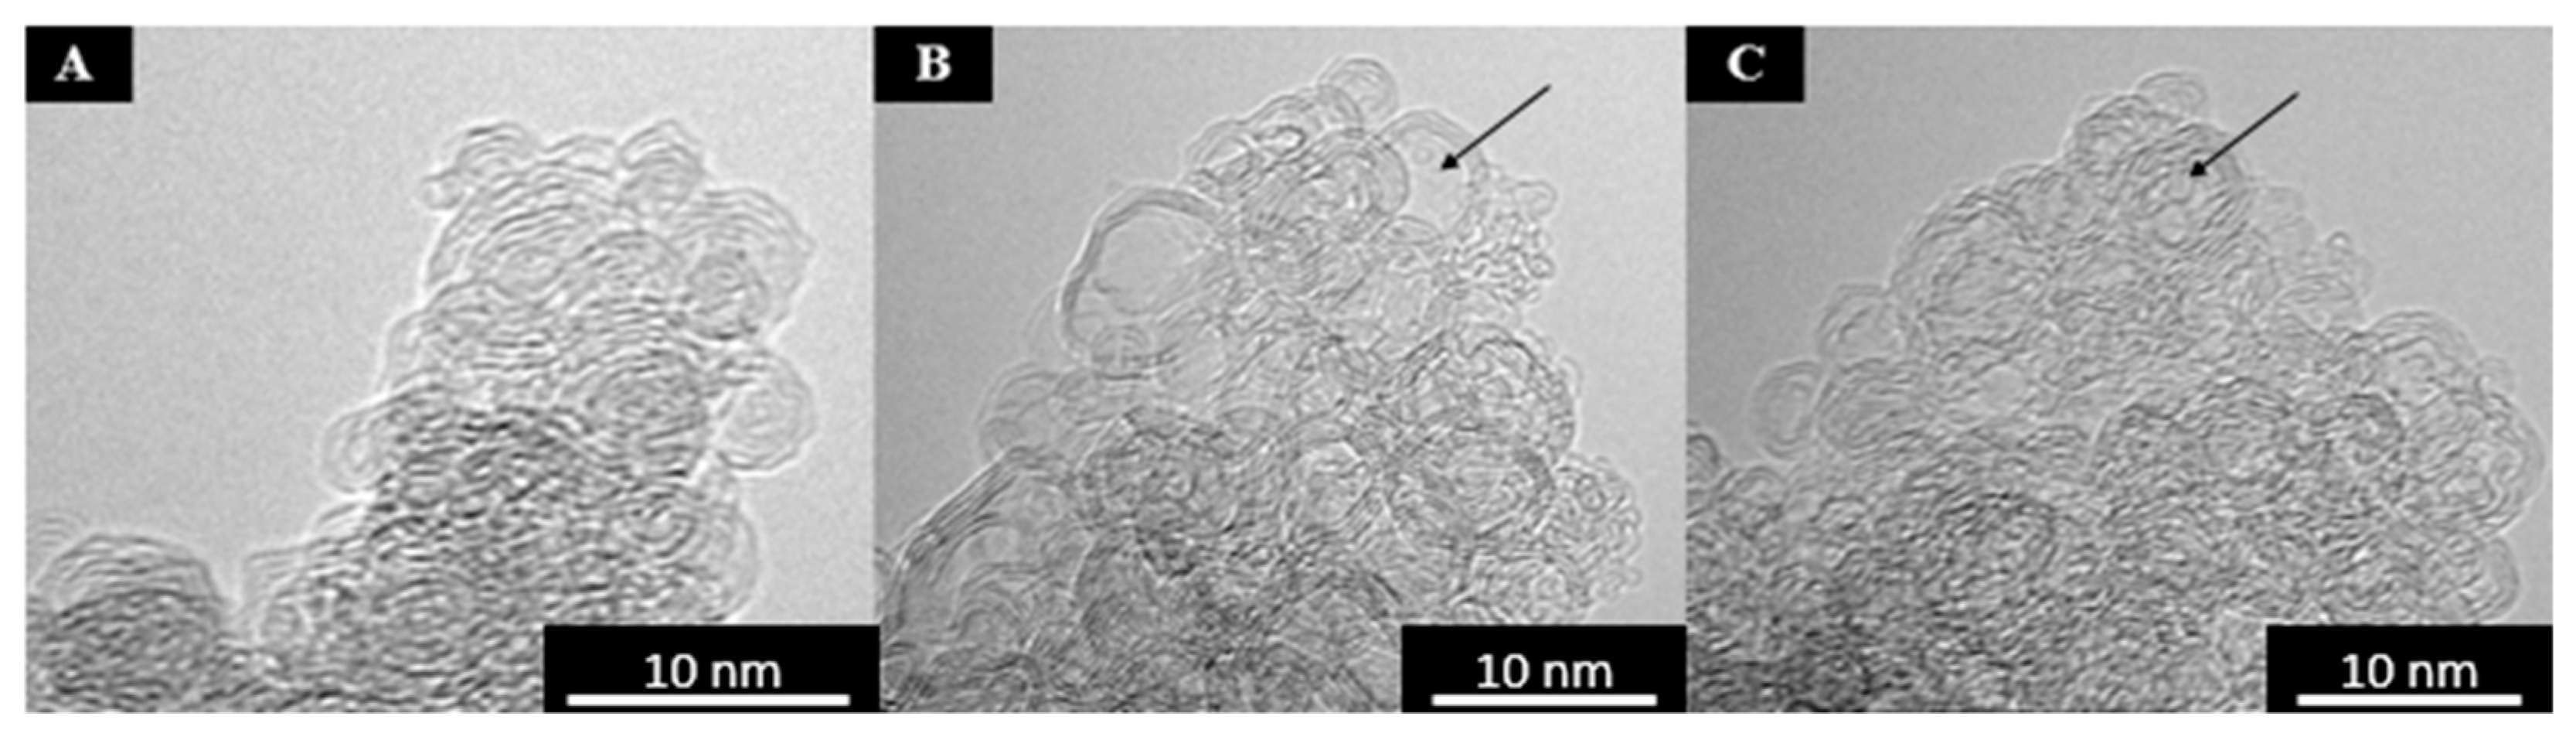
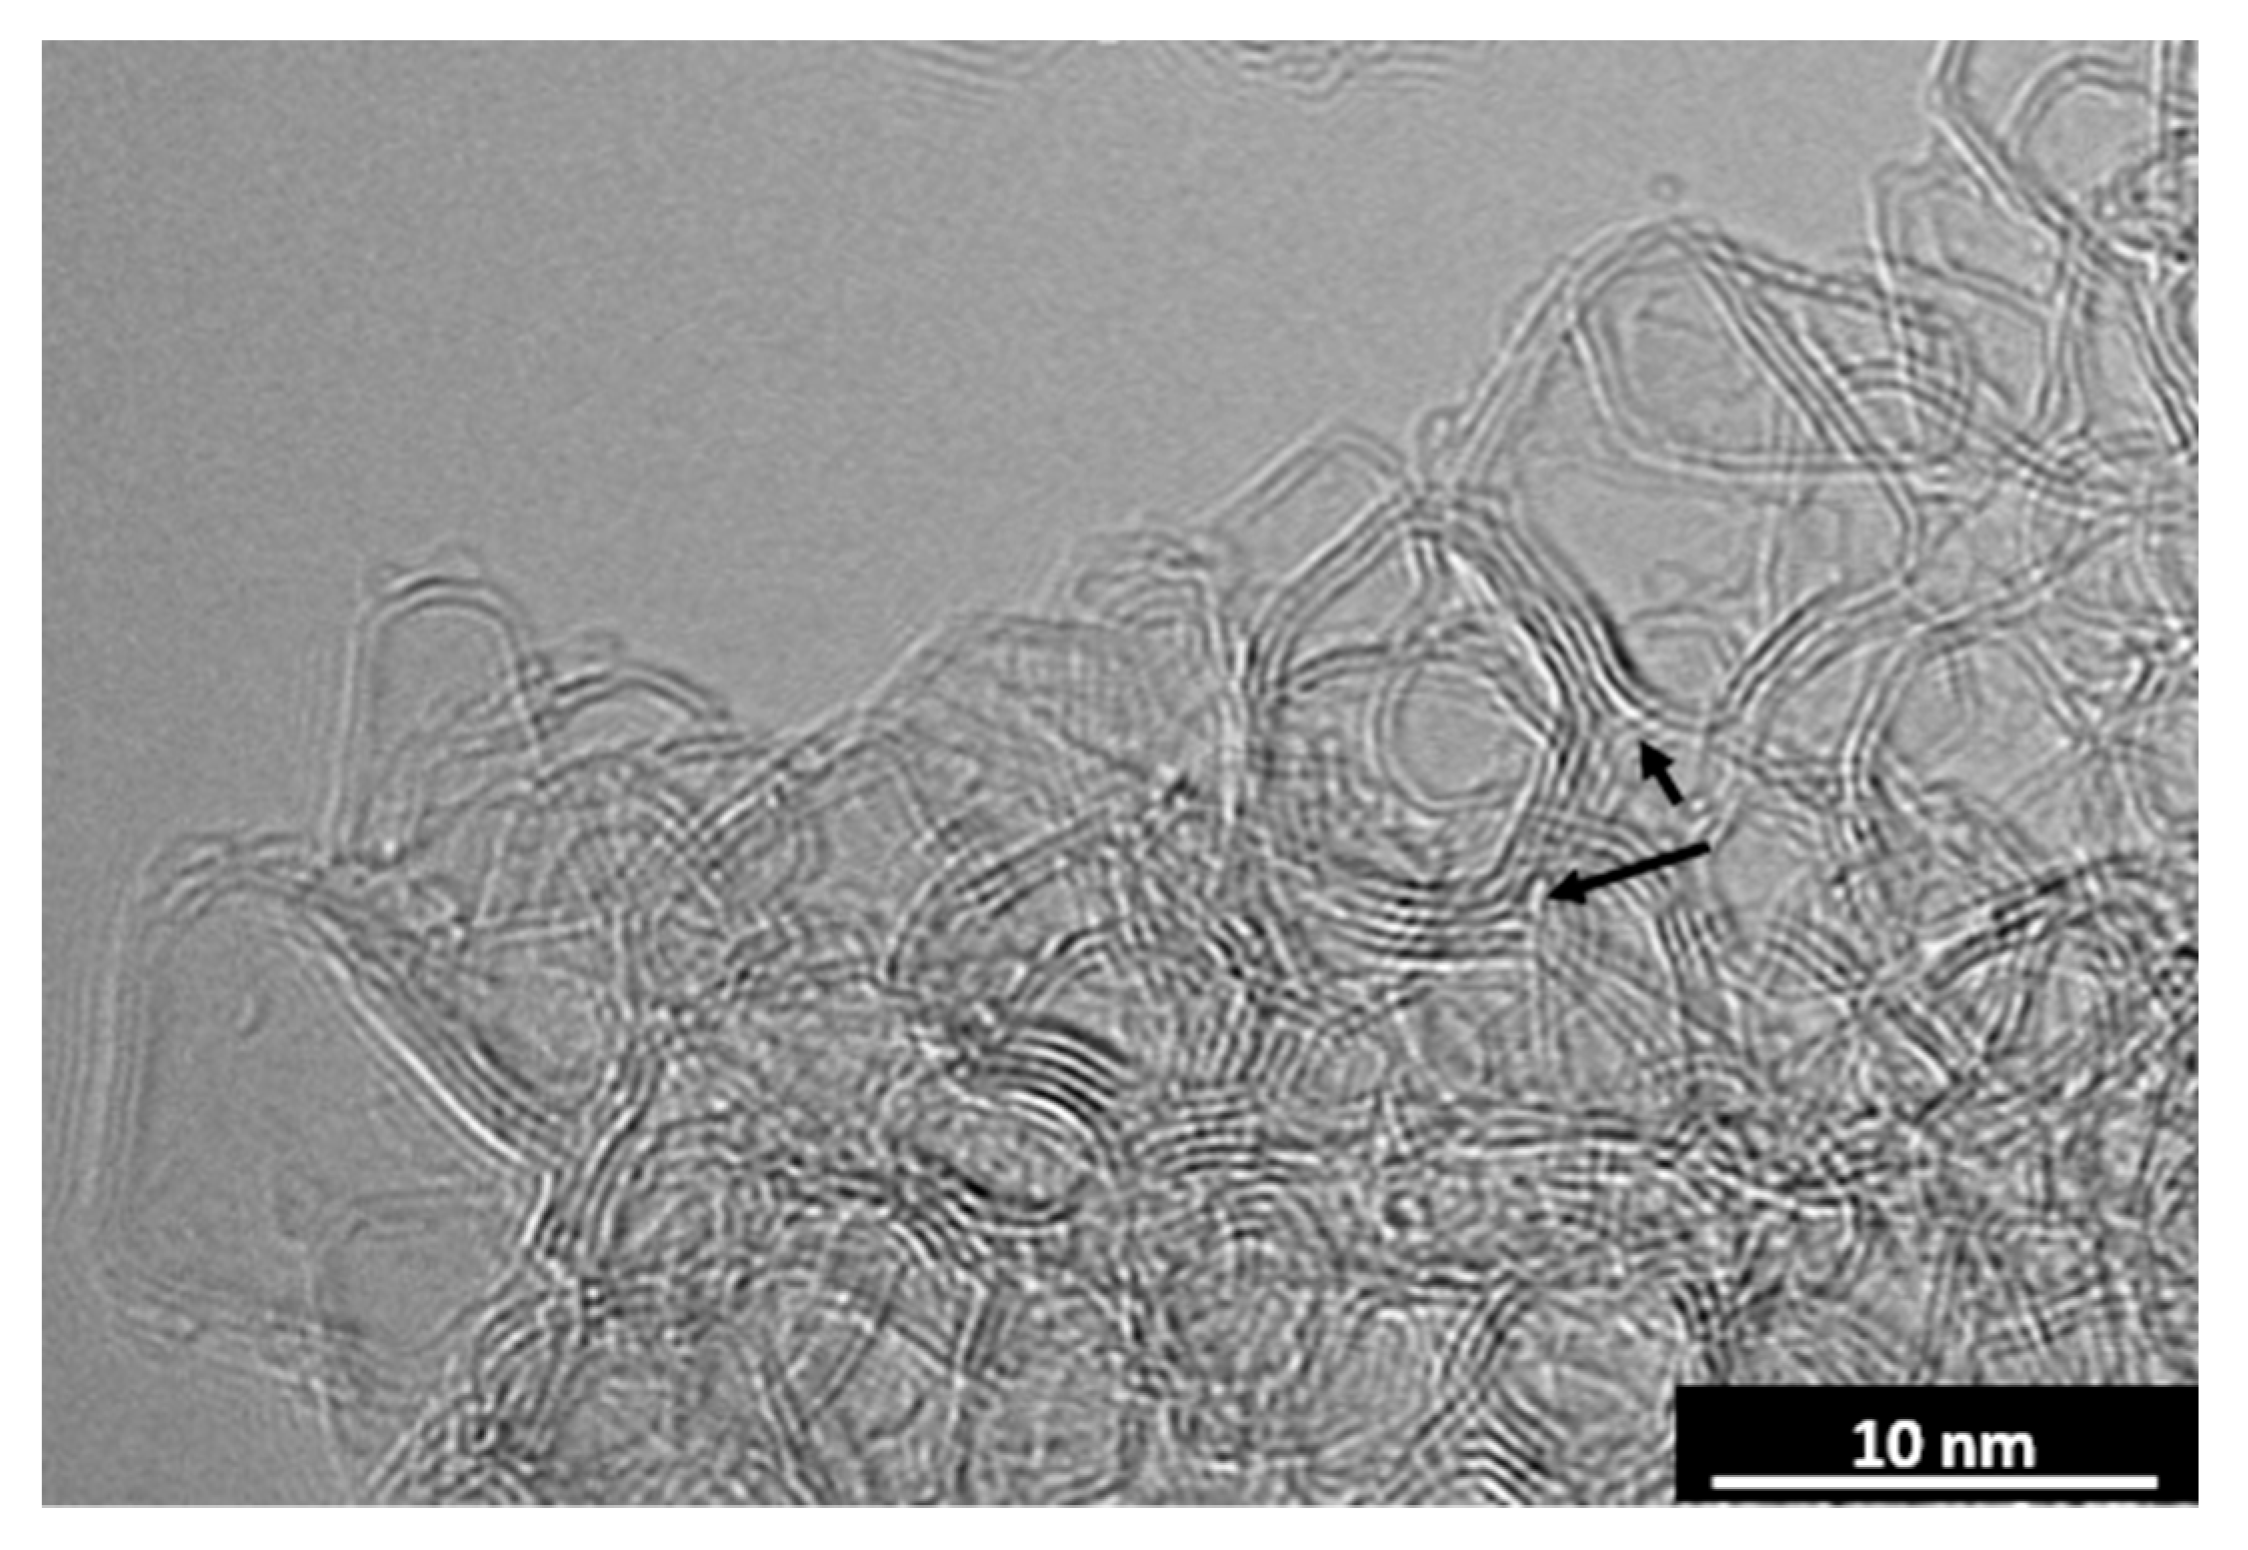
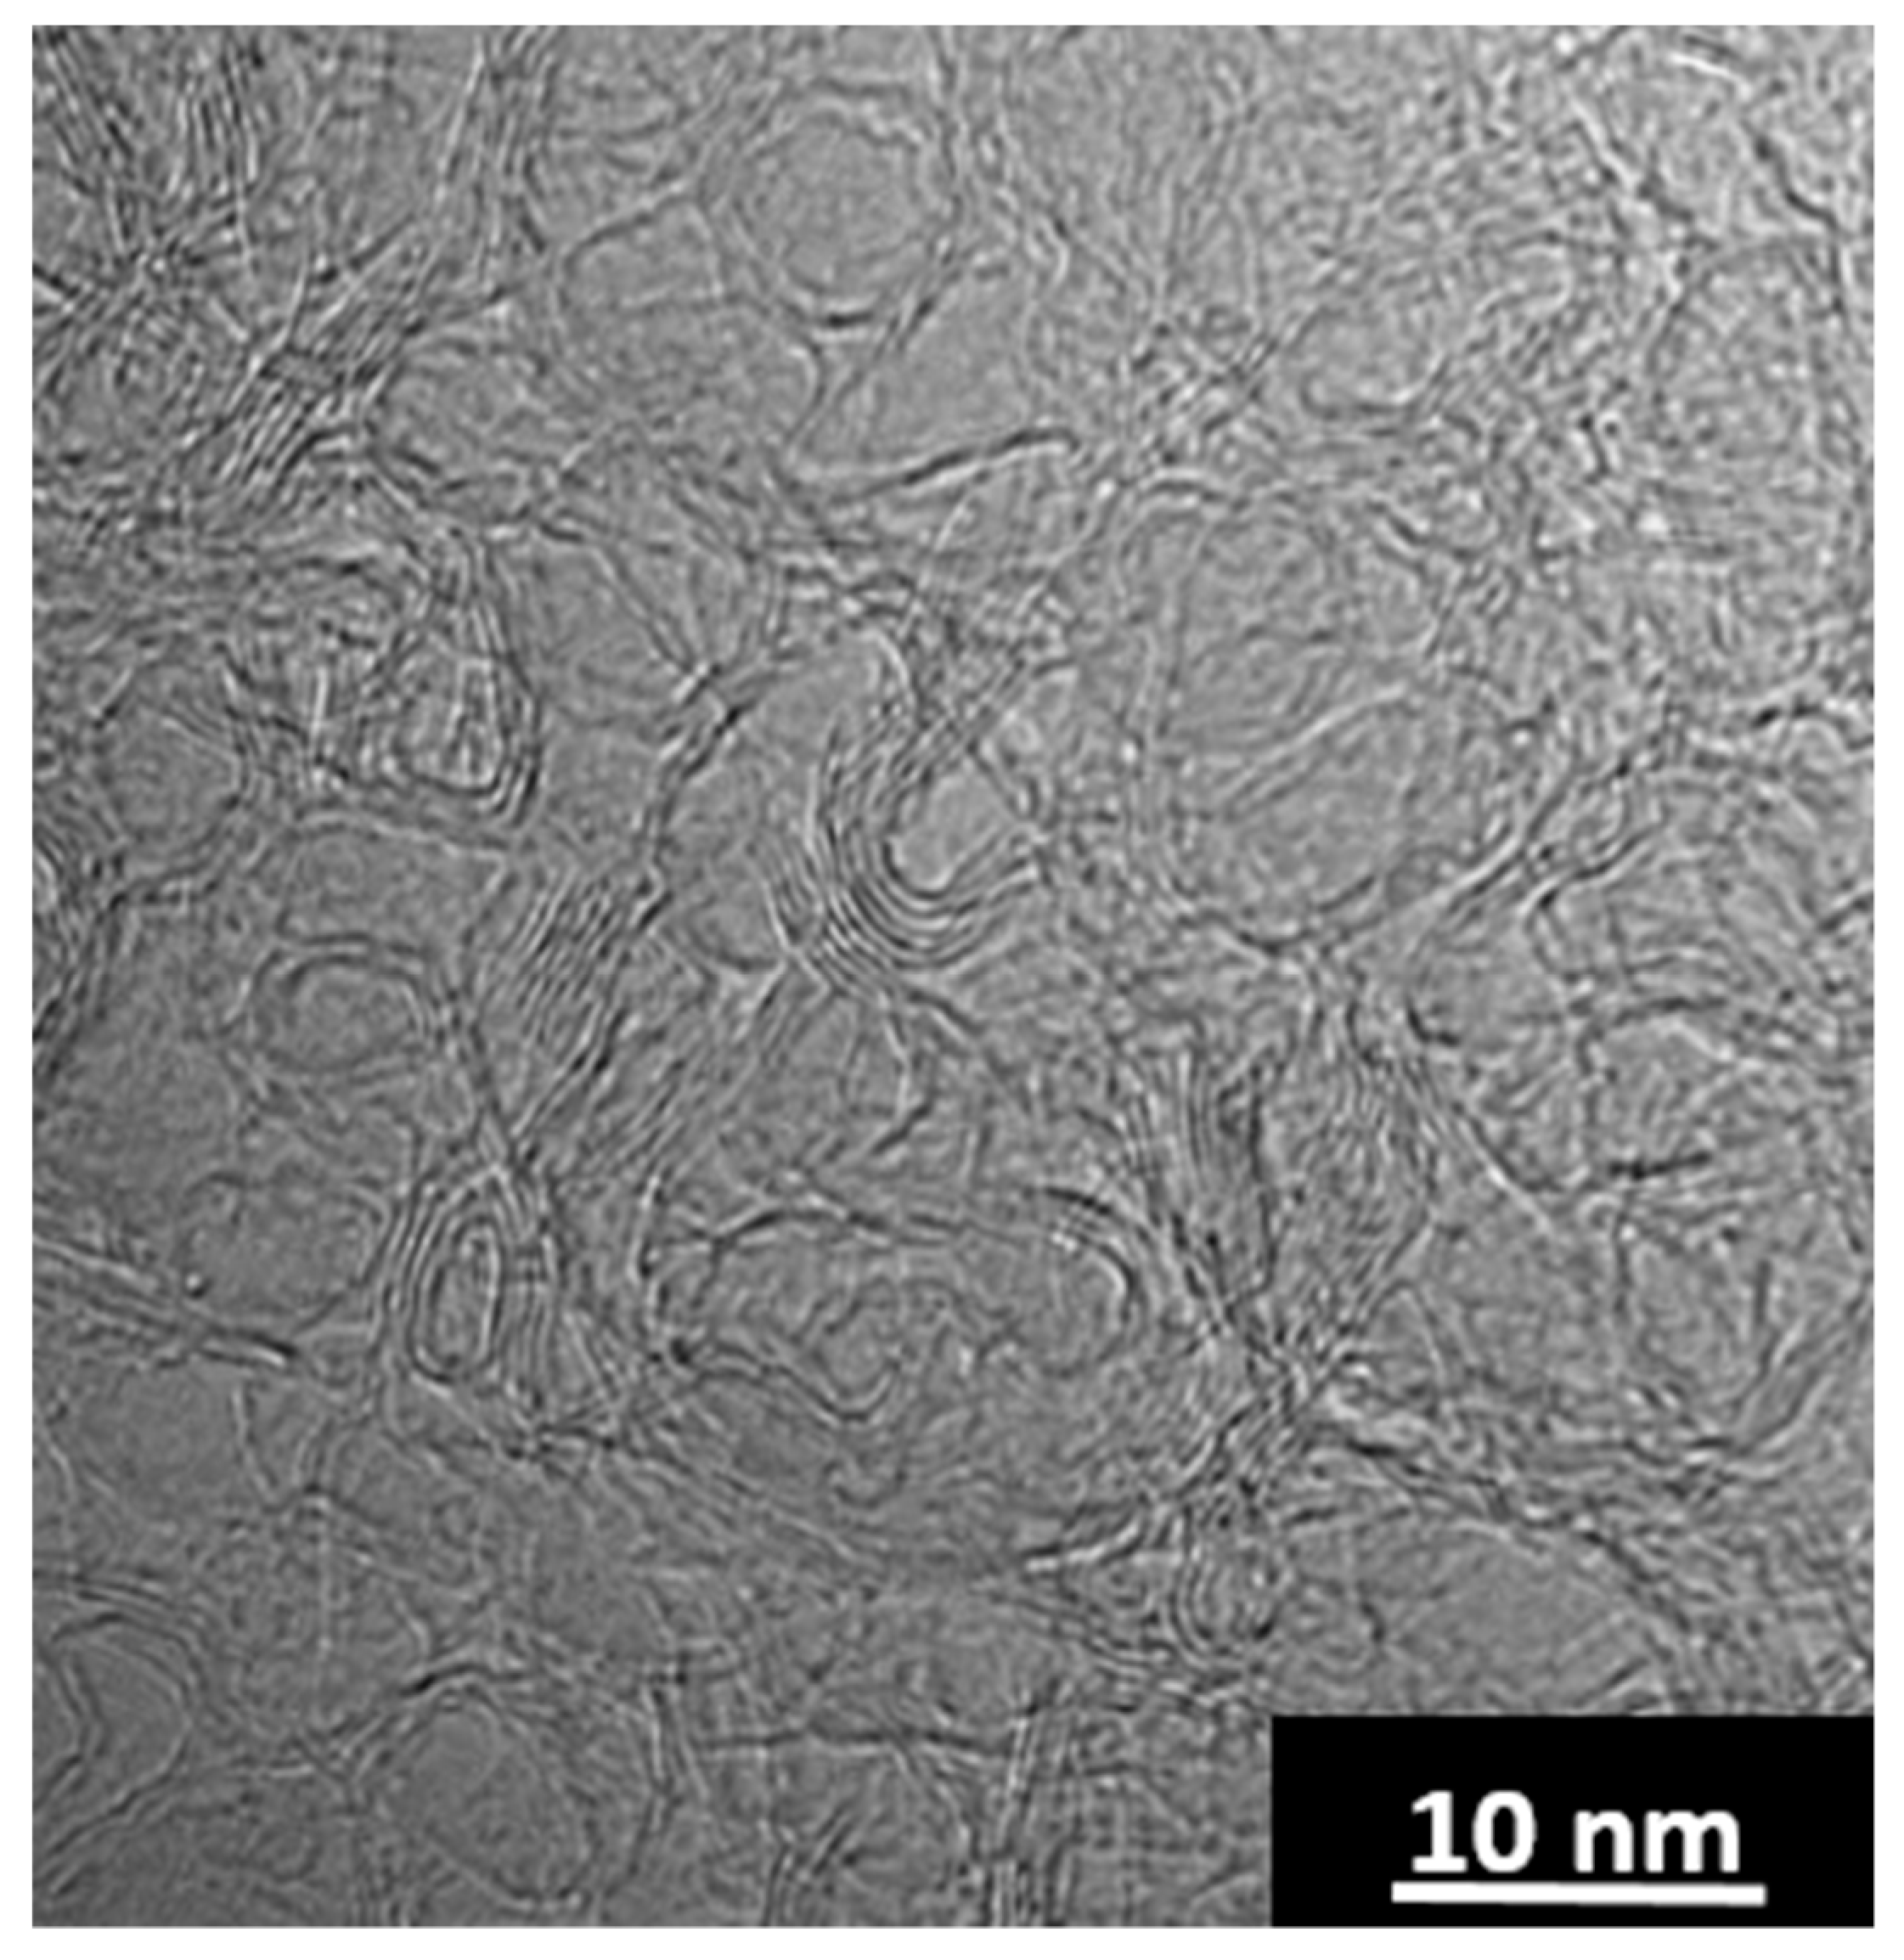
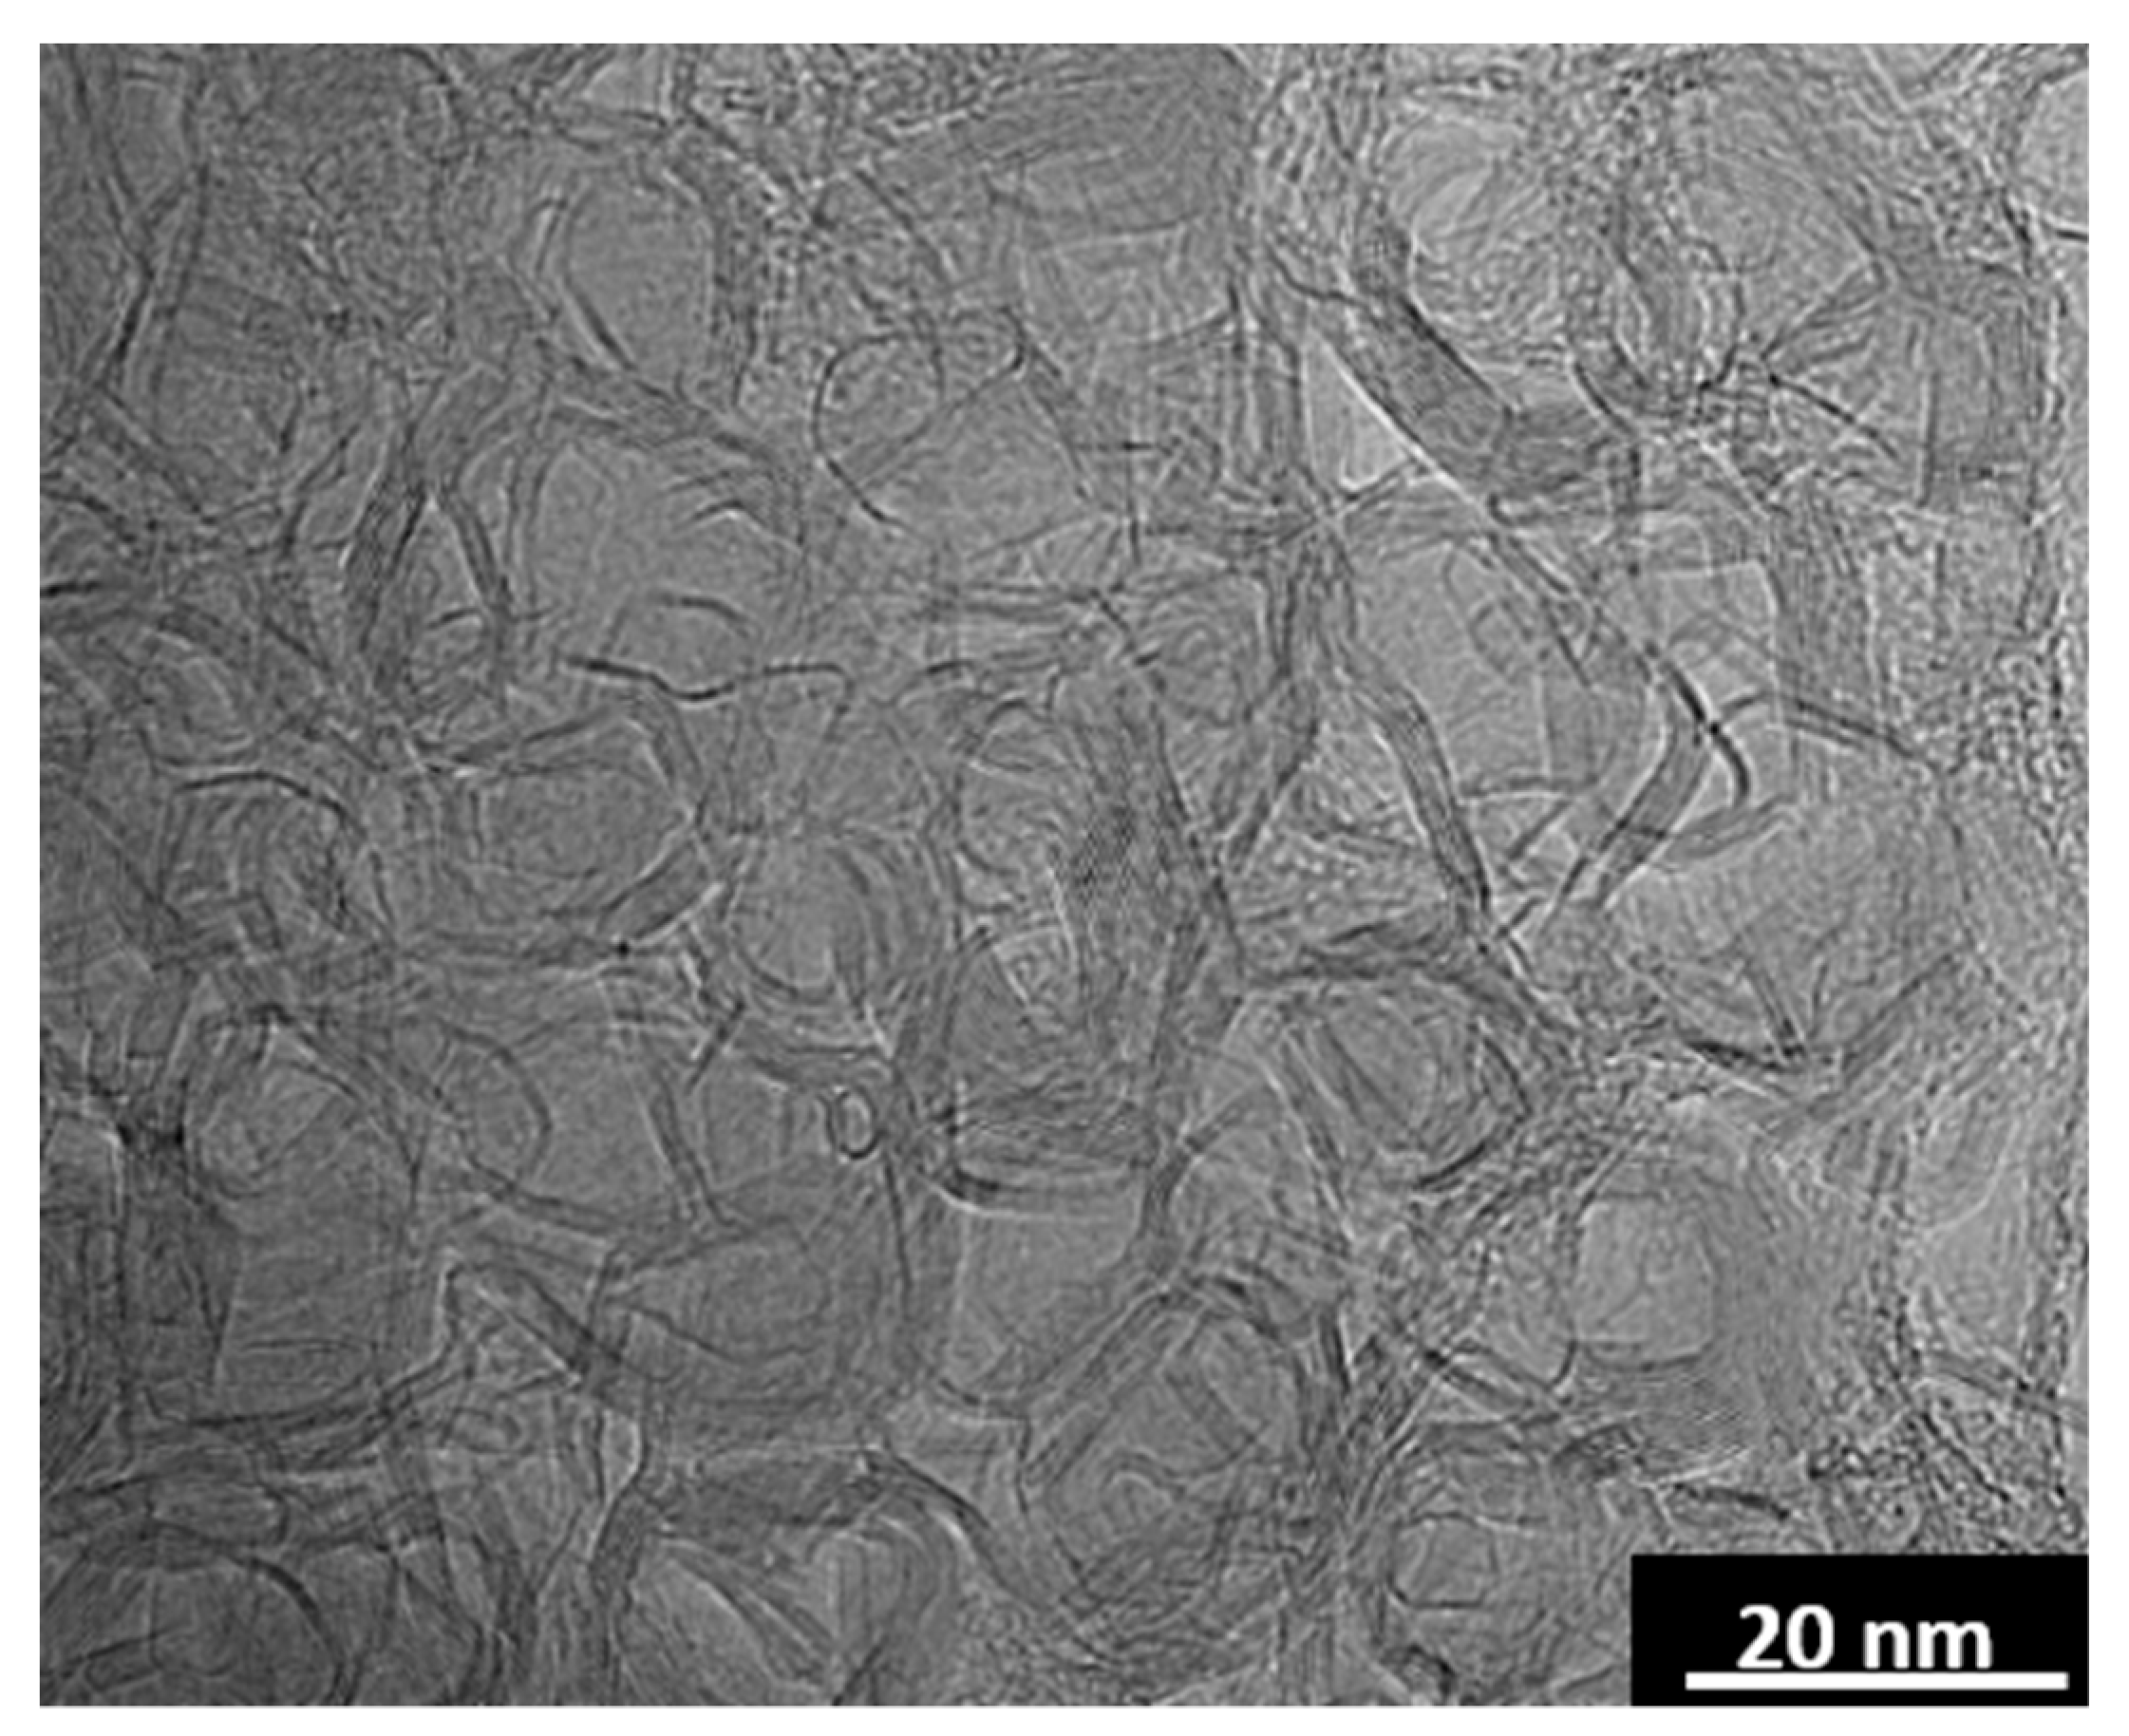
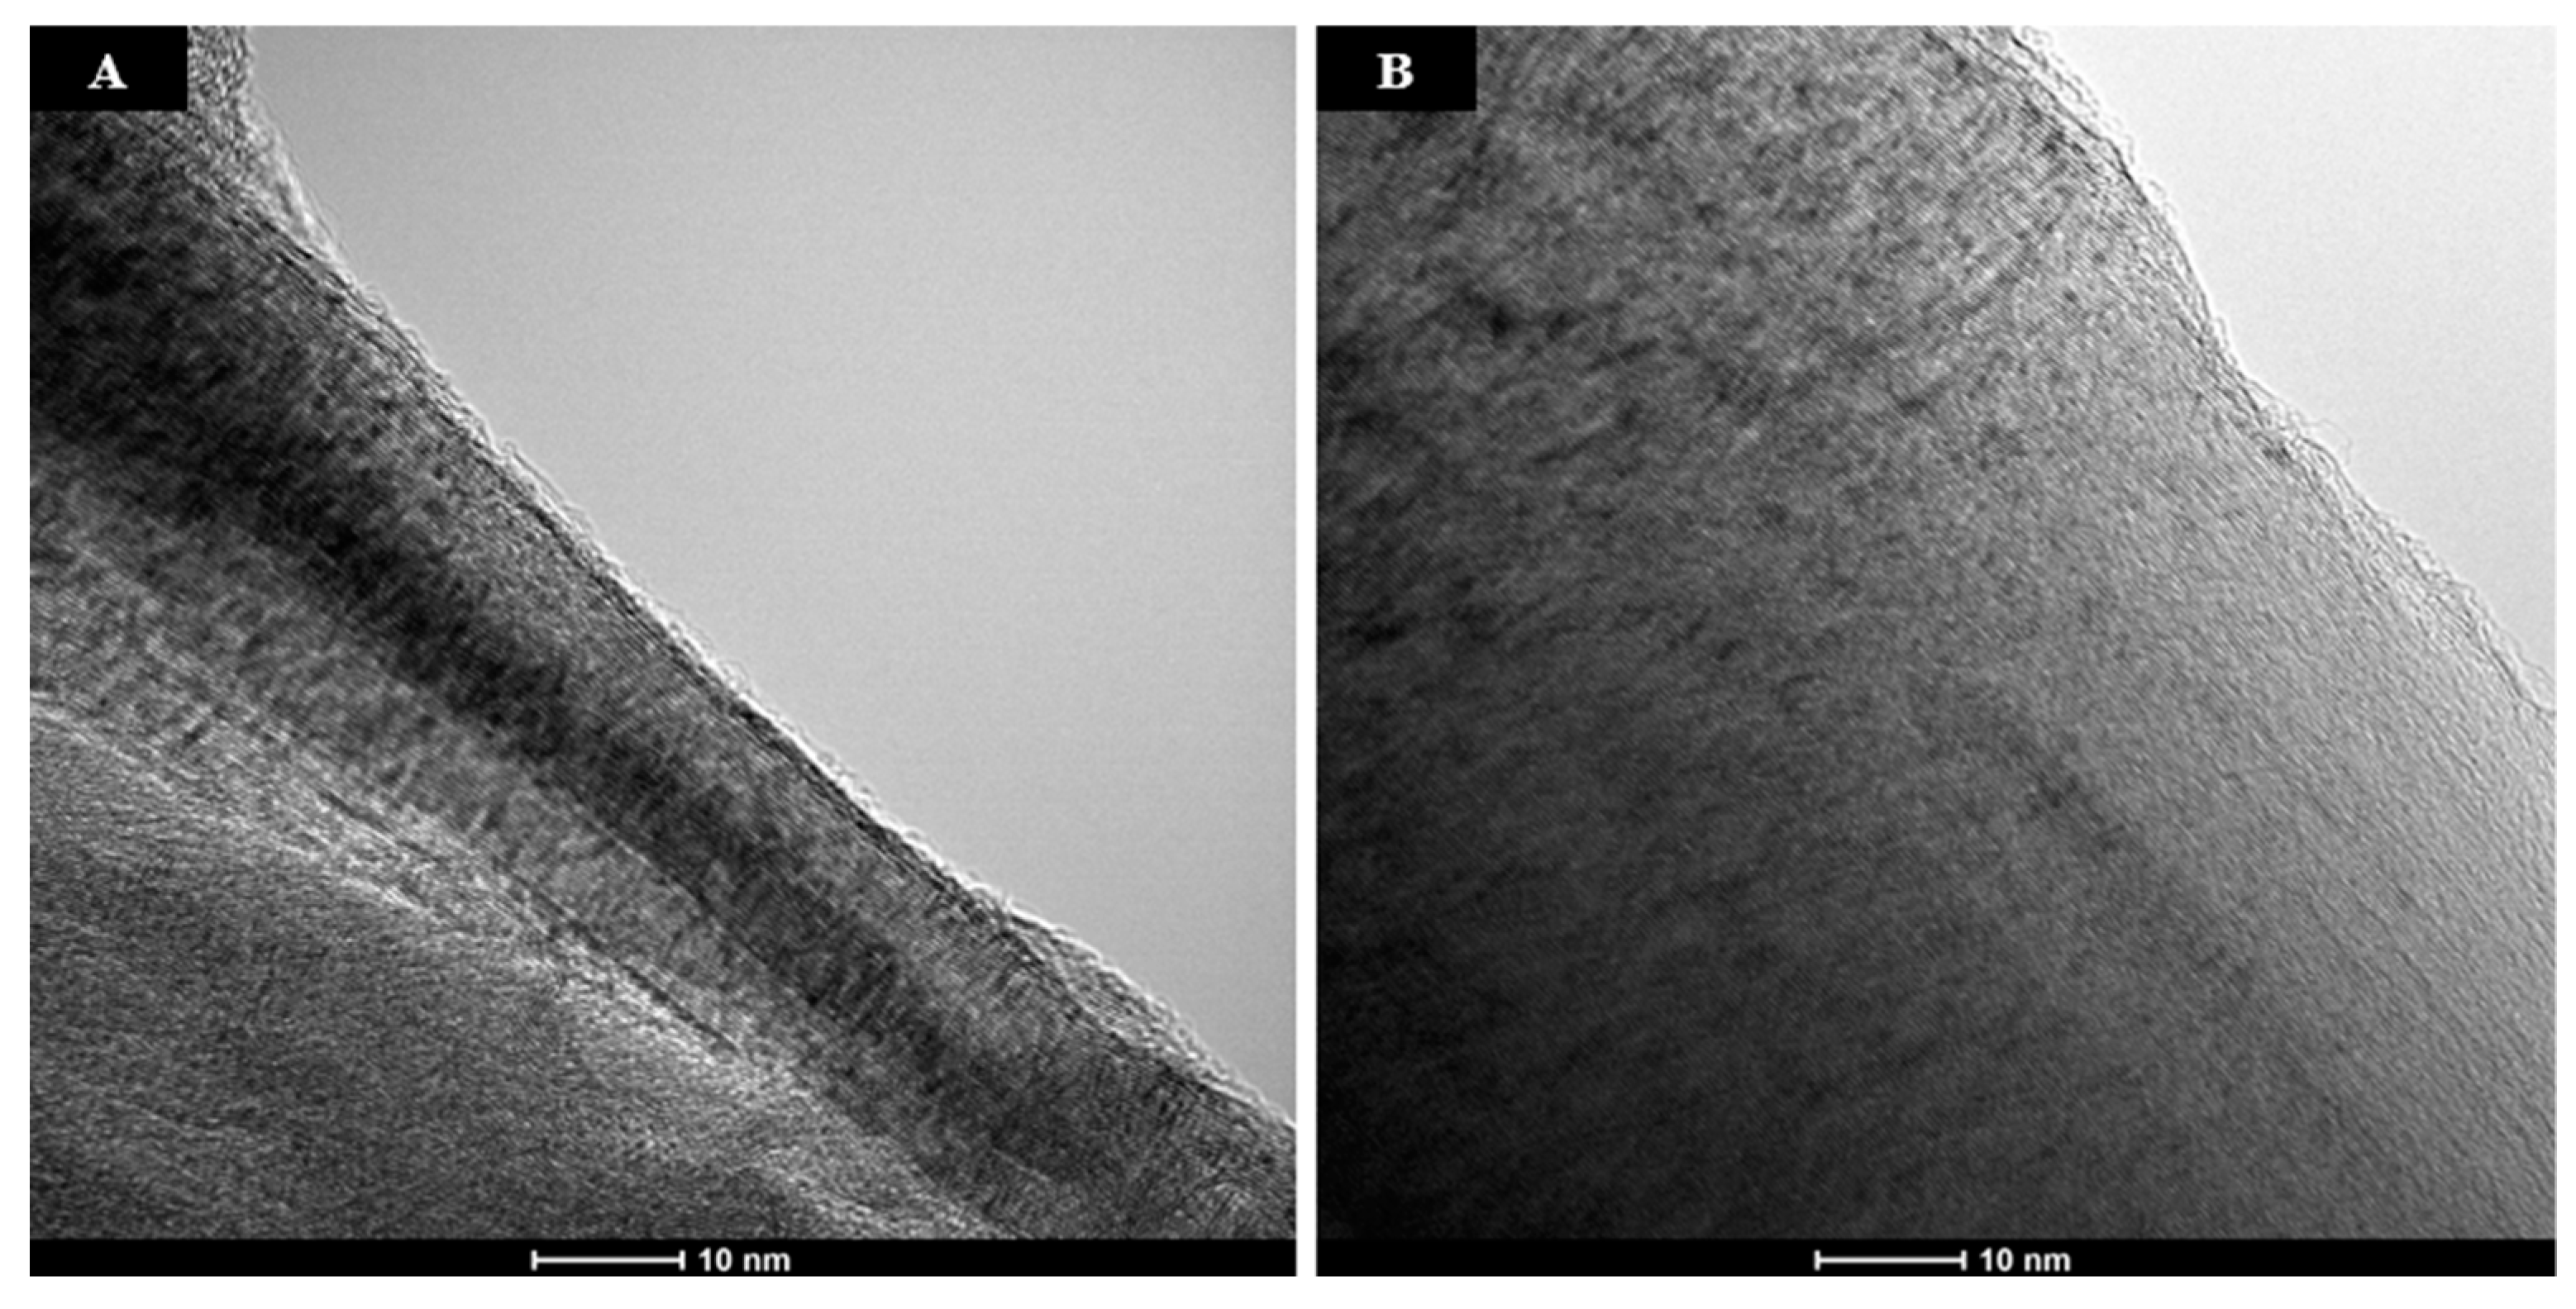
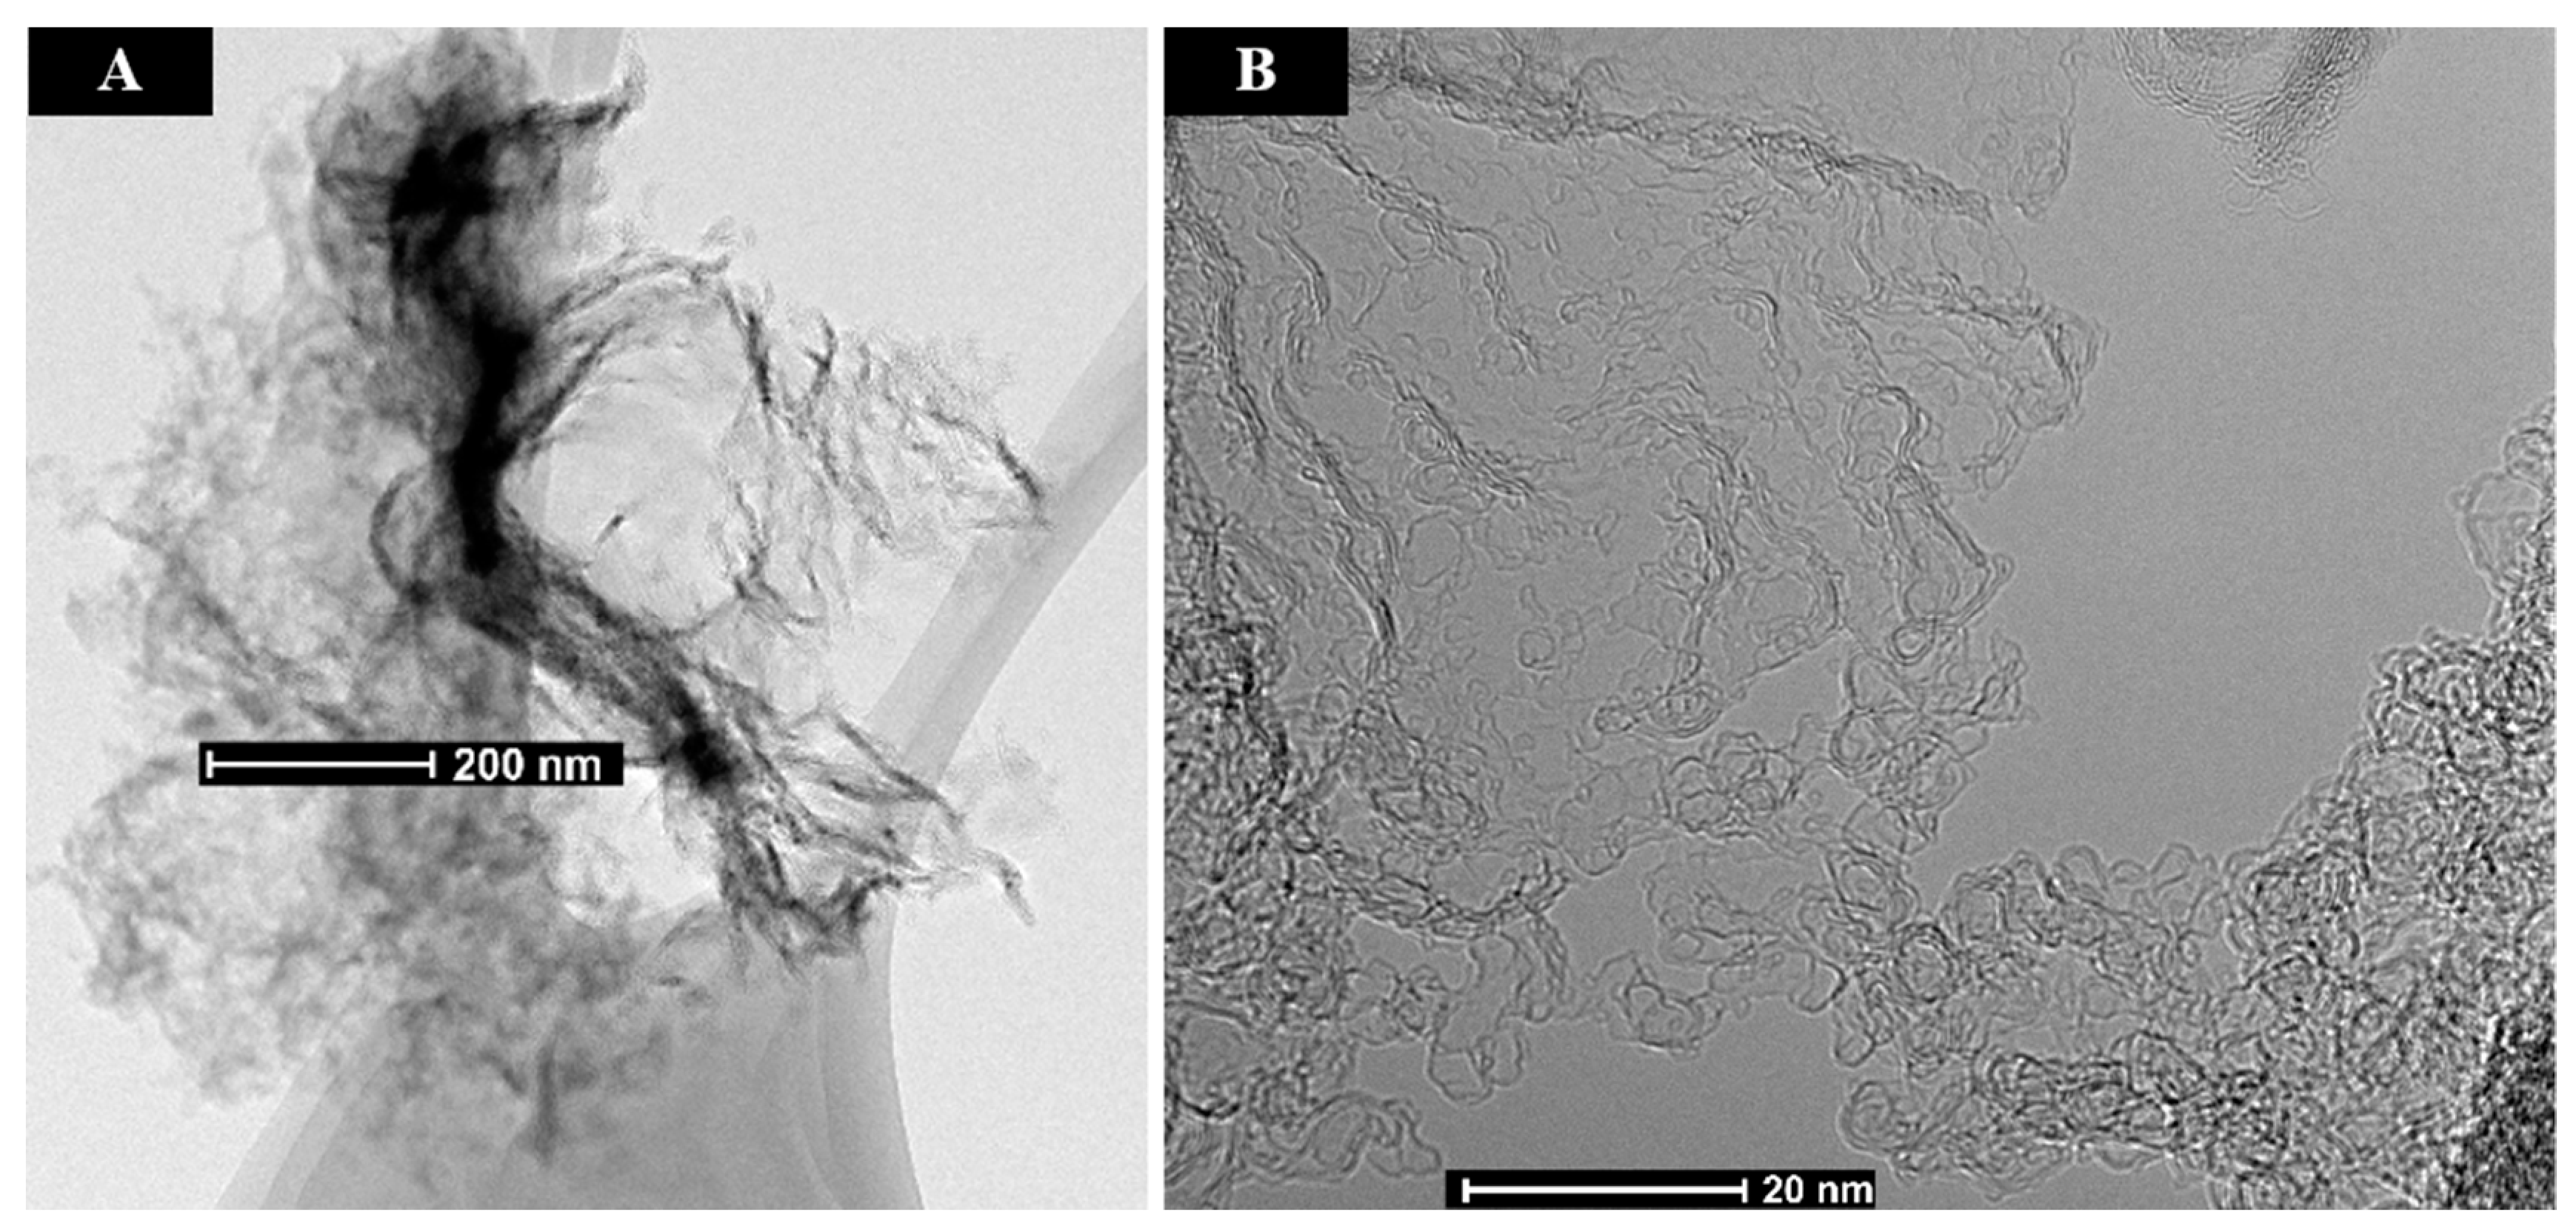
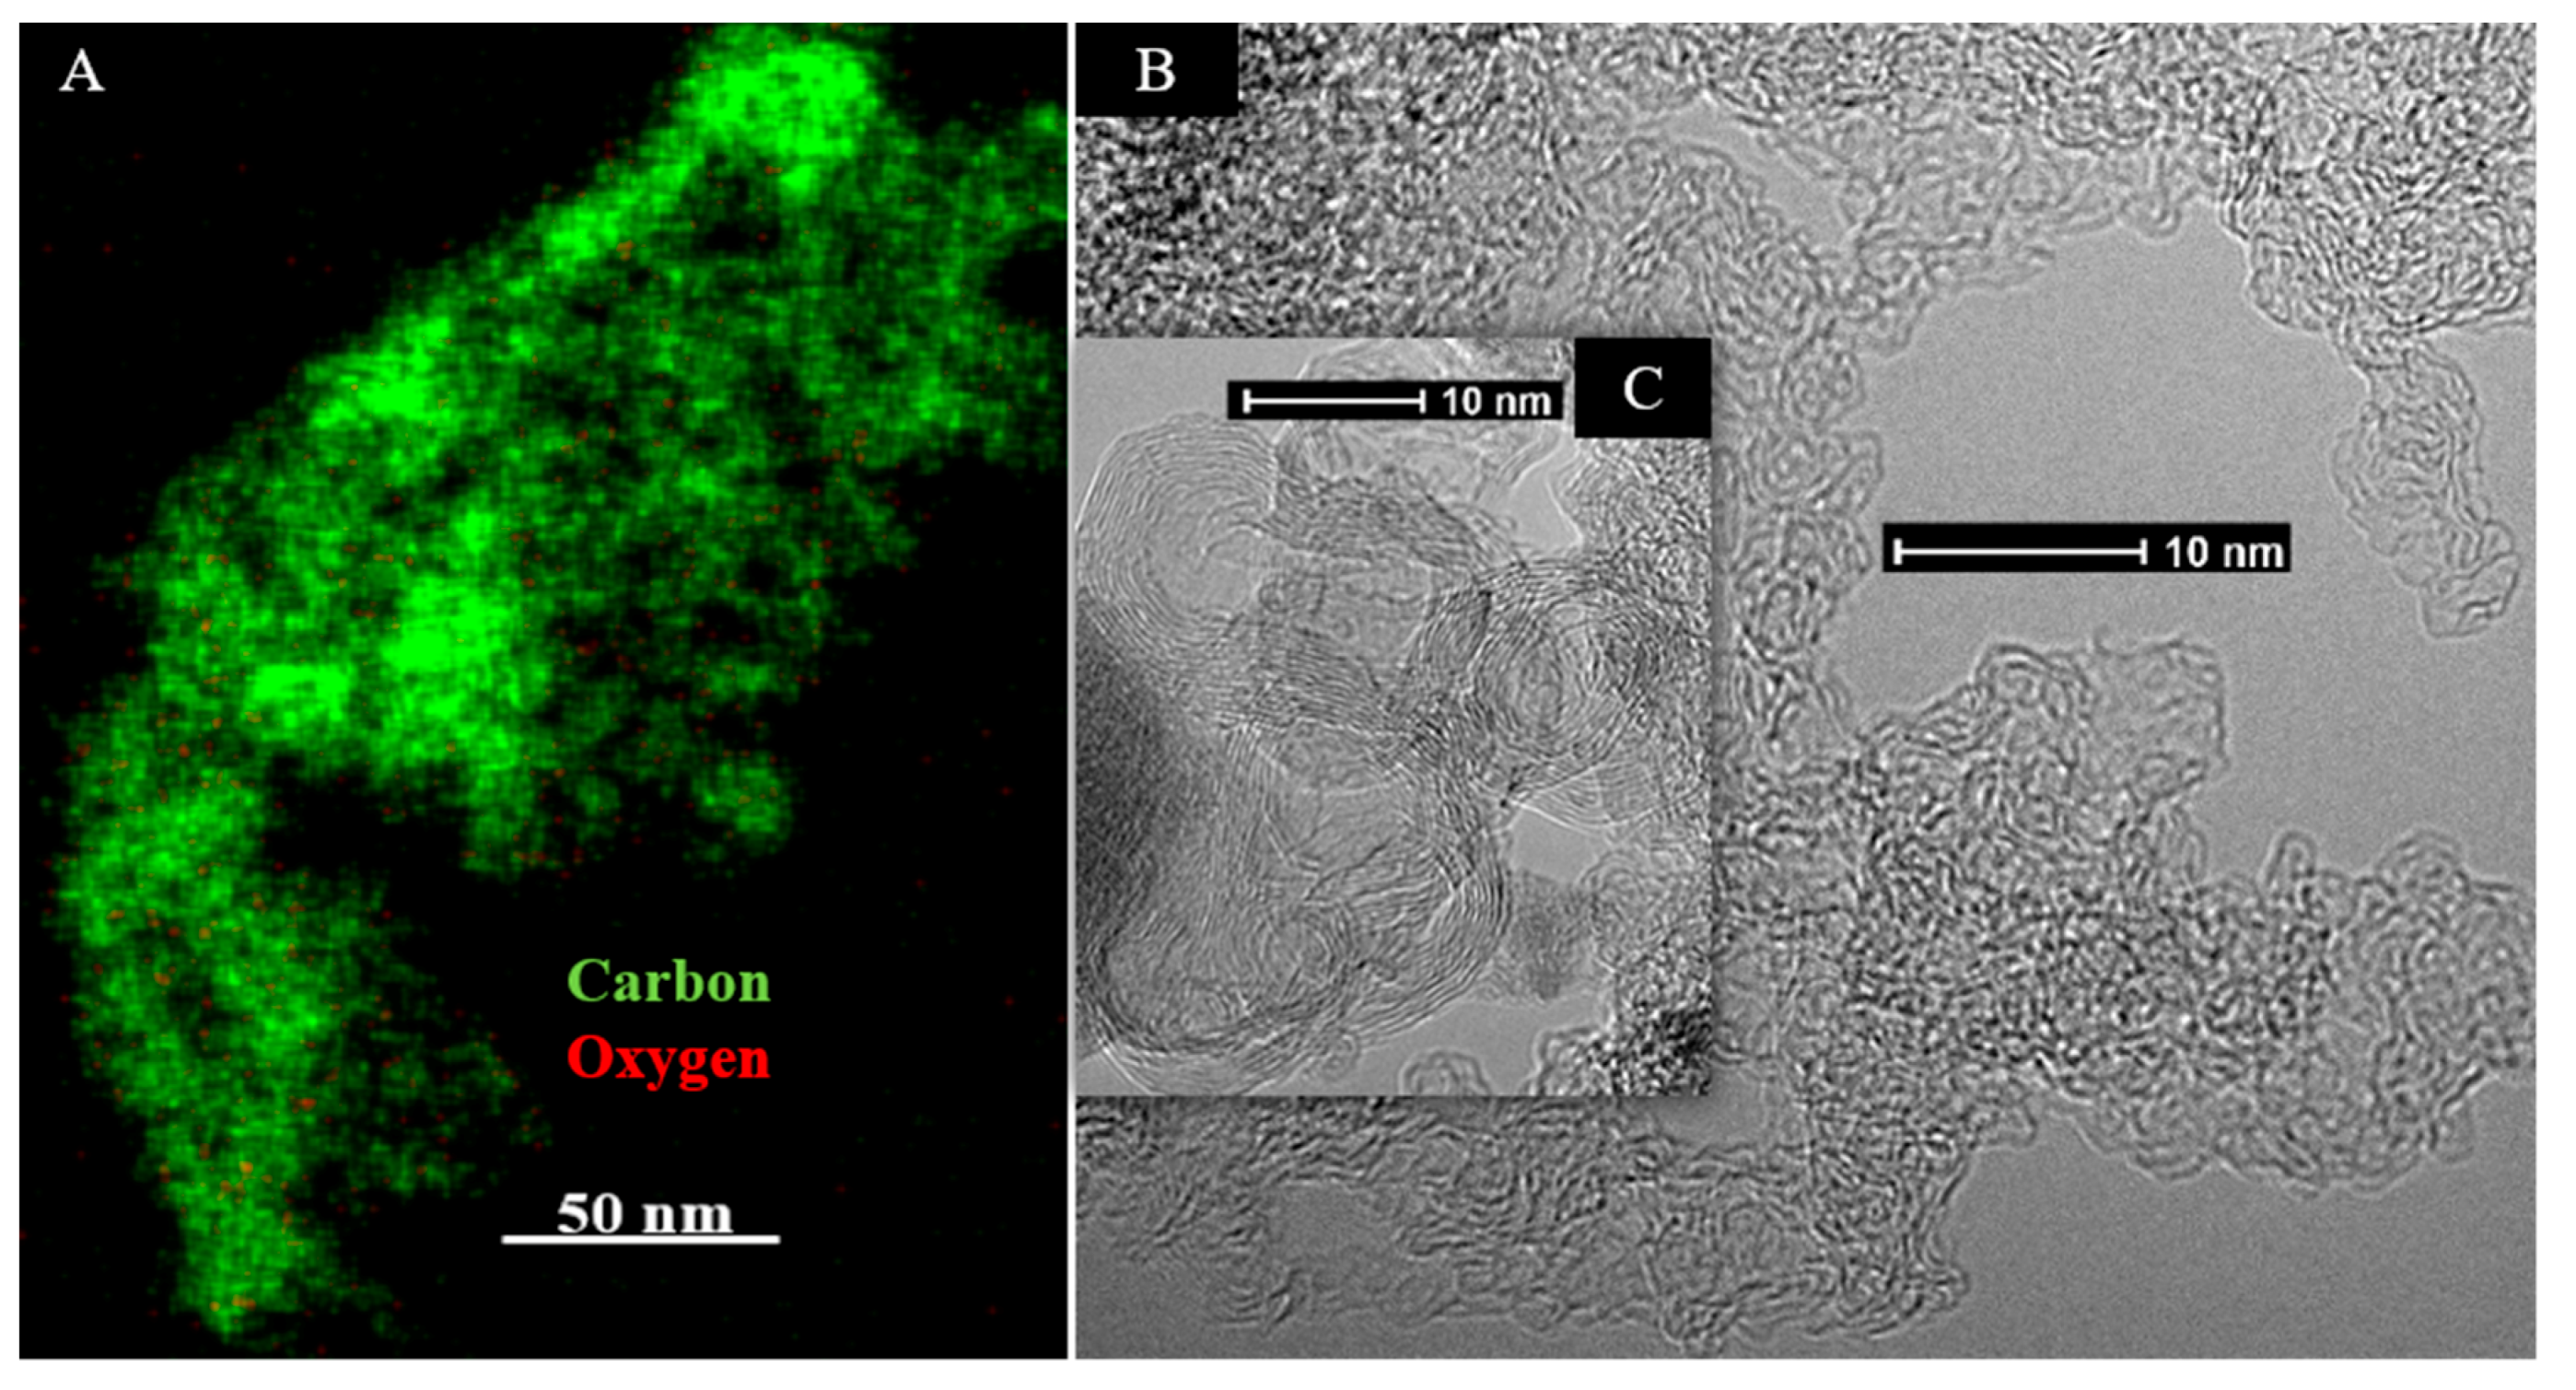
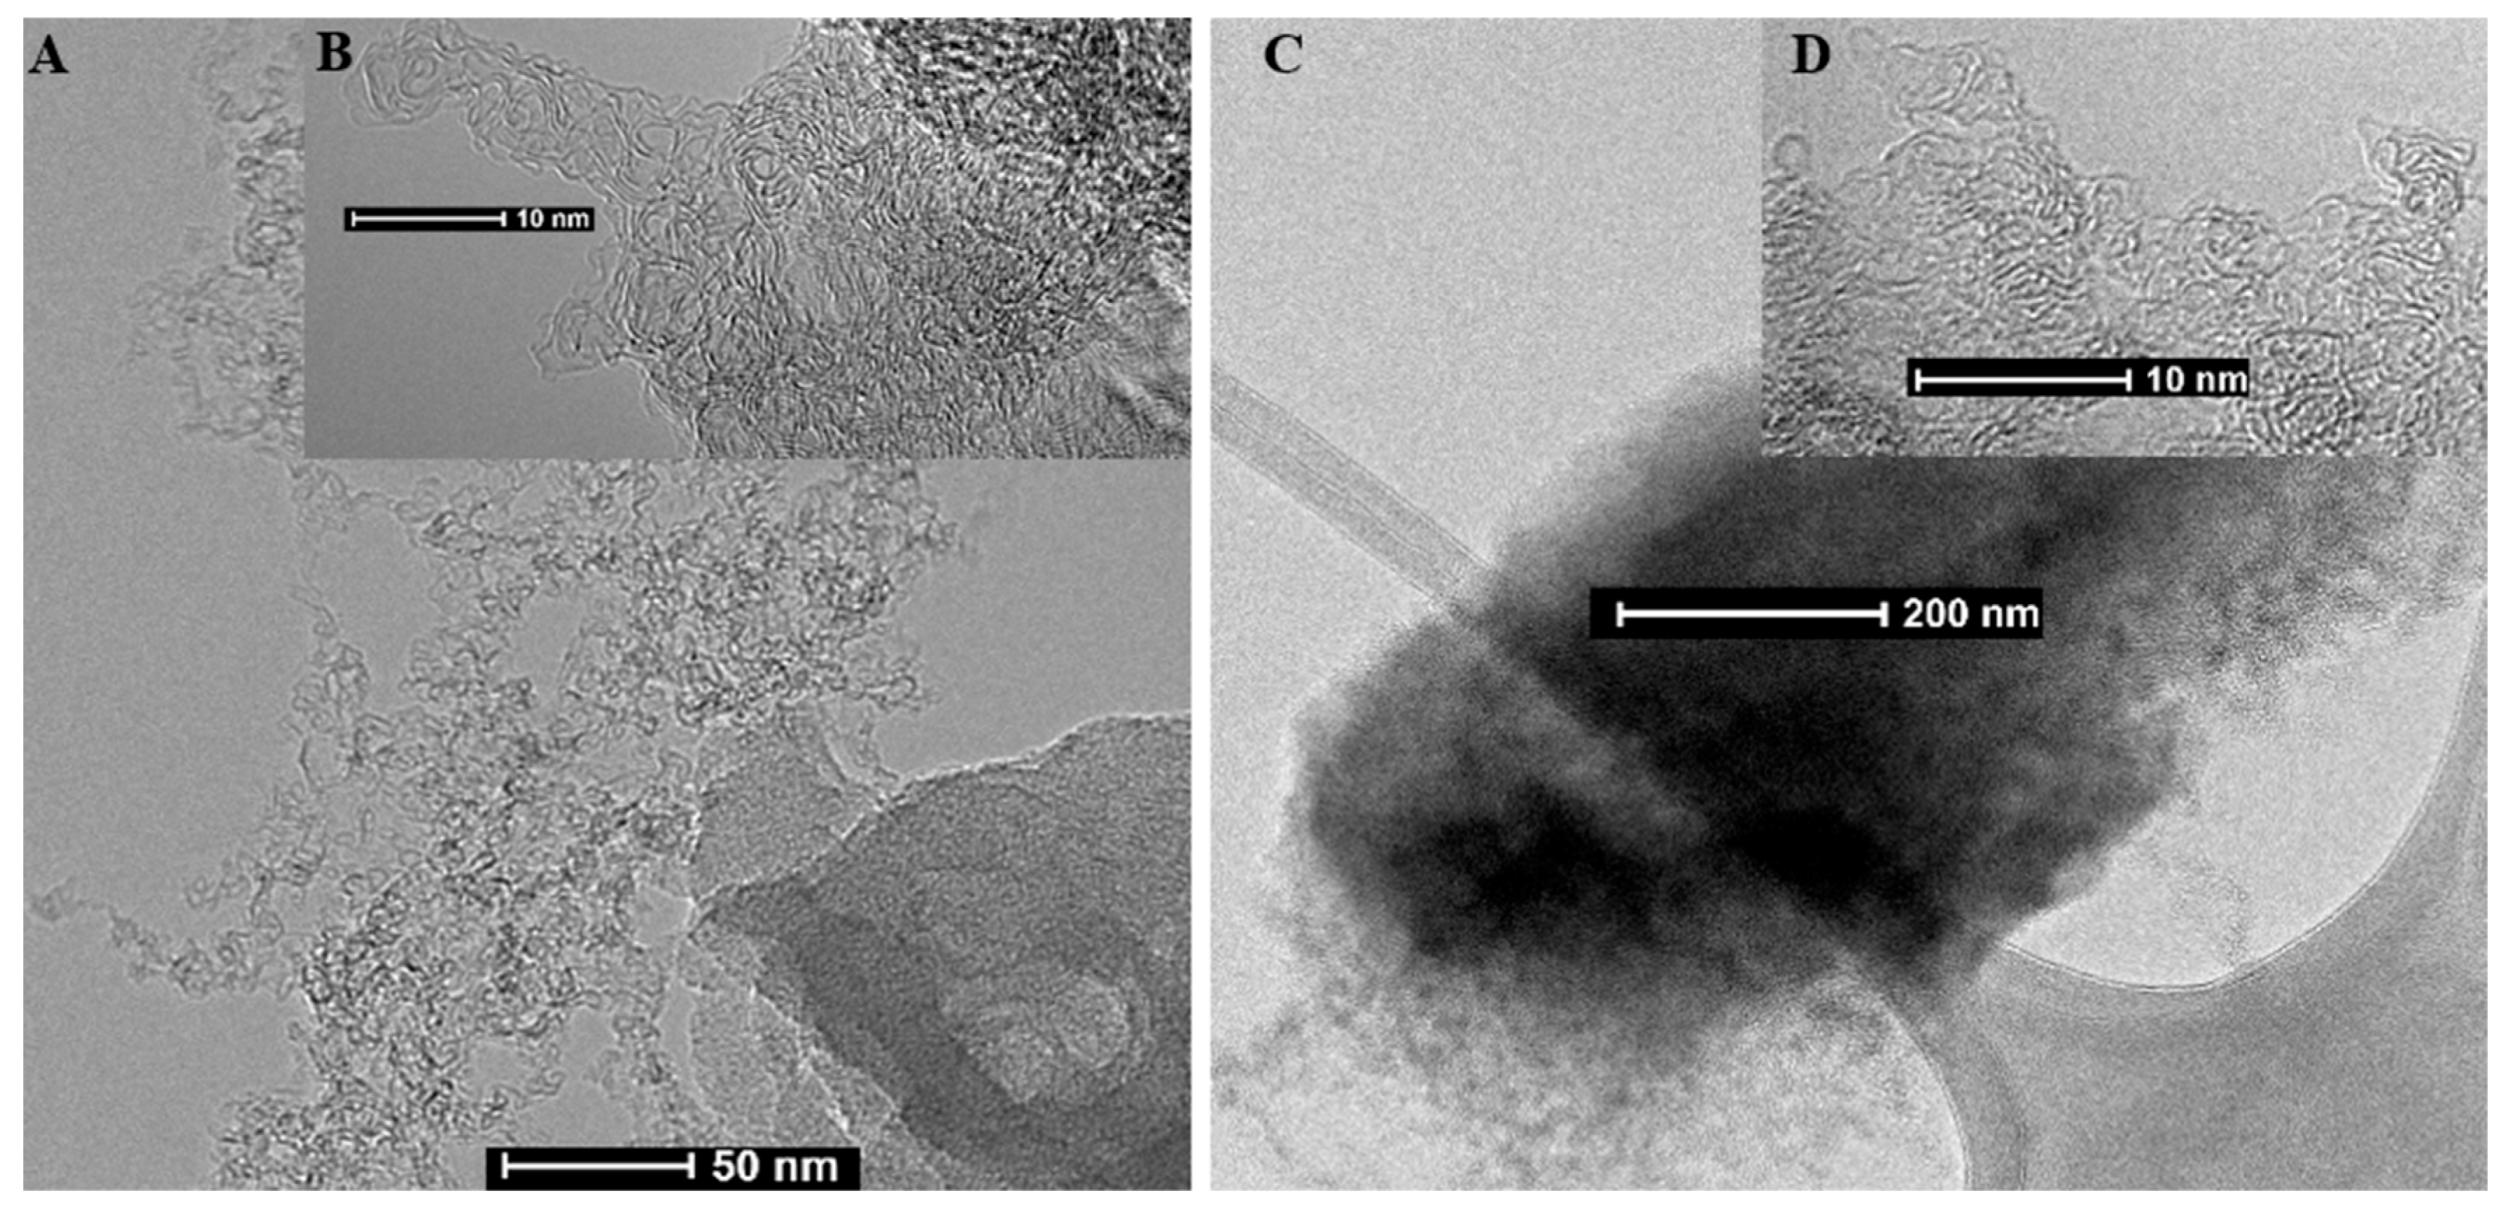
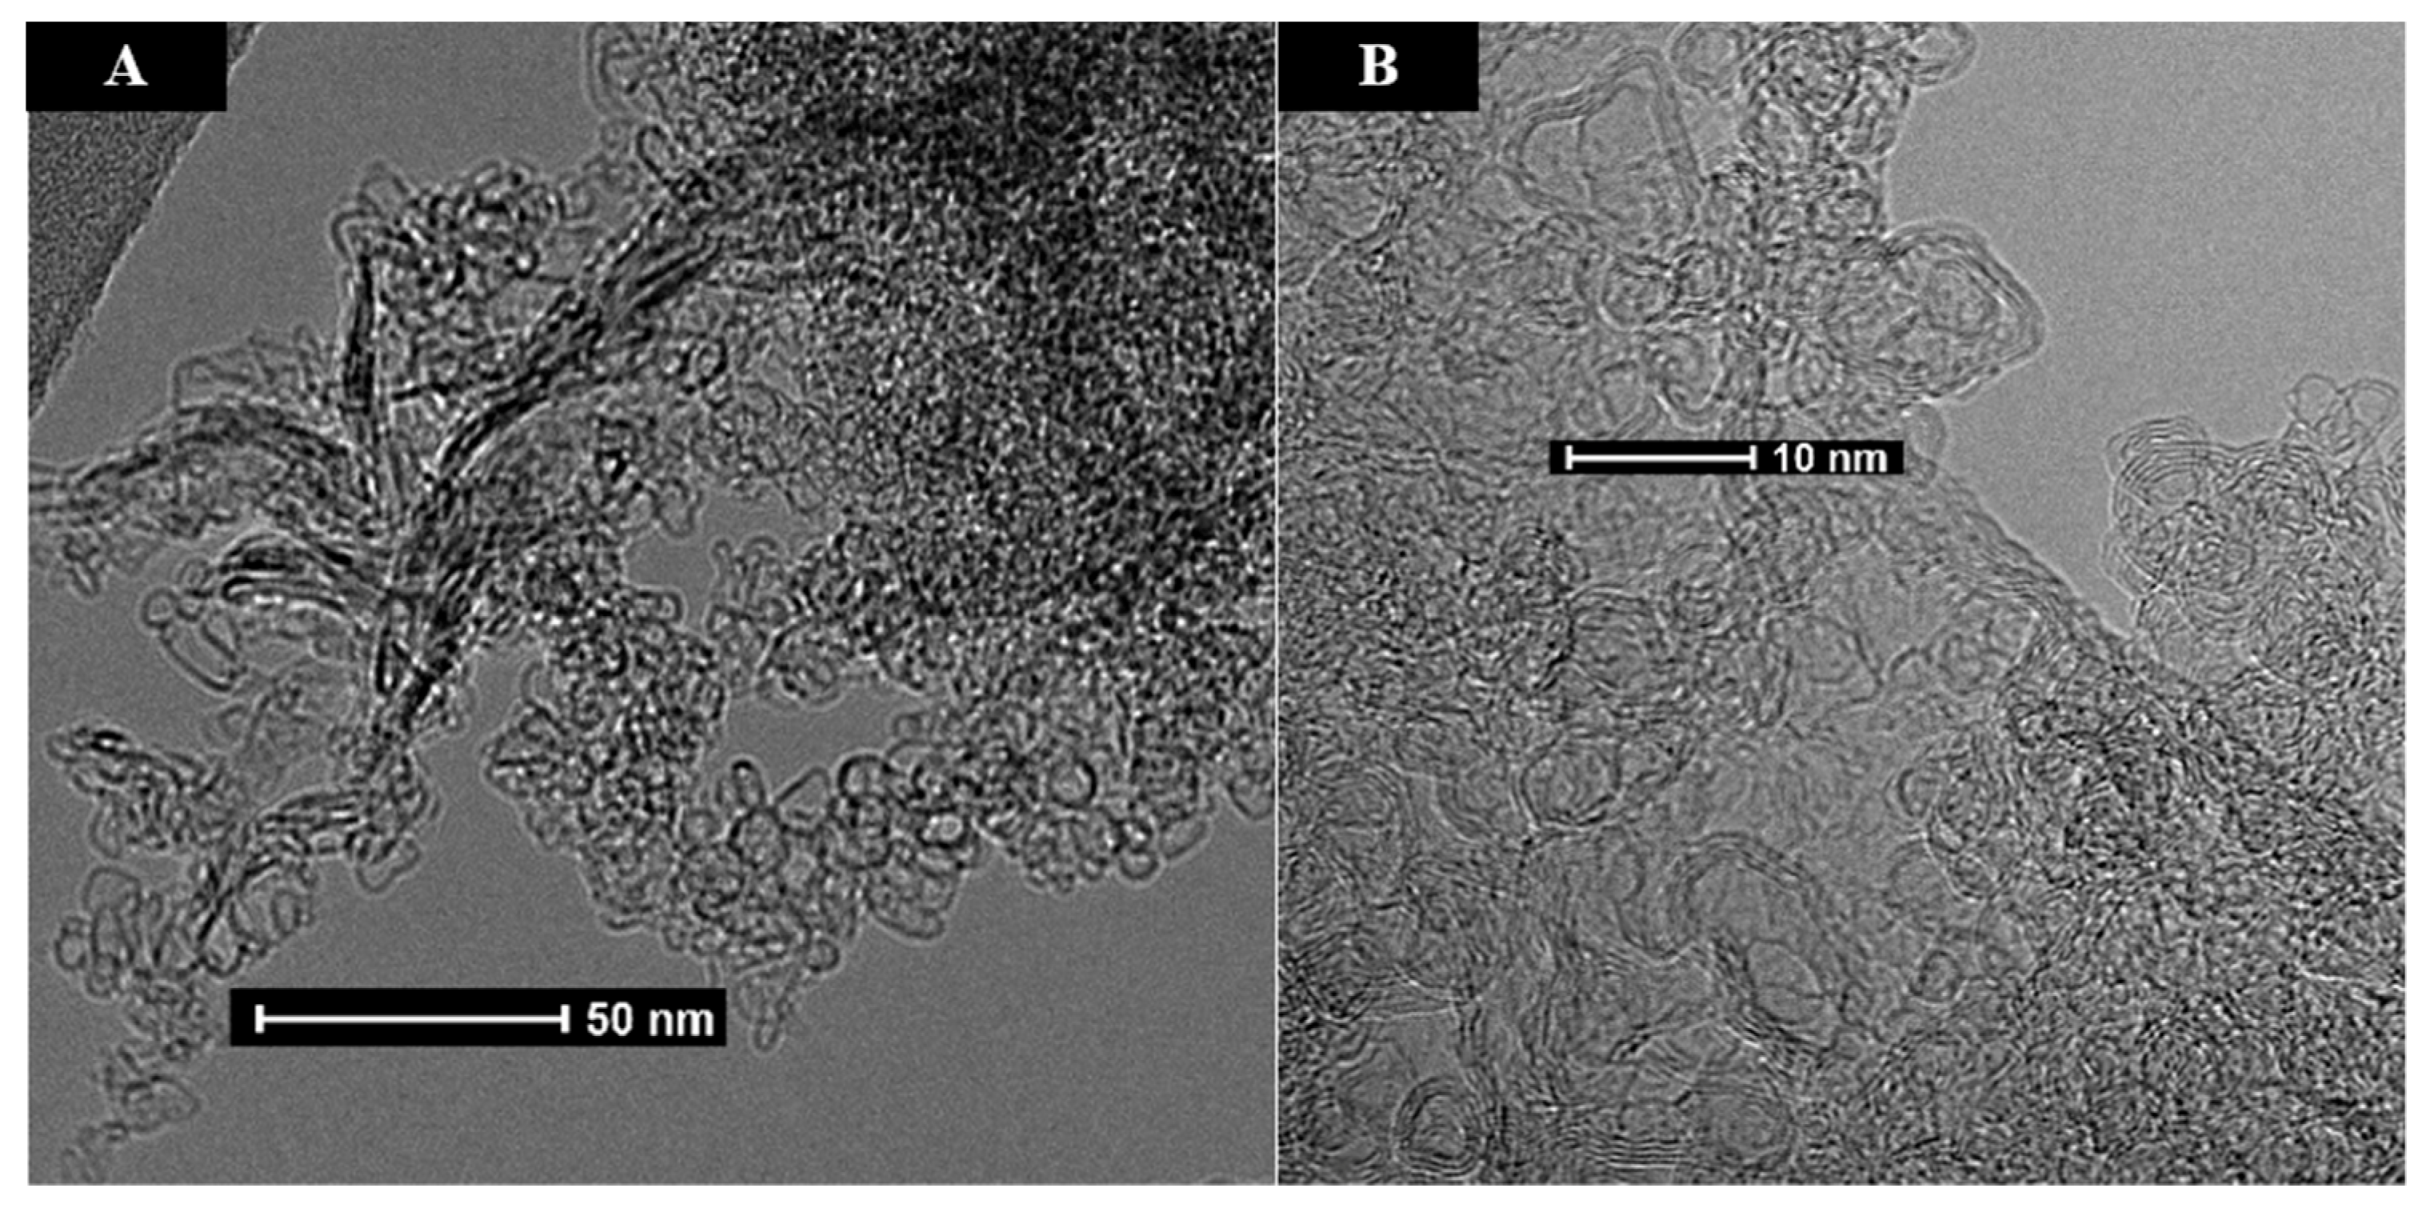
2.4.2. Transmission Electron Microscopy
2.4.3. Elemental Analysis
2.4.4. Electron Energy Loss Spectroscopy
2.5. ReaxFF Simulations
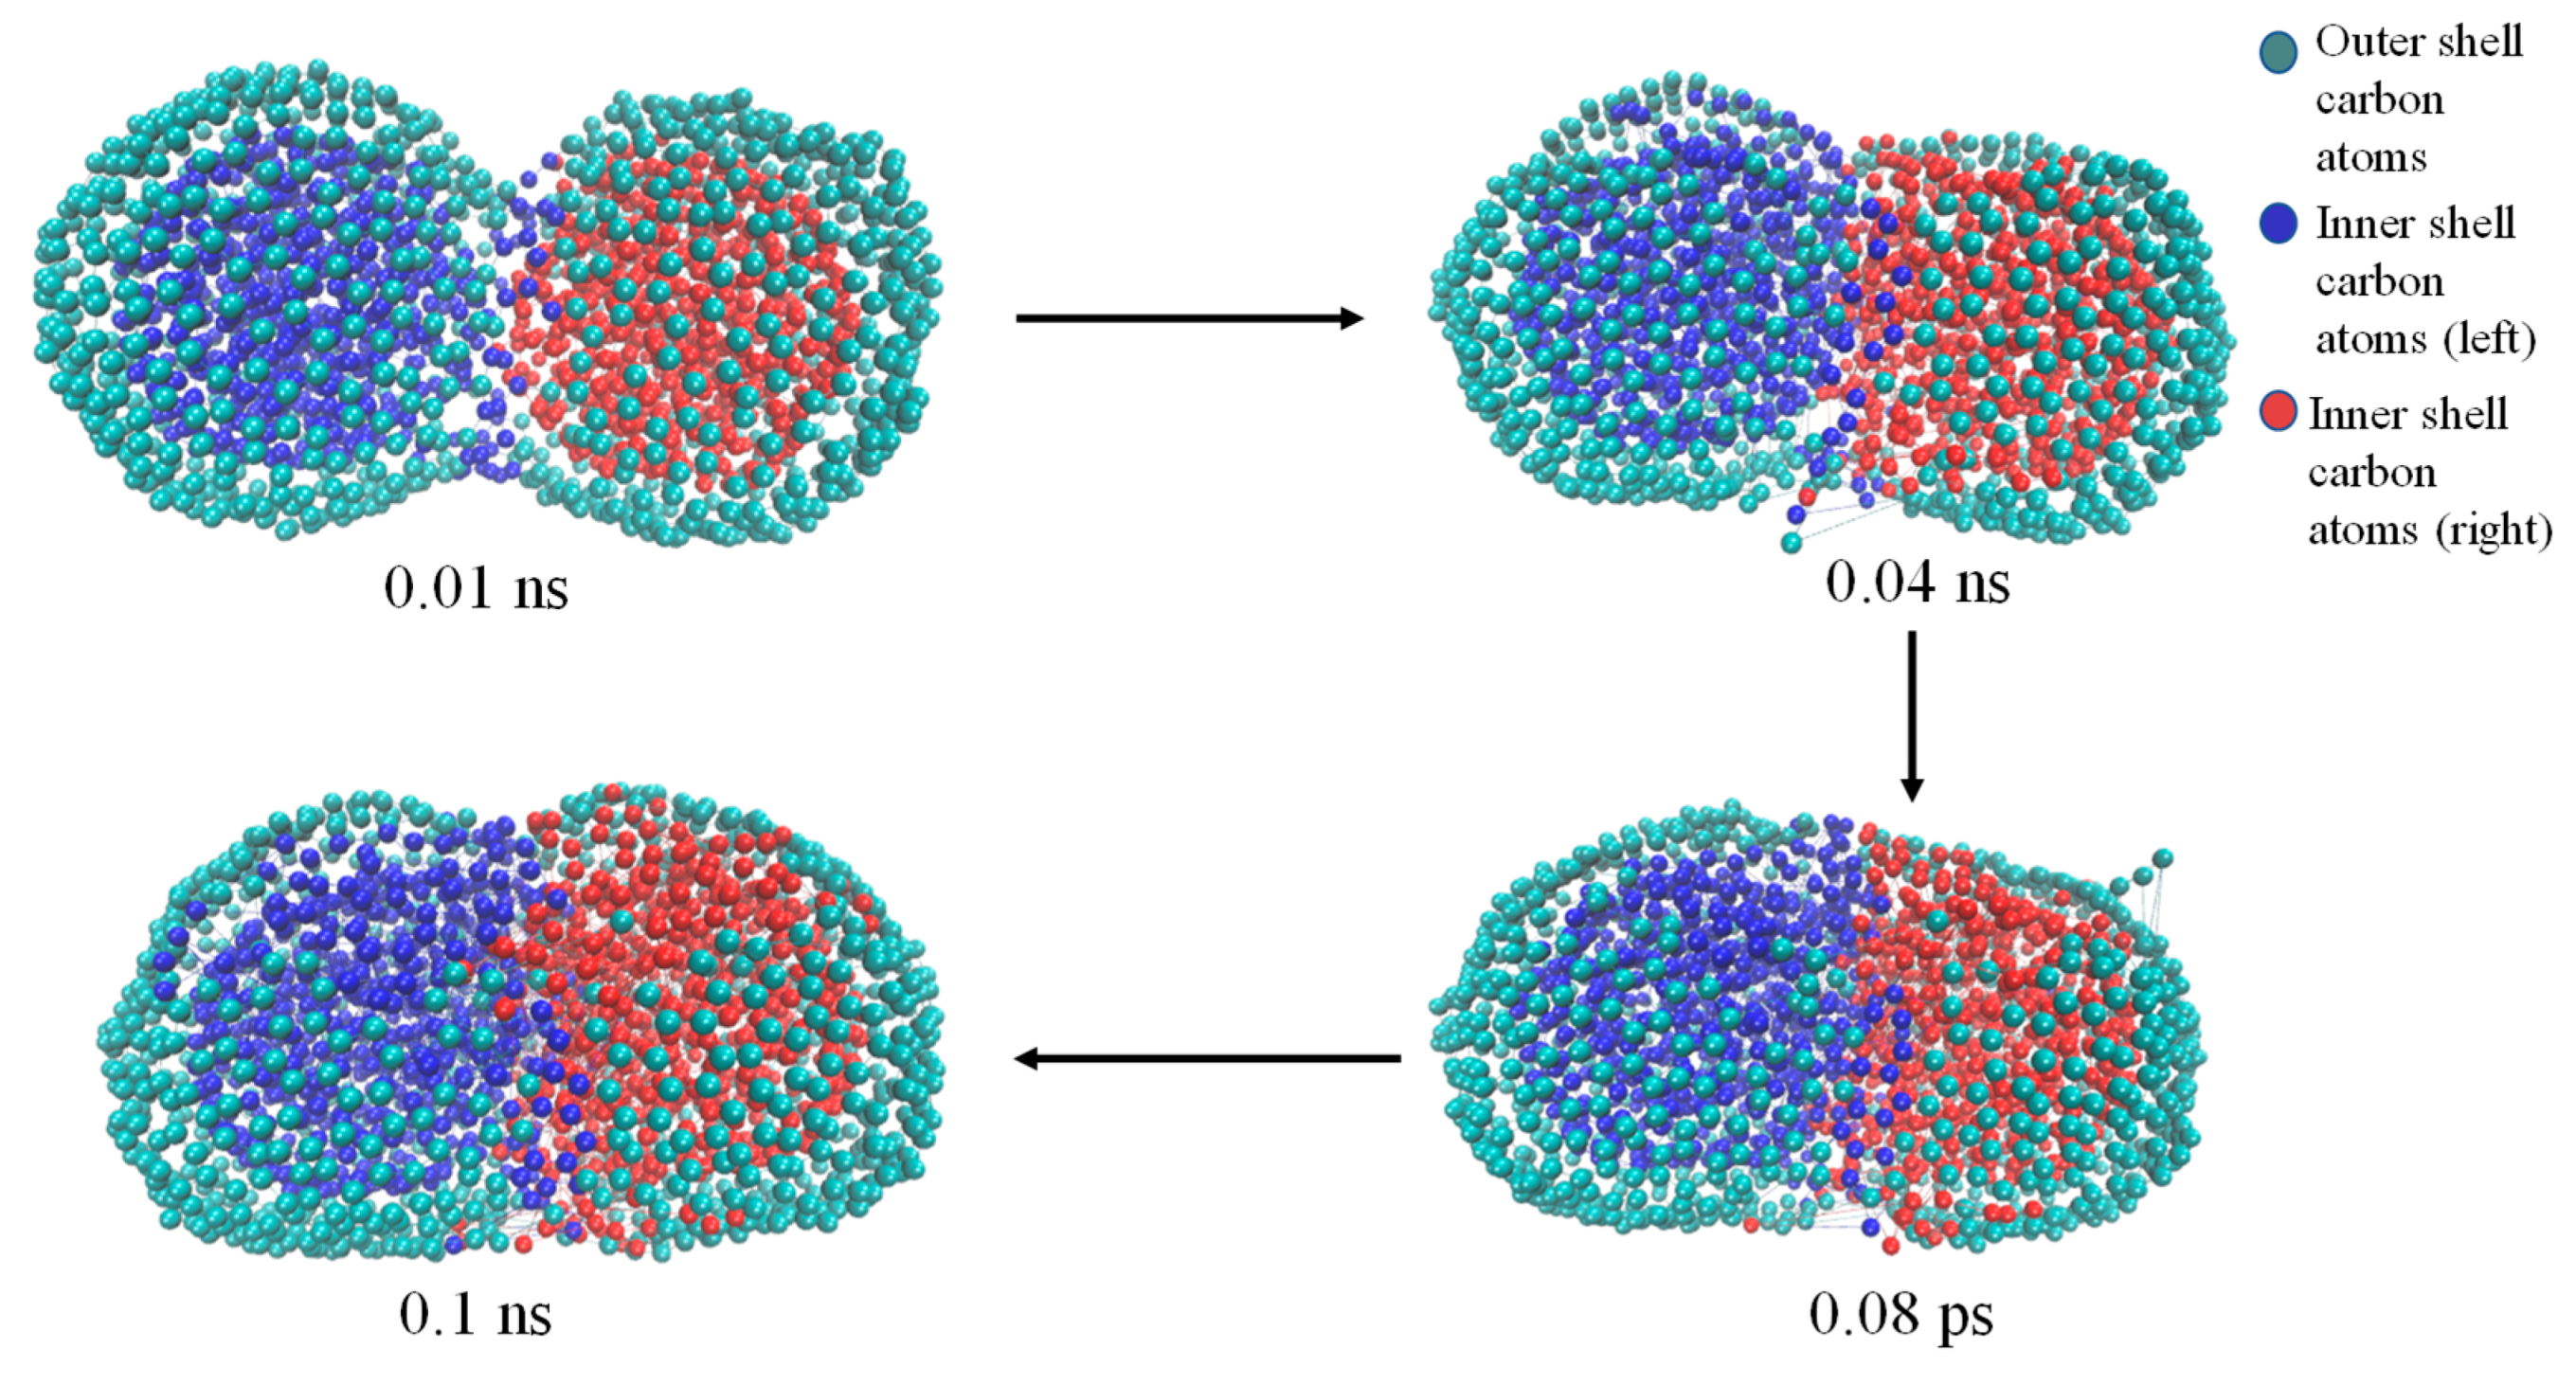
Simulation Methodology
3. Results and Discussion
3.1. Carbonization and Furnace Annealing
3.2. CO2 Laser Annealing
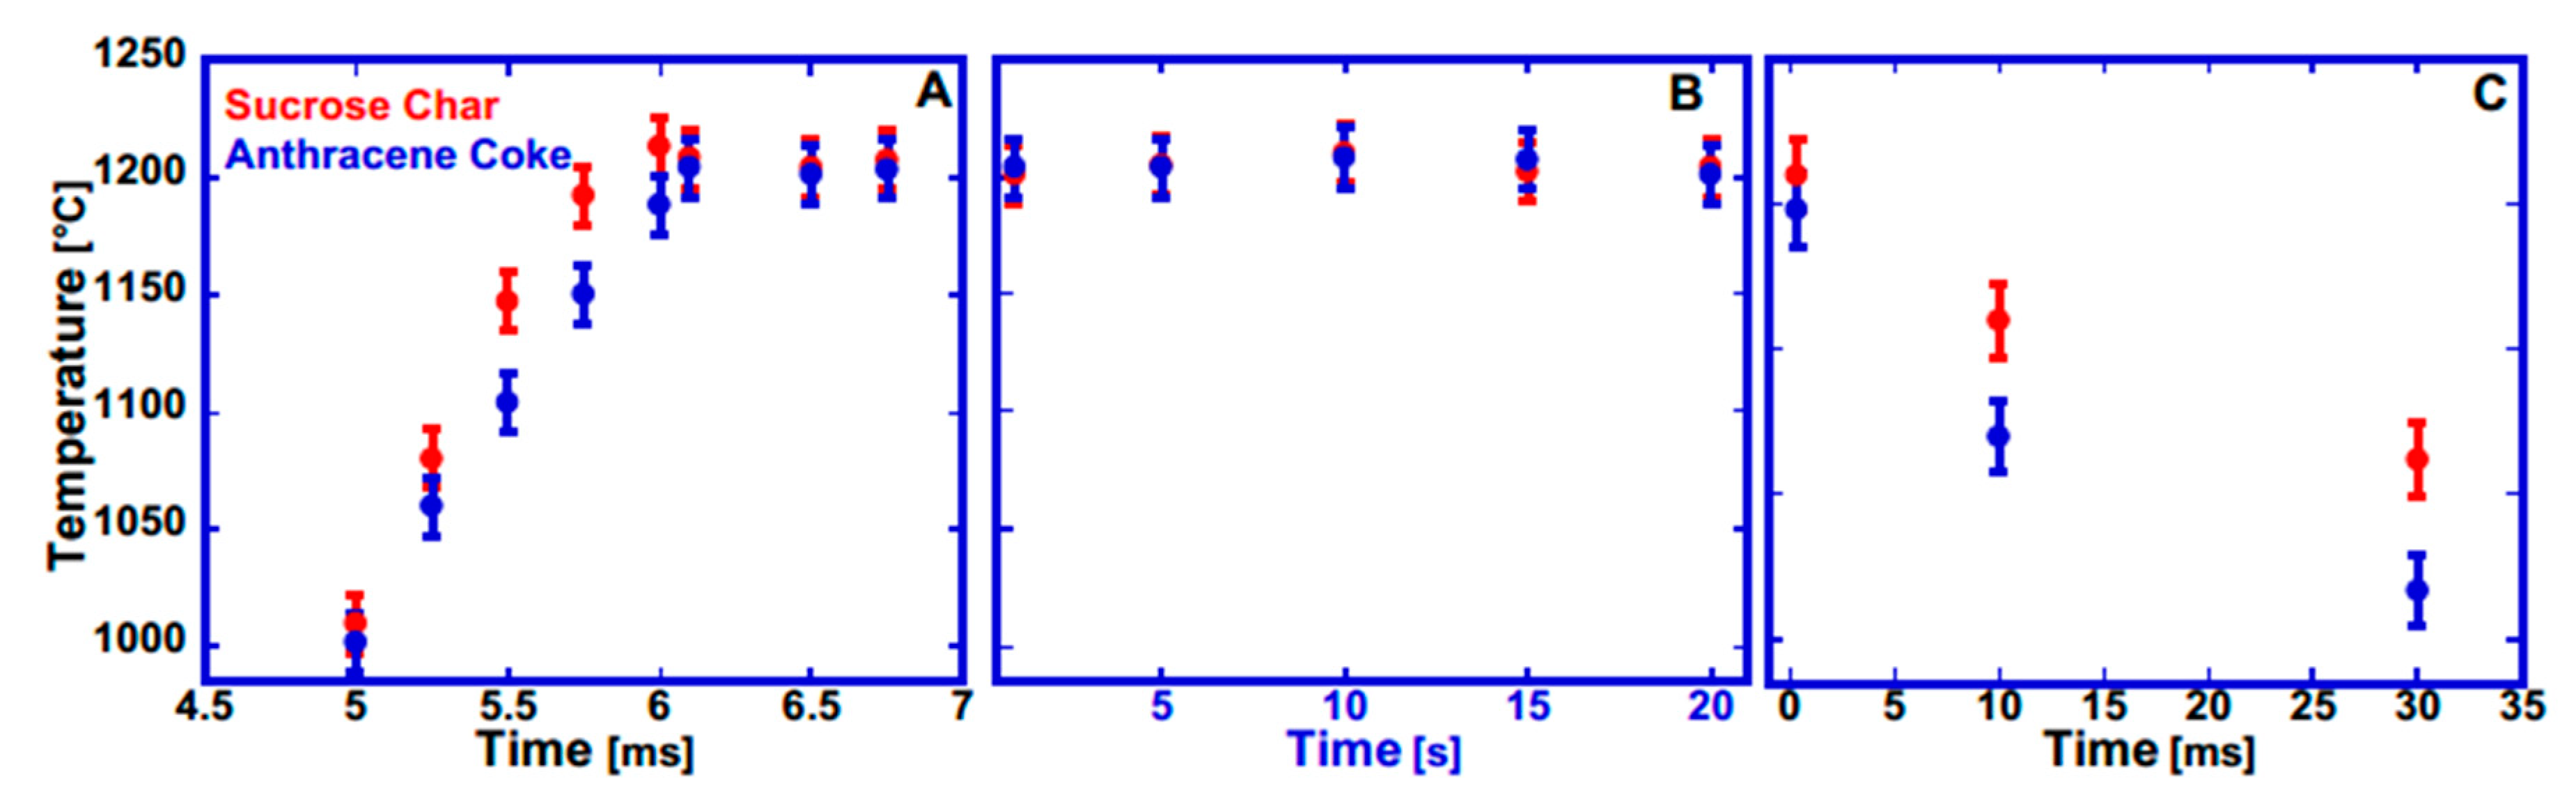
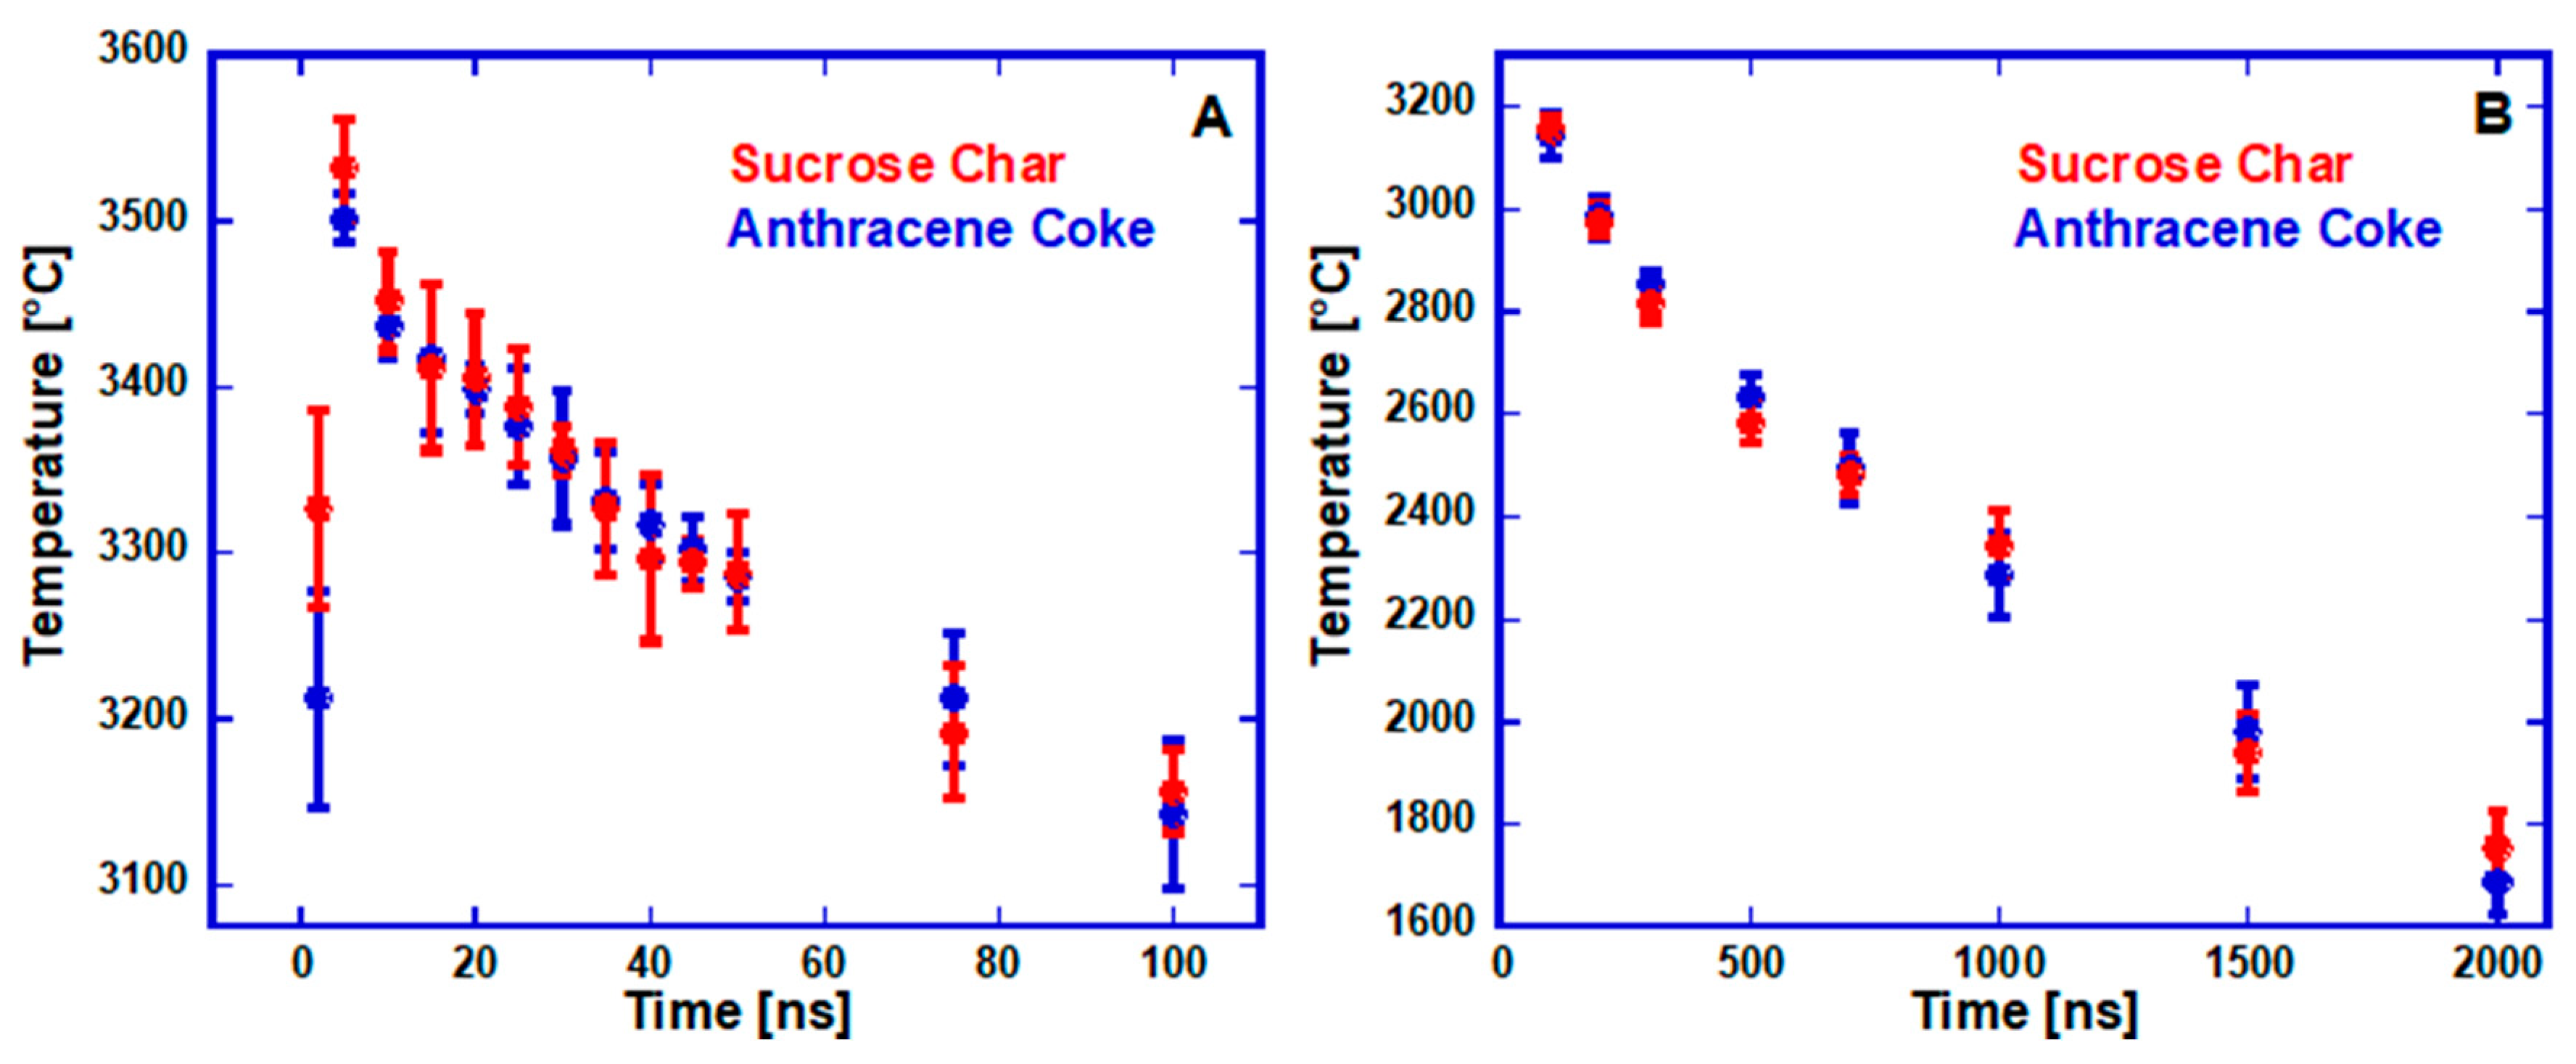
3.2.1. CO2 Laser Annealing—1200 °C
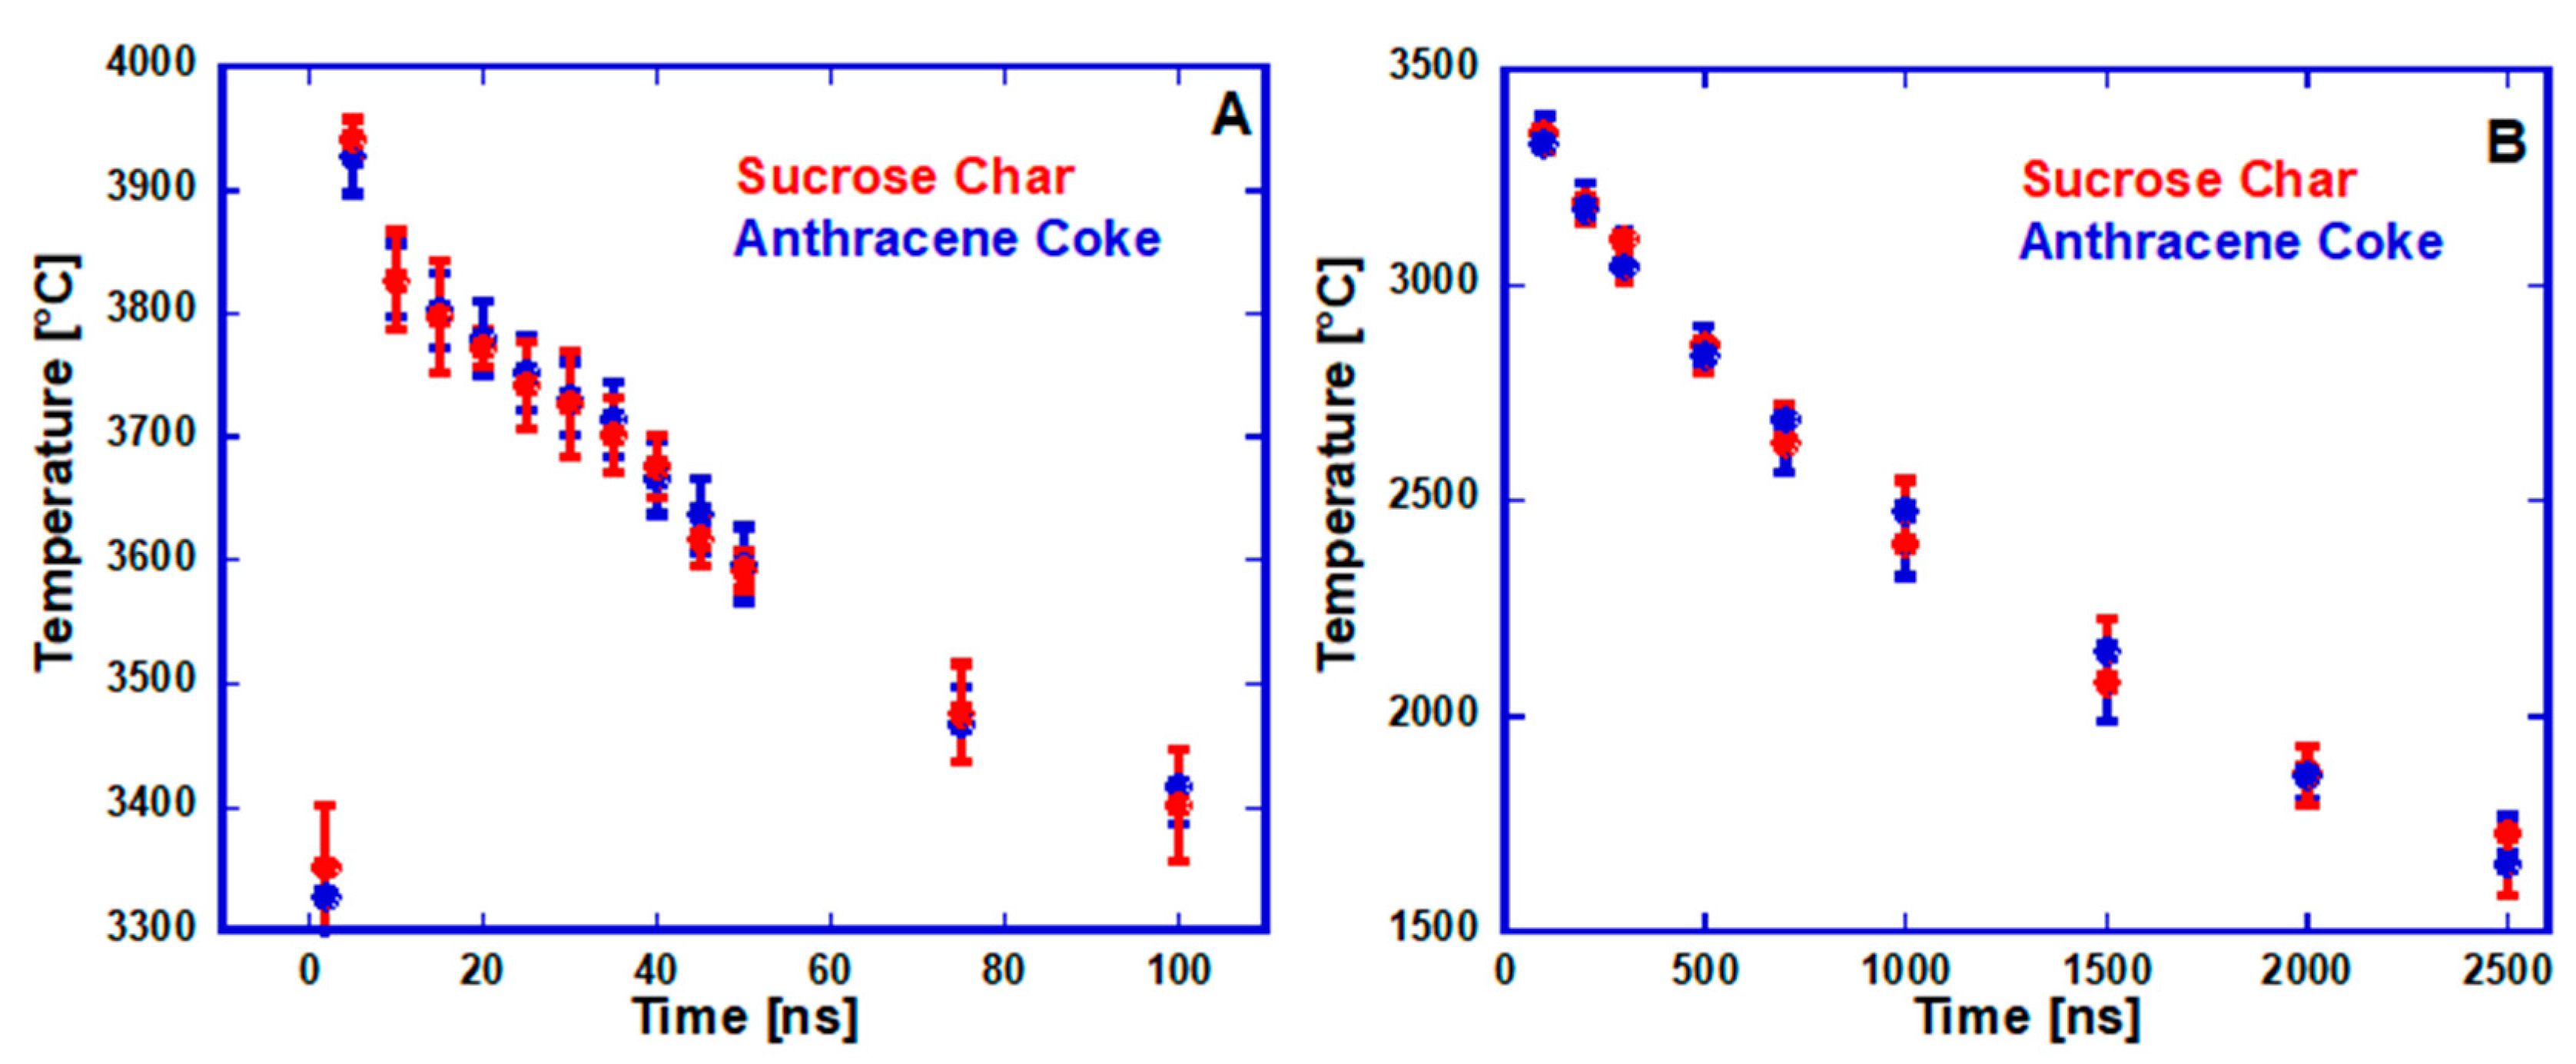
3.2.2. CO2 Laser Annealing—2600 °C
CO2 Laser Annealing of Anthracene Coke—2600 °C
CO2 Laser Annealing of Sucrose Char—2600 °C
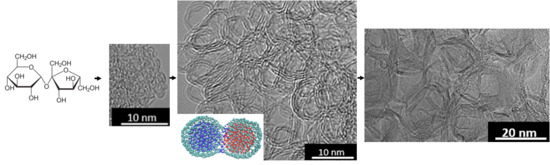
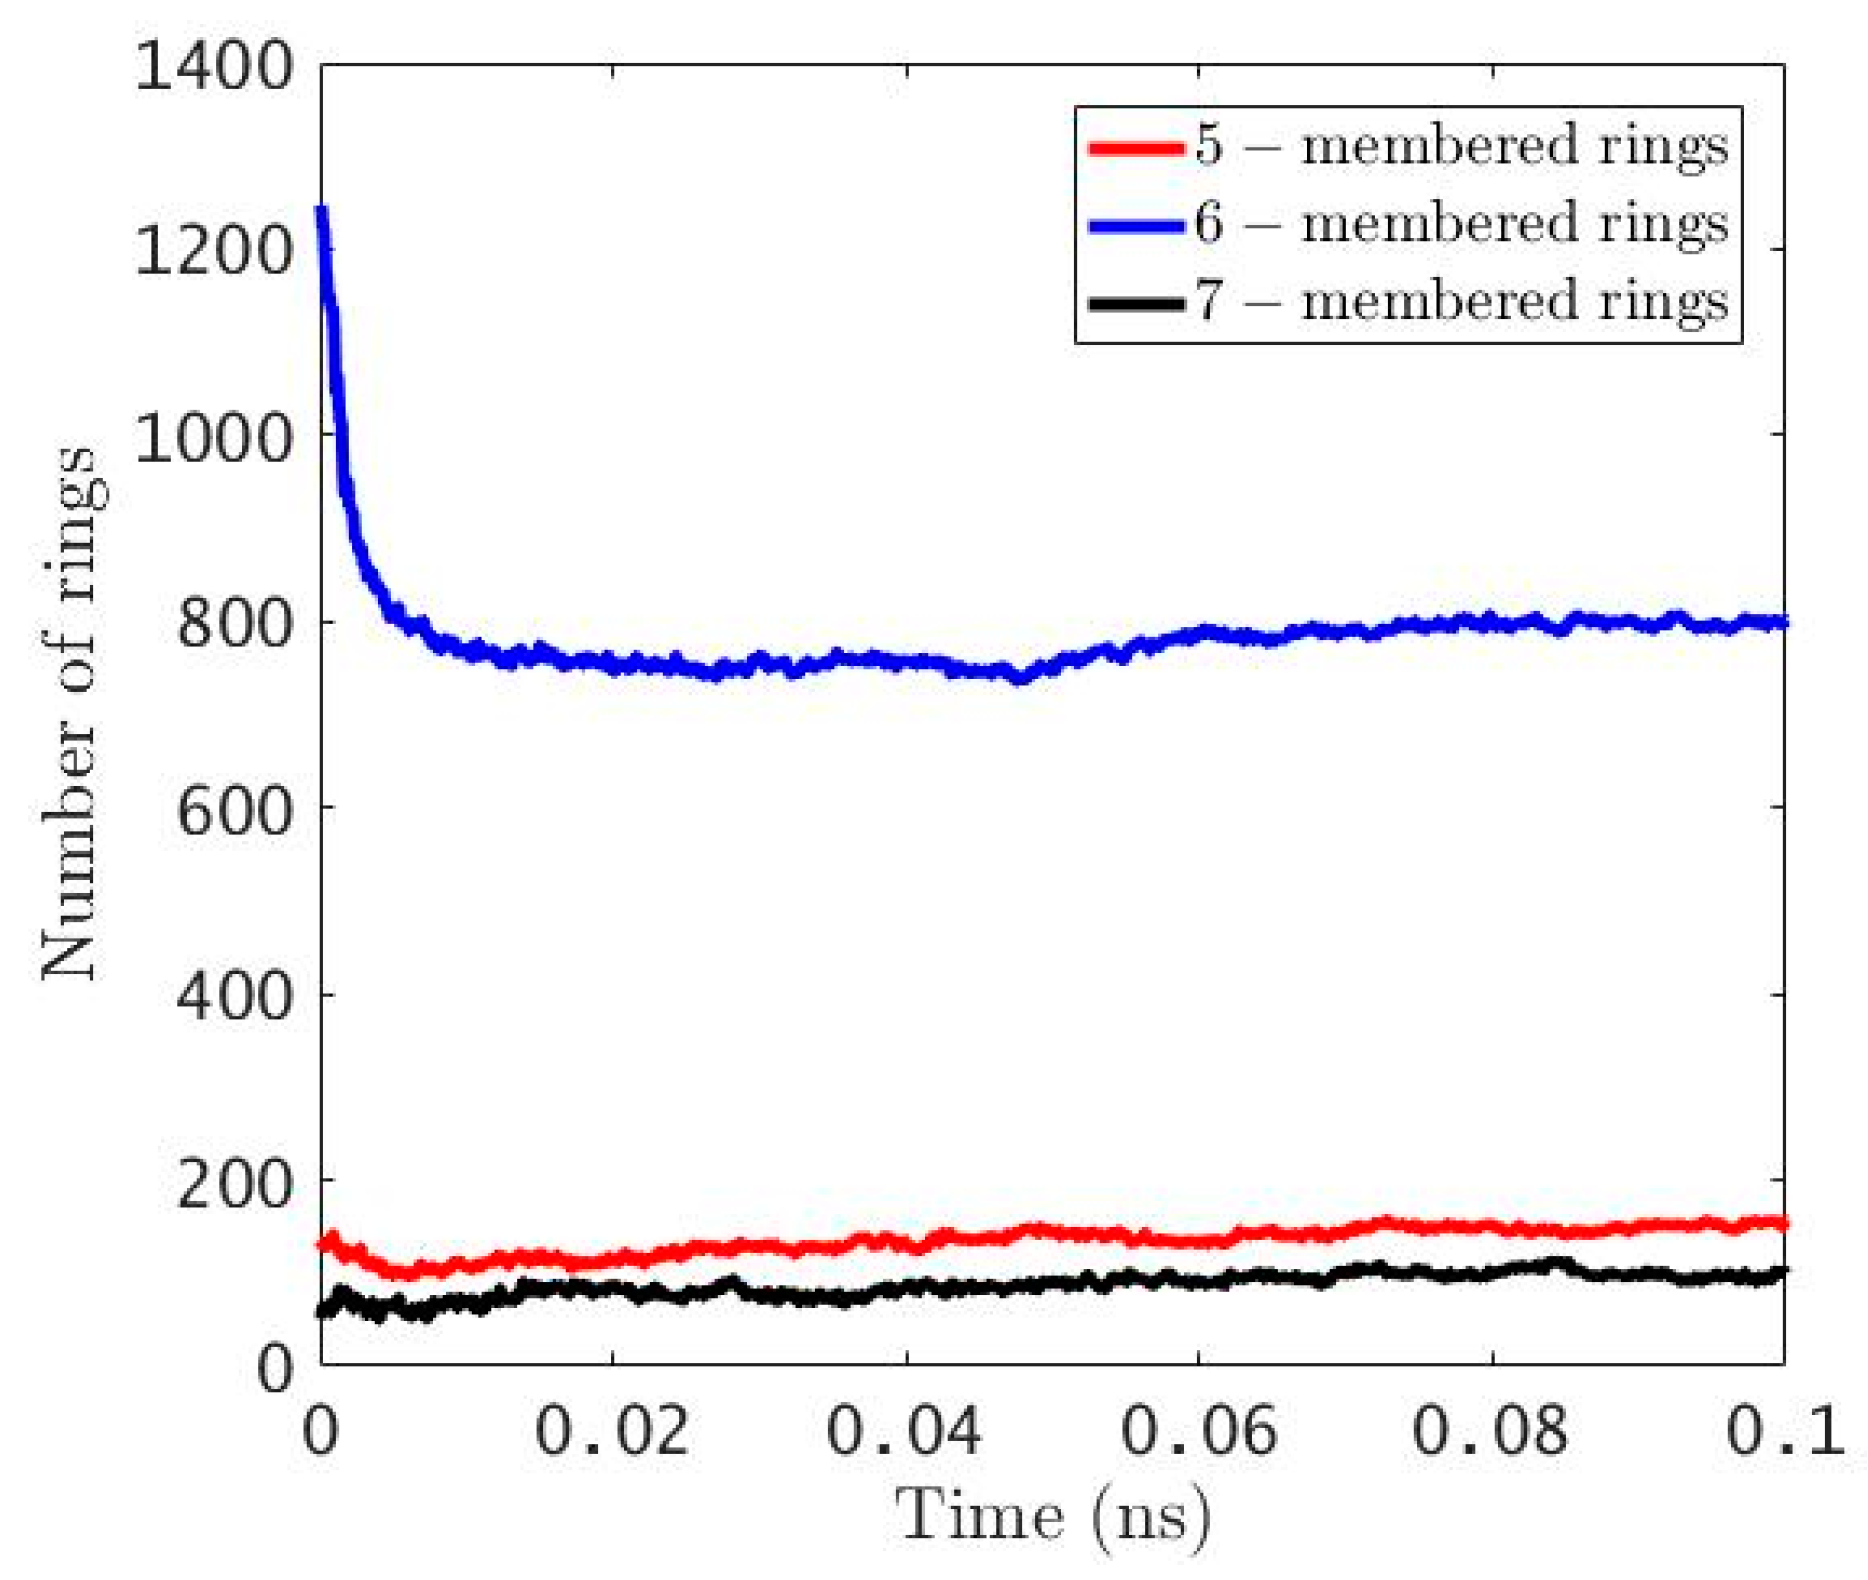
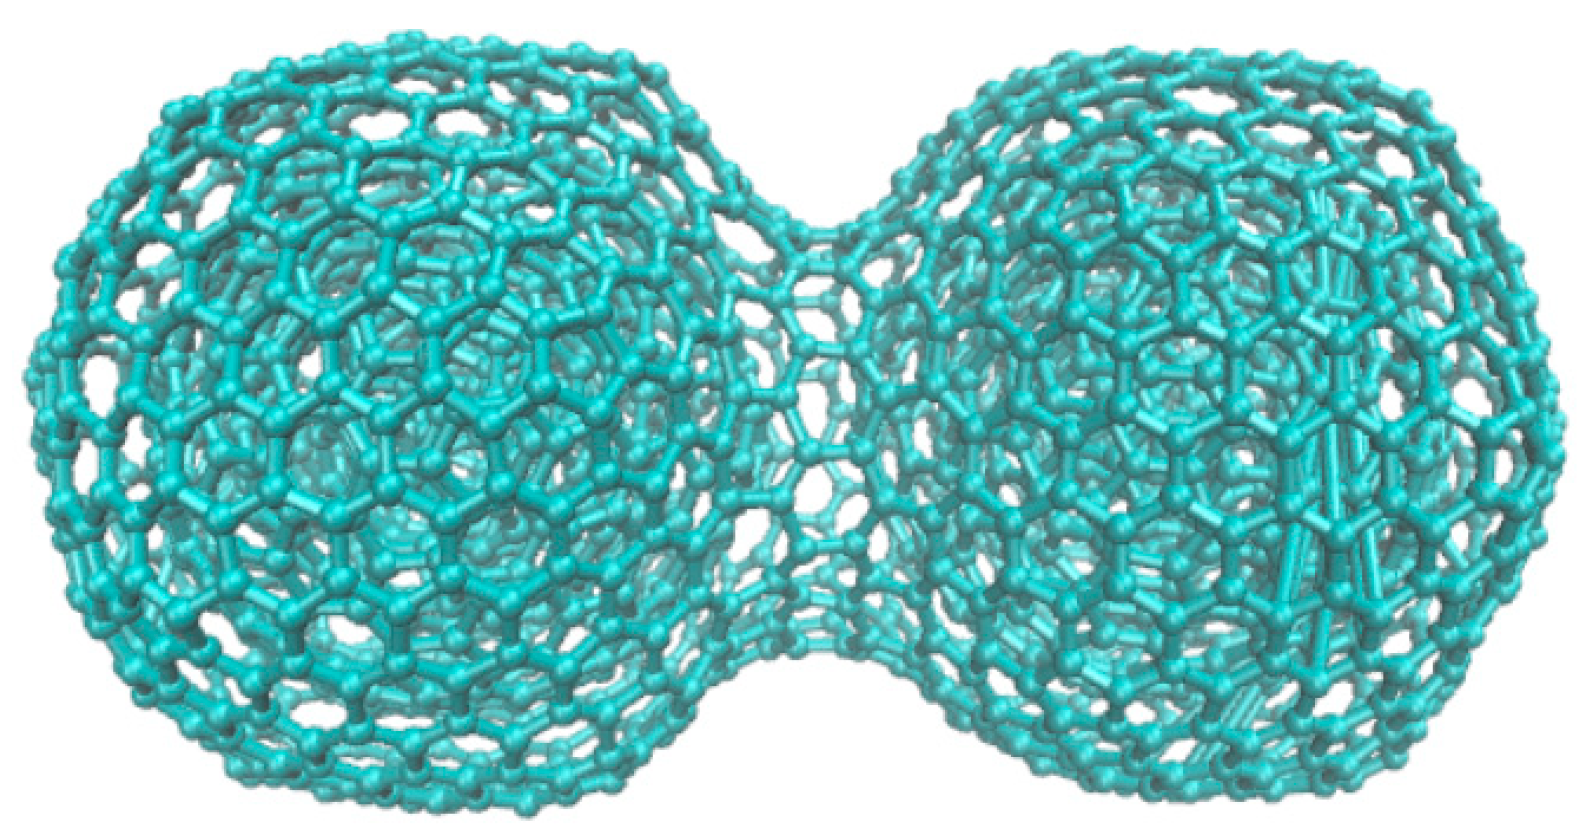
3.3. ReaxFF Atomistic Simulation of Sucrose Char Unfurling
4. Conclusions
Author Contributions
Funding
Conflicts of Interest
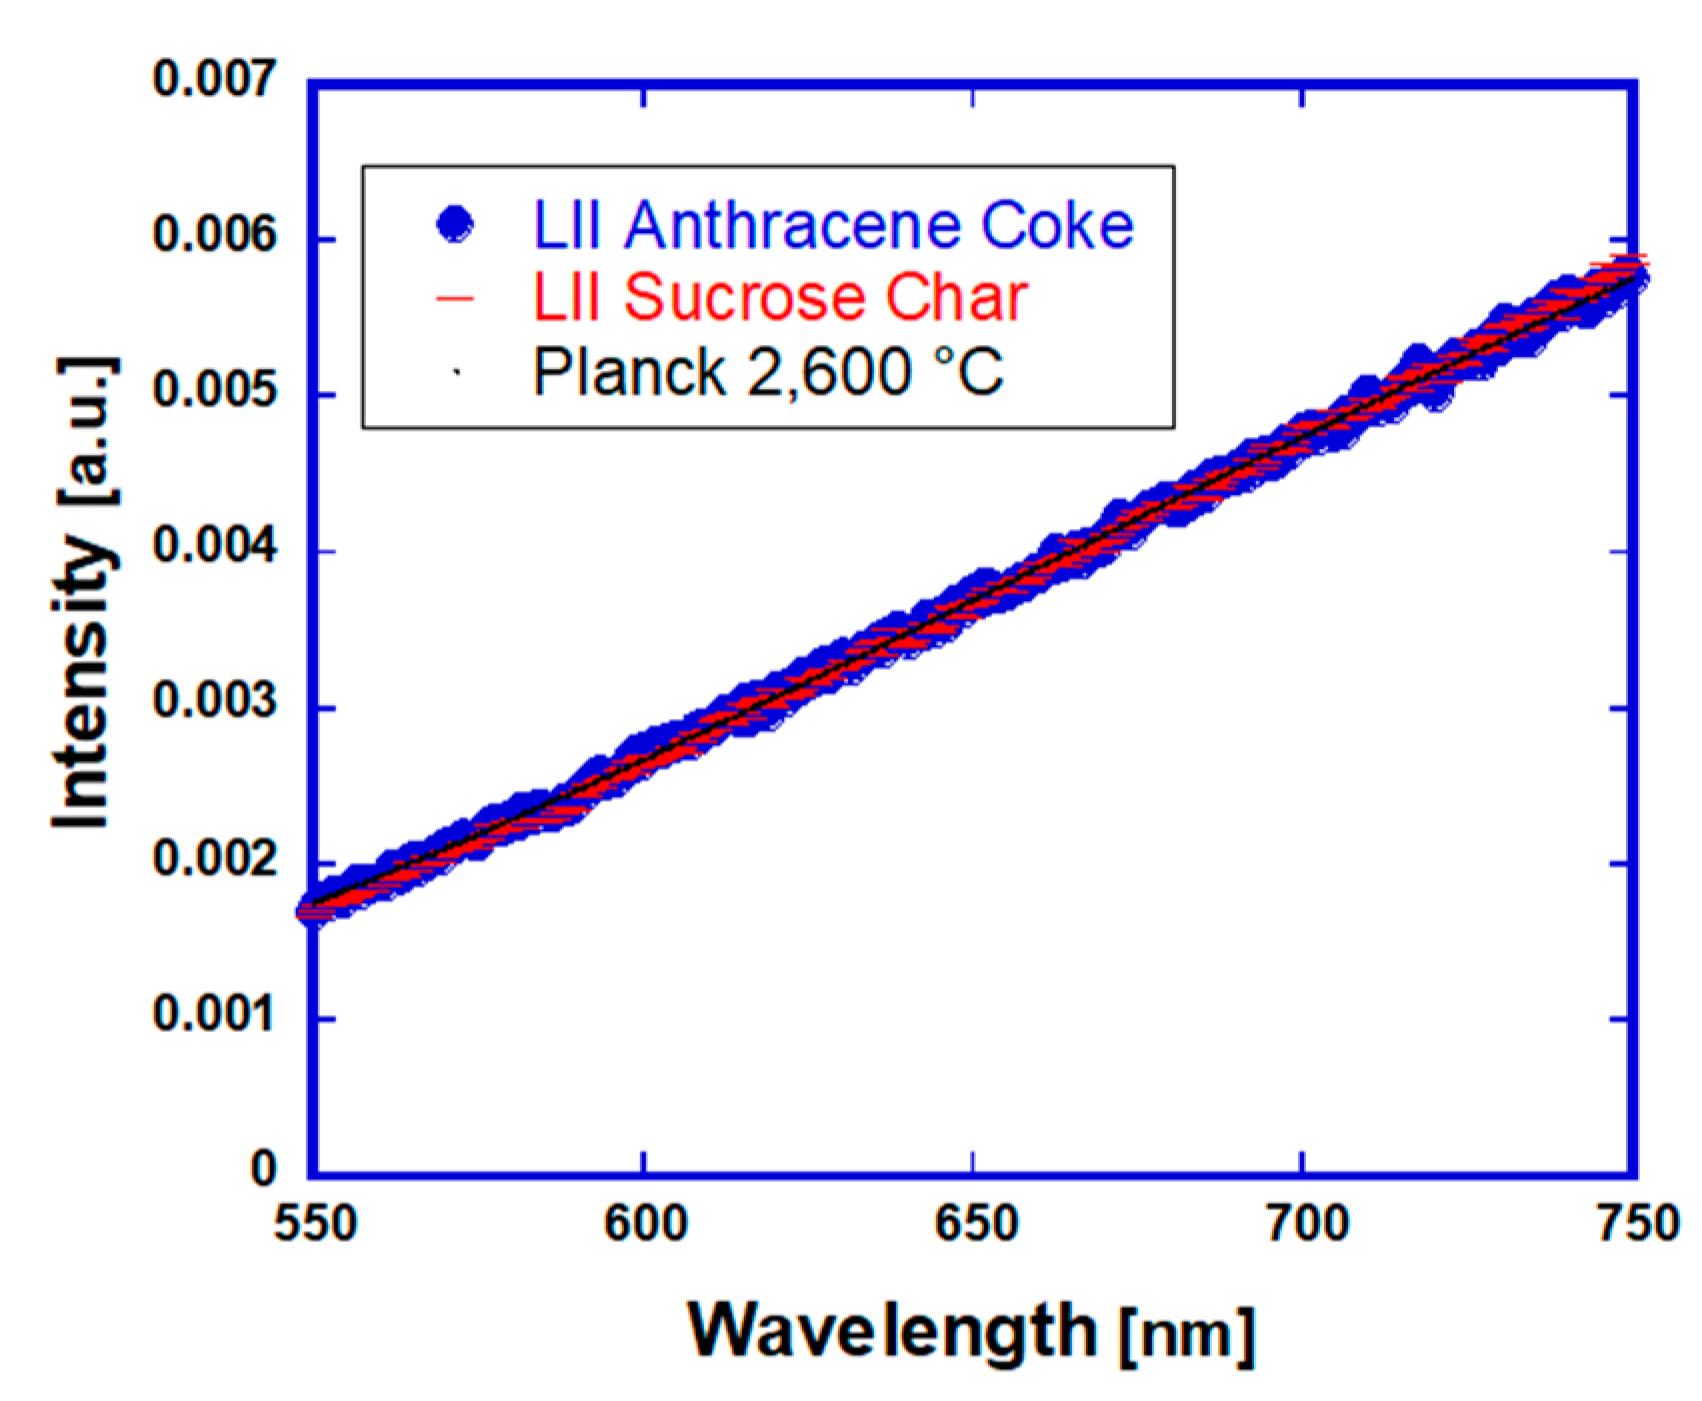
Appendix A. Multi-Wavelength Pyrometry

Appendix B. Anthracene Coke


Appendix C. Nd:YAG Laser Annealing


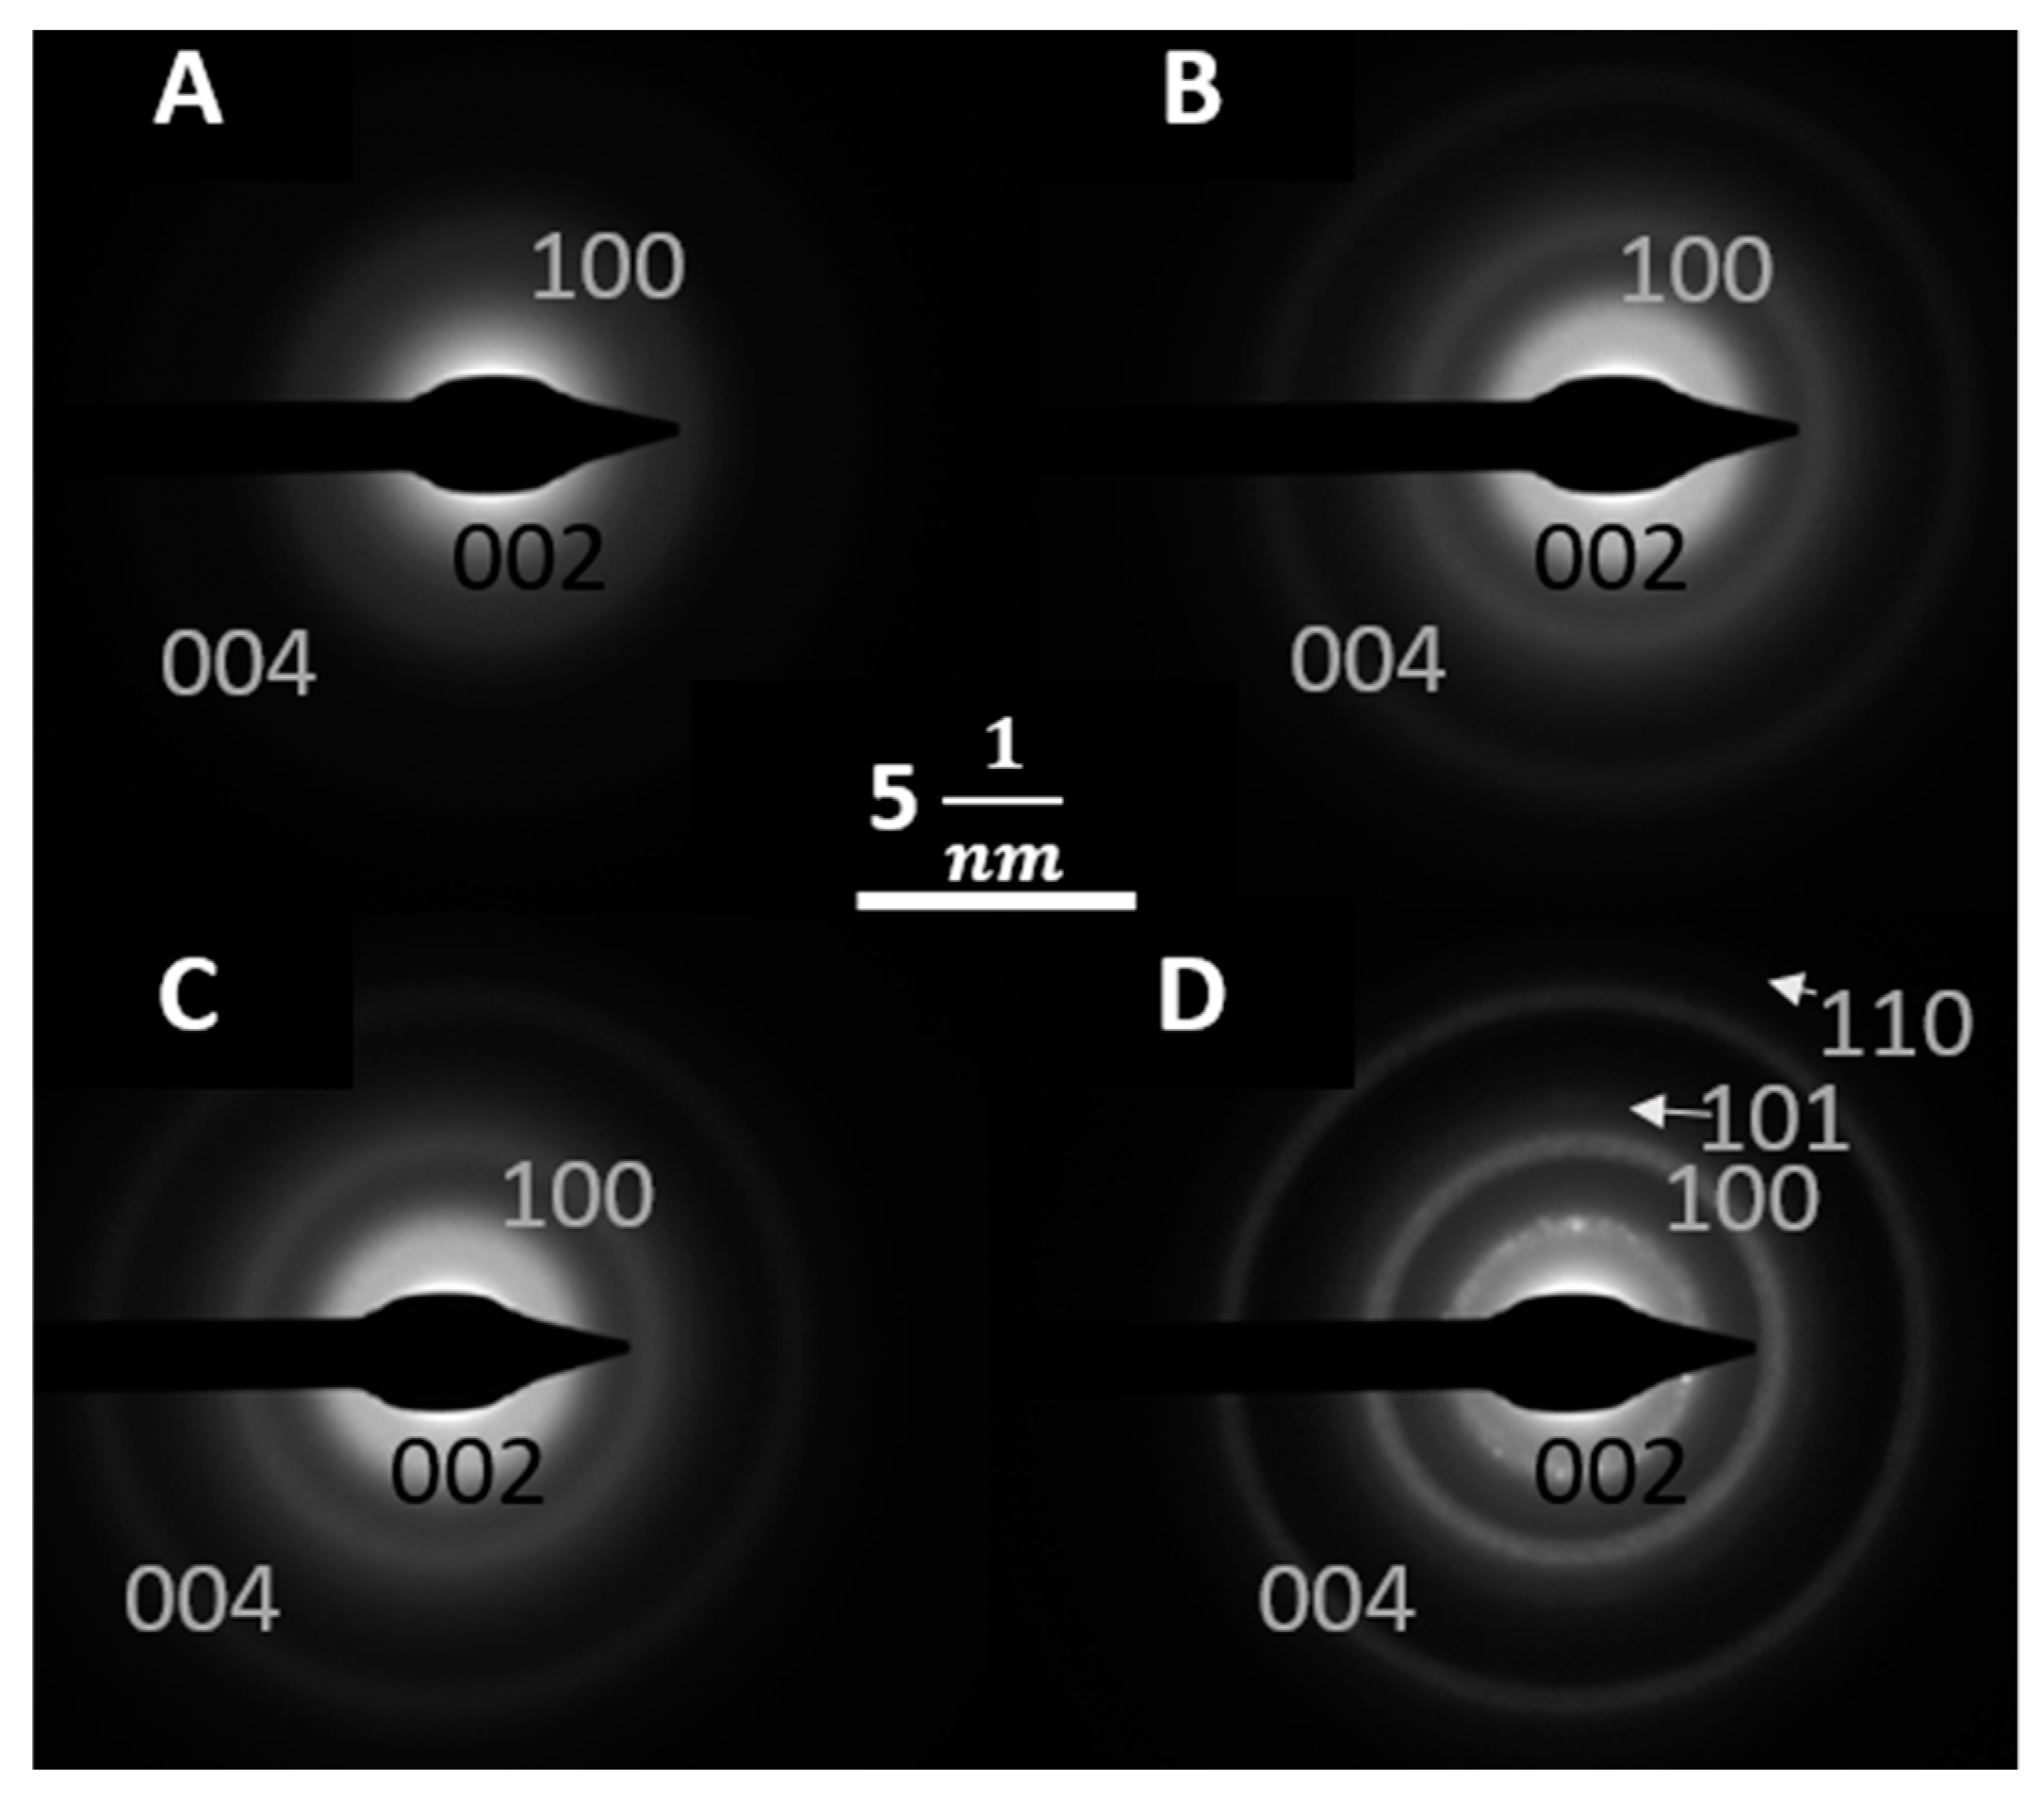
Appendix D. CO2 Laser Annealed Sucrose Char SAED Patterns

References
- Fair, F.V.; Collins, F.M. Effect of residence time on graphitization at several temperatures. In Proceedings of the Fifth Conference on Carbon; Pergamon Press: New York, NY, USA, 1961; pp. 503–508. [Google Scholar]
- Mizushima, S. Rate of graphitization of carbon. In Proceedings of the Fifth Conference on Carbon; Pergamon Press: New York, NY, USA, 1961; p. 439. ISBN 9780080097084. [Google Scholar]
- Fischbach, D.B. The kinetics and mechanism of graphitization. In Chemisty and Physics of Carbon; Walker, P.L., Ed.; Marcel Dekker, Inc.: New York, NY, USA, 1971; pp. 1–92. [Google Scholar]
- Emmerich, F.G. Evolution with heat treatment of crystallinity in carbons. Carbon 1995, 33, 1709–1715. [Google Scholar] [CrossRef]
- Murty, H.N.; Biederman, D.L.; Heintz, E.A. Kinetics of graphitization-I. Activation energies. Carbon 1969, 7, 667–681. [Google Scholar] [CrossRef]
- Fischbach, D.B. Kinetics of graphitization of a petroleum coke. Nature 1963, 200, 1281–1283. [Google Scholar] [CrossRef]
- Putman, K.J.; Sofianos, M.V.; Rowles, M.R.; Harris, P.J.F.; Buckley, C.E.; Marks, N.A.; Suarez-Martinez, I. Pulsed thermal treatment of carbon up to 3000 °C using an atomic absorption spectrometer. Carbon 2018, 135, 157–163. [Google Scholar] [CrossRef]
- Abrahamson, J.P.; Madhu, S.; Mathews, J.P.; Vander Wal, R.L. Pulsed laser annealing of carbon black. Carbon 2017, 124, 380–390. [Google Scholar] [CrossRef]
- Abrahamson, J.P.; Rajagopalan, R.; Vander Wal, R.L. Porous (swiss-cheese) graphite. C 2018, 4, 27. [Google Scholar] [CrossRef]
- Franklin, R.E. The interpretation of diffuse X-ray diagrams of carbon. Acta Crystallogr. 1950, 3, 107–121. [Google Scholar] [CrossRef] [Green Version]
- Franklin, R.E. Crystallite growth in graphitizing and non-graphitizing carbons. Proc. R. Soc. Lond. A Math. Phys. Eng. Sci. 1951, 209, 196–218. [Google Scholar] [CrossRef]
- Oberlin, A. Carbonization and graphitization. Carbon 1984, 22, 521–541. [Google Scholar] [CrossRef]
- Marsh, H.; Crawford, D. Structure in graphitizable carbon from coal-tar pitch HTT 750–1148 K. Studied using high resolution electron microscopy. Carbon 1984, 22, 413–422. [Google Scholar] [CrossRef]
- Kinney, C.R.; Nunn, R.C.; Walker, P.L. Carbonization of anthracene and graphitization of anthracene carbons. Ind. Eng. Chem. 1957, 49, 880–884. [Google Scholar] [CrossRef]
- Abrahamson, J.P.; Jain, A.; van Duin, A.C.T.; Vander Wal, R.L. Carbon structure and resulting graphitizability upon oxygen evolution. Carbon 2018, 135, 171–179. [Google Scholar] [CrossRef]
- Van Duin, A.C.T.; Dasgupta, S.; Lorant, F.; Goddard, W.A. ReaxFF: A reactive force field for hydrocarbons. J. Phys. Chem. A 2001, 105, 9396–9409. [Google Scholar] [CrossRef]
- Brenner, D.W. Empirical potential for hydrocarbons for use in simulating the chemical vapor deposition of diamond films. Phys. Rev. B 1990, 42, 9458–9471. [Google Scholar] [CrossRef]
- Chenoweth, K.; van Duin, A.C.T.; Goddard, W.A. ReaxFF reactive force field for molecular dynamics simulations of hydrocarbon oxidation. J. Phys. Chem. A 2008, 112, 1040–1053. [Google Scholar] [CrossRef] [PubMed]
- Wang, Q.D.; Wang, J.B.; Li, J.Q.; Tan, N.X.; Li, X.Y. Reactive molecular dynamics simulation and chemical kinetic modeling of pyrolysis and combustion of n-dodecane. Combust. Flame 2011, 158, 217–226. [Google Scholar] [CrossRef]
- Castro-Marcano, F.; Kamat, A.M.; Russo, M.F.; van Duin, A.C.T.; Mathews, J.P. Combustion of an Illinois No. 6 coal char simulated using an atomistic char representation and the ReaxFF reactive force field. Combust. Flame 2012, 159, 1272–1285. [Google Scholar] [CrossRef]
- Liu, L.; Bai, C.; Sun, H.; Goddard, W.A. Mechanism and kinetics for the initial steps of pyrolysis and combustion of 1,6-dicyclopropane-2,4-hexyne from ReaxFF reactive dynamics. J. Phys. Chem. A 2011, 115, 4941–4950. [Google Scholar] [CrossRef] [PubMed]
- Berendsen, H.J.C.; Postma, J.P.M.; Van Gunsteren, W.F.; Dinola, A.; Haak, J.R. Molecular dynamics with coupling to an external bath. J. Chem. Phys. 1984, 81, 3684–3690. [Google Scholar] [CrossRef]
- Ashraf, C.; van Duin, A.C.T. Extension of the ReaxFF combustion force field toward syngas combustion and initial oxidation kinetics. J. Phys. Chem. A 2017, 121, 1051–1068. [Google Scholar] [CrossRef] [PubMed]
- Harris, P.J.F. New perspectives on the structure of graphitic carbons. Crit. Rev. Solid State Mater. Sci. 2005, 30, 235–253. [Google Scholar] [CrossRef]
- Harris, P.J.F.; Tsang, S.C. High-resolution electron microscopy studies of non-graphitizing carbons. Philos. Mag. A Phys. Condens. Matter Struct. Defects Mech. Prop. 1997, 76, 667–677. [Google Scholar] [CrossRef] [Green Version]
- Harris, P.J.F. Impact of fullerenes on carbon science. In Chemistry and Physics of Carbon; Radovic, L.R., Ed.; Marcel Dekker, Inc.: New York, NY, USA, 2003; pp. 1–36. [Google Scholar]
- Harris, P.J.F. Fullerene-related structure of commercial glassy carbons. Philos. Mag. 2004, 84, 3159–3167. [Google Scholar] [CrossRef] [Green Version]
- Harris, P.J.F. Structure of non-graphitising carbons. Int. Mater. Rev. 1997, 42, 206–218. [Google Scholar] [CrossRef] [Green Version]
- Rouzaud, J.N.; Oberlin, A. Structure, microtexture, and optical properties of anthracene and saccharose-based carbons. Carbon 1989, 27, 517–529. [Google Scholar] [CrossRef]
- Franklin, R.E. The structure of graphitic carbons. Acta Crystallogr. 1951, 4, 253–261. [Google Scholar] [CrossRef] [Green Version]
- Lewis, I. Chemistry of carbonization. Carbon 1982, 20, 519–529. [Google Scholar] [CrossRef]
- Harris, P.J.F.; Green, M.L.H.; Tsang, S.C. High-resolution electron microscopy of tubule-containing graphitic carbon. J. Chem. Soc. Faraday Trans. 1993, 89, 1189. [Google Scholar] [CrossRef]
- Harris, P. Transmission electron microscopy of carbon: A brief history. C 2018, 4, 4. [Google Scholar] [CrossRef]
- Whitesides, R.; Domin, D.; Salomon-Ferrer, R.; Lester, W.A.; Frenklach, M. Graphene layer growth chemistry: Five- and six-member ring flip reaction. J. Phys. Chem. A 2008, 112, 2125–2130. [Google Scholar] [CrossRef] [PubMed]
- Whitesides, R.; Kollias, A.C.; Domin, D.; Lester, W.A.; Frenklach, M. Graphene layer growth: Collision of migrating five-member rings. Proc. Combust. Inst. 2007, 30, 539–546. [Google Scholar] [CrossRef]
- Smith, B.W.; Luzzi, D.E. Formation mechanism of fullerene peapods and coaxial tubes: A path to large scale synthesis. Chem. Phys. Lett. 2000, 321, 169–174. [Google Scholar] [CrossRef]
- Abrahamson, J. Graphite sublimation temperatures, carbon arcs and crystallite erosion. Carbon 1974, 12, 111–141. [Google Scholar] [CrossRef]
- Michelsen, H.A.; Schulz, C.; Smallwood, G.J.; Will, S. Laser-induced incandescence: Particulate diagnostics for combustion, atmospheric, and industrial applications. Prog. Energy Combust. Sci. 2015, 51, 2–48. [Google Scholar] [CrossRef] [Green Version]
- Michelsen, H.A.; Schrader, P.E.; Goulay, F. Wavelength and temperature dependences of the absorption and scattering cross sections of soot. Carbon 2010, 48, 2175–2191. [Google Scholar] [CrossRef]
- Goulay, F.; Schrader, P.E.; Lopez-Yglesias, X.; Michelsen, H.A. A data set for validation of models of laser-induced incandescence from soot: Temporal profiles of LII signal and particle temperature. Appl. Phys. B Lasers Opt. 2013, 112, 287–306. [Google Scholar] [CrossRef]
- Michelsen, H.A.; Liu, F.; Kock, B.F.; Bladh, H.; Bioarciuc, A.; Charwath, M.; Dreier, T.; Hadef, R.; Hofmann, M.; Reimann, J.; et al. Modeling laser-induced incandescence of soot: A summary and comparison of LII models. Appl. Phys. B 2007, 87, 503–521. [Google Scholar] [CrossRef] [Green Version]


| Time (s) | d002 (Å) |
|---|---|
| 0 | 3.44 |
| 0.25 | 3.44 |
| 1 | 3.44 |
| 5 | 3.42 |
| 60 | 3.40 |
| 300 | 3.39 |
© 2018 by the authors. Licensee MDPI, Basel, Switzerland. This article is an open access article distributed under the terms and conditions of the Creative Commons Attribution (CC BY) license (http://creativecommons.org/licenses/by/4.0/).
Share and Cite
Abrahamson, J.P.; Jain, A.; Van Duin, A.C.T.; Vander Wal, R.L. Trajectories of Graphitizable Anthracene Coke and Non-Graphitizable Sucrose Char during the Earliest Stages of Annealing by Rapid CO2 Laser Heating. C 2018, 4, 36. https://doi.org/10.3390/c4020036
Abrahamson JP, Jain A, Van Duin ACT, Vander Wal RL. Trajectories of Graphitizable Anthracene Coke and Non-Graphitizable Sucrose Char during the Earliest Stages of Annealing by Rapid CO2 Laser Heating. C. 2018; 4(2):36. https://doi.org/10.3390/c4020036
Chicago/Turabian StyleAbrahamson, Joseph P., Abhishek Jain, Adri C. T. Van Duin, and Randy L. Vander Wal. 2018. "Trajectories of Graphitizable Anthracene Coke and Non-Graphitizable Sucrose Char during the Earliest Stages of Annealing by Rapid CO2 Laser Heating" C 4, no. 2: 36. https://doi.org/10.3390/c4020036