Article

Single Wall Carbon Nanotubes Synthesis through Methane Chemical Vapor Deposition over MCM-41–Co Catalysts: Variables Optimization

by
Frank Ramírez Rodríguez
1,*,†,
Betty Lucy López
1,† and
Luis Fernando Giraldo
2,†
1
Grupo de Investigación Ciencia de los Materiales, Universidad de Antioquia, Calle 70 N° 52-21, Medellín 050010, Colombia
2
Laboratorio de Investigación en Polímeros, Universidad de Antioquia, Calle 70 N° 52-21, Medellín 050010, Colombia
*
Author to whom correspondence should be addressed.
These authors contributed equally to this work.
Submission received: 8 May 2018 / Revised: 8 June 2018 / Accepted: 12 June 2018 / Published: 19 June 2018

Abstract

:
MCM-41–Co catalysts were tested in the synthesis of single wall carbon nanotubes (SWCNTs) through methane chemical vapor deposition (CVD), varying total cobalt content, synthesis temperature, methane flow rate, and deposition time. All variables showed a relationship with total carbon deposition, graphitic quality according to Raman results. Cobalt content showed a maximum activity at 4%, but the structural quality is best at 3%. Flow rate does not affect the quality up to 300 cm3 min−1, but deposition time leads to the formation of highly disordered carbon species passing methane for periods longer than 30 min, concluding that optimal variables are a methane deposition temperature of 800 °C, a 300 cm3 min−1 methane flow rate, and a 30 min of methane injection time, leading to a 5.4% carbon mass content and 5.1 G/D area ratios.

1. Introduction

Since single wall carbon nanotubes (SWCNTs) were discovered [1] and remain one of the most remarkable carbon materials, with singular physical and electrical properties. An important feature of SWCNTs relies on the high tensile strength parallel to the tube axis as a consequence of the strongly delocalized π -electron density, and the high aspect ratio (up to millions) makes SWCNTs suitable for improving the physical strength of polymers [2]. Another important feature of SWCNTs is the semiconducting behavior dependent on chiral indexes [3,4], the band-gap being inversely related to the tube diameter [5]. This behavior is quite important when a material with a narrow band-gap value is required such as in the research of field-effect transistors [6]. Besides the semiconducting properties, SWCNTs present high electron and hole mobilities [7], improving short-circuit currents in solar cell devices [8,9]; through chemical doping of the graphitic structure, the band-gap is modified and permits the SWCNTs to serve as a chemical sensor where the response is generally interpreted as a current change when a probe molecule interacts with the doping agent in the graphitic structure [10]. Another important application field in gas adsorption, nanotube packaging leaves interstitial pores where small molecules such as hydrogen can be adsorbed for energy-related research [10]. Despite the huge brand of applications, nowadays SWCNT synthesis processes are expensive, requiring sophisticated production set-ups such as laser ablation and arc-discharge. While chemical vapor deposition (CVD) [11] is the simplest way to prepare them, carbon monoxide (CO) is the most used carbon source producing good, high-quality yields [12]. The main disadvantage of this compound lies in its high toxicity; on the other hand, methane is a good alternative because it has low toxicity, it is less expensive, and it produces either multiwall carbon nanotubes (MWCNTs) [13] or SWCNTs [14]. Mesoporous cobalt-based catalysts are of great interest due to their high selectivity towards SWCNTs, which is related to the ability of the MCM-41 porous structure to control the cobalt particle size inside pores with small diameters (<5 nm), responsible for the diameter of a carbon nanotube (CNT) [15] and the selectivity towards SWCNTs, which only grows over metal particles with a small size [16]. Most studies use carbon monoxide as a carbon source, but methane, being more accessible, could substitute CO. Therefore, in this work, to reach a high selectivity and yield of SWCNTs, cobalt content in MCM-41–Co catalyst, methane–CVD reaction temperature, methane flow rate, and reaction time are evaluated in order to determine the optimal conditions.

2. Materials and Methods

2.1. Chemical Reagents

Tetramethylammonium silicate (TMASiO2) (15–20%) was from Sigma-Aldrich (St. Louis, MO, USA), colloidal silica Cab-O-Sil (99.5%) was from Sigma-Aldrich, [Co(NO3)2x6H2O] (99.3%) was from Merck (Kenilworth, NJ, USA), cetyltrimethylammonium bromide (99%) was from Sigma-Aldrich, Ambersep 900® was from Alfa-Aesar, glacial acetic acid was from Merck, and ammonia (27% w/v) was from Merck.

2.2. Catalyst Synthesis

An total of 2.50 g of colloidal silica Cab-O-Sil and 10 mL of TMASiO2 were stirred for 30 min in 50 mL of deionized water; then, the proper amount of the [Co(NO3)2x6H2O] was added to reach the desired amount of cobalt (2–6%). The mixture was kept under constant stirring for 30 min, and two drops of antifoam A and 28.79 g of CTMAOH were then added. Next, the pH was adjusted to 11.5 using glacial acetic acid. The CTMAOH was previously prepared using 20% CTMABr and an Ambersep 900, in a proportion of 1 mmol CTMABr to 1 mL of Ambersep. Previous works have shown that both MCM-41 [17] and the MCM-41–Co [18] catalyst has good thermal stability and pore uniformity when the synthesis is conducted under these conditions. Catalysts names are: Con, where n is the nominal content of cobalt.

2.3. Chemical Vapor Deposition

All chemical vapor depositions (CVDs) were carried on a vertical quartz tube with an inner fritted disk, 200 mg of MCM-41–Co catalyst was heated under a constant flux of N2 at 25 °C min−1 until the reactor reached 700 °C. A mixture of 50:150 H2/N2 vol/vol was passed for 30 min, and the reducing atmosphere was switched for N2 and rapidly heated to 800 °C where a variable flux of CH4 was supplied. Once the reaction was completed, the reactor was allowed to cool to room temperature under an N2 atmosphere. The CVD products were characterized without purification.

2.4. Catalyst Characterization

The catalysts porous structure was characterized by means of N2 adsorption isotherms using ASAP 2020 equipment at a normal boiling point of N2 (−195.8 °C), taking approximately 30 points in the pressure range 0–1.0 (P/P0). Surface area using the BET model was used in the pressure range 0.05 P/P0–0.25 P/P0 [19], and pore size distribution was determined according to non-local density functional theory (NLDFT) models [20]. Incorporation evidence was performed using ultraviolet-visible spectrometer lambda 35 Perkin Elmer with an integration sphere attached to record the diffuse reflectance spectrum (DRS-UV) in the visible region, from 400 to 700 nm.

2.5. CVD Product Characterization

Total carbon content was determined using a thermogravimetric analyzer (TGA) supplied by Thermal Advantage, Q500, under an air atmosphere (a mixture of 80% N2 and 20% O2), a flow rate of 100 cm3 min−1, and a heating rate of 10 °C min−1. Total carbon content was taken as the weight loss from 200 °C to 800 °C. Graphitic features and evidence of SWCNTs using Raman spectroscopy, LabRam HR at 732 nm, Horiba. Each sample was placed on top of a glass substrate and flattened to minimize the signal noise. A single spectrum was collected by pointing the equipment laser to the darkest place in the sample and acquiring the spectrum for 10 s.

3. Results

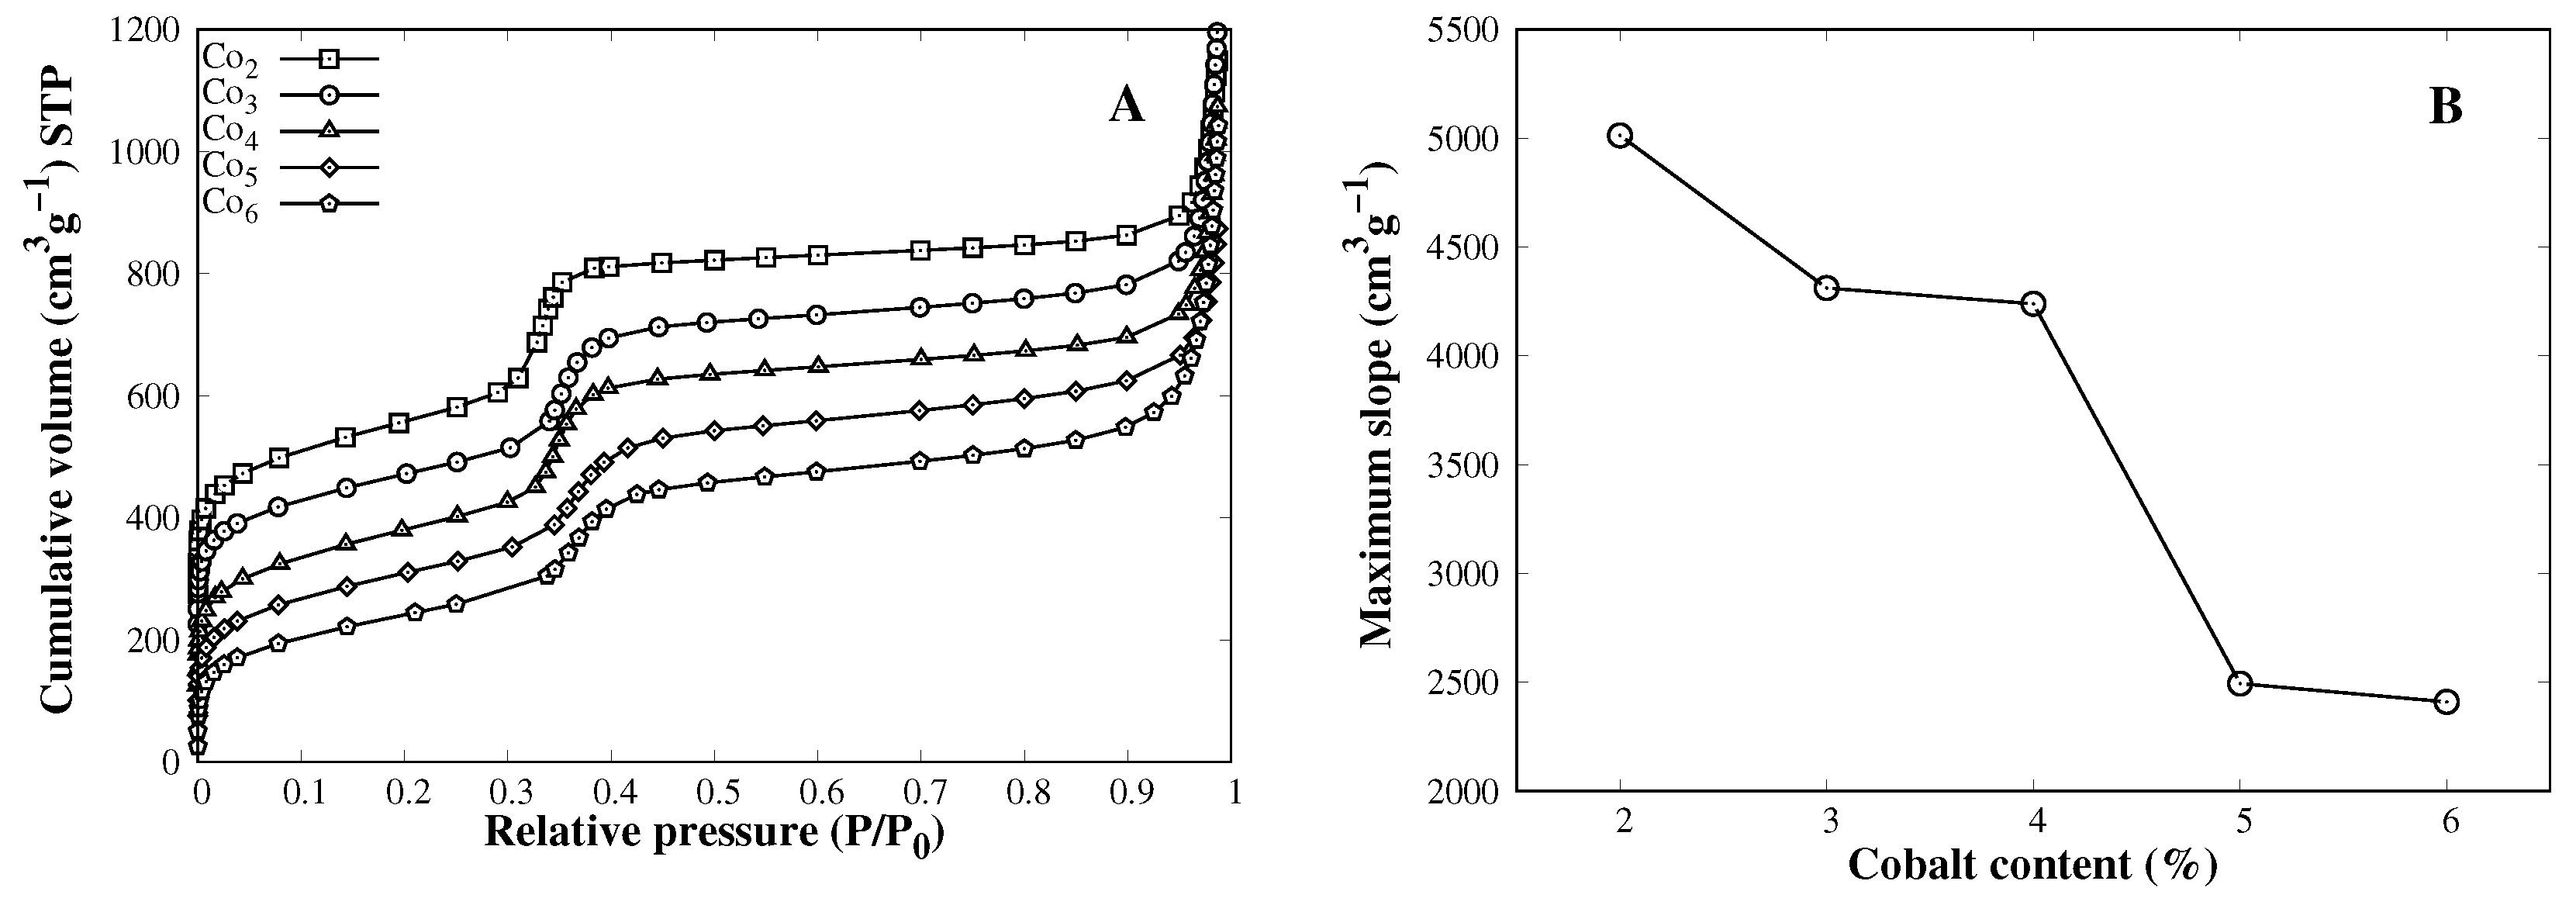
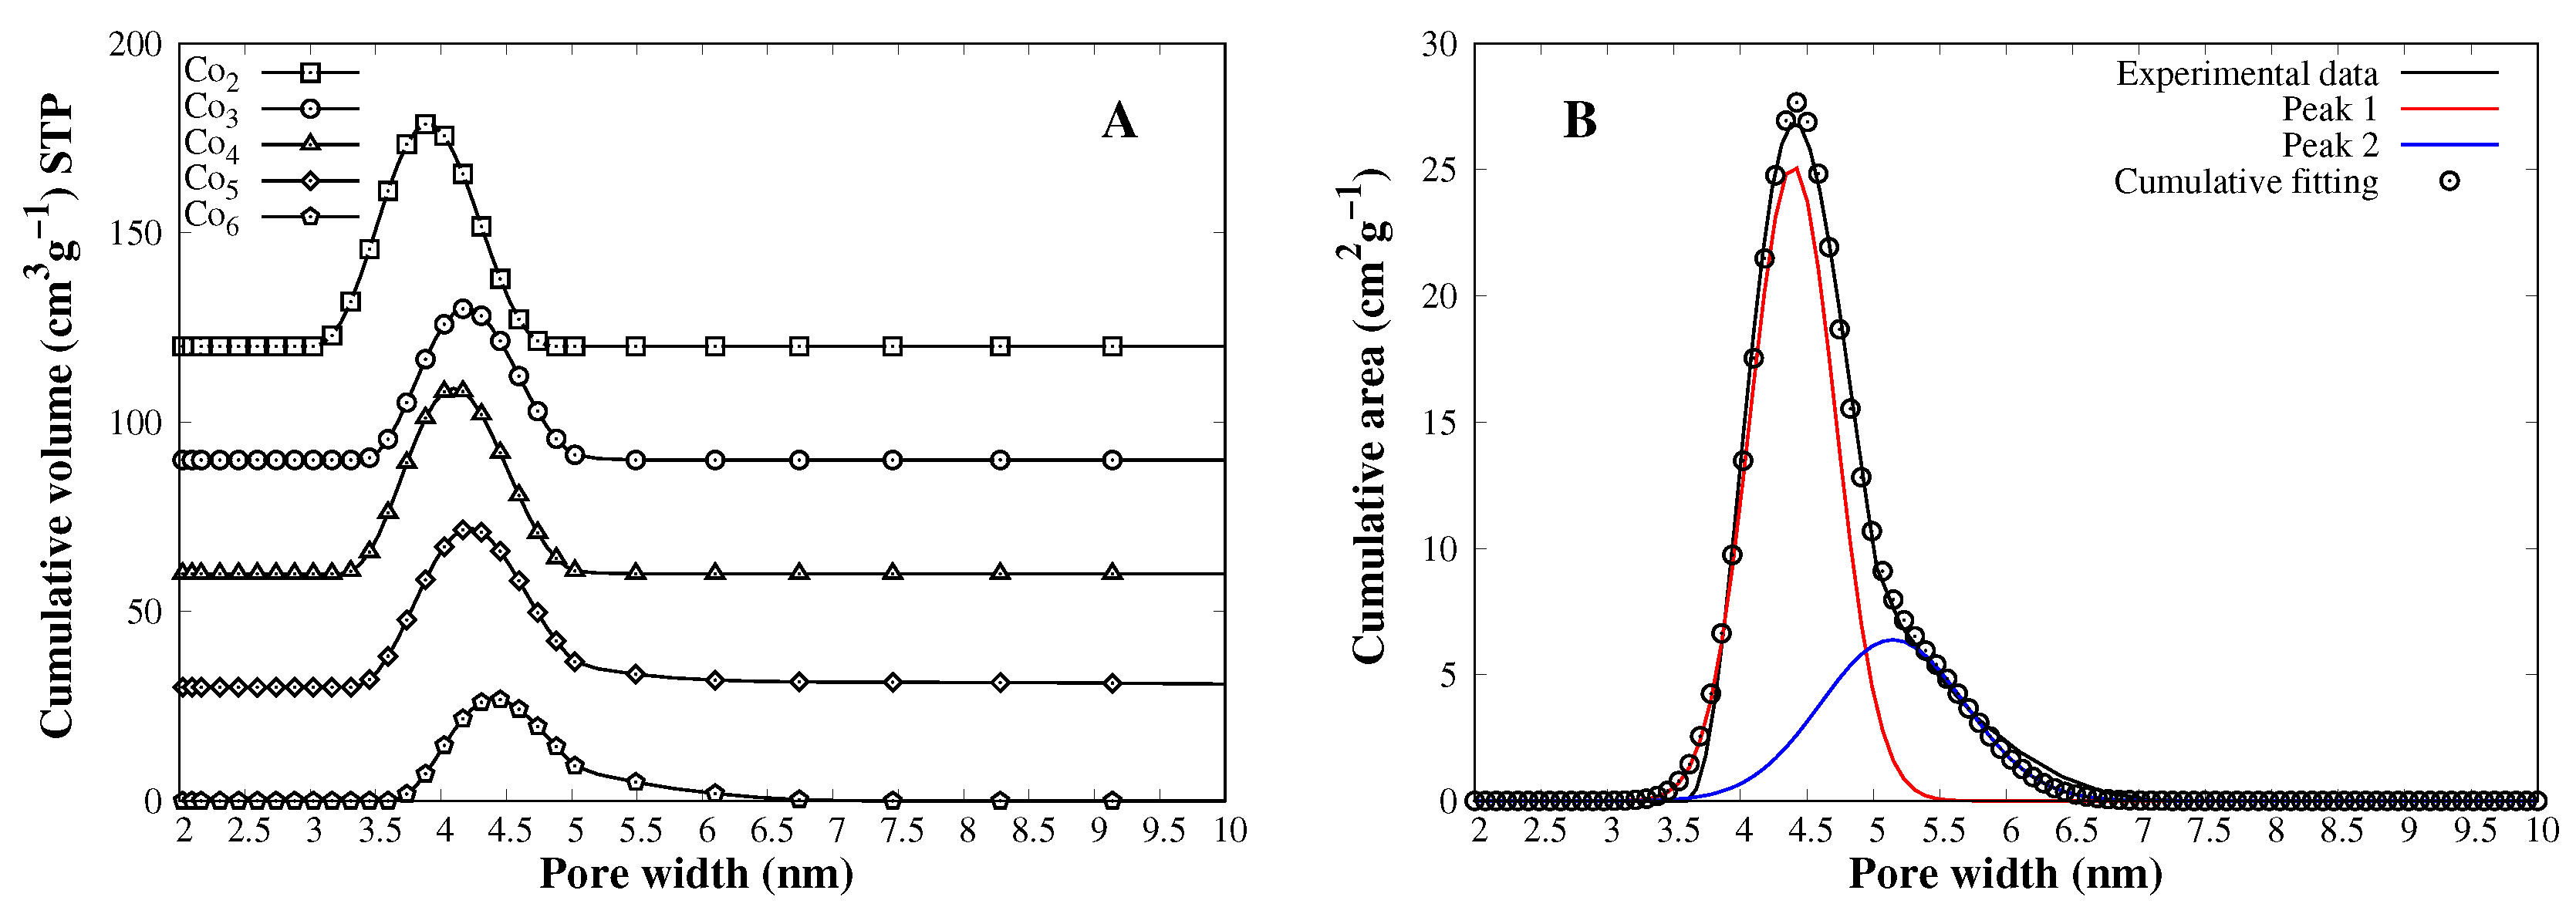
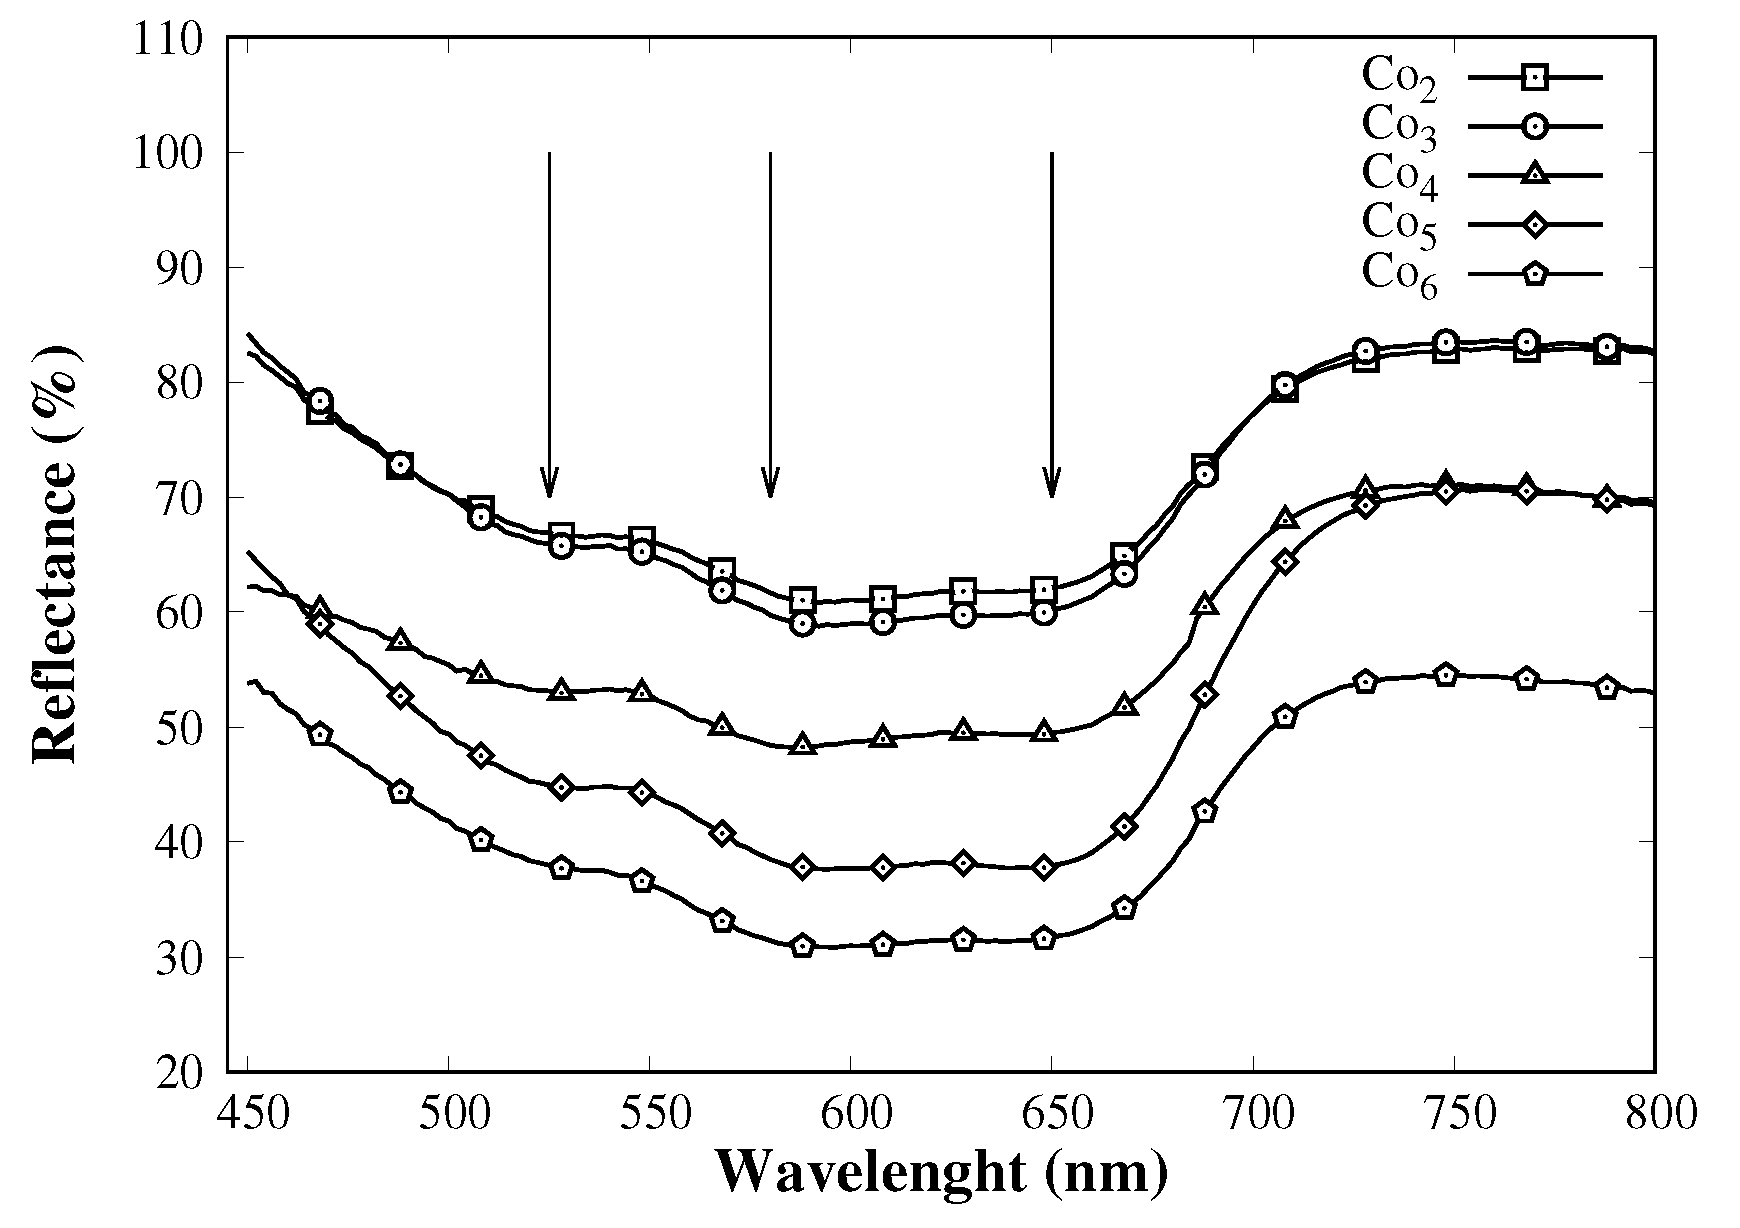
3.1. Catalyst Characterization

The porous structure of the MCM-41 support is of great importance during SWCNT synthesis, when the cobalt silicate-like is reduced by hydrogen, and the metallic particles diameter is restricted by the MCM-41 pore dimension, which subsequently defines the CNT diameter [21]. On the other hand, a large surface area is required to effectively disperse cobalt particles inside the porous structure to avoid sintering processes that lead to a loss of activity towards SWCNTs. Nitrogen adsorption isotherms give good insight in the mesoporous structure of catalysts (Figure 1A). All catalysts show mesoporous adsorption behavior [22] with a capillary condensation step from 0.3 P/P0 to 0.45 P/P0 featuring an MCM-41-like structure. Incorporation of a foreign cation into the siloxane network leads to a pore distortion, a deviation from the ideal Si–O–Si bond length conducts to a pore size increment (M–O larger than Si–O) or shortening (M–O shorter than Si–O). Co–OSi bond length is larger than the Si–OSi [21]; therefore, when cobalt is incorporated into the MCM-41 network, there is a pore shape disruption and an enlargement that conducts to a less uniform nitrogen uptake in the capillary condensation step, reflecting a decrease in the slope (Figure 1B) and mesoporous surface area (Table 1).
Mesoporous MCM-41 silica prepared with cetyltrimethylammonium bromide (CTABr) as pore director leads to a mean diameter of 4.0 nm approximately, confirmed by XRD and TEM experiments [23]. Through nitrogen adsorption, it is possible to determine pore size; NLDFT [20] or the Barrett–Joyne–Halenda (BJH) method [24] are two approaches for the determination of the pore size of mesoporous materials. The latter underestimates the pore size of a cylindrical shape (like MCM-41 pores), while NLDFT hasa better correlation, giving pore diameters around 4.0 nm for MCM-41 prepared with CTABr as a pore director [25]. According to pore size distribution (Figure 2A), there is an increment in pore diameter as the cobalt content increases. This finding is in good agreement with the dependence of pore size and metal–oxygen bond length. The Co2 catalyst has a pore size of 3.91 nm, while Co6 has an average pore diameter of 4.40 nm (see Table 1). Interestingly, as the cobalt content increases, a second distribution comes out, and pores are larger than 5.0 nm (Figure 2B). Such pores are potentially detrimental to SWCNT growth since large particles are preferentially active towards amorphous carbon and non-tubular graphitic materials.
Through nitrogen adsorption results, it was possible to confirm the well-defined mesostructure for all catalysts; nevertheless, the incorporation of cobalt is not feasible to prove solely via this technique. Diffuse reflectance UV–Vis (DRS-UV) absorption profiles (Figure 3) give information about the coordination of cobalt cation in the bulk structure. When cobalt cation is surrounded by four oxygen anions, it absorbs photons from 550 to 700 nm [26]. Since all catalysts show almost the same absorption profile, it can be concluded that the chemical environment of cobalt within the siloxane network is similar in all cases. It is noteworthy that the initial amount of cobalt salt in the sol-gel process is directly related to the spectral intensity within the range 550–750 nm range. This increment is presumably due to an increase of cobalt cations forming SiO–Co–OSi species.

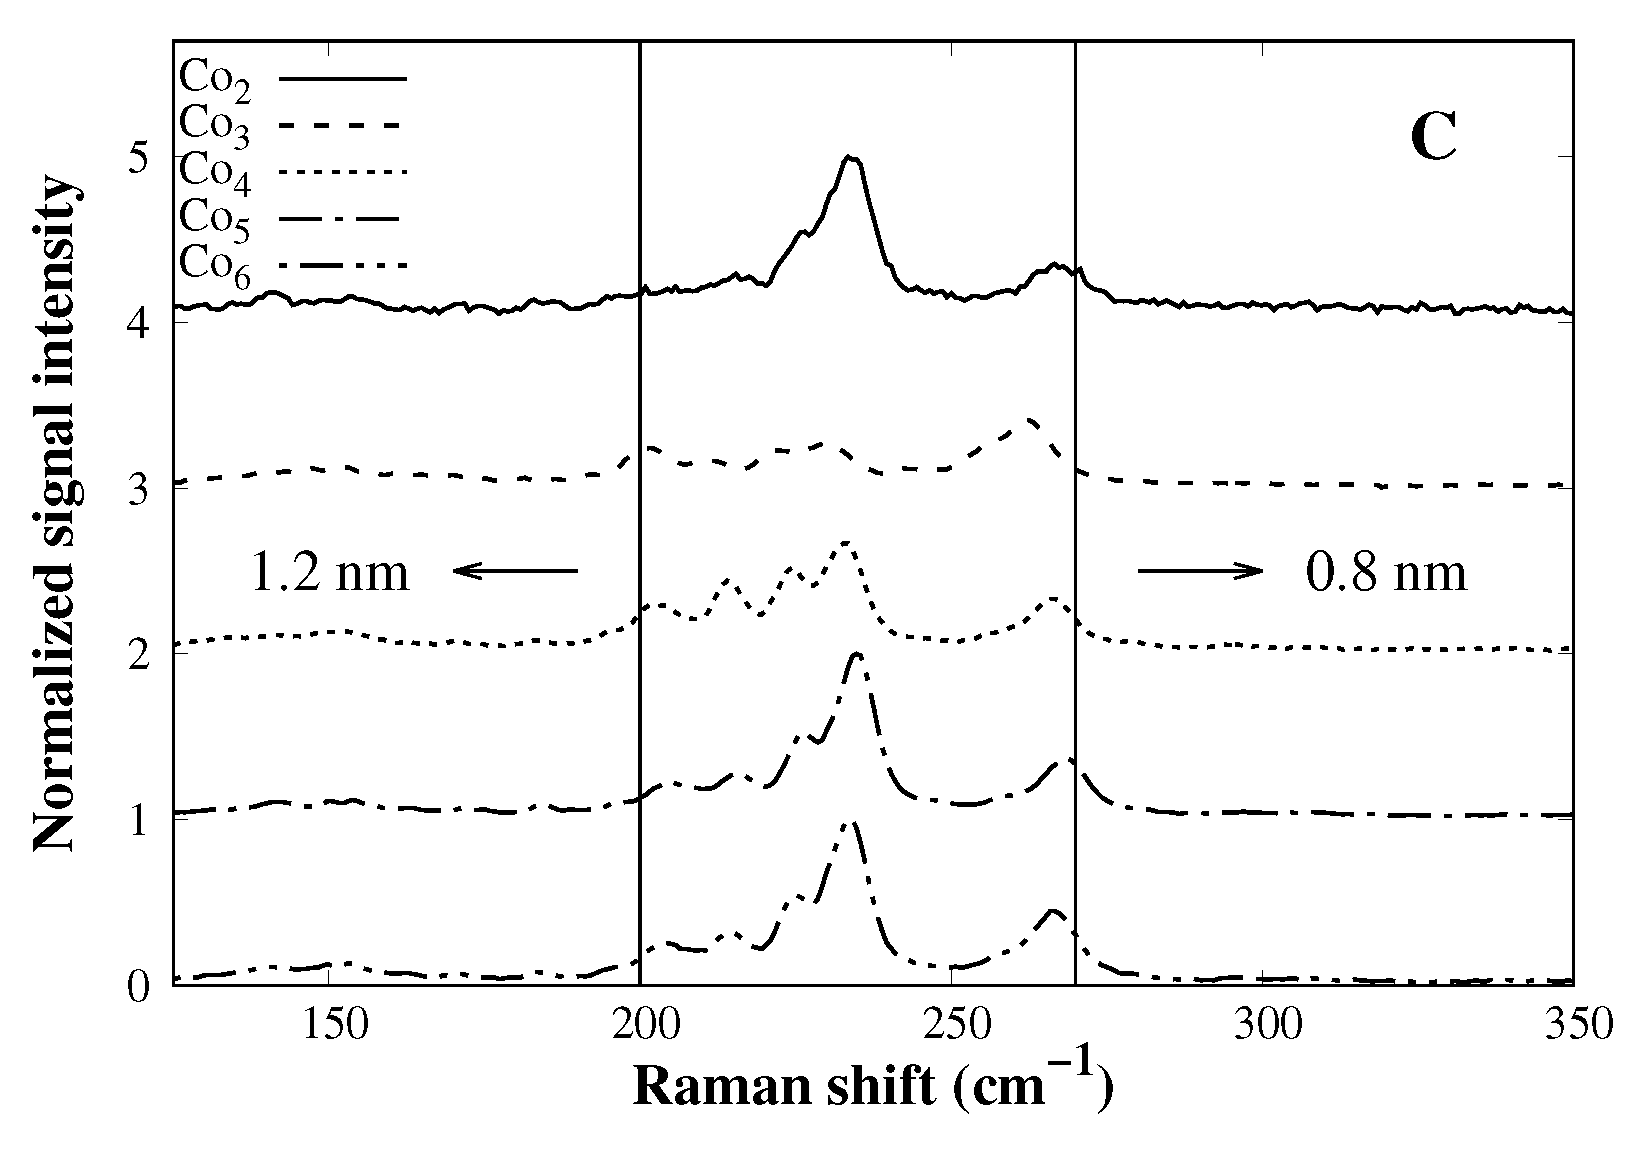
3.2. Methane Chemical Vapor Deposition

The cobalt catalysts prepared so far show the desired incorporation without losing the mesoporous characteristics; nevertheless, to test the catalysts in the production of SWCNTs, a CVD process is conducted. Figure 4A shows the total amount of carbon deposited after the CVD process (extracted from TGA curves as the weight loss between 200 and 800 °C). According to the bar plot, there is a direct relationship between the total amount of carbon and the cobalt load up to 4%, where a maximum of carbon production is reached. Further cobalt load (5% and 6%) leads to a loss of activity which could be related to the lower surface area of those catalysts (Table 1), leading to a poor dispersion of cobalt species after reduction and allowing the growth of large cobalt particles, which do not have activity towards SWCNTs [18]. Evidence of SWCNTs was confirmed by means of Raman spectroscopy (Figure 4B), where all samples show signals between 150 and 250 cm−1, related to the radial breathing mode (RBM) of the tube [27]. Peak maximum within this range is inversely related to the tube diameter [28] (see Equation (1)). G-band (∼1580 cm−1) appears when graphitic-like structures are present, and D-band (∼1350 cm−1) is characteristic of defects on the tube structure (fused 5- and 7-member rings) and amorphous carbon. The G to D areas ratio is of particular interest since is a quantitative measure of graphitic quality [29]. CVDs show all of those aforementioned features, which is conclusive of the formation of SWCNTs. Moreover, according to data in Table 2, the samples Co3, Co5, and Co6 have a higher G/D-band ratio, indicating good tube quality. In Co2 and Co4, there is even evidence that the structural quality of SWCNTs is not as good as the priors. Since catalytic activity decreases beyond 4% of cobalt content, one may think that some cobalt metal particle growth is larger than the critical size, losing activity to SWCNTs. Combining Raman and TGA results, it is clear that Co3 is the ideal catalyst, where carbon content is good and does not lose structural quality. According to Equation (1), the tube diameter in all cases varies from 0.8 to 1.2 nm approximately (Figure 4C); as mentioned earlier, tube diameter is related to the cobalt particle size and cobalt particle size is defined by the pore dimension, if it is confined inside the pore; since all catalysts showed pore diameters that are close to each other, similar SWCNT diameters are expected.
ν ˜ = 234 d t + 10 tube diameter ( in nm ) relationship with the RBM shift

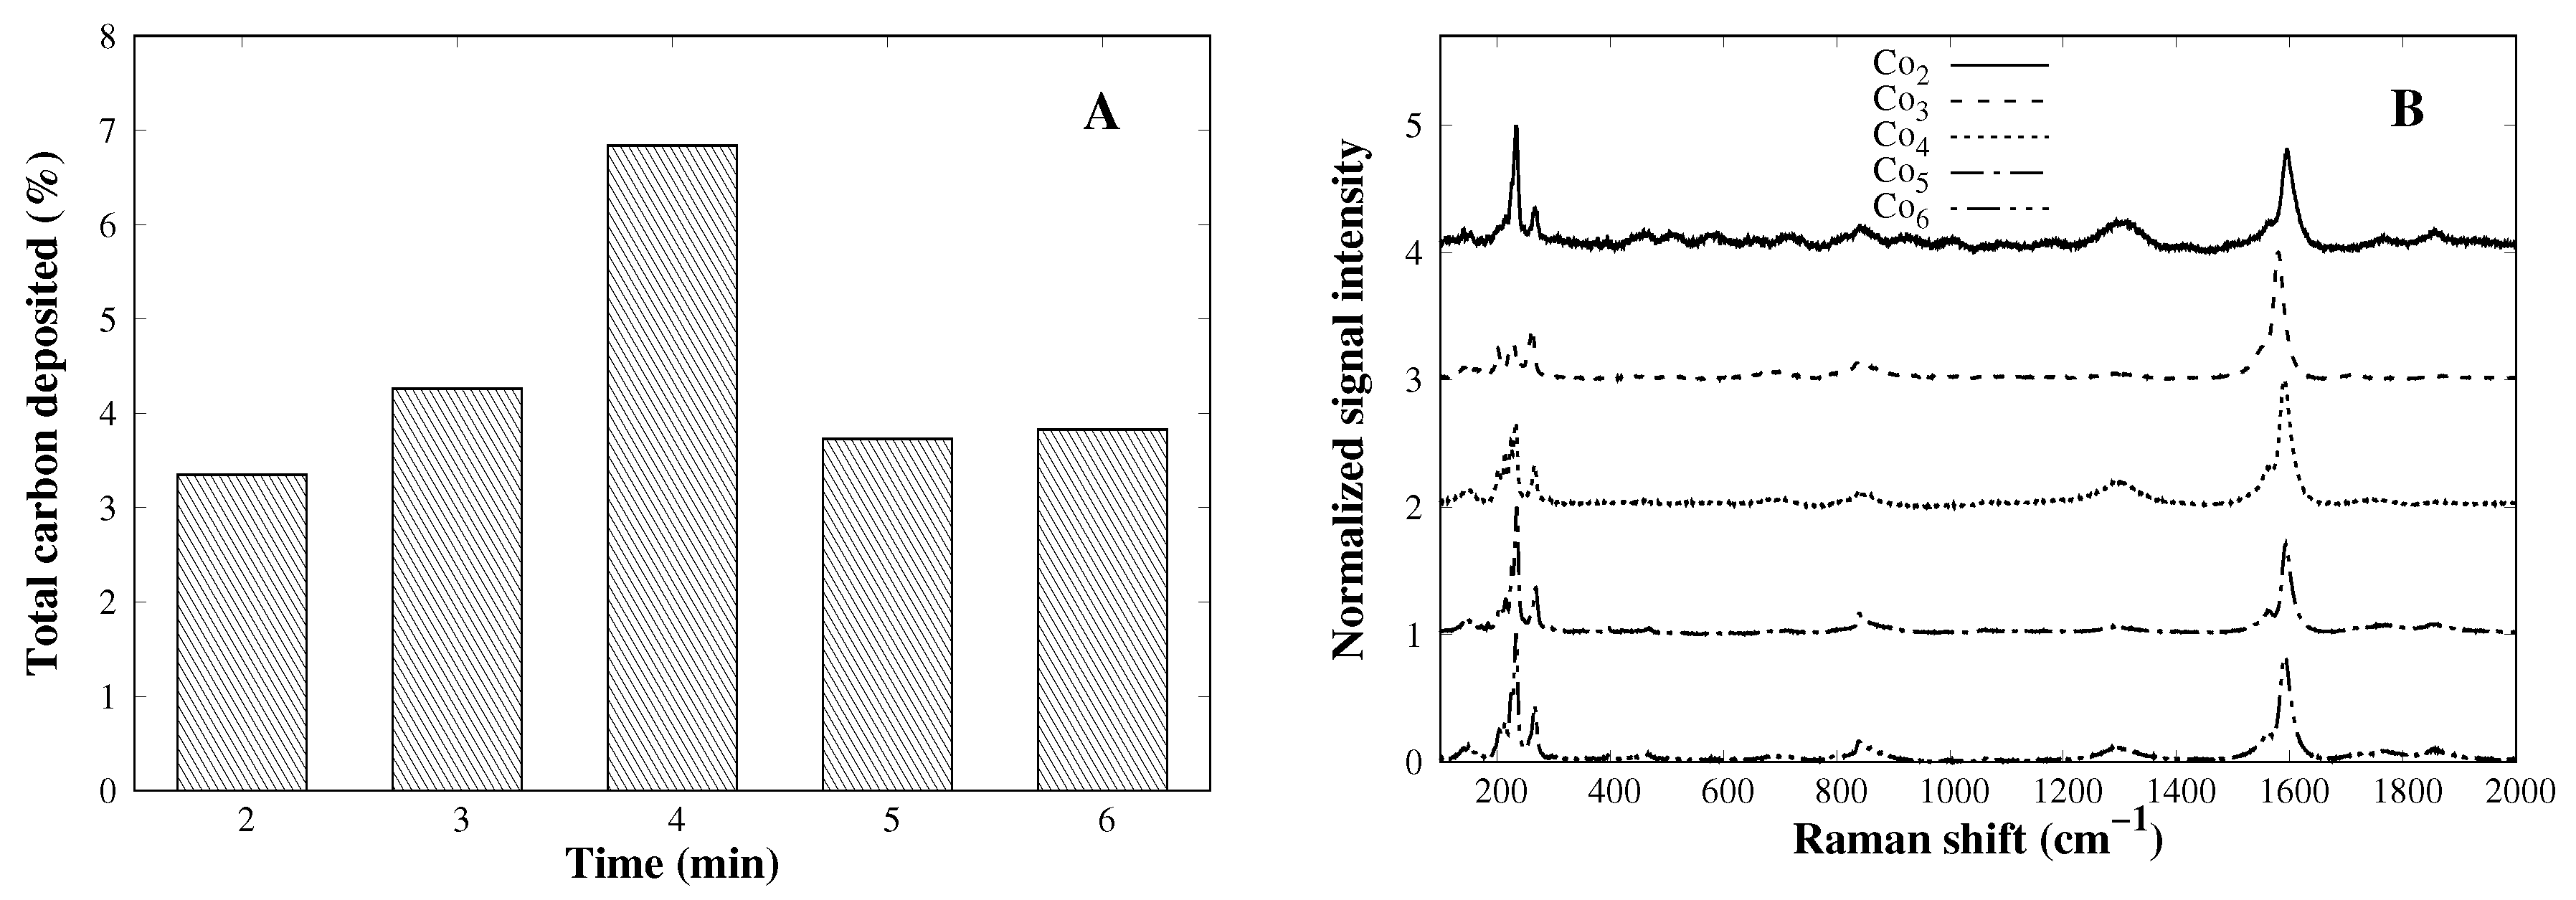
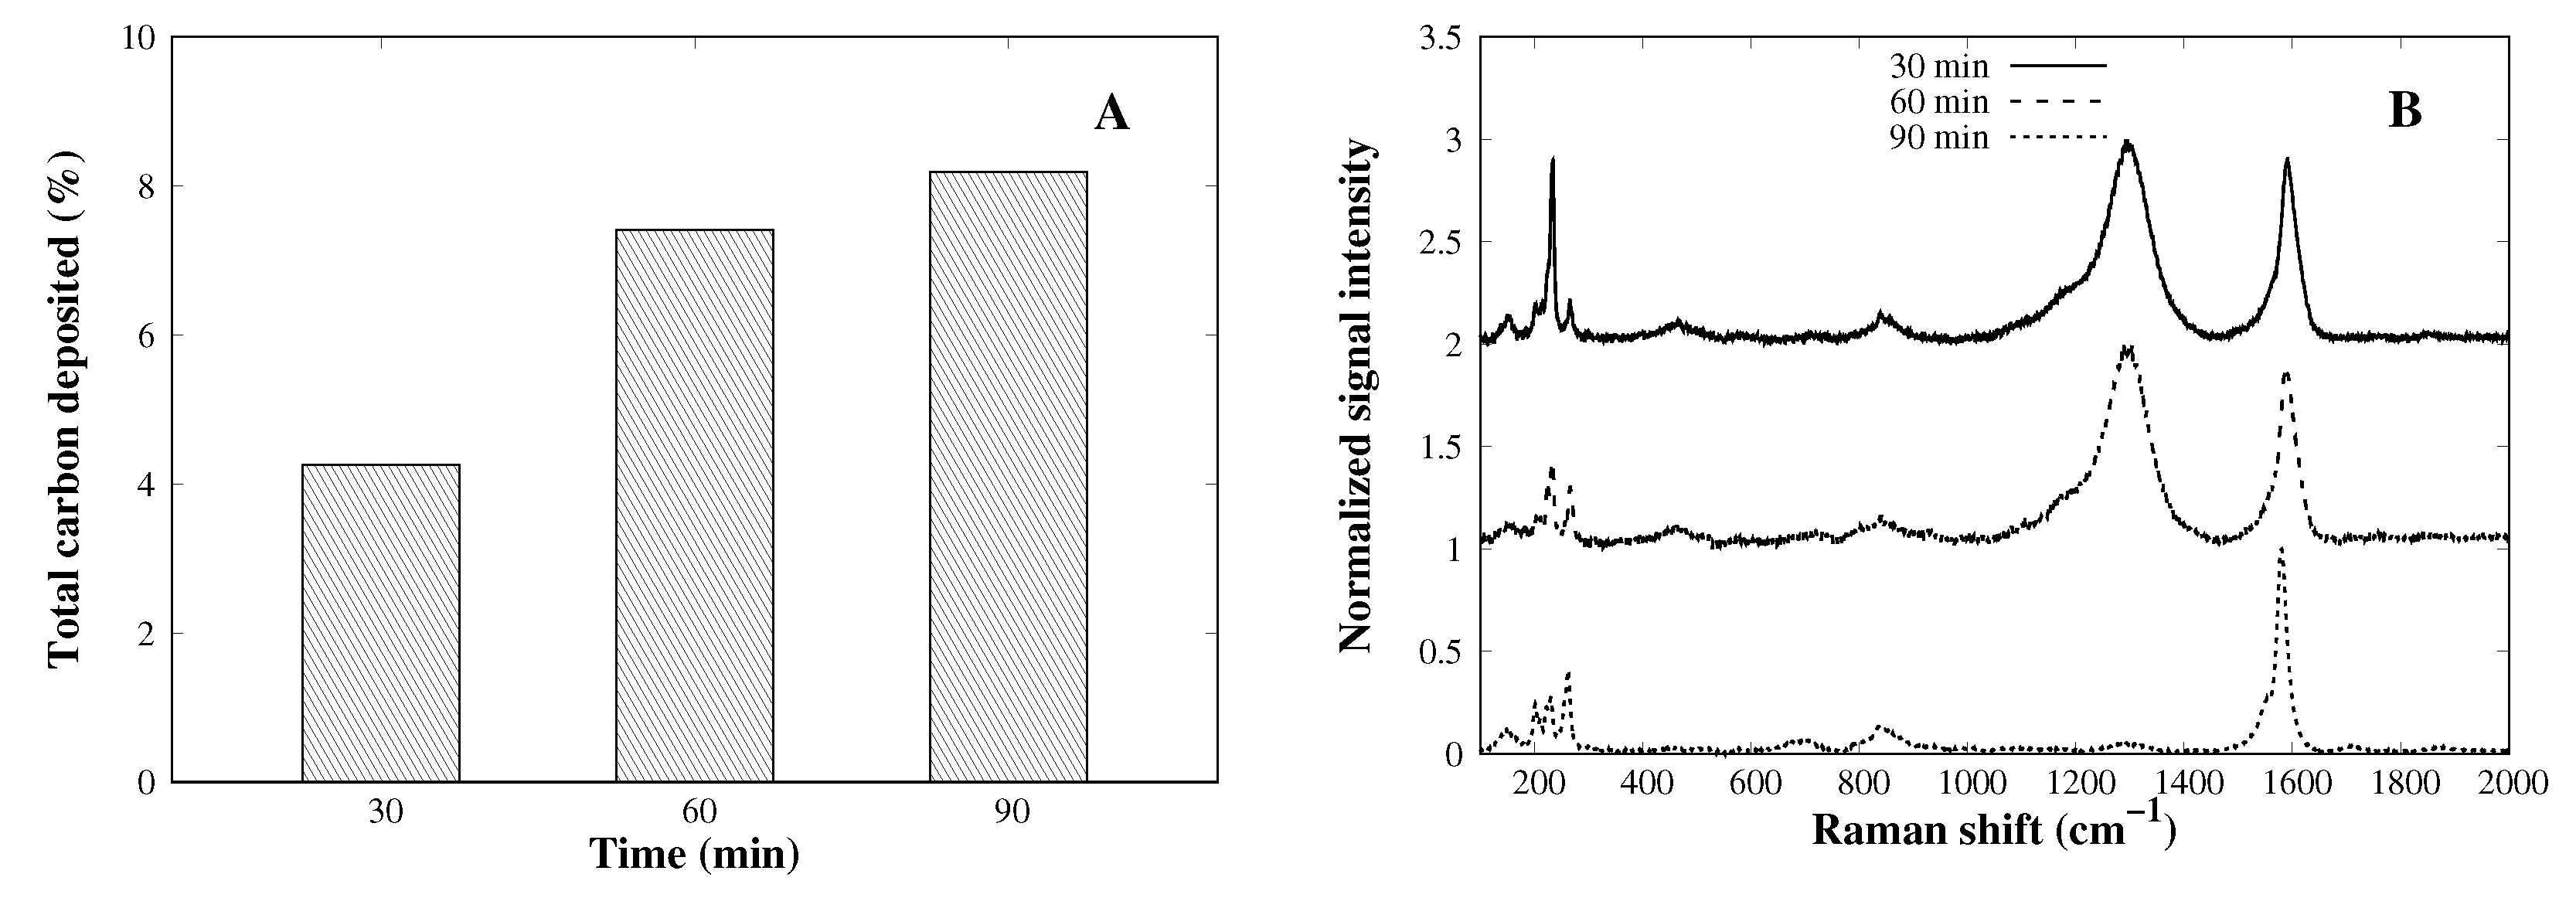
3.3. Time Effect on the CVD Process

In all CVD experiments conducted so far, the reaction time under methane flow was 30 min long. To evaluate the time effect on the deposition quality and yield, the reaction was performed for 60 and 90 min. The total carbon deposition at a 30 min reaction time was approximately 4% (Figure 5A) and retains the structural quality (Figure 5B). A longer deposition time (>30 min) leads to a higher carbon amount after the CVD process, but the structural quality decreases enormously, as can be seen by the increase of the D-band; 30 min seems to be the optimal time. As the methane molecules pass through the cobalt particles, they dissociate and begin to cover the cobalt particle surface. Once the particles are saturated with carbon atoms, the excess of methane molecules dissociate over the silica support, yielding amorphous carbon and non-tubular structures [30].

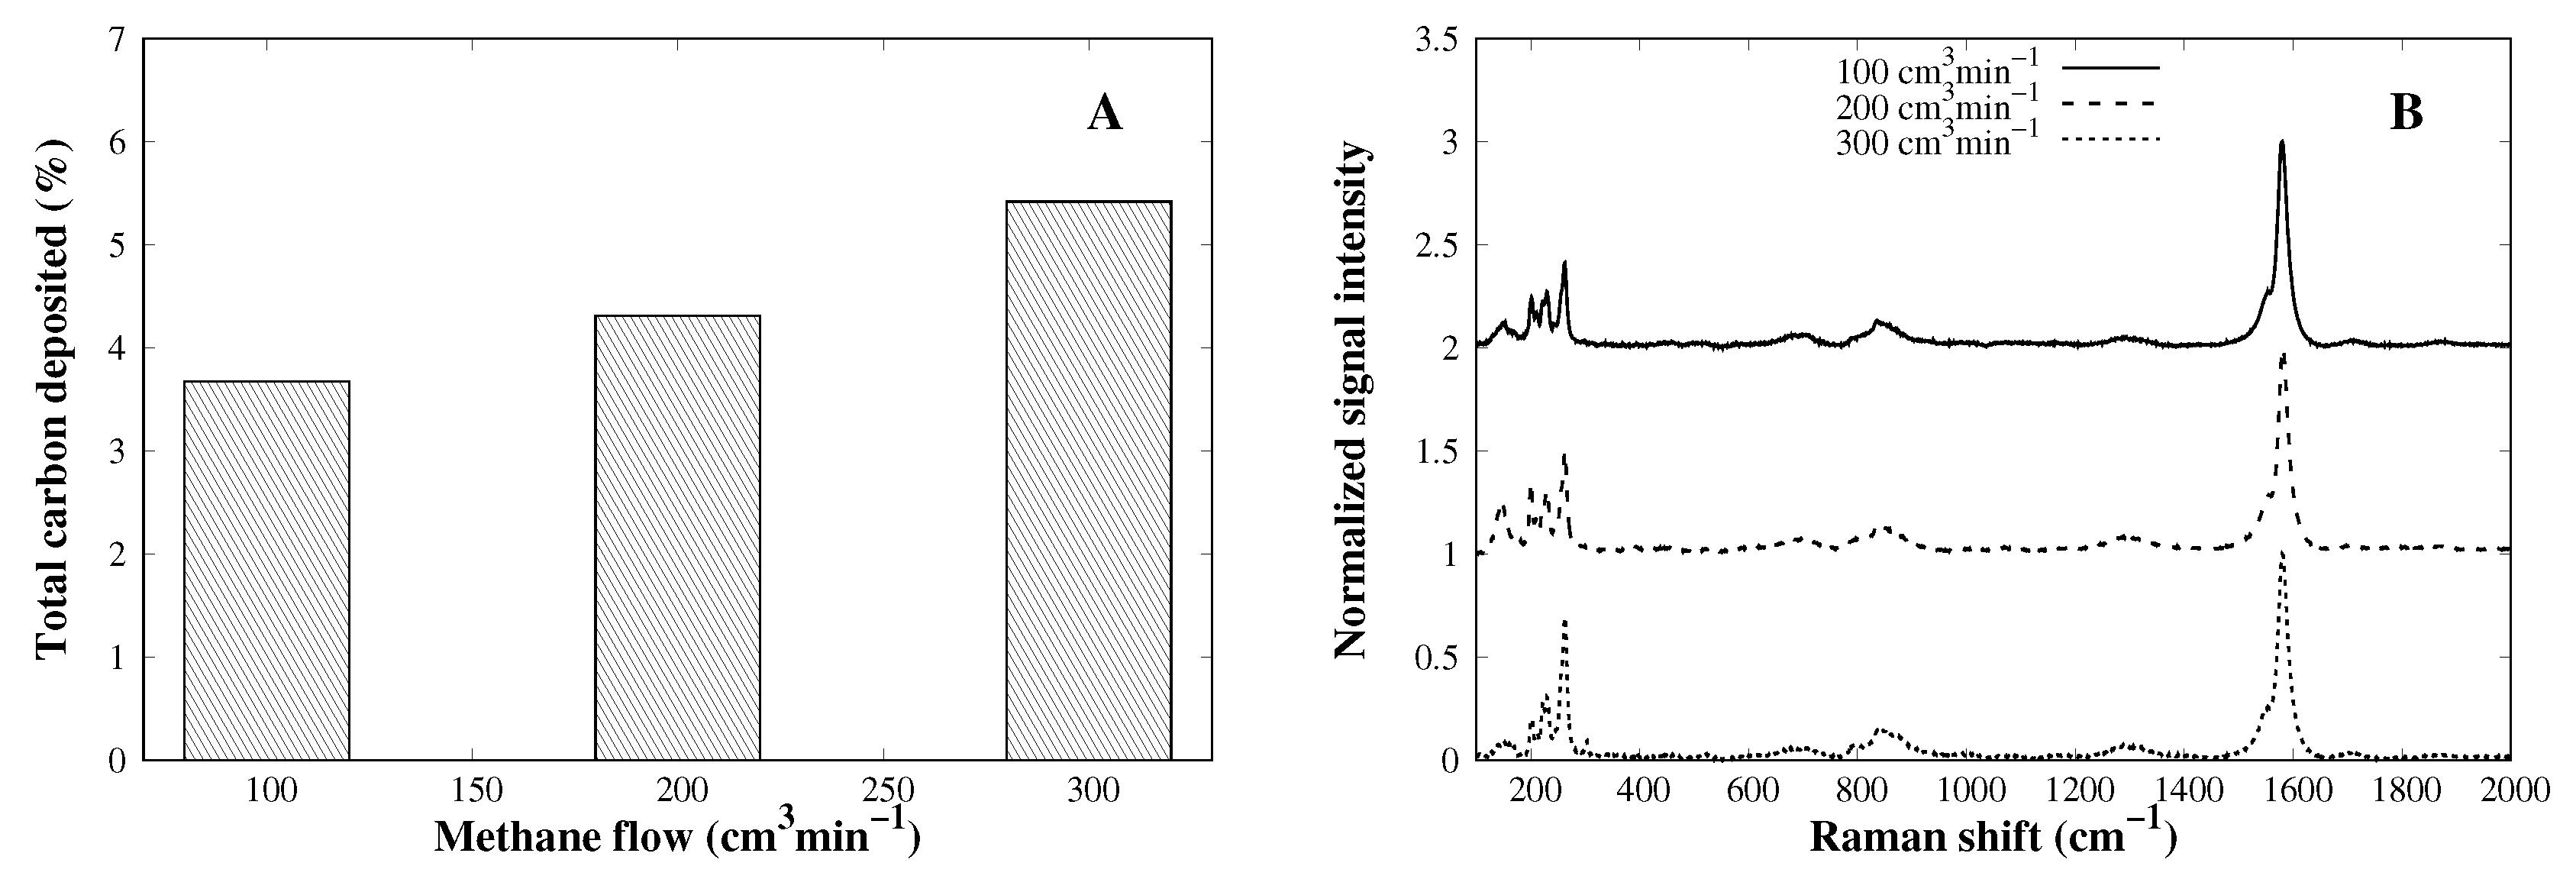
3.4. Methane Flow Rate Effect on CVD Process

The CVD process is affected by the gas adsorption, bulk diffusion, and surface diffusion, among others. The carbon source quantity available for reacting affects the total amount of carbon species deposited over the CVD process. As the number of methane molecules increases, the collision probability of methane molecules against the cobalt particles increase as well, which leads to a higher amount of deposited carbon [31]; as seen in Figure 6A, methane flow rate indeed increases the yield by up to to 5.4%. More interestingly, there is no increase in the D-band as the flow rate rises, nor is any loss in graphite-like structure evidenced. Since an oversaturation of methane molecules over metal particles cannot be seen, the flow rate may be increased, pushing the yield of carbon deposition beyond 6% without losing structural quality.

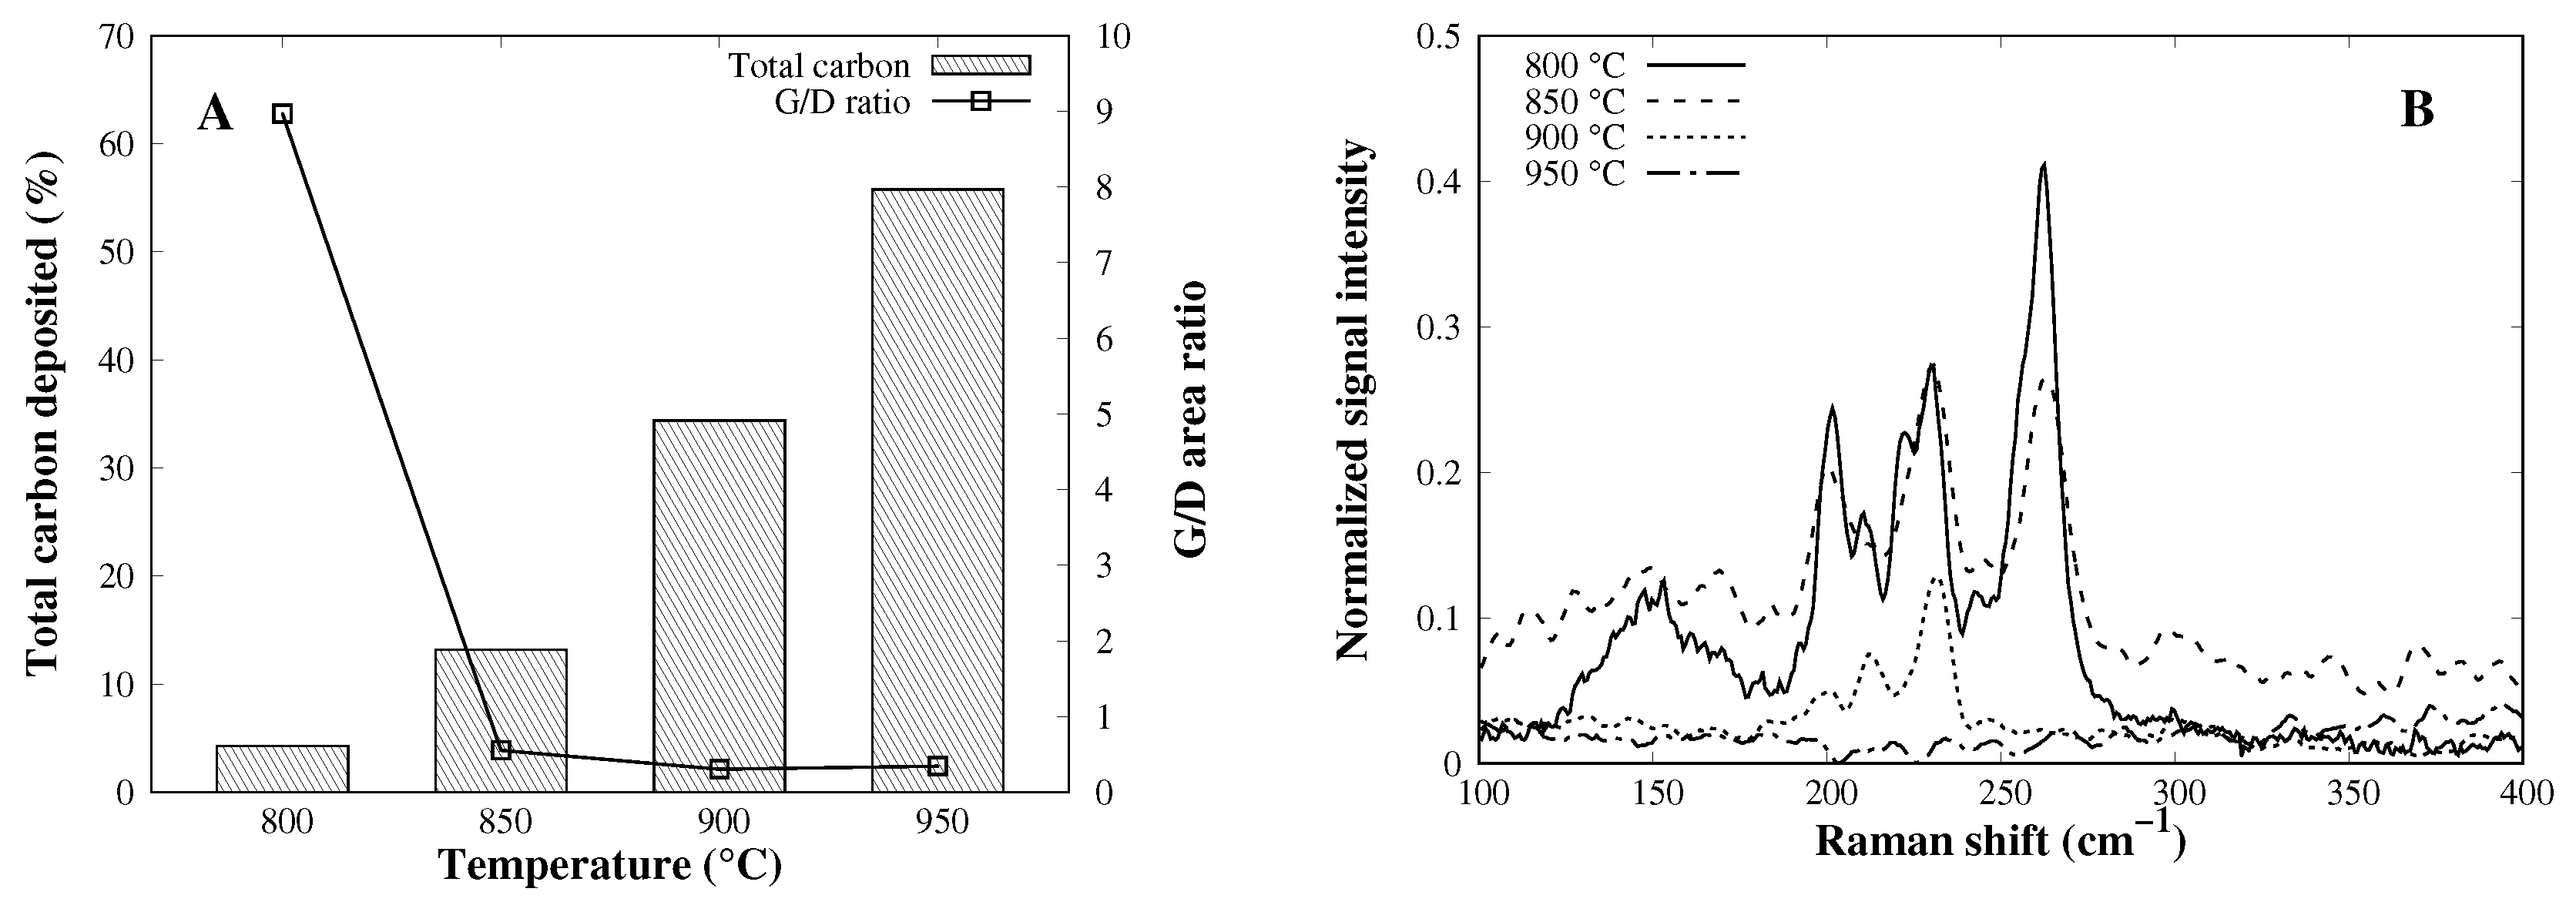
3.5. Effect of Reaction Temperature on CVD Process

Finally, temperature variation is assessed from 800 to 950 °C, in 50 °C steps. A huge increase in catalytic activity is shown in Figure 7A, where the total amount of carbon uptake went from 5.4% to nearly 60%. This trend has been evidenced [32,33] where the temperature has a direct effect on the CVD deposition amount, due to an overcoming of the methane dissociation energy barrier. Despite the higher activity, the G/D area ratio decreases strongly, and the amount of SWCNT formed also diminishes with temperature (Figure 7B), leading to a complete loss of activity to SWCNTs.
Scanning electron micrographs (Figure 8) show no tubular structures, such as MWCNTs over the Co3 catalyst in the temperature range evaluated. Combining Raman, TGA, and SEM results, it is clear that there is a complete loss of activity toward CNTs, so carbon species growth may be amorphous or highly disordered non-tubular carbon compounds. More detailed information regarding the nature of this carbon compounds can be extracted by transmission electron microscopy [34].

4. Conclusions

In this work, SWCNTs have been successfully prepared from methane CVD processes over MCM-41–Co catalysts with good quality and yield. Methane flow rate is directly related to yield without losing quality, while reaction time increases yield but decreases quality. On the other hand, increasing the reaction temperature boosts the catalytic activity enormously but leads to the loss of SWCNT selectivity. Non-tubular species are present, but this may suggest the formation of graphite or non-tubular species with low quality.

Author Contributions

F.R.R.: Experimental procedures, data analysis, manuscript writing; L.F.G.: Data analysis and manuscript writing; B.L.L.: manuscript correction.

Funding

This research received no external funding.

Acknowledgments

Frank Ramírez Rodríguez wants to thank Colciencias for the Francisco José de Caldas Doctoral scholarship.

Conflicts of Interest

The authors declare no conflict of interest.

Abbreviations

The following abbreviations are used in this manuscript:
SWCNTsingle wall carbon nanotubes
DRS-UVdiffuse reflectance UV–Vis spectroscopy
CVDchemical vapor deposition
MWCNTmultiwall carbon nanotubes
RBMradial breathing mode

References

  1. Iijima, S. Helical microtubules of graphitic carbon. Nature 1991, 354, 56–58. [Google Scholar] [CrossRef]
  2. Cadek, M.; Coleman, J.N.; Ryan, K.P.; Nicolosi, V.; Bister, G.; Fonseca, A.; Nagy, J.B.; Szostak, K.; Beguin, F.; Blau, W.J. Reinforcement of Polymers with Carbon Nanotubes: The Role of Nanotube Surface Area. Nano Lett. 2004, 4, 353–356. [Google Scholar] [CrossRef]
  3. Dresselhaus, M.S.; Dresselhaus, G.; Charlier, J.C.; Hernandez, E. Electronic, thermal and mechanical properties of carbon nanotubes. Philos. Trans. R. Soc. A Math. Phys. Eng. Sci. 2004, 362, 2065–2098. [Google Scholar] [CrossRef] [PubMed] [Green Version]
  4. Manevitch, L.; Smirnov, V.; Strozzi, M.; Pellicano, F. Nonlinear optical vibrations of single-walled carbon nanotubes. Int. J. Non-Linear Mech. 2017, 94, 351–361. [Google Scholar] [CrossRef]
  5. Bandaru, P.R. Electrical Properties and Applications of Carbon Nanotube Structures. J. Nanosci. Nanotechnol. 2007, 7, 1239–1267. [Google Scholar] [CrossRef] [PubMed]
  6. Park, R.S.; Hills, G.; Sohn, J.; Mitra, S.; Shulaker, M.M.; Wong, H.S.P. Hysteresis-Free Carbon Nanotube Field-Effect Transistors. ACS Nano 2017, 11, 4785–4791. [Google Scholar] [CrossRef] [PubMed]
  7. Tameev, A.R.; Jiménez, L.L.; Pereshivko, L.Y.; Rychwalski, R.W.; Vannikov, A.V. Charge carrier mobility in films of carbon-nanotube-polymer composites. J. Phys. Conf. Ser. 2007, 61, 1152–1156. [Google Scholar] [CrossRef]
  8. Ren, S.; Bernardi, M.; Lunt, R.R.; Bulovic, V.; Grossman, J.C.; Gradečak, S. Toward Efficient Carbon Nanotube/P3HT Solar Cells: Active Layer. Nano Lett. 2011, 11, 5316–5321. [Google Scholar] [CrossRef] [PubMed]
  9. Grace, T.; Yu, L.; Gibson, C.; Tune, D.; Alturaif, H.; Al Othman, Z.; Shapter, J. Investigating the Effect of Carbon Nanotube Diameter and Wall Number in Carbon Nanotube/Silicon Heterojunction Solar Cells. Nanomaterials 2016, 6, 52. [Google Scholar] [CrossRef] [PubMed]
  10. Zaporotskova, I.V.; Boroznina, N.P.; Parkhomenko, Y.N.; Kozhitov, L.V. Carbon nanotubes: Sensor properties. A review. Mod. Electron. Mater. 2016, 2, 95–105. [Google Scholar] [CrossRef]
  11. Thostenson, E.T.; Ren, Z.; Chou, T.W. Advances in the science and technology of carbon nanotubes and their composites: A review. Compos. Sci. Technol. 2001, 61, 1899–1912. [Google Scholar] [CrossRef]
  12. Zoican Loebick, C.; Derrouiche, S.; Fang, F.; Li, N.; Haller, G.L.; Pfefferle, L.D. Effect of chromium addition to the Co-MCM-41 catalyst in the synthesis of single wall carbon nanotubes. Appl. Catal. A Gen. 2009, 368, 40–49. [Google Scholar] [CrossRef]
  13. Ziebro, J.; ukasiewicz, I.; Borowiak-Palen, E.; Michalkiewicz, B. Low temperature growth of carbon nanotubes from methane catalytic decomposition over nickel supported on a zeolite. Nanotechnology 2010, 21, 145308. [Google Scholar] [CrossRef] [PubMed]
  14. Ramirez, F.; Giraldo, L.F.; Lopez, B. Silica Precursor Effect on the Physical and Chemical and Their Performance towards Single Wall. C J. Carbon Res. 2018, 4, 16. [Google Scholar] [CrossRef]
  15. Sinnott, S.B.; Andrews, R.; Qian, D.; Rao, A.M.; Mao, Z.; Dickey, E.C.; Derbyshire, F. Model of carbon nanotube growth through chemical vapor deposition. Chem. Phys. Lett. 1999, 315, 25–30. [Google Scholar] [CrossRef]
  16. Chen, Y.; Ciuparu, D.; Lim, S.; Yang, Y.; Haller, G.L.; Pfefferle, L. Synthesis of uniform diameter single-wall carbon nanotubes in Co-MCM-41: Effects of the catalyst prereduction and nanotube growth temperatures. J. Catal. 2004, 225, 453–465. [Google Scholar] [CrossRef]
  17. Lim, S.; Yang, Y.; Ciuparu, D.; Wang, C.; Chen, Y.; Pfefferle, L.; Haller, G.L. The effect of synthesis solution pH on the physicochemical properties of Co substituted MCM-41. Top. Catal. 2005, 34, 31–40. [Google Scholar] [CrossRef]
  18. Pfefferle, L.; Haller, G.; Chen, Y.; Ciuparu, D.; Lim, S.; Yang, Y.H. Mechanism study on cobalt cluster size control in Co-MCM-41 during single wall carbon nanotubes synthesis by Co disproportionation. Abstr. Pap. Am. Chem. Soc. 2005, 229, 15565–15571. [Google Scholar] [CrossRef]
  19. Brunauer, S.; Emmett, P.H.; Teller, E. Adsorption of Gases in Multimolecular Layers. J. Am. Chem. Soc. 1938, 60, 309–319. [Google Scholar] [CrossRef]
  20. Neimark, A.V.; Ravikovitch, P.I.; Grün, M.; Schüth, F.; Unger, K.K. Pore Size Analysis of MCM-41 Type Adsorbents by Means of Nitrogen and Argon Adsorption. J. Colloid Interface Sci. 1998, 207, 159–169. [Google Scholar] [CrossRef] [PubMed]
  21. Lim, S.; Ciuparu, D.; Pak, C.; Dobek, F.; Chen, Y.; Harding, D.; Pfefferle, L.; Haller, G. Synthesis and Characterization of Highly Ordered Co-MCM-41 for Production of Aligned Single Walled Carbon Nanotubes (SWNT). J. Phys. Chem. B 2003, 107, 11048–11056. [Google Scholar] [CrossRef]
  22. Donohue, M.D.; Aranovich, G.L. Classification of Gibbs adsorption isotherms. Adv. Colloid Interface Sci. 1998, 76–77, 137–152. [Google Scholar] [CrossRef]
  23. Kruk, M.; Jaroniec, M.; Sakamoto, Y.; Terasaki, O.; Ryoo, R.; Hyun Ko, C. Determination of Pore Size and Pore Wall Structure of MCM-41 by Using Nitrogen Adsorption, Transmission Electron Microscopy, and X-ray Diffraction. J. Phys. Chem. B 2000, 104, 292–301. [Google Scholar] [CrossRef]
  24. Barrett, E.P.; Joyner, L.G.; Halenda, P.P. The determination of pore volume and area distributions in porous substances. I. computations from nitrogen isotherms. J. Am. Chem. Soc. 1951, 73, 373–380. [Google Scholar] [CrossRef]
  25. Ravikovitch, P.I.; O’Domhnaill, S.C.; Neimark, A.V.; Schiith, F.; Unger, K.K. Capillary Hysteresis in Nanopores: Theoretical and Experimental Studies of Nitrogen Adsorption on MCM-41. Langmuir 1995, 11, 4765–4772. [Google Scholar] [CrossRef]
  26. Brik, Y.; Kacimi, M.; Ziyad, M.; Bozon-Verduraz, F. Titania-Supported Cobalt and Cobalt–Phosphorus Catalysts: Characterization and Performances in Ethane Oxidative Dehydrogenation. J. Catal. 2001, 202, 118–128. [Google Scholar] [CrossRef]
  27. Jorio, A.; Pimenta, M.A.; Souza Filho, A.G.; Saito, R.; Dresselhaus, G.; Dresselhaus, M.S. Characterizing carbon nanotube samples with resonance Raman scattering Characterizing carbon nanotube samples with resonance Raman scattering. New J. Phys. 2012, 5, 1–11. [Google Scholar] [CrossRef]
  28. Dresselhaus, M.; Dresselhaus, G.; Jorio, A.; Souza Filho, A.; Saito, R. Raman spectroscopy on isolated single wall carbon nanotubes. Carbon 2002, 40, 2043–2061. [Google Scholar] [CrossRef]
  29. Dresselhaus, M.; Dresselhaus, G.; Saito, R.; Jorio, A. Raman spectroscopy of carbon nanotubes. Phys. Rep. 2005, 409, 47–99. [Google Scholar] [CrossRef]
  30. Niu, Z.; Fang, Y. Effects of synthesis time for synthesizing single-walled carbon nanotubes over Mo–Fe–MgO catalyst and suggested growth mechanism. J. Cryst. Growth 2006, 297, 228–233. [Google Scholar] [CrossRef]
  31. Wirth, C.T.; Zhang, C.; Zhong, G.; Hofmann, S.; Robertson, J. Diffusion- and Reaction-Limited Growth of Carbon Nanotube Forests. ACS Nano 2009, 3, 3560–3566. [Google Scholar] [CrossRef] [PubMed]
  32. Lee, C.J.; Park, J.; Huh, Y.; Yong Lee, J. Temperature effect on the growth of carbon nanotubes using thermal chemical vapor deposition. Chem. Phys. Lett. 2001, 343, 33–38. [Google Scholar] [CrossRef]
  33. Lee, Y.T.; Park, J.; Choi, Y.S.; Ryu, H.; Lee, H.J. Temperature-dependent growth of vertically aligned carbon nanotubes in the range 800–1100 °C. J. Phys. Chem. B 2002, 106, 7614–7618. [Google Scholar] [CrossRef]
  34. Branca, C.; Frusteri, F.; Magazu, V.; Mangione, A. Characterization of Carbon Nanotubes by TEM and Infrared Spectroscopy. J. Phys. Chem. B 2004, 108, 3469–3473. [Google Scholar] [CrossRef]
Figure 1. (A) Nitrogen adsorption isotherms of MCM-41–Co catalysts. (B) Offset added for each catalyst to differentiate curves and maximum slope of the capillary condensation step.
Carbon 04 00037 g001
Figure 2. (A) NLDFT pore size distribution of each MCM-41–Co catalyst. (B) Co6 NLDFT pore size distribution deconvolution using Gaussian functions.
Carbon 04 00037 g002
Figure 3. Diffuse reflectance UV–Vis of MCM-41–Co catalysts. The arrows point to the main absorption transitions.
Carbon 04 00037 g003
Figure 4. (A) Total carbon content after the CVD process. (B) Raman spectra of all CVD products arranged by the offset and (C) the RBM zone (150–350 cm−1) zoom of all Raman spectra.
Carbon 04 00037 g004aCarbon 04 00037 g004b
Figure 5. (A) Time effect on carbon deposition amount and (B) Raman characteristics of CVD deposition products as function of time.
Carbon 04 00037 g005
Figure 6. (A) Total carbon content dependency on methane flow rate and (B) complete Raman spectra of CVD products.
Carbon 04 00037 g006
Figure 7. (A) Total mass content of carbon and the G to D area ratio of CVD products and (B) the RBM distribution of CVD products.
Carbon 04 00037 g007
Figure 8. SEM micrograph of CVD products: (A) 800 °C, (B) 850 °C, (C) 900 °C, and (D) 950 °C.
Carbon 04 00037 g008
Table 1. Nitrogen adsorption results summary, BET surface area (SA), and pore diameter (PD) as the peak maximum in the NLDFT distribution.
CatalystSA (m2 g−1)PD (nm)
Co21115.33.9
Co3977.84.2
Co41057.24.1
Co5934.54.3
Co6873.74.4
Table 2. G-band and D-band ratio (G/D) of CVD products over MCM-41–Co.
CatalystG/D Area Ratio
Co21.53
Co36.86
Co42.03
Co53.77
Co63.12

