
Production and Quality Analysis of Wine from Honey and Coconut Milk Blend Using Saccharomyces cerevisiae

1
Department of Microbiology, Ibrahim Badamasi Babangida University, 911101 Lapai, Nigeria
2
Department of Food Science and Technology, Ibrahim Badamasi Babangida University, 911101 Lapai, Nigeria
3
Department of Microbiology, Federal Polytechnics, 912101 Bida, Nigeria
*
Author to whom correspondence should be addressed.
Fermentation 2017, 3(2), 16; https://doi.org/10.3390/fermentation3020016
Submission received: 6 February 2017
/
Revised: 14 April 2017
/
Accepted: 20 April 2017
/
Published: 26 April 2017
(This article belongs to the Special Issue Microbiology and Food Hygiene)
Abstract
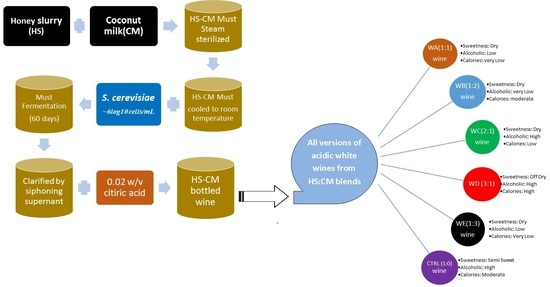
:Honey is a high-sugar jelly-like substance produced by bees from flower nectar, and coconut milk is the creamy (rich in fat and minerals) extract of coconut meat (endosperm). Studies on honey-fruit wines are scant, and mostly documented in unpublished or personal blogs. This study produced honey–coconut wine using Saccharomyces cerevisiae. Honey slurry (HS, a 100% diluted honey) was mixed with undiluted coconut milk (CM) at varying ratios to obtain six wine (W) versions (HS:CM) designated as WA (1:1), WB (1:2), WC (2:1), WD (3:1), WE (1:3), and control was coded as CTRL (1:0). Each version (1800 mL) was inoculated with 200 mL (~6.0 log10 cfu/mL) of S. cerevisiae, fermented (25 ± 2 °C) for 60 days, degassed and agitated every 2 days, pasteurized to stop fermentation, and clarified by siphoning the supernatant. Irrespective of the wine version, the optimum range of microbial growth and duration for HS-CM wines were 8.1–8.2 log10 cfu/mL and 25–30 days respectively. Most enological (pH, total acidity, and free SO2) and physicochemical (temperature and fermentation velocity) parameters were relatively stable across all wine versions. However, fermentative capacity and degree, and alcoholic and caloric contents were proportional to the quantity of HS. Sensory rating of wines by 50 assessors were in the decreasing order of CTRL > WC > WD > WA > WE > WB. Conclusively, honey–coconut wines are acidic wines and could be dry or semi-sweet wines, low to high alcoholic wines, or very low to moderate caloric wines, depending on the quantity of honey added. This study observed a correlation of more than 95% precision between wine compositions (HS:CM) and wine qualities (alcoholic and caloric contents). Thus, models of enological parameters would enhance HS-CM winemaking process.
1. Introduction
Over the decades, the definition of wine as an alcoholic beverage derived from fermented grape juice has been attributed to other alcoholic beverages from fermented fruits and vegetables. Fermented beverages and alcoholic drinks are culturally and socially accepted products for consumption, drinking, entertainment, customary practices, and religious purposes. Across the globe (Europe, America, Australia, Asia, and recently, Africa), winemaking processes are popular [1,2]. Honey wines have ancient history in Asia, and were regarded as the beverage for the nobles and gods, for spiritual wisdom and life [3].
Honey is a sweet (mostly consisting of monosaccharides of fructose and glucose) jelly-like substance made from the nectar of flowers by bees. The high sugar content present in honey predisposes it as a good substrate for yeast fermentation to produce alcohol and carbondioxide gas. Different fermentation technologies have been applied to achieve various degrees of alcoholic honey beverages, popularly called mead [4]. Most processes undertake a minimum of 21 days fermentation to achieve 7.6%–22% alcoholic content [3,5]. Compared to other fermented foods, alcoholic beverages of honey-fruit mixtures have mostly been documented in personal blogs, as well as unpublished and scant published studies [6]. There are studies on honey-fruit meads from mixtures of honey with fruits and vegetables such as apple, banana, berry, soya, grape, etc. [3]. Coconut fruit juice or extract is another potential source that could be mixed with honey for mead production. Coconut (Cocos nucifera L.) fruit is characterized by its outer hard shell and inner white meat (endosperm). Coconut milk is a liquid extract of grated and squeezed white meat of coconut which is highly rich in fat, minerals, and vitamins. The health merits of this nutrient-rich juice availed its choice as a blend for coconut-honey wine in this study.
Natural and controlled fermented beverages are predominated by flavour-enhancing lactic acid bacteria, mycelial fungi (Mucor, Rhizopus, Amylomyces, etc.), and associated yeasts, such as Schizosaccharomyces, Candida, Torulopsis, Zygosaccharomyces; prominent among them are Saccharomyces species [7]. Unique strains of S. cerevisiae are involved in the fermentation of most fruits and vegetables, with high alcohol content upto 20%, and acceptable flavour and aroma [8]. Different alcoholic beverages in the market depend on the raw materials, sugar source, fermenting chamber, microbial flora, and fermenting conditions such as temperature, pH, redox potential [3,8,9]. Apart from economic gains, nutritional and health benefits were among the major reasons for the popularity of fermented beverages. However, scant or no literature of honey–coconut wine exists within the purview of Nigeria and the globe in general. Thus, this study was designed to produce and optimize honey–coconut wine using Saccharomyces cerevisiae.
2. Materials and Methods
2.1. Sample Collection/Preparation
A total of 6 kg of freshly harvested honey were purchased from a local honeybee farmer and coconut fruits were purchased from local markets, both from Lapai, Niger state, Nigeria. Honey and coconuts were transported in clean plastic bottles (<4 °C) and plastic bags, respectively, to the Microbiology laboratory, Ibrahim Badamasi Babangida University. Honey and coconuts were stored at refrigerator and room temperature, respectively, prior to preparation and fermentation.
2.2. Preparation of Inoculum Starter Culture
From the laboratory repository, pure colonies of S. cerevisiae (starter culture) were verified in potato dextrose broth (PDB) incubated at ambient temperature for 24 h with relevant biochemical assay. The starter cultures were primed in sterile honey–coconut mixture juices for 3–6 h, standardized (~6.0 log10 cfu/mL), and stored at 4 °C [2].
2.3. Preparation and Fermentation Protocol
Fresh white meat (endosperm) of coconut fruits was extracted, sorted, washed, and homogenized (with industrial electric blender) to smooth slurry. Creamy juices were pressed out from the slurries, sieved with muslin bags, and labelled as coconut milk (CM). Honey was diluted with distilled water at the ratio of 1:1 and labelled as honey slurry (HS).
Six sets of 2000 mL long-necked round-bottom glass flasks were washed and labelled with the following codes WA (1:1), WB (1:2), WC (2:1), WD (3:1), WE (1:3), and control as CTRL (1:0). The ratios in parentheses denote the mixture ratio of HS:CM of each tagged flask to the maximum of 1800 mL. This means that WA was a mixture of 900 mL HS + 900 mL CM, WB (600 mL HS + 1200 mL CM), WC (1200 mL HS + 600 mL CM), WD (1350 mL HS + 450 mL CM), WE (450 mL HS + 1350 mL CM), and CTRL (1800 mL HS only). The glass flasks were sealed with airtight gas valve and steam sterilized (121 °C at 15 psi for 15 min) and allowed to cool at ambient temperature below 35 °C before the addition of 200 mL of standardized starter culture (~6.0 log10 cfu/mL) and vigorous agitation for 2 min. The setups were fermented for 60 days at room temperature (25 ± 2 °C), periodically agitated, and degassed at 2-day intervals. The wines were pasteurized (50–60 °C) for 15 min to stop fermentation. Clarified wines (by siphoning supernatant of wine sediments into clean bottle) were bottled in 1000 mL glass vessels seeded with 5 mL of citric acid (0.02 w/v) solution to limit bacterial growth.
2.4. Specific Gravity
Specific gravity (SG) was determined by measuring 50 mL of the sample into a measuring cylinder at 20 °C; and a hydrometer was dipped into it to determine the specific gravity (with appropriate temperature correction factor). The percentage alcohol content, calories, residual sugar (RS), apparent fermentation degree (AFD), fermentative capacity (VC), fermentation velocity (FV), and attenuation were then calculated based on specific gravity chart [10,11,12].
2.5. Proximate Compositionand Physicochemical Analysis
Nutritional proximate composition of HS and CM mixtures were analysed with AOAC (Association of Official Analytical Chemists) methods [13], and selected physicochemical parameters (titratable acidity, pH, and temperature) were assessed using the methods of [13,14] with slight modifications [2]. Ambient temperature and pH were determined with a dual pH and temperature portable digital device (Jenway 3510, Camlab, UK). Probes of pH and temperature were dipped into a 50 mL sample for 2 min (for stable reading). Recorded data were means of triplicate values. Total titratable acidity (TTA) was assessed by titrating 10 mL of sample with 0.1 M of NaOH to obtain 7.1 neutral pH. The titre of NaOH was used to calculate the TTA (7.5 × 0.1 × titre value) and expressed in g/L; tartaric acid and volatile acidity (VA = 6 × 0.1 × titre value) was calculated and expressed in g/L; acetic acid using OIV (International Organization of Vine and Wine) methods [14]. Free SO2 was calculated as described by [15].
2.6. Sensory Evaluation
A total of 50 assessors (trained and untrained) from staff and students of IBB University Lapai community were selected to evaluate the wines using a seven-point hedonic scale. Only +18 years old assessors (those with prior exposure and no exposure to alcoholic beverages) were selected to limit biased responds. Prior to sensory evaluation, ISO standards [16] for selection, training (≥2 days) and monitoring of assessors (ISO 8586:2012), design of testing room (ISO 8589:2010), and methodology of monitoring performance of sensory panel (ISO 11132:2009) were followed. Each assessor was served with approximately 50 mL of test sample (18 ± 2 °C) with 250 mL wine tasting glasses (ISO 3591:1977); results were ranked (ISO 8587:2006) and expressed in accordance with the sensory vocabulary (ISO 5492:2008 en).
2.7. Microbial Analysis
Microbial population of wines was evaluated using PDA (yeast), Nutrient Agar (bacteria), and relevant biochemical assays, in accordance with the methods of [17]. Four periodic microbial samplings were done at 15-day intervals to determine the microbial kinetic profile of the system.
2.8. Statistical Analysis
All data generated from this study were subjected to relevant statistical tools (ANOVA, Chi-square, and Duncan’s Multiple Range Test) using SAS statistical software (Version 8, SAS Institute, Cary, NC, USA) and SPSS software (version 20 of 2014), and significance was taken at 95% confidence level.
3. Results and Discussion
Table 1 shows the nutritional and physicochemical qualities of raw materials before fermentation to various wine versions. Dilution of raw honey (RH) with distilled water to form honey slurry (HS) significantly altered the composition (moisture, sugar, ash, and fat contents) by ~45–50% and physicochemical properties (pH and specific gravity) by 6.8–20%. High fat content (18.3%) accounted for low specific gravity (0.995) of CM, and this invariably accounts for the poor alcoholic content of WB and WE with double- and triple-fold CM ratios, respectively, more than HS ratio. The pH (4.05–4.35) and specific gravities (1.1250–1.4231) of RH and HS were within the range of previous reports [3,18,19].
A steady progressive microbial growth profile (6.0 log10 cfu/mL to 8.6 log10 cfu/mL) within 60 days of fermentation was observed. Five sequential sampling intervals at day-0, day-15, day-30, day-45, and day-60 had mean kinetic rate of 6.0 log10 cfu/mL, 7.8 log10 cfu/mL, 8.2 log10 cfu/mL, 8.4 log10 cfu/mL, and 8.2 log10 cfu/mL, respectively. Dynamic microbial kinetics was resolved (R2 = 0.971) with 4th polynomial model of Y = −0.000006β4 + 0.000β3− 0.008β2 + 0.213β + 6.0 (Figure 1). From the resolved microbial dynamic curve, optimum microbial kinetics (8.15–8.20 log10 cfu/mL) was attained within 25–30 days, regardless of the version of HS-CM wine involved.
Volatile acidity could be used as a measure of acetic acid content in beverages in combination with other parameters (off-odour and haziness) as an indicator for sensory and microbial quality of wines. Extremely high volatile acidity (7.50–11.58 g/L) level observed across all the wine blends (Table 2) might be erroneously adjudged as legally unacceptable or spoiled wine due to high level of acetic acid produced by either bacteria or yeasts (e.g., Saccharomyces or Brettanomyces spp). This is not true for untreated wine with high accumulation of volatile acids during primary fermentation, as pre and post bottling treatments (reverse osmosis, sterile filtration, SO2, distillation, dilution) effectively diminish volatile acidity level [20]. Sluggish fermentation as observed in this study [20] and other conditional factors such as incubating beyond 26 days at ~28 °C and headspace exposed to O2) [20,21], enhance volatile acidity level of wines. Perhaps, the lengthy fermentation period (60 days at 26–27 °C) could have played a role in the volatile acidity level observed in this study. Correlation between HS ratios and volatile acidity of wines, suggests that volatile acids accumulated during primary fermentation. This means that nutritional configuration of HS modulates the metabolic pathway of S. cerevisiae to accumulate volatile acids. However, it was argued that volatile acids are significantly composed of distillable acids such as carbonic acids (released as CO2), sulfurous acid (SO2) and various organic acids [21]. It is also important to note that clarification process play a significant role in retaining odourless components of wines’ volatile acids. Cold clarification procedures as adopted in this study, increasingly reconstitute the volatile acidity of wine through excessive elimination of solid matters, unlike the clarification by centrifuge [22]. There seems to be no consistent correlation between volatile acidity and the mixing ratio of wines. Contrarily to volatile acidity, TTAs of wines (12.5 to 19.3 g/L) were proportional to the HS ratios such that an overall increasing order (WB > WA > WC > WD> CTRL > WE) was observed (Table 2). However, residual sugar correlates with HS ratio in the wines, though not beyond the limits observed in previous report [3]. A phenomenal correlation exists between fermentative capacity and apparent fermentation degree of the wines, as both parameters measure (sugar utilization) the quantity and rate of sugar utilization, respectively. Fermentation velocity tends to measure the percentage or rate of sugar conversion to alcohol. It was observed that WC had the best rate (0.99), and other wine versions ranged from 0.51 to 0.65. These values were significantly low compared to literature data (4.9–6.7 [23]). This is suggestive of sluggish fermentation that encourages volatile acidity accumulation during primary fermentation [21]. It is possible that the chemical configuration, heat treatment of juice, and length of fermentation diminished the overall fermentation velocity. Free SO2 contents (4.30–39.34 mg/L) of all wine blends were higher than the minimum (≥3 mg/L) requirement to limit Zygosaccharomyces-induced wine spoilage [24]. The high free SO2 observed in the wine may account for the stability of all wine versions for 30 days beyond the optimum kinetics.
Only temperature (26.0–27.0 °C) and pH (4.10–4.20) were relatively stable among the assessed wines. Similar to this study, most previous studies [11,24,25] on fruit and vegetable wines reported acidic beverages of pH below 6.0. Apparent attenuation as a measure of percentage sugar conversion rate seemed to be proportional to the amount of honey, such that WA, WB, WC, CTRL, WD, and WE were 94.50%, 81.78%, 98.63%, 91.27%, 97.6%, and 72.81%, respectively. A similar trend was observed in the initial specific gravities (1.0081–1.1332) of wine blends prior to fermentation. However, no trend was observed in final specific gravities (1.0013–1.0055) of wines after fermentations (Table 2).
Nutritional compositions of all wines had moisture contents between 89.83% and 96.98% in decreasing order of WE, WA, WB, WD, and WC. The moisture contents were significantly different (p < 0.05), and do not have any remarkable relationship to the mixing ratios of the various wine blends. Similarly, ash contents (0.01%–0.03%) of wines were neither significant (p < 0.05) nor proportional to HS–CM ratio. Total carbohydrate content of WC (10.16%) was highest, followed by WD (8.75%), WB (7.32%), WA (5.67%), and WE (3.01%). However, total protein, crude fiber, and fat were not detected in all wine versions (Table 3).
In decreasing order, alcoholic contents of wines WD, CTRL, WC, WA, WE, and WB were 173.3, 155, 145, 42.5, 9.2 and 9.0 g/L,respectively. The range of alcoholic contents observed in this study were within the limits (70–220 g/L) reported in previous study [3]. Similar pattern was observed for caloric content, with WD (234.4%), CTRL (83.86%), WC (78.45%), WA (22.99%), WE (4.98%), and the least was WB, with 4.87%. The alcoholic and caloric models strongly correlate to the amount of HS and CM of wines at coefficient (R2) of 0.983 and 0.961, respectively (Figure 2). Similarly, the study by Umeh et al. [24] optimized a pineapple wine production process using response surface methodology (RSM) models of pH, time, sugar, and yeast concentrations as indicators with R2 range of 0.7994–0.8617. This supported the opinion of the authors of this study that caloric and alcoholic contents are possible winery model indicators with assumed precision of 96% (p = 0.04) and 98% (p = 0.02), respectively. However, bioethanol quantity and quality depend mainly on the primary metabolites and microbial consortium of the system [26]. Apart from nutritional factors, technologies of fermentation, enzyme and metabolic engineering were necessary to optimize ethanol yield [27].
The crests of the models predict the optimum honey–coconut blend ratios for maximum yield of wine qualities (alcohol, calories, and sweetness) predicated on the fermentation parameter. Thus, since the crest of both alcohol and caloric curves occurred at CTRL and between WC and WD, this validates the sensory assessors’ evaluation that strongly preferred WC, WD, and CTRL.
Closer observation revealed that honey–coconut blend (WA, WB, and WE) ratios 1:1, 1:2, and 1:3 adversely affected the overall yield prospect of the winery system. Invariably, WC (2:1) would be best for low-calorie wine seekers, while WD (3:1) blends would be the customers’ option when seeking high caloric value wine. This may be the pioneer study to have this line of thought in honey–coconut winery formulation. The findings of this study will enrich the repositories of winery databases with fundamental data for further analyses on honey–coconut wines.
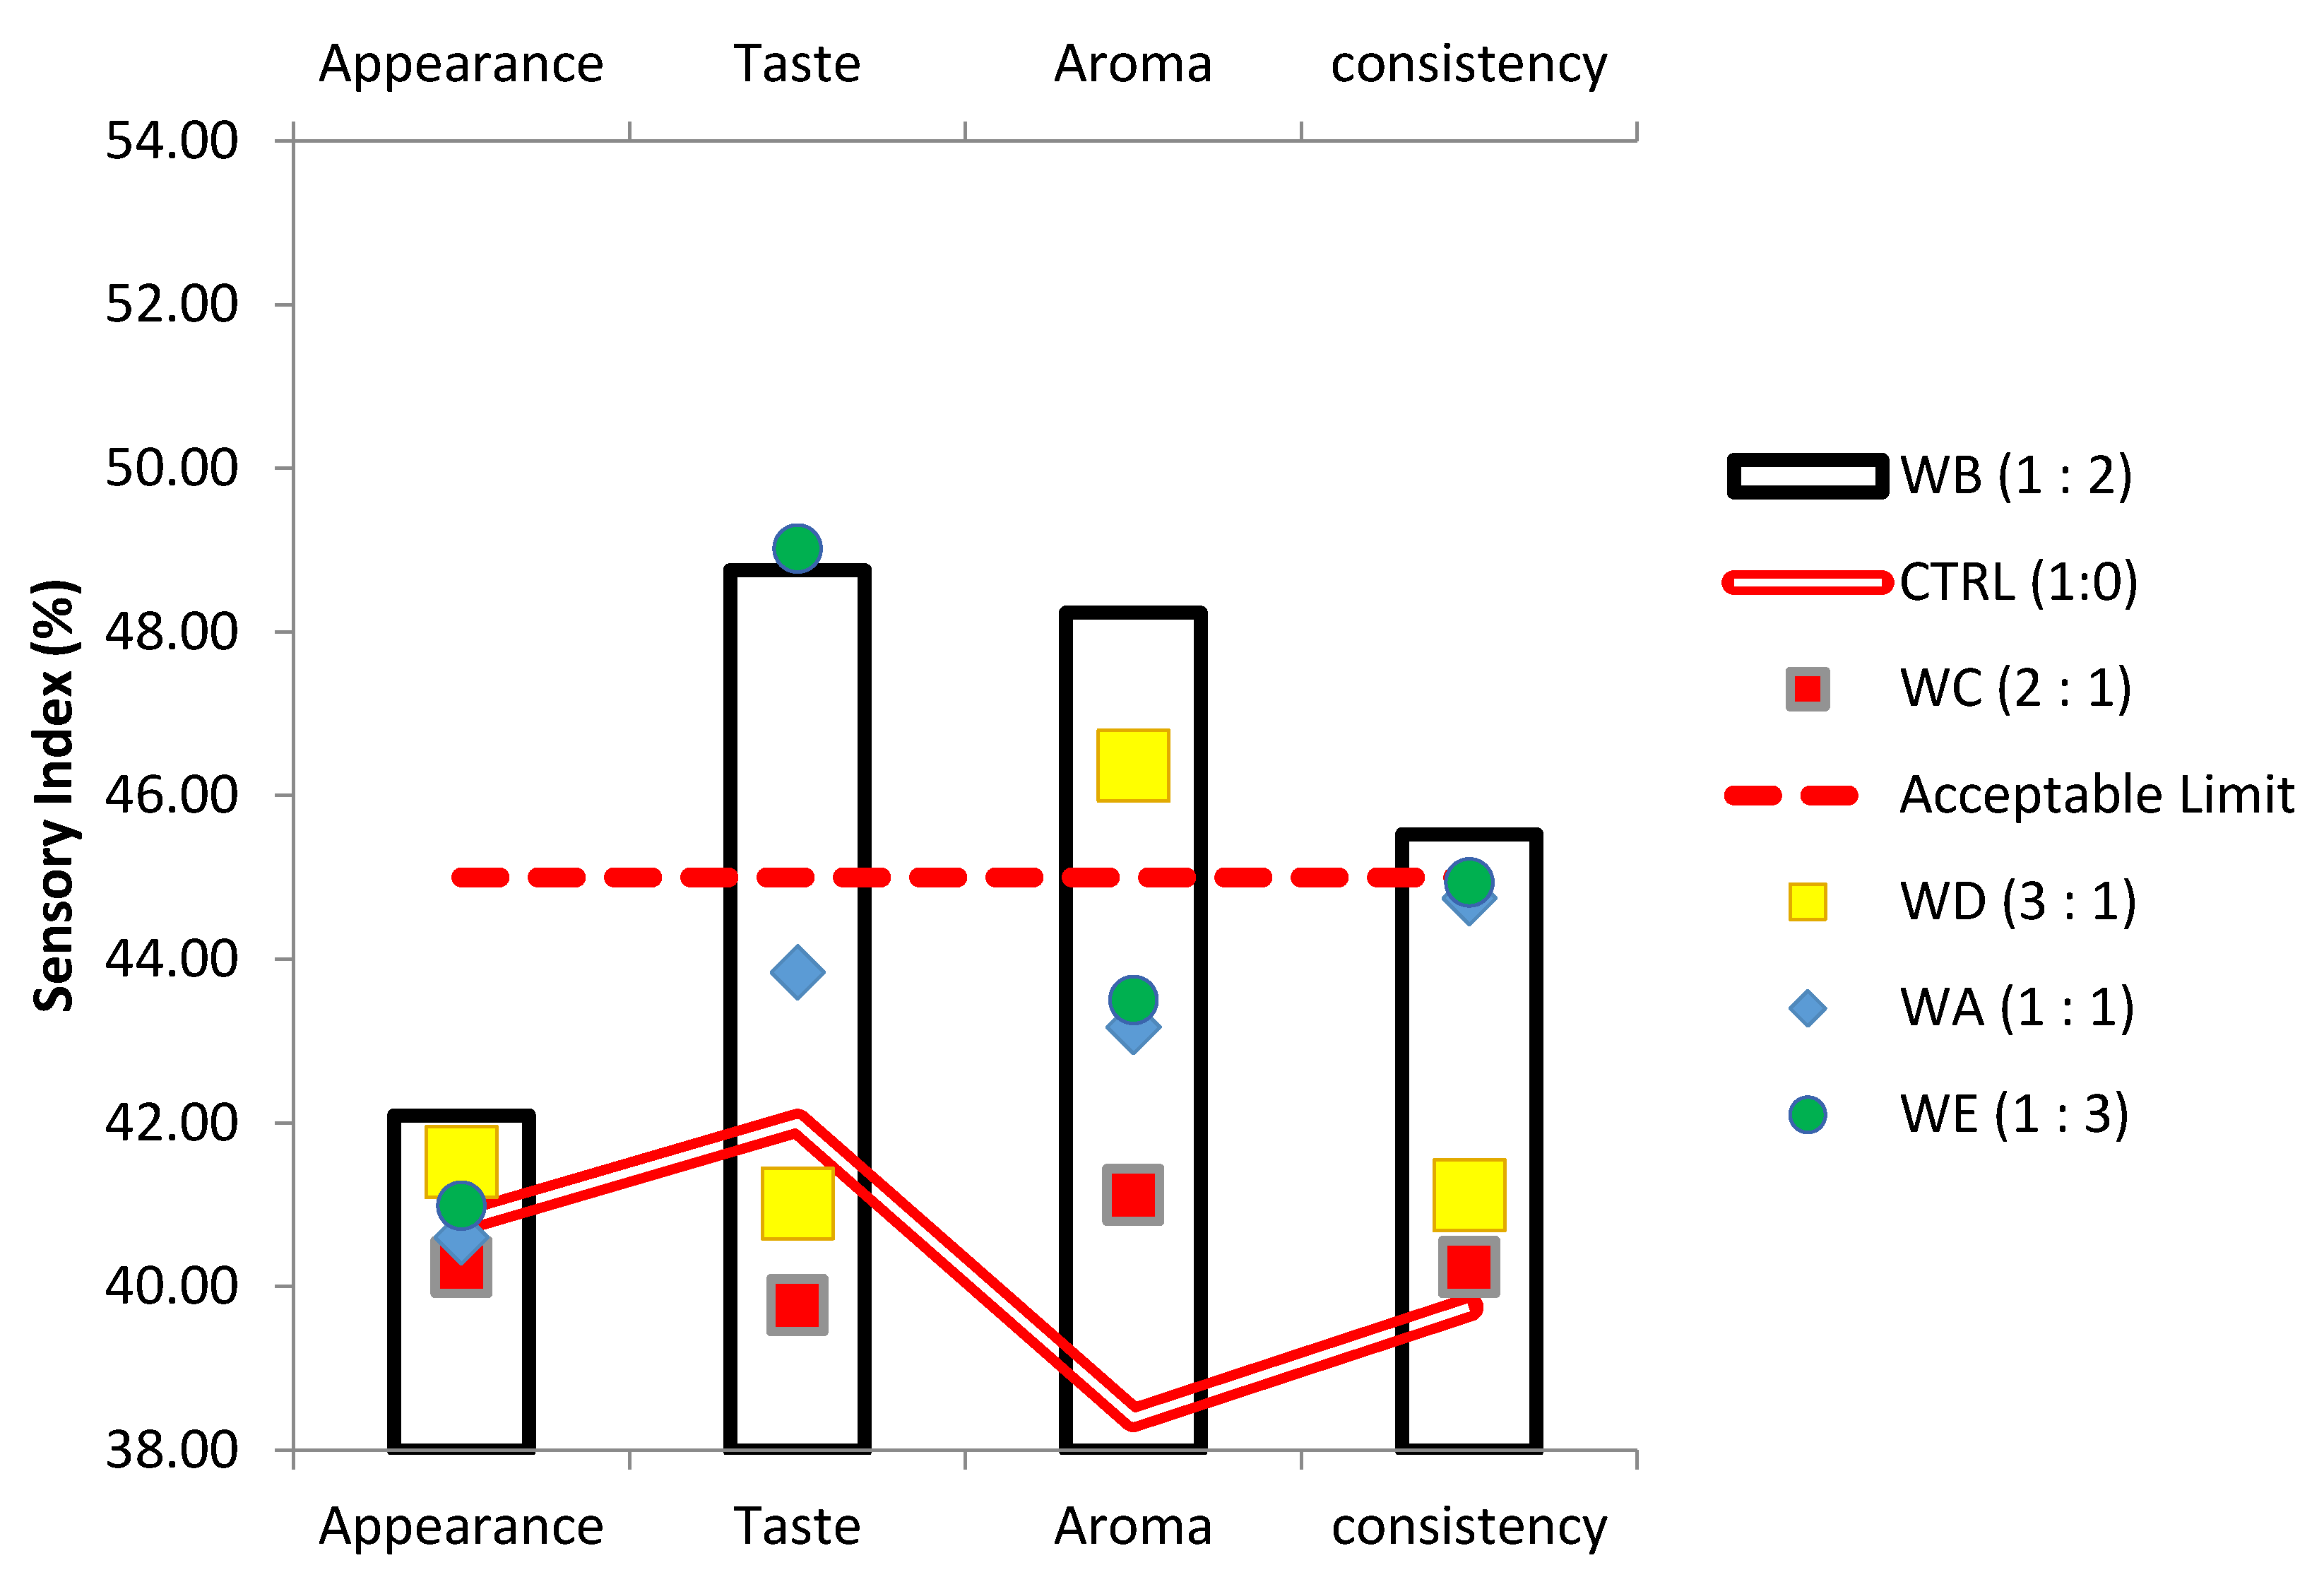
Among the sensory properties of the wines, only taste of WB (48.75%) and WE (49.02), and aroma of WB (48.24) and WD (46.36%) were strongly disliked. However, consistency rates of WA (44.75%), WB (45.36%), and WE (44.94%) were at the borderlines. All other parameters of wine versions were liked strongly by assessors. WC had the overall best rating (39.77%–41.12%), followed by CTRL (38.40%–42.0%), WA (40.60%–44.75%), WD (41.02%–46.36%), WB (42.09%–48.75%), and the least was WE, with 40.99%–49.02% (Figure 3).
None of the wines had the same cumulative derived quality rating, such that each version differed from each other in at least one quality. Among all the wine versions, sweetness qualities ranged from dry, to off-dry, to semi-sweet, and caloric qualities of wines were from very low to high. All wine versions were acidic, and the alcoholic ratings were between the spectrum of low, moderate, to high (Table 4). Sweetness quality of wines depends on the amount of residual sugar present in wine; thus, wines (WA, WB, WC, and WE) with <10 g/L residual sugar were classified as dry wines, but WD and CTRL with >10 g/L and >20 g/L residual sugars were classified as off-dry and semi-sweet wines, respectively. It seems that an increase in honey ratio invariably enhances the sweetness of wine. This may be attributed to the high reducing sugar content in honey. Similarly, the calories rating of the wines were proportional to the honey content of the mixture. All the wine versions were tagged acidic based on pH values, and this corroborated with the high total titratable acidity recorded across all versions. Neither the honey nor the coconut milk had correlation to the pH of the wines, as all the wines irrespective of the mixture ratio were acidic in nature. Invariably, the metabolic pathway of S. cerevisiae would account for this phenomenon. The acidic nature of the wines is a positive factor that would naturally limit bacterial spoilage during ageing in the absence of preservatives. The acidic and free SO2 qualities of all wine versions synergistically limit most microbial spoilers of wine in the absence of preservatives.
4. Conclusions
In conclusion, honey–coconut wines are stable acidic, but qualities such as sweetness (dry to semi-sweet), caloric (very low to moderate) and alcoholic (low to high) depend on the honey composition of the blend. Models of microbial kinetics and wine compositions (HS:CM) vs. wine qualities with high correlations (>95%) would be a valuable analytical tool to predict HS-CM wine-making process with reliable precision.
Author Contributions
Tochukwu V. Balogu and Oyinloye Towobola conceived and designed the experiments; Tochukwu V. Balogu and Oyinloye Towobola performed the experiments; Tochukwu V. Balogu analyzed the data; Oyinloye Towobola contributed reagents/materials/analysis tools; Tochukwu V. Balogu wrote the paper.
Conflicts of Interest
The authors declare no conflict of interest.
References
- Steinkraus, K.H. Fermentation in World Food Processing. Compr. Rev. Food Sci. Food Saf. 2002, 1, 23–27. [Google Scholar] [CrossRef]
- Balogu, T.V.; Abdulkadir, A.; Ikegwu, M.T.; Akpadolu, B.; Akpadolu, K. Production and Sensory Evaluation of Non-Alcoholic Wine from Sugarcane and Tiger Nut Blend Using Saccharomyces cerevisiae. Int. J. BioSci. Agric. Technol. 2016, 7, 7–14. [Google Scholar]
- Gupta, J.K.; Sharma, R. Production Technology and quality characteristics of mead and fruit-honey wines. Nat. Prod. Radiance 2009, 8, 345–355. [Google Scholar]
- Kraus, E.C. Mead (Honey) Wine. Copyright of Home Wine & Beer Making Supplies. 2012. Available online: www.eckraus.com (accessed on 27 January 2017).
- Rhim, J.W.; Kim, D.H.; Jung, S.I. Production of Fermented Honey Wine. Korean J. Food Sci. Technol. 1997, 29, 337–342. [Google Scholar]
- Sarba, A.C. Obtaining Different Types of Wine Products from Honey. Unpublished. Ph.D. Thesis, Doctoral School of Engineering, Faculty of Animal Breeding and Biotechnologies, University of Agricultural Science and Veterinary Medicine, Cluj-Napoca, Romania, 2015. Available online: http://www.usamvcluj.ro/en/files/teze/en/2015/sarba.pdf (accessed on 22 March 2017).
- Tamang, J.P.; Tamang, B.; Schillinger, U.; Guigas, C.; Holzapfel, W.H. Functional properties of lactic acid bacteria isolated from ethnic fermented vegetables of the Himalayas. Int. J. Food Microbiol. 2009, 135, 28–33. [Google Scholar] [CrossRef] [PubMed]
- Jyoti, P.T.; Kasipathy, K. Fermented Food and Beverage of the World; CRC Press: London, UK; New York, NY, USA, 2010; pp. 114–116. [Google Scholar]
- Battcock, M.; Azam-Ali, S. Fermented Fruits and Vegetables: A Global Perspective; FAO Agricultural Services Bulletin No. 134; FAO: Roma, Italy, 1998; Available online: http://www.fao.org/docrep/x0560e/x0560e00.htm (accessed on 28 March 2017).
- American Society for Brewing Chemists (ASBC). Methods of Analysis of ABSC, 14th ed.; ASBC: Saint Paul, MN, USA, 2011. [Google Scholar]
- May, D.; Sharpe, A. The Only Wine Book You’ll Ever Need; Adams Media, F + W Publication Company: Cincinnati, OH, USA, 2004; p. 275. [Google Scholar]
- Delfini, C.; Formica, J.V. Wine Microbiology: Science and Technology (Food Science and Technology); CRC Press: Boca Raton, FL, USA, 2001; p. 496. [Google Scholar]
- Association of Official Analytical Chemists (AOAC). Official Method of Analysis, 16th ed.; Association of Official Analytical Chemists: Arlington, VA, USA, 1999; Volume 11. [Google Scholar]
- OIV: Organization of Compendium of International Methods of Wine and Must Analysis, 2012 Edition. Available online: https://www.scribd.com/document/324259472/Metodos-Analisis-Vol-2-OIV (accessed on 15 March 2017).
- Coelho, J.M.; Howe, P.A.; Sacks, G.L. A Headspace Gas Detection Tube Method for Measurement of SO2 in Wine without Disruption of Sulfur Dioxide Equilibria. Am. J. Enol. Vitic. 2015, 66, 257–265. [Google Scholar] [CrossRef]
- International Standard Organization (ISO). Sensory Analysis Standards. 2017. Available online: https://www.iso.org (accessed on 22 March 2017).
- Cowan, S.T.; Steel, K.J. Manual for the Identification of Medical Bacteria, 3rd ed.; Cambridge University Press: London, UK, 2004; p. 331. [Google Scholar]
- Buba, F.; Gidado, A.; Shugaba, A. Physicochemical and Microbiological Properties of Honey from North East Nigeria. Biochem. Anal. Biochem. 2013, 2, 142. [Google Scholar] [CrossRef]
- Awada, M.H.; Elgornazi, A.M. Physicochemical characterization of honey from KasrKhiar and Garaboli areas-Libya. Asian J. Plant Sci. Res. 2016, 6, 8–12. [Google Scholar]
- Zoecklein, B.Z.; Fugelsang, F.C.; Gump, B.H.; Nury, F.S. Wine analysis and production; Springer: New York, NY, USA, 2005. [Google Scholar]
- Gardner, D. Volatile Acidity in Wine: Wine Made Easy. Available online: http://extension.psu.edu/food/enology/wine-production/wine-made-easy-fact-sheets/volatile-acidity-in-wine/extension_publication_file (accessed on 15 March 2017).
- Fugelsang, K.C.; Edwards, C.G. Wine Microbiology: Practical Applications and Procedures, 2nd ed.; Springer: New York, NY, USA, 2007; p. 381. [Google Scholar]
- Cordero-Bueso, G.; Esteve-Zarzoso, B.; Gil-Díaz, M.; García, M.; Cabellos, J.M.; Arroyo, T. Improvement of Malvar Wine Quality by Use of Locally-Selected Saccharomyces cerevisiae Strains. Fermentation 2016, 2, 1–13. [Google Scholar] [CrossRef]
- Umeh, J.I.; Ejikeme, P.C.N.; Egbuna, S.O. Optimization of Process Conditions for Alcoholic Wine Production from Pineapple Using RSM. Int. J. Multidiscip. Sci. Eng. 2015, 6, 23–30. [Google Scholar]
- Reddy, L.V.; Reddy, O.V.S. Production, optimization and characterization of wine from Mango (Mangiferaindica Linn.). Nat. Prod. Radiance 2009, 8, 426–435. [Google Scholar]
- Sanchez, S.; Demain, A.L. Metabolic Regulation and Overproduction of Primary Metabolites. Microbiol. Biotechnol. 2008, 1, 283–319. [Google Scholar] [CrossRef] [PubMed]
- Hahn-Hagerdal, B.; Galbe, M.; Gorwa-Grauslund, M.F.; Liden, G.; Zacchi, G. Bio-ethanol—The fuel of tomorrow from the residues of today. Trends Biotechnol. 2006, 24, 549–556. [Google Scholar] [CrossRef] [PubMed]
Figure 1.
Overall microbial dynamic of honey–coconut wine blends fermented for 60 days. NB: ◆= mean of triplicate values; ⼯ = standard error of mean plot; .....= optimum kinetics.
Figure 1.
Overall microbial dynamic of honey–coconut wine blends fermented for 60 days. NB: ◆= mean of triplicate values; ⼯ = standard error of mean plot; .....= optimum kinetics.
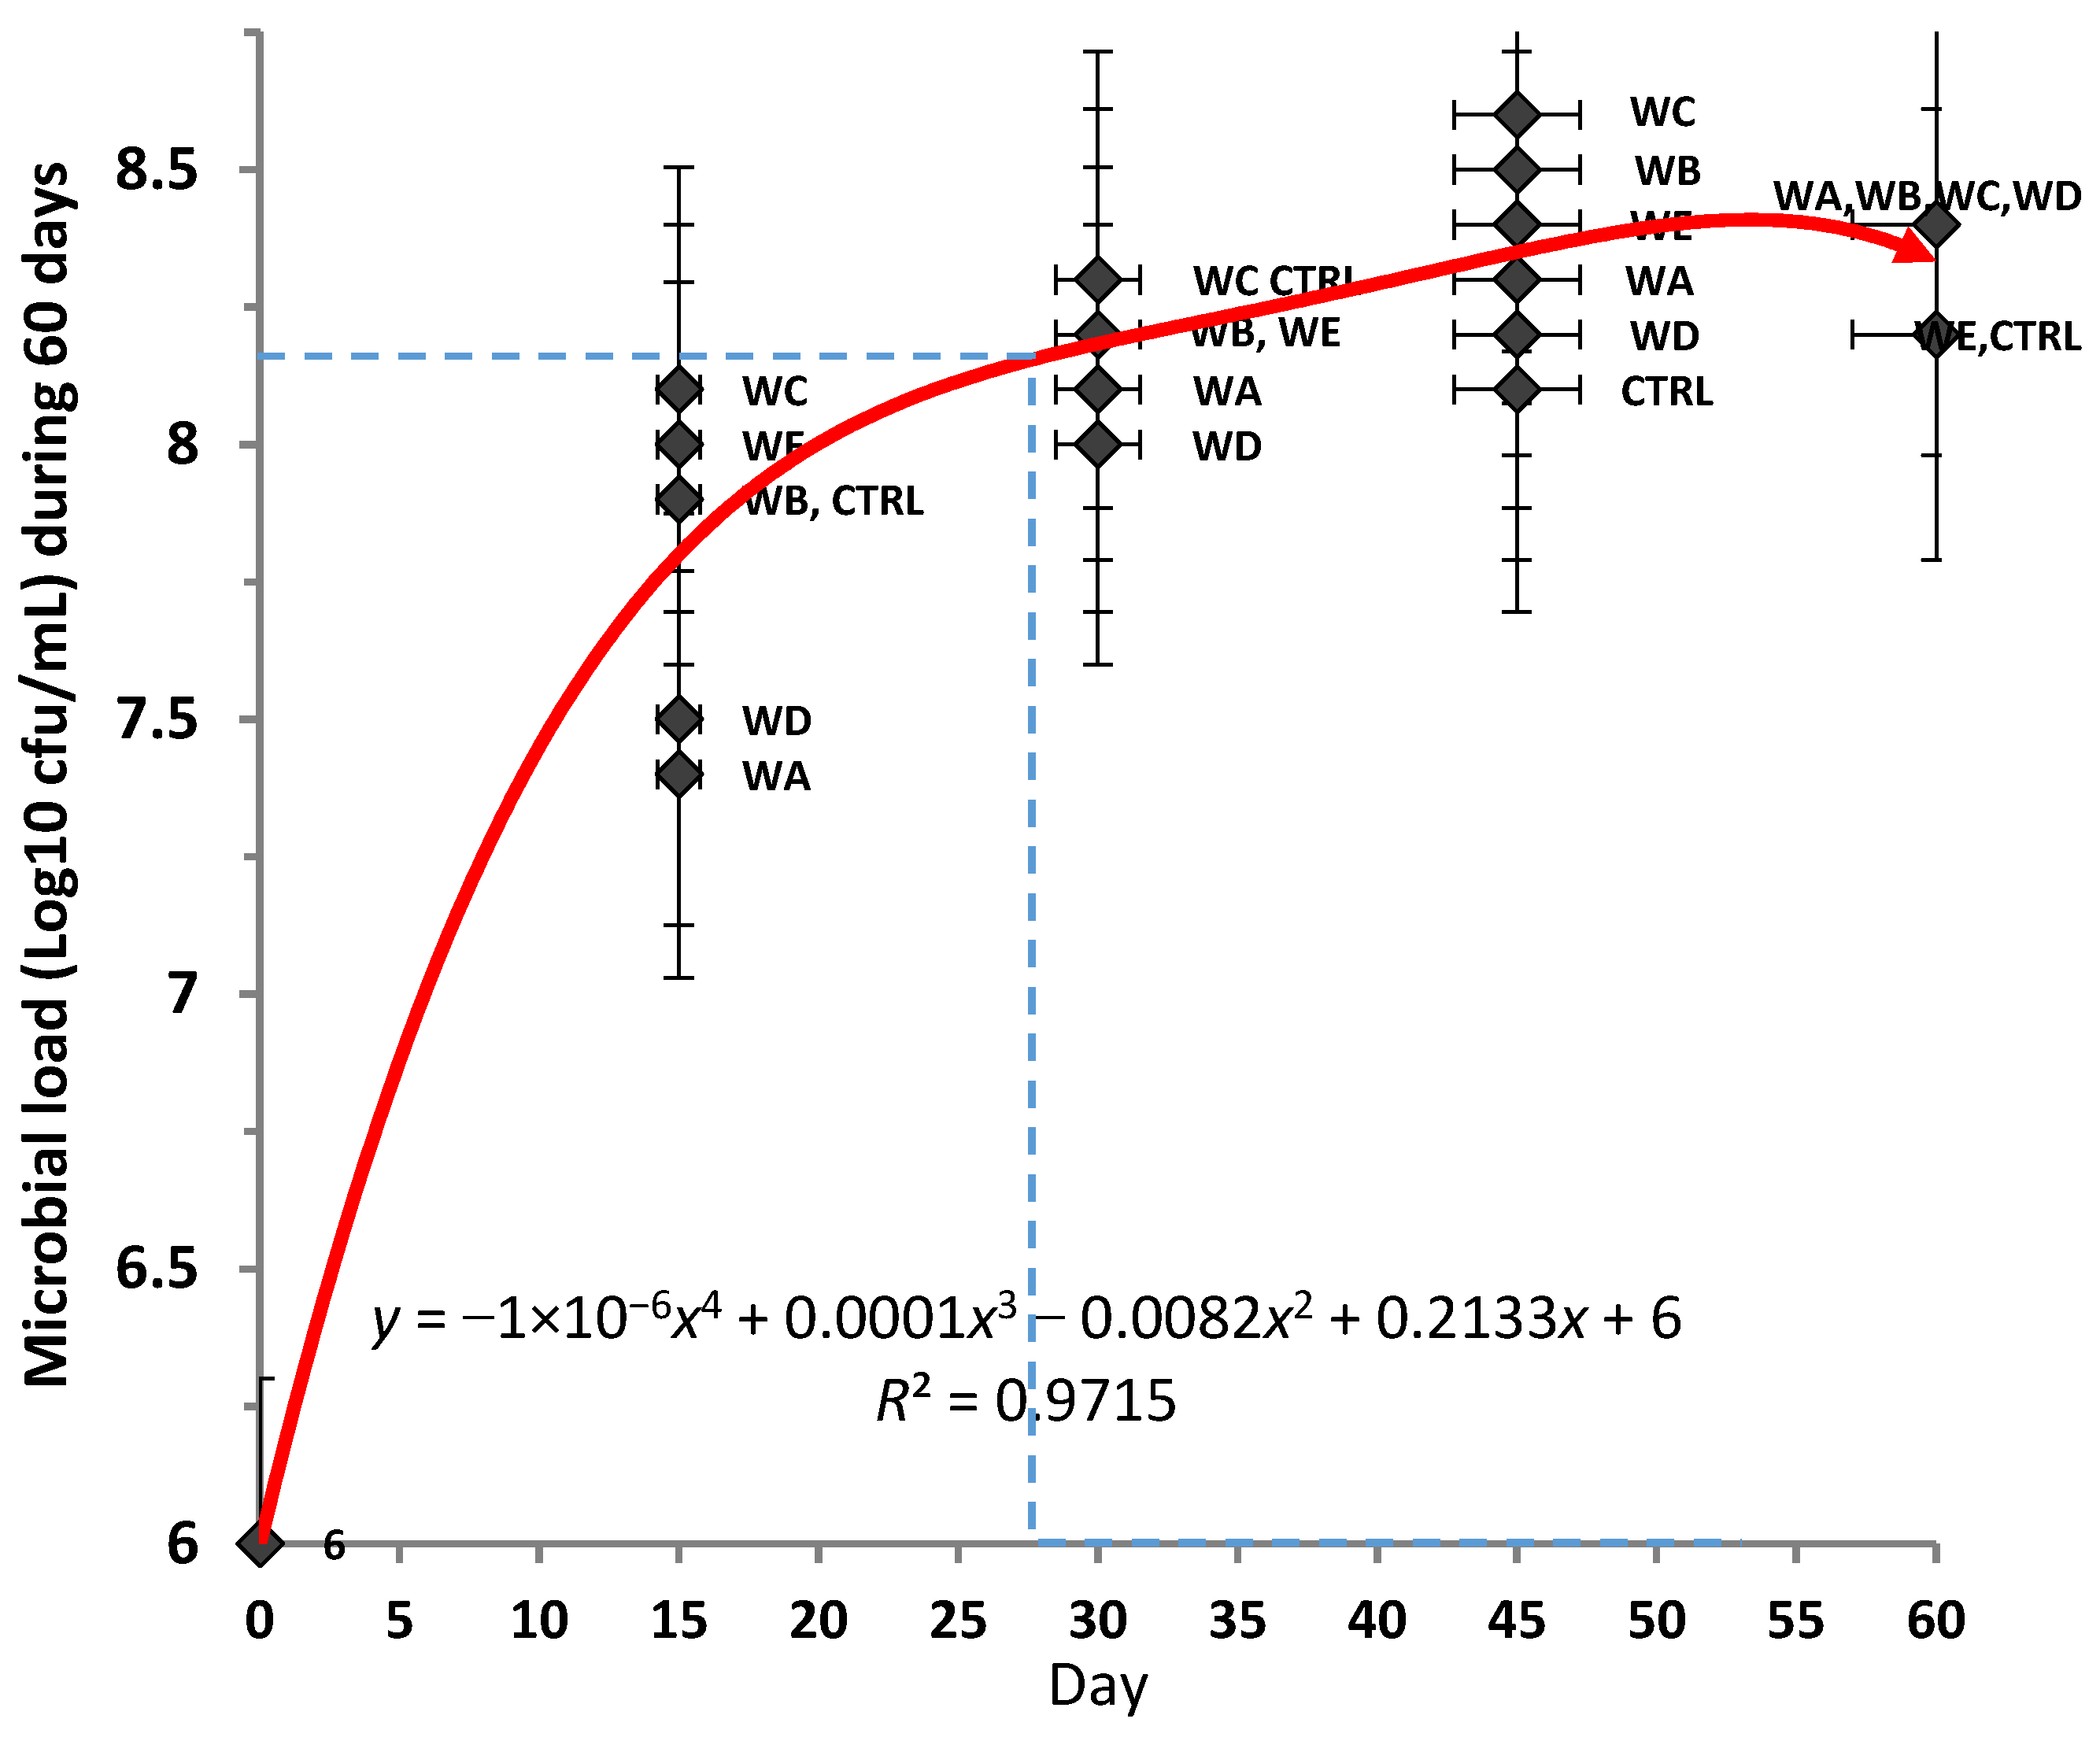
Figure 2.
Relationship of alcoholic content and calories content of honey–coconut wines. Key: WA (1:1) = honey (900 mL) + coconut milk extract (900 mL), WB (1:2) = honey (600 mL) + coconut milk extract (1200 mL), WC (2:1) = honey (1200 mL) + coconut milk extract (600 mL), WD (3:1) = honey (450 mL) + coconut milk extract (1350 mL), WE (1:3) = honey (1350 mL) + coconut milk extract (450 mL), CTRL (1:0) = honey (1800 mL) + coconut milk extract (0 mL).
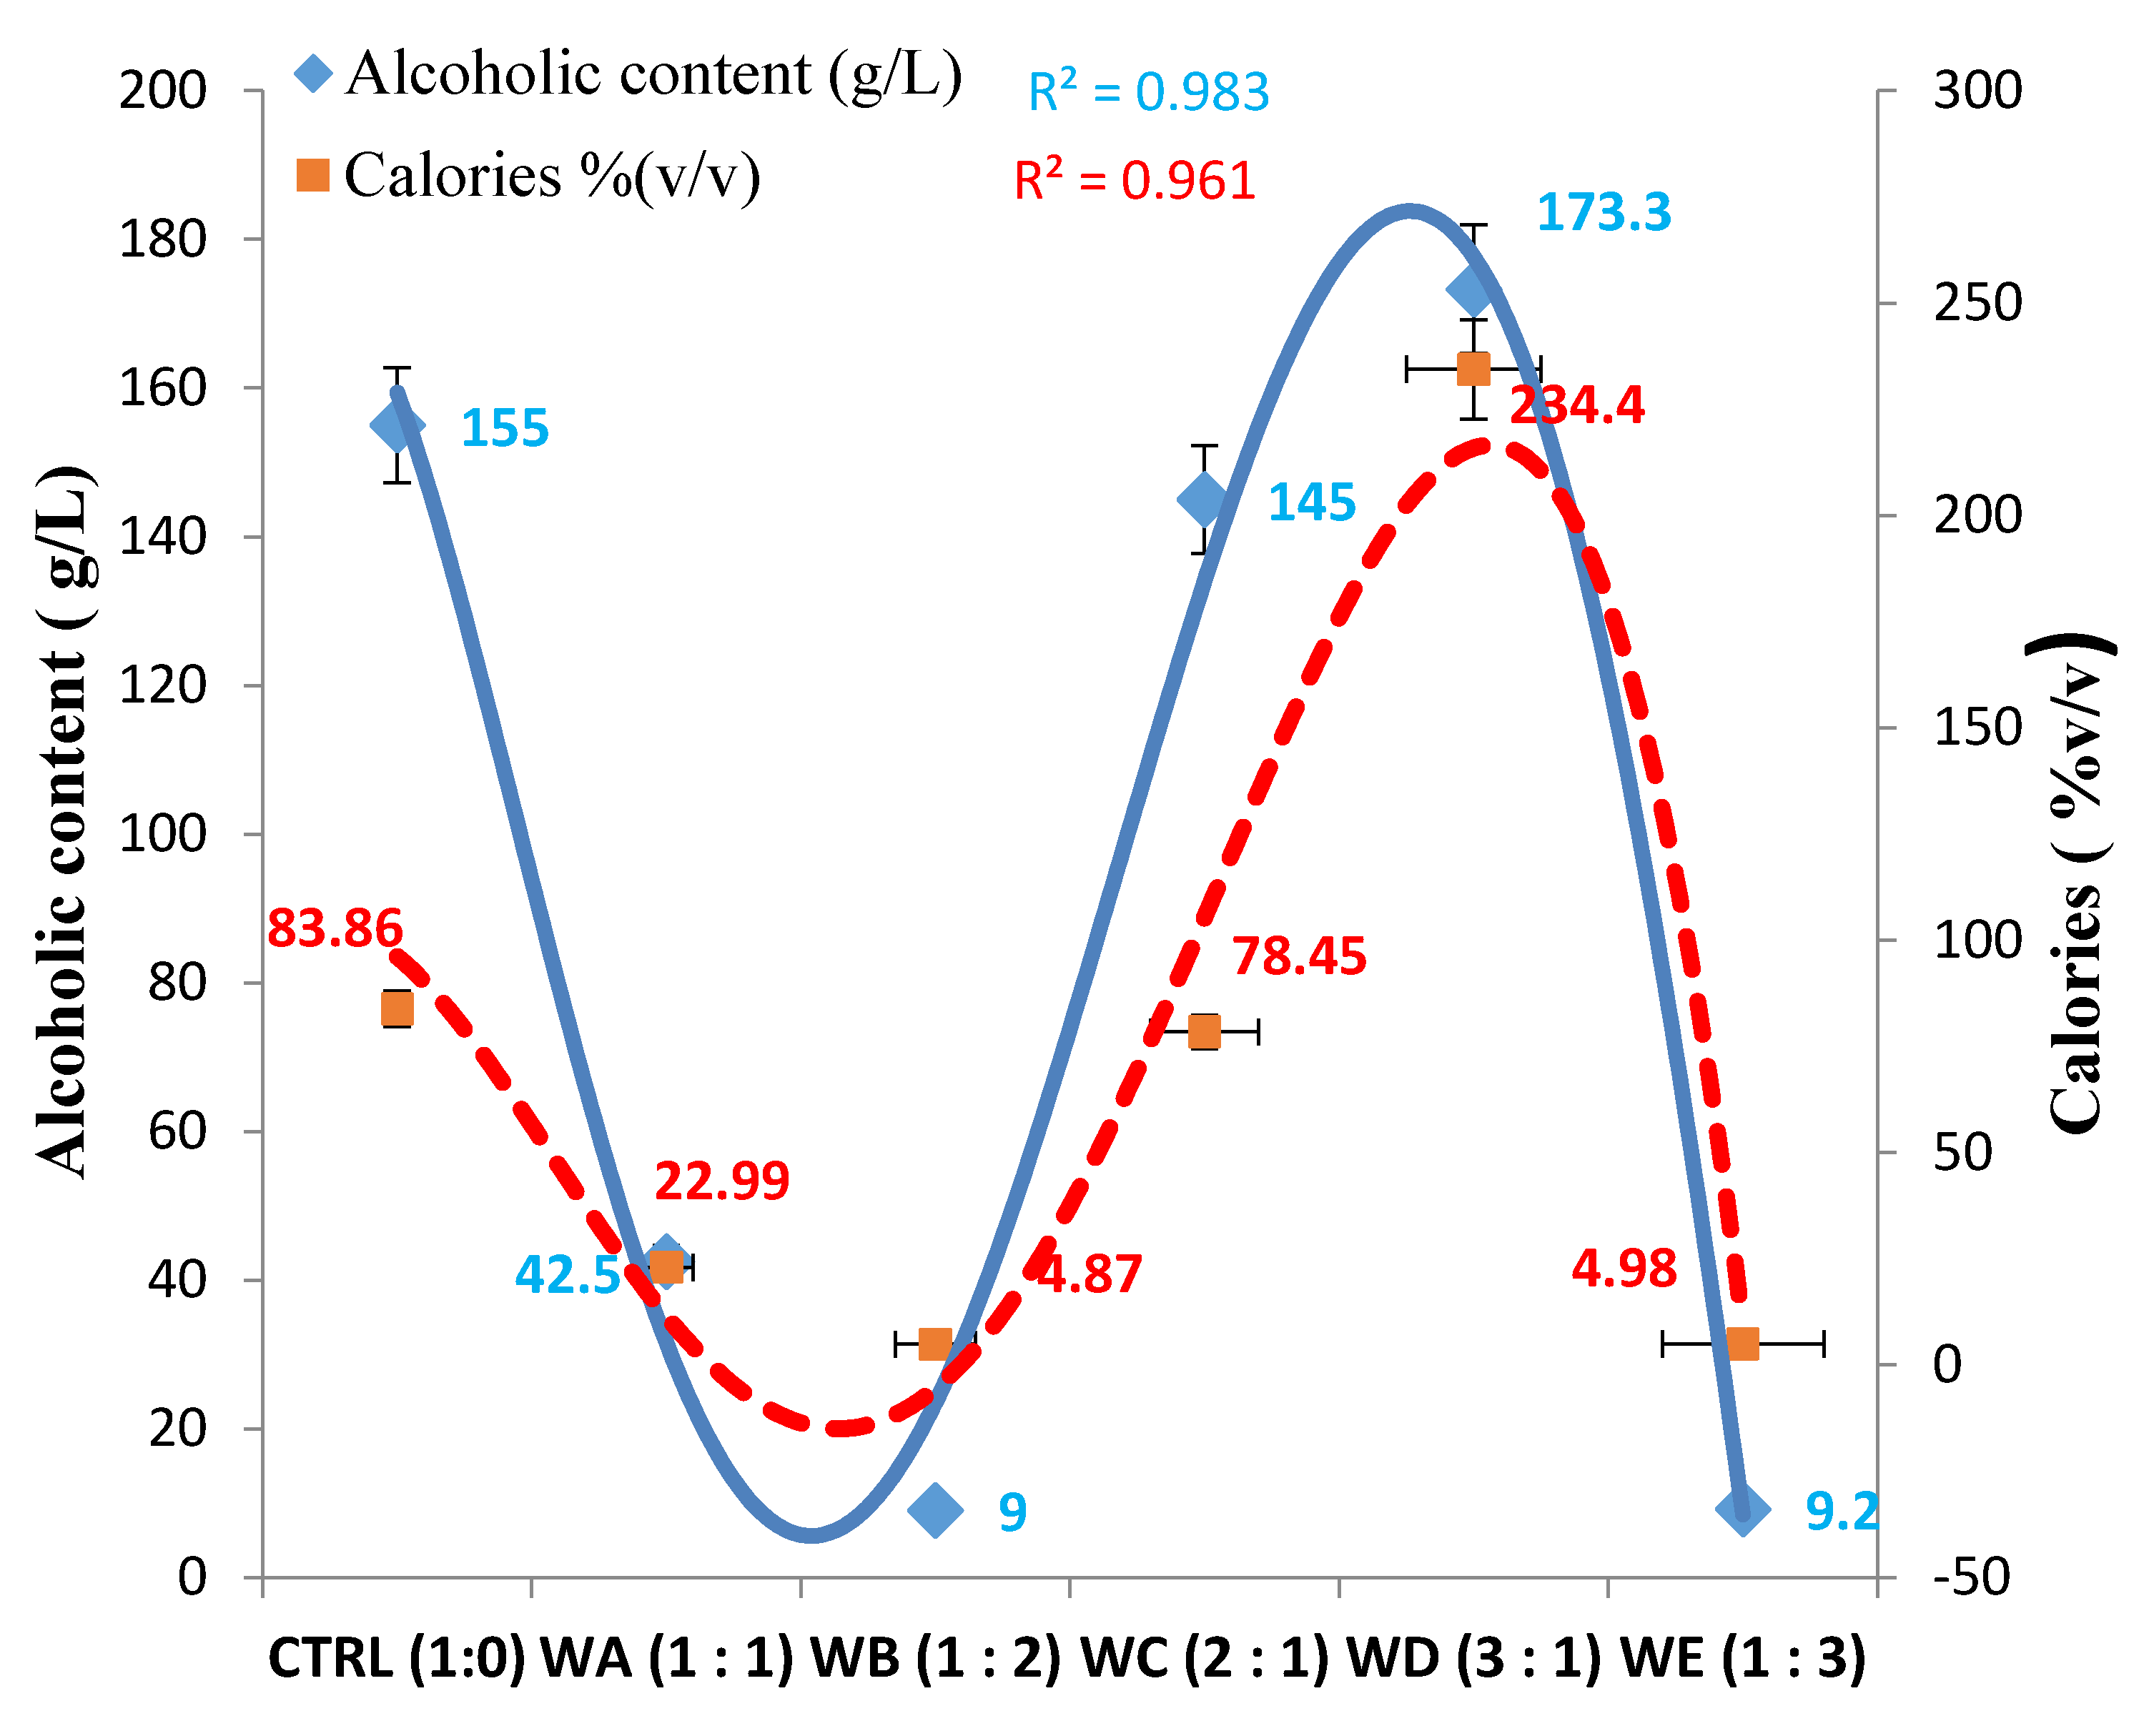
Figure 3.
Sensory evaluation of honey–coconut wine produced with S. cerevisiae. Data are mean score points of 50 assessors. Key: WA (1:1) = honey (900 mL) + coconut milk extract (900 mL), WB (1:2) = honey (600 mL) + coconut milk extract (1200 mL); WC (2:1) = honey (1200 mL) + coconut milk extract (600 mL); WD (3:1) = honey (450 mL) + coconut milk extract (1350 mL); WE (1:3) = honey (1350 mL) + coconut milk extract (450 mL); CTRL (1:0)= honey (1800 mL) + coconut milk extract (0 mL); NB: ≤25% = strongly liked; ≤45% = acceptance limit; ≥40% = neutral or disliked. Seven-point hedonic scale was expressed in percentage (%index = average hedonic point × 15%).

Table 1.
Nutritional and physicochemical qualities of honey–coconut juice before fermentation. CM: coconut milk; HS: honey slurry.
Table 1.
Nutritional and physicochemical qualities of honey–coconut juice before fermentation. CM: coconut milk; HS: honey slurry.
| Parameters | Raw Honey | Raw Coconut CM (0:1) | HS (1:1) |
|---|---|---|---|
| Sugar content (g/L) | 68.74 | 33.41 | 36.63 |
| Moisture content (%) | 16.7 | 72.5 | 31.6 |
| Ash (%) | 0.35 | 0.85 | 0.16 |
| Crude fat content (%) | ND | 18.3 | ND |
| pH | 4.05 | 5.56 | 4.35 |
| Specific Gravity | 1.4231 | 0.995 | 1.1250 |
Key: ND = not detected.
Table 2.
Enological properties of honey–coconut wines produced with S. cerevisiae for 60 days.
| Parameters | WA (1:1) | WB (1:2) | WC (2:1) | WD (3:1) | WE (1:3) | CTRL (1:0) |
|---|---|---|---|---|---|---|
| pH | 4.10 | 4.20 | 4.20 | 4.20 | 4.20 | 4.20 |
| Temperature (°C) | 26.0 | 27.0 | 26.0 | 26.0 | 26.0 | 27.0 |
| Total titratable acidity (g/L) | 12.9 | 12.5 | 13.1 | 13.7 | 19.3 | 14.3 |
| Attenuation (%) | 94.50 | 81.78 | 98.63 | 97.6 | 72.81 | 91.265 |
| Volatile acidity (g/L) | 7.74 | 7.5 | 7.86 | 8.22 | 11.58 | 8.58 |
| Residual sugar (g/L) | 3.93 | 3.24 | 3.01 | 12.72 | 5.01 | 25.20 |
| Fermentative capacity (g/L) | 72.59 | 15.49 | 247.15 | 295.24 | 14.10 | 263.80 |
| Apparent fermentative degree (%) | 3.04 | 0.67 | 9.65 | 11.29 | 0.61 | 10.14 |
| Fermentation velocity | 0.51 | 0.58 | 0.99 | 0.59 | 0.65 | 0.58 |
| Free SO2 (mg/L) | 39.34 | 7.47 | 4.77 | 4.31 | 8.04 | 4.30 |
| Initial Specific Gravity | 1.0331 | 1.0081 | 1.1082 | 1.1332 | 1.0083 | 1.1250 |
| Final Specific Gravity | 1.0017 | 1.0014 | 1.0013 | 1.0055 | 1.0022 | 1.0109 |
Key: WA (1:1) = honey (900 mL) + coconut milk extract (900 mL), WB (1:2) = honey (600 mL) + coconut milk extract (1200 mL), WC (2:1) = honey (1200 mL) + coconut milk extract (600 mL), WD (3:1) = honey (450 mL) + coconut milk extract (1350 mL), WE (1:3) = honey (1350 mL) + coconut milk extract (450 mL), CTRL (1:0) = honey (1800 mL) + coconut milk extract (0 mL).
Table 3.
Proximate analysis of honey–coconut wines produced with S. cerevisiae for 60 days.
| Parameter | WA (1:1) | WB (1:2) | WC (2:1) | WD (3:1) | WE (1:3) |
|---|---|---|---|---|---|
| Moisture content (%) | 94.31 | 92.65 | 89.83 | 91.23 | 96.98 |
| Ash content (%) | 0.02 | 0.03 | 0.01 | 0.02 | 0.01 |
| Total protein content (%) | ND | ND | ND | ND | ND |
| Crude fiber (%) | ND | ND | ND | ND | ND |
| Crude fat content (%) | ND | ND | ND | ND | ND |
| Total carbohydrate (%) | 5.67 | 7.32 | 10.16 | 8.75 | 3.01 |
Key: WA (1:1) = honey (900 mL) + coconut milk extract (900 mL), WB (1:2) = honey (600 mL) + coconut milk extract (1200 mL), WC (2:1) = honey (1200 mL) + coconut milk extract (600 mL), WD (3:1) = honey (450 mL) + coconut milk extract (1350 mL), WE (1:3) = honey (1350 mL) + coconut milk extract (450 mL).
Table 4.
Derived non-sensory wine qualities.
| Parameter | WA (1:1) | WB (1:2) | WC (2:1) | WD (3:1) | WE (1:3) | CTRL (1:0) |
|---|---|---|---|---|---|---|
| Sweetness | Dry | Dry | Dry | Off-Dry | Dry | Semi-Sweet |
| Calories | Very Low | Very Low | Low | High | Very Low | Moderate |
| Acidity/alkalinity | Acidic | Acidic | Acidic | Acidic | Acidic | Acidic |
| Alcoholic | Low | Moderate | High | High | Low | High |
Key: WA (1:1) = honey (900 mL) + coconut milk extract (900 mL), WB (1:2) = honey (600 mL) + coconut milk extract (1200 mL); WC (2:1) = honey (1200 mL) + coconut milk extract (600 mL); WD (3:1) = honey (450 mL) + coconut milk extract (1350 mL); WE (1:3) = honey (1350 mL) + coconut milk extract (450 mL); CTRL (1:0) = honey (1800 mL) + coconut milk extract (0 mL).
© 2017 by the authors. Licensee MDPI, Basel, Switzerland. This article is an open access article distributed under the terms and conditions of the Creative Commons Attribution (CC BY) license (http://creativecommons.org/licenses/by/4.0/).
Share and Cite
MDPI and ACS Style
Balogu, T.V.; Towobola, O. Production and Quality Analysis of Wine from Honey and Coconut Milk Blend Using Saccharomyces cerevisiae. Fermentation 2017, 3, 16. https://doi.org/10.3390/fermentation3020016
AMA Style
Balogu TV, Towobola O. Production and Quality Analysis of Wine from Honey and Coconut Milk Blend Using Saccharomyces cerevisiae. Fermentation. 2017; 3(2):16. https://doi.org/10.3390/fermentation3020016
Chicago/Turabian StyleBalogu, Tochukwu V., and Oyinloye Towobola. 2017. "Production and Quality Analysis of Wine from Honey and Coconut Milk Blend Using Saccharomyces cerevisiae" Fermentation 3, no. 2: 16. https://doi.org/10.3390/fermentation3020016
Note that from the first issue of 2016, this journal uses article numbers instead of page numbers. See further details here.