
Continuous Ethanol Production from Synthesis Gas by Clostridium ragsdalei in a Trickle-Bed Reactor


1
Department of Biosystems and Agricultural Engineering, Oklahoma State University, Stillwater, OK 74078, USA
2
Department of Chemical Engineering, Brigham Young University, Provo, UT 84602, USA
*
Author to whom correspondence should be addressed.
Fermentation 2017, 3(2), 23; https://doi.org/10.3390/fermentation3020023
Submission received: 27 March 2017
/
Revised: 7 May 2017
/
Accepted: 18 May 2017
/
Published: 24 May 2017
(This article belongs to the Special Issue Biofuels and Biochemicals Production)
Abstract
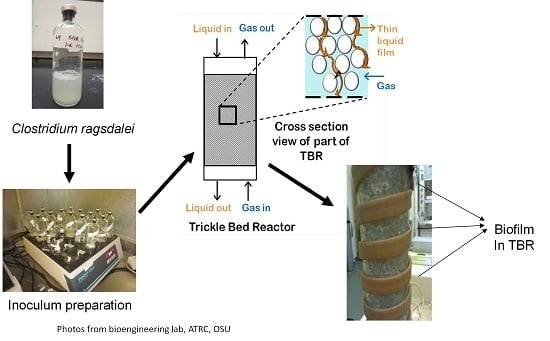
:A trickle-bed reactor (TBR) when operated in a trickle flow regime reduces liquid resistance to mass transfer because a very thin liquid film is in contact with the gas phase and results in improved gas–liquid mass transfer compared to continuous stirred tank reactors (CSTRs). In the present study, continuous syngas fermentation was performed in a 1-L TBR for ethanol production by Clostridium ragsdalei. The effects of dilution and gas flow rates on product formation, productivity, gas uptakes and conversion efficiencies were examined. Results showed that CO and H2 conversion efficiencies reached over 90% when the gas flow rate was maintained between 1.5 and 2.8 standard cubic centimeters per minute (sccm) at a dilution rate of 0.009 h−1. A 4:1 molar ratio of ethanol to acetic acid was achieved in co-current continuous mode with both gas and liquid entered the TBR at the top and exited from the bottom at dilution rates of 0.009 and 0.012 h−1, and gas flow rates from 10.1 to 12.2 sccm and 15.9 to 18.9 sccm, respectively.
1. Introduction
Syngas fermentation is part of the hybrid conversion technology for the conversion of renewable feedstocks or gas waste streams containing CO, CO2 and H2 to biofuels and chemicals. Clostridium ljungdahlii, Clostridium carboxidivorans, Clostridium ragsdalei, and Alkalibaculum bacchi are among the microorganisms that metabolize CO, CO2 and H2 via the reductive acetyl-CoA pathway to produce ethanol, acetic acid and cell carbon [1,2,3,4]. One major advantage of the hybrid conversion process is the ability to utilize feedstocks such as municipal solid wastes, industrial fuel gases and biomass [5]. However, challenges for this technology include mass transfer limitations, enzyme inhibition, low cell concentration and low ethanol productivity.
Ethanol has been reported to be a non-growth associated product of gas fermentation by certain Clostridium species [5,6]. Many researchers focused on improving ethanol productivity by optimizing media components, adding reducing agents, adjusting pH, adding nanoparticles and optimizing the bioreactor design to improve the mass transfer of CO and H2 in fermentation medium [7,8,9,10,11,12,13]. C. ljungdahlii is one of the most extensively studied microorganisms for ethanol production using syngas fermentation. Tenfold (from 5 to 48 g/L) and over threefold (from 0.4 to 1.5 g/L) increases in ethanol and cell mass concentrations, respectively, were achieved in a continuous stirred tank reactor (CSTR) with cells recycled using C. ljungdahlii by designing a defined production medium and controlling pH at 4.5 [14].
Syngas fermentation bioreactors must maximize gas–liquid mass transfer, while achieving high cell densities to promote fast reaction [10]. Bioreactors such as air-lift reactors, continuous stirred tank reactors (CSTRs), trickle-bed reactors (TBRs) and hollow fiber membrane (HFM) reactors have been characterized for their capabilities for CO mass transfer into fermentation medium [12,15,16,17,18,19]. Further, improved ethanol production over batch bottle fermentations was reported when fermentations were performed in various bioreactors that provided larger working volume, greater cell recycling, continuous addition of nutrients and syngas, and better control of operating parameters [1,16,20,21,22,23]. For example, C. carboxidivorans produced only 0.9 g/L ethanol in batch bottles [24] compared to 1.6 g/L ethanol in bubble column [21]. About 19 g/L ethanol was produced by C. ljungdahlii in a two stage CSTRs with cell recycle [22] compared to about 1 g/L ethanol in batch bottles [25]. C. ragsdalei produced about 1.5 g/L ethanol in bottles [8] compared to 2 g/L in two stage CSTRs with partial cell recycle [20]. However, 1.7 g/L ethanol was produced by A. bacchi in bottles compared 6 g/L ethanol in a CSTR with cell recycling.
In our previous study [19], the TBR was reported to provide greater mass transfer capabilities compared to a CSTR. Further, in semi-continuous fermentation, formation of a biofilm in the TBR improved the H2 uptake by decreasing the CO inhibition on hydrogenase because CO is consumed by cells as it flows through the TBR [18]. However, higher acetic acid production was observed in the semi-continuous fermentations due to repetitive medium replacement that provided a growth supporting environment. During batch and semi-continuous fermentations, cells undergo lysis as the nutrient levels depleted, causing the fermentation to cease. Production of ethanol in a batch process is time- and labor-intensive due to the long doubling times of syngas-fermenting microbes [22]. During continuous fermentation, high cell concentrations and productivity can be maintained for a longer period. Further, a continuous supply of fresh medium would maintain the cell’s activity and adapt cells in the biofilm to produce more solvent by controlling fermentation parameters such as dilution rate, pH and gas flow rate. The focus of the present study is to improve ethanol production in a TBR during continuous fermentation. Supply of nutrients to a TBR was controlled by altering the dilution rate. The effect of dilution rate and gas flow rate on gas conversion, gas uptake, product concentrations, yields and productivities in both counter-current and co-current modes of operation were studied.
2. Materials and Methods
2.1. Microorganism and Medium Preparation
Clostridium ragsdalei (ATCC-PTA-7826) was maintained and grown on standard yeast extract medium. The medium contained 0.5 g/L yeast extract (YE), 10 g/L 2-(N-morpholino)ethanesulfonic acid (MES) as the buffer, 25 mL/L mineral solution without NaCl, 10 mL/L vitamin solution, 10 mL/L metal solution and 10 mL/L of 4% (w/v) cysteine sulfide. The detailed medium composition was previously reported [4]. C. ragsdalei stock culture was passaged three times (i.e., inoculum was transferred to fresh medium three times for cells’ adaptation) prior to inoculating the TBR to reduce the lag phase. Detailed inoculum preparation was reported previously [18].
2.2. Fermentation Experimental Setup
A schematic of the continuous syngas fermentation setup is shown in Figure 1. The TBR designed in house was made of a borosilicate glass column of 5.1 cm diameter and 61 cm long. The detailed reactor design was reported earlier [18]. The packing material was 6-mm soda lime glass beads. The TBR liquid outlet was connected to a 500 mL Pyrex glass bottle, which was used as a sump to hold 500 mL of medium. It was operated both in counter-current and co-current modes. A peristaltic pump circulated the liquid at a desired flow rate. The pH and ORP probes (Cole-Parmer, Vernon, IL, USA) were placed in line in the recirculation loop. A liquid sample port was placed in the recirculation loop. Fresh medium from the feed tank was pumped to the reactor through a 6.4 mm T-connector placed in the recirculation loop before the medium enters the top of the TBR using a Bioflo pump and controller (New Brunswick Scientific Co., Edison, NJ, USA). The product stream was connected to another Bioflo pump that pumped out the product to a tank to maintain a constant amount of liquid in the reactor and recirculation loop. A port for acid and base addition was placed in the recirculation loop after the sampling port and was connected to the Bioflo controller for pH control. N2 was purged continuously through the feed and product tanks at 20 standard cubic centimeters per minute (sccm) to maintain anaerobic conditions. A one-way valve was connected at the gas outlet of both tanks to make sure the gas flowed out and air did not flow back into the tanks. In counter-current mode of operation, the gas entered at the bottom of the TBR. The exhaust gas from the TBR was fed into the sump headspace and then out to the sump gas exit line. In co-current operation, both gas and liquid entered the TBR at the top and exited through the same exit line to the sump. The sump acted as a gas–liquid separator. Further, a back pressure regulator was connected to the sump gas exit line to ensure that a 115 kPa pressure was maintained in the TBR. A pressure gauge was connected at the TBR gas exit line to measure the pressure in the TBR. An additional gas exit line was connected to the sump as a safety exhaust line with a pressure switch and a solenoid valve to vent the excess pressure in the TBR. A bubbler was placed after the pressure regulator to minimize losses of products exiting with the gas.
2.3. Continuous Fermentation Procedure
The TBR column, sump, tubing and liquid medium were sterilized in an autoclave (Primus Sterilizer Co., Inc., Omaha, NE, USA) at 121 °C for 20 min. After sterilization, the TBR was setup and purged with N2 for 5 h. Then, 200 mL of fresh sterile medium was added into the TBR and purged with N2 for 8 h. Next, the gas was switched to syngas with 38% CO, 5% N2, 28.5% CO2 and 28.5% H2 (by volume) (Stillwater Steel and Supply Company, Stillwater, OK, USA), which is similar to the composition of coal derived syngas [26]. A 60% (v/v) inoculum was aseptically added into the TBR through the liquid sample port. The temperature of the TBR was maintained at 37 °C. The liquid recirculation rate was set at 200 mL/min. At the beginning of the fermentation, the gas flow rate was set at 1.5 sccm. Initially, the TBR was operated in semi-continuous mode. After the CO and H2 conversion efficiencies reached about 90%, the TBR was switched to continuous mode by turning on the fresh medium and product pumps at a desired flow rate. Effects of three dilution rates of 0.006, 0.009 and 0.012 h−1 on product formation and gas conversion efficiency were examined. The conversion efficiency of each gas during fermentation was estimated based on the amount of gas converted by C. ragsdalei relative to the amount of gas fed to the TBR. Dilution rate equals to the feed rate divided by the medium volume in TBR, sump and recirculation loop. At each dilution rate, the effect of gas flow rate on cell growth, gas conversion, product formation and yields was examined. The gas flow rate in the TBR was gradually increased until CO conversion efficiency dropped below 40%. Then, the gas flow rate was decreased and a new dilution rate was applied. Gas and liquid samples were aseptically withdrawn from the TBR periodically. To avoid flooding of the TBR by cell debris, the recirculation rate was increased from 200 to 500 mL/min for about 10 min at every sampling time to remove cell cells debris between the packing materials.
2.4. Sample Analysis
The cell optical density of the fermentation medium from the liquid sample port in the circulation loop was measured at 660 nm (OD660) with a UV spectrophotometer (Cole Parmer, Vernon, Hills, IL, USA). The total cell optical density of the attached cells was measured at the end of the fermentation as described previously [18]. The pH measurements were logged into a computer using Biocommand software (New Brunswick Scientific Co.). Fermentation samples were analyzed for ethanol and acetic acid using a DB-FFAP capillary column gas chromatography with flame ionization detector (GC-FID). Gas samples were analyzed in a 6890N gas chromatography with thermal conductivity detector (TCD) (Agilent Technologies, Wilmington, DE, USA). More details of the methods used to analyze gas and liquid samples were described previously [18].
3. Results
3.1. Cell Growth and pH
C. ragsdalei cell OD660 and pH profiles in the TBR when continuously operated for 3200 h in counter-current and co-current modes are shown in Figure 2. C. ragsdalei started to grow after 174 h of lag phase. The cell OD660 was 0.35 at 197 h when the TBR was switched to continuous operation with a dilution rate of 0.012 h−1 and a gas flow rate of 1.9 sccm. Cell OD660 further increased to 0.53 at 207 h and remained constant until 224 h. However, the cell OD660 started decreasing slowly to 0.20 at 305 h, most likely due to cell washout. At this point, the dilution rate was decreased by 50% (D = 0.006 h−1) which resulted in an increase in the cell OD660 to 0.30 by 357 h.
A brief power interruption between 329 and 351 h resulted in no gas flow to the TBR. This caused a decrease in cell activity (i.e., decrease in CO and H2 gas uptake rates) up to 398 h. The fermentation slowly recovered when the gas flow and dilution rates were reset to 1.5 sccm and 0.006 h−1, respectively. The cell OD660 increased from 0.10 at 398 h to 0.29 at 461 h. The cell OD660 in the liquid medium dropped to approximately zero around 700 h. However, the gas uptake rates were maintained indicating continued cell activity due to a biofilm in TBR rather than suspended cells. This was also confirmed by measuring the total cell mass concentration at the end of the TBR run, which showed a much higher cell mass concentration attached to the TBR than was suspended in the liquid medium as discussed below. Formation of biofilm refers to all cell mass excluding suspended cells. During counter-current flow mode, cells from the biofilm were resuspended into the medium when the pressure was released to clear the medium between the beads in the flooded TBR at 627, 901 and 909 h. This resulted in a sudden increase in the measured cell OD660. To avoid flooding issues in counter-current mode, the liquid recirculation rate was intermittently increased from 200 to 500 mL/min for 10 min at various sampling times of 1197, 1371, 1498, 1628, 1643 and 1652 h. Unlike in counter-current mode, cell OD660 was between 0.05 and 0.3 during co-current mode from 1700 to 3200 h (Figure 2B).
The TBR and glass beads were washed with DI water to calculate the total amount of cells attached to the beads in the TBR after 3200 h of continuous fermentation. The beads were collected in a tub and washed three times with 1 L DI water. The column was also washed with 1 L of DI water to account of cells attached to the column walls. The cell OD660 in the beads from wash-1, wash-2, wash-3 and column-wash were 8.86, 0.41, 0.13 and 1.97, respectively. Based on this analysis, the estimated overall dry cell weight in the TBR at the end of the fermentation was 4.24 g.
During cell growth, the medium pH decreased from 5.7 at 174 h to 4.7 at 207 h. The pH of the medium was then maintained at 4.6 by addition of about 0.5 to 1 mL of 2 N KOH after every sampling time. After the power interruption between 329 and 351 h, the pH was increased to 5.2 to maintain a pH slightly favorable to cell growth conditions to recover fermentation activity. The pH dropped from 5.2 to 4.7 as cell OD660 increased between 422 to 461 h. After 461 h, the pH was maintained between 4.5 and 4.6.
3.2. Gas Conversion
The CO and H2 conversion efficiencies in the TBR are estimated as the amount utilized divided by the amount flowing into the TBR. The CO and H2 conversion efficiencies by C. ragsdalei were 92% and 72%, respectively, when the fermentation was switched from semi-continuous to continuous mode at 197 h (Figure 3A).
In counter-current mode, the TBR was operated at dilution rates of 0.012 h−1 (D3), 0.006 h−1 (D1) and 0.009 h−1 (D2) from 197 to 305 h, 305 to 989 h and 989 to 1700 h, respectively. The CO and H2 conversion efficiencies were 93% and 74%, respectively, at 0.012 h−1 and gas flow rate of 1.9 sccm. However, when the gas flow rate was increased to 2.3 sccm at the same dilution rate, the CO and H2 conversion efficiencies dropped slightly to 88% and 71%, respectively.
CO and H2 conversions efficiencies continued to decrease to 81% and 60%, respectively, when the gas flow rate and dilution rate were 2.3 sscm and 0.006 h−1, respectively, at 305 h. However, the CO and H2 conversion efficiencies increased to 88% and 74%, respectively, when gas flow rate was reduced to 1.9 sccm at 319 h. The conversion efficiencies of CO and H2 decreased to 40% and 31%, respectively, due to power shutdown from 329 to 351 h that hindered the fermentation. The fermentation recovered slowly after 398 h with CO and H2 conversion efficiencies reached to 92% and 86%, respectively at 620 h. As the gas flow rate was increased from 1.5 to 1.9 sccm, the liquid medium flooded the TBR (at 627, 901 and 909 h), which decreased the CO and H2 conversion efficiencies to about 65% at 909 h (Figure 3A). The TBR flooding caused gas bypass from the bottom of the TBR to the headspace sump and decreased the availability of syngas to cells in the TBR. The gas flow rate was decreased from 1.9 to 1.5 sccm at 909 h to avoid further flooding. CO and H2 conversion efficiencies recovered to 85% and 81%, respectively, at 981 h before increasing the dilution rate to 0.009 h−1.
Gas conversion efficiencies of 91% CO and 90% H2 were achieved between 989 and 1115 h at 0.009 h−1. While the CO conversion efficiency was about the same at both 0.006 and 0.009 h−1, the H2 conversion efficiency was 5% higher at 0.009 h−1 than at 0.006 h−1 at the same gas flow rate. The increase in gas uptake is due to higher cells’ activity due to availability of more nutrients at higher dilution rate. A decrease in CO and H2 conversion efficiencies was observed at various sample points (1197, 1371, 1498 and 1628 h) when the liquid recirculation rate was increased for 10 min to clear the cell debris in the TBR. During the period between 1197 and 1628 h, the gas flow rate was increased from 1.7 sccm to 2.6 sccm. The combination of the increase in gas supply and possible removal of active cells with removal of cell debris likely contributed to the decrease in gas conversion. The TBR operation at 0.009 h−1 from 989 to 1700 h with an increase in gas flow rate from 1.5 sccm to 2.8 sccm resulted in CO and H2 conversion efficiencies of about 91% and 89%, respectively.
The TBR was operated in co-current mode at dilution rates of 0.009 h−1 (D2) and 0.012 h−1 (D3) from 1700 to 2672 h and from 2672 to 3200 h, respectively, with a gradual increase in gas flow rate from 2.8 sccm to 18.9 sccm (Figure 3B). The TBR gas inlet leaked from 1700 to 2042 h, which resulted in inaccurate gas flow rate measurements. No gas data was obtained during this time period. During the TBR operation at 0.009 h−1, the increase in gas flow rate from 2.8 sccm at 2042 h to 12.2 sccm at 2607 h resulted in a decrease in CO and H2 conversion efficiencies from 95% and 88% to 43% and 19%, respectively. A decrease in conversion is expected since the length of time the gas is in the reactor decreases with increasing flow rate. The gas flow rate was reduced to 7.6 sccm at 2607 h to increase CO and H2 conversion before a new dilution rate of 0.012 h−1 was used. CO and H2 conversion efficiencies increased to 71% and 42%, respectively. The gas conversion efficiencies at 2660 h were slightly higher than those obtained at 2375 h and the same operating conditions.
The dilution rate was increased to 0.012 h−1 (D3) at 2672 h with a gas flow rate of 7.6 sccm (Figure 3B). CO and H2 conversion efficiencies reached 77% and 53%, respectively, at 2725 h. These gas conversion efficiencies at 0.012 h−1 and the same gas flow were 8% higher for CO and 21% higher for H2 than at 0.009 h−1. This is due to the increase in cells’ activity with additional nutrients at the higher dilution rate. Further, when the gas flow rate was increased from 8.4 sccm at 2732 h to 18.9 sccm at 3200 h, the CO and H2 conversion efficiencies slowly dropped to 50% CO and 30% H2, respectively. The differences between CO and H2 conversion efficiencies at dilution rate of 0.012 h−1 was lower than at 0.009 h−1 indicating an increase in gas uptake at higher dilution rates (Figure 4B). It can also be observed from Figure 3B that the decrease in CO and H2 gas conversion efficiencies were lower at 0.012 h−1 than at 0.009 h−1 indicating higher cells’ activity at 0.012 h−1. In two stages of continuous syngas fermentation with C. ljungdahlii in a CSTR followed by a bubble column with gas and cells recycling, the increase in dilution rate from 0.01 to 0.016 h−1 was reported to increase the cell OD600 from 9.9 to 17.8 due to supply of more nutrients [22]. The same study reported CO and H2 conversion efficiencies in the CSTR were 46% and 49%, respectively, at 23 sccm compared to CO and H2 conversion efficiencies of 86% and 82% in the bubble column at 121 sccm. The high gas conversion efficiency in the second stage is attributed to the high cell OD600 of 17.8 that was achieved with cell recycling.
3.3. Gas Uptake Profiles
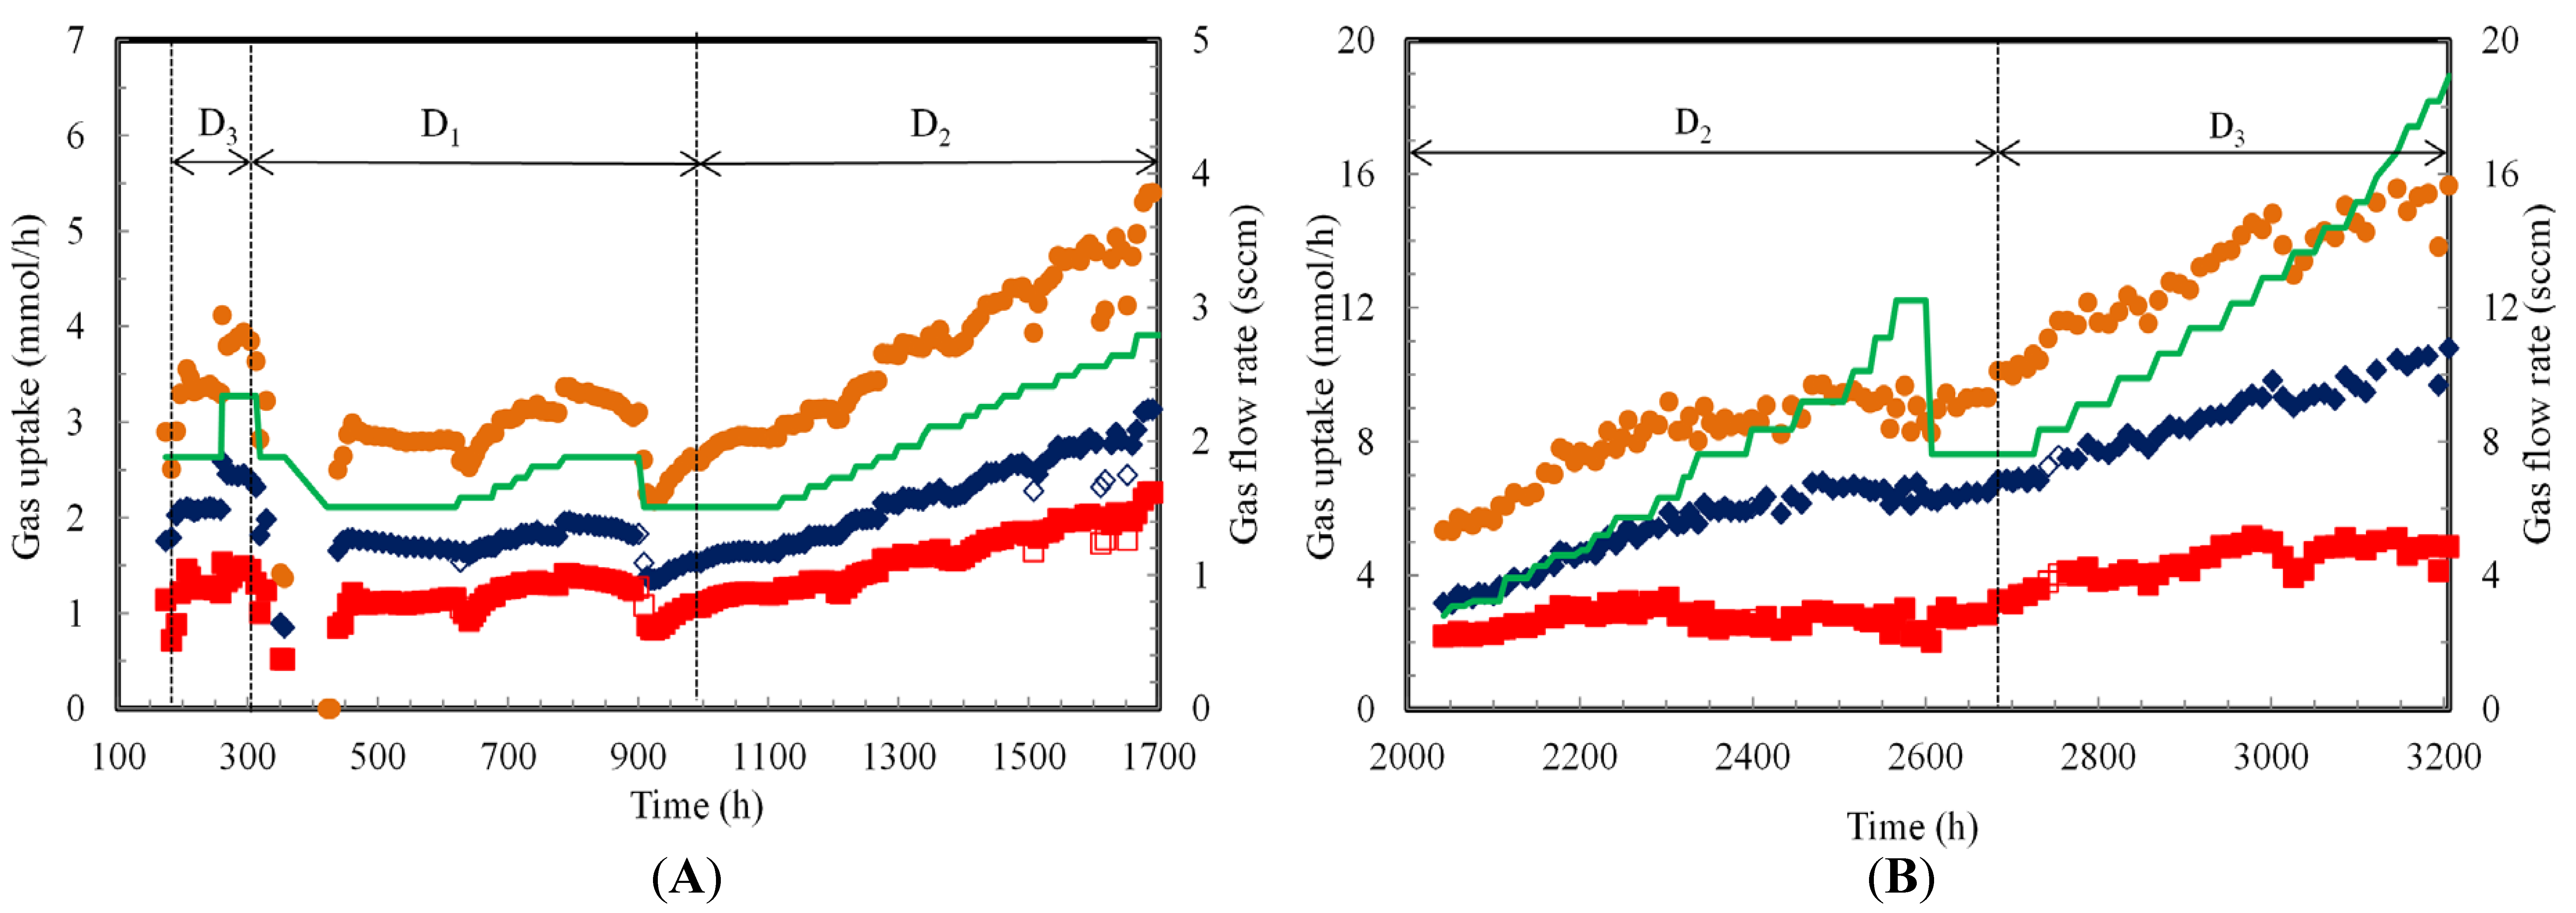
The gas uptake profiles during continuous syngas fermentation by C. ragsdalei in the TBR are shown in Figure 4. The specific gas uptake rates in mmol/gcell·h were not calculated because the cell mass concentration in the biofilm during operation was not known and difficult to quantify. Hence, the gas uptakes are described only in terms of mmol/h. CO and H2 uptake rates at the start of the continuous fermentation at 197 h, 0.012 h−1 and 1.9 sccm were 2.0 and 1.2 mmol/h, respectively. When the gas flow rate was increased to 2.3 sccm at 261 h, CO and H2 uptake rates slightly increased. However, cell OD660 decreased to 0.20 at 305 h due to cell washout (Figure 2A). Therefore, the dilution rate was decreased to 0.006 h−1 at 305 h. CO and H2 uptake rates at 319 h decreased to 1.8 and 1.0 mmol/h, respectively.
To increase gas consumption, the gas flow rate was reduced to 1.9 sccm at 319 h. CO and H2 uptake rates at 329 h recovered back to 2.0 and 1.2 mmol/h, respectively. However, the cell activity decreased when a power failure occurred between 329 and 351 h. The fermentation slowly recovered with CO and H2 uptake rates of 1.7 and 1.1 mmol/h between 375 and 620 h.
The gas flow rate was increased from 1.5 to 1.9 sccm between 620 and 787 h, which resulted in a slight increase in CO and H2 uptake rates to 2.0 and 1.4 mmol/h at 787 h, respectively. These gas uptakes were maintained up to 900 h. However, flooding at 901 h and 909 h resulted in a decline in CO and H2 uptake rates to 1.5 and 1.0 mmol/h, respectively. Hence, the gas flow rate was decreased to 1.5 sccm at 909 h and was maintained at this flow rate until 981 h. At 981 h, the CO and H2 uptake rates were essentially still the same as at 909 h. However, since the same gas uptake rates were achieved at a lower gas flow rate, CO and H2 conversion efficiencies increased (Figure 3). The dilution rate was maintained at 0.009 h−1 during counter-current operation between 989 and 1700 h. A step increment increase in gas flow rate by 5–10% from 1.5 sccm at 989 h to 2.8 sccm at 1700 h resulted in an increase of gas uptake rate to 3.1 mmol/h of CO and 2.1 mmol/h of H2.
The TBR was switched at 1700 h to co-current mode due to frequent flooding issues. However, there was gas leak in the inlet to the TBR from 1700 to 2042 h, which resulted in inaccurate gas flow rate measurements and no gas uptake data. The gas flow rate was gradually increased from 2.8 to 6.3 sccm in between 2042 and 2313 h, which increased the gas uptake rates to 5.9 mmol/h CO and 3.3 mmol/h H2 at 2313 h (Figure 4B). A further increase in the gas flow rate from 6.3 to 12.2 sccm from 2313 to 2672 h resulted in a decrease of H2 uptake rate to between 2.4 and 3.0 mmol/h, while the CO uptake rate increased between 6.0 and 6.7 mmol/h.
The average total CO and H2 gas uptake rate between 2313 and 2672 h was 8.5 mmol/h. It can be observed that the increase in the dilution rate from 0.009 to 0.012 h−1 and gas flow rate from 2.8 to 18.9 sccm increased the overall CO and H2 uptake rates. In co-current flow, it was also observed that the increase in dilution rate by 36% (0.009 h−1 to 0.012 h−1) resulted in an increase in total CO and H2 uptake rate by 47%. The gas uptake rates in co-current mode were 2.5 fold higher than in counter-current mode. This was attributed to the ability to operate the TBR in co-current mode at higher gas flow rates.
In the previous study with semi-continuous fermentation in co-current mode TBR, the maximum CO and H2 conversion efficiencies at 4.6 sccm were 80% (CO uptake rate of 4.4 mmol/h) and 55% (H2 uptake rate of 2.2 mmol/h), respectively [18]. In the present study during co-current continuous fermentation at 4.6 sccm and 0.009 h−1, gas conversion efficiencies of 82% CO (CO uptake rate of 4.4 mmol/h) and 72% H2 (H2 uptake rate of 2.74 mmol/h) were achieved. The high gas conversion efficiency and uptake rates are due to high cells’ activity with continuous addition of nutrients during the fermentation.
3.4. Product Profiles
At the beginning of continuous fermentation (197 h), ethanol and acetic acid concentrations were 0.8 g/L and 2.4 g/L, respectively (Figure 5A). Ethanol and acetic acid concentrations increased to 2.0 g/L and 5.0 g/L, respectively between 197 and 305 h at a dilution rate of 0.0012 h−1. A slight increase in ethanol and acetic acid concentrations was observed when dilution rate was decreased to 0.006 h−1. However, ethanol and acetic acid concentrations decreased between 329 h and 398 h. This decrease was associated with the power shutdown and washout cells and products.
The fermentation slowly recovered and product concentrations were observed to be stable from 398 to 454 h after which ethanol and acetic acid concentrations at 627 h reached 3.2 and 6.2 g/L, respectively, when the gas flow rate was increased by 20% from 1.5 sccm between 627 and 787 h, ethanol concentration increased by 20% while the acetic acid concentration decreased by 20%. Ethanol concentration slowly increased to 4.3 g/L while acetic acid concentration remained at 5.0 g/L between 787 and 909 h. Due to flooding at 901 and 909 h, the gas flow rate was reduced from 1.9 to 1.5 sccm to recover the fermentation in the TBR.
The dilution rate was increased from 0.006 to 0.009 h−1 between 989 and 1700 h. This increased the product removal rate from the TBR, which decreased the ethanol concentration by about 40% to 2.5 g/L at 1115 h. However, the acetic acid concentration increased by 15% to around 5.9 g/L at 1115 h. The increase in acetic acid concentration was due to increase in cells’ activity and concentration in the biofilm. The increase in cell concentration is associated with acetic acid production and ATP generation as a high amount of energy is required for cell maintenance [1].
The gas flow rate was increased from 1.5 to 2.8 sccm in a step increment of 5–10% every 24 to 36 h between 1115 and 1700 h (Figure 5A). Ethanol and acetic acid concentrations were stable at 2.5 and 6.2 g/L, respectively, when the gas flow rate was increased from 1.5 to 1.7 sccm from 1115 to 1197 h. The liquid recirculation rate was increased from 200 to 500 mL/min for 10 min to clear the cell debris at 1197 h. This resulted in a slow increase in the ethanol concentration to 3.2 g/L and a decrease in the acetic acid concentration to 4.7 g/L at 1245 h. This intermittent increase in liquid recirculation rate could have cleared the cell debris from the packing and caused better gas uptake resulting in a positive effect on ethanol production.
To test the positive effect of the intermittent increase of liquid recirculation rate on ethanol production, the liquid flow rate was again increased to 500 mL/min for 10 min at 1371 h. Ethanol concentration slowly increased to 3.7 g/L while acetic acid remained at 4.7 g/L at 1474 h. Since increasing the liquid recirculation rate intermittently had a positive effect on ethanol production, it was performed when the cell OD660 in the medium decreased to zero. The intermittent increase in liquid recirculation rate and gradual increase in gas flow rate to 2.4 sscm resulted in production of 5.0 g/L ethanol and 6.1 g/L acetic acid at 1532 h. The gas flow rate was further increased to 2.8 sccm between 1532 and 1700 h. Ethanol and acetic acid concentrations were 4.4 and 5.8 g/L, respectively at 1700 h.
In co-current mode, the gas flow rate was gradually increased from 2.8 to 18.9 sccm (Figure 5B). Similar to the counter-current mode, the gradual increase in gas flow rate with an increase in liquid recirculation rate from 200 to 500 mL/min for 10 min at every sampling time increased ethanol production. Ethanol and acetic acid concentrations were 2.7 and 6.7 g/L, respectively, at 2052 h and 3.1 sccm. An increasing trend in ethanol production and a decreasing trend in acetic acid production were observed as the gas flow rate was increased from 3.1 to 9.2 sccm between 2052 and 2493 h. Ethanol and acetic acid concentrations at 2493 h were 11.9 and 4.6 g/L, respectively. A further increase in the gas flow rate from 9.2 to 11.1 sccm at 2542 h did not increase ethanol production. Additionally, the increase in gas flow rate from 11.1 to 12.2 sccm at 2566 h slightly decreased ethanol and acetic acid concentrations to 10.5 and 4.1 g/L, respectively. This indicates that beyond a gas flow rate of 9.2 sccm, cells reached a kinetic limitation and were not able to process more gas even when more gas was provided (Figure 4B).
Further, when the gas flow rate was decreased from 12.2 to 7.6 sccm at 2607 h, ethanol and acetic acid concentrations were stable at 10.8 and 3.8 g/L, respectively, until 2672 h. When the dilution rate was increased from 0.009 to 0.012 h−1 at 2510 h, the ethanol concentration dropped slowly to 9.9 g/L. However, the acetic acid concentration slightly increased to 5.0 g/L at 2551 h and 7.6 sccm. Further increase in the gas flow rate from 7.6 to 18.9 sccm resulted in 13.2 g/L ethanol and 4.3 g/L acetic acid at 3200 h. The gas uptake rate at 0.012 h−1 was higher than at 0.009 h−1 due to higher cells’ activity, which resulted in more ethanol production at 0.012 h−1.
3.5. Productivity and Yields
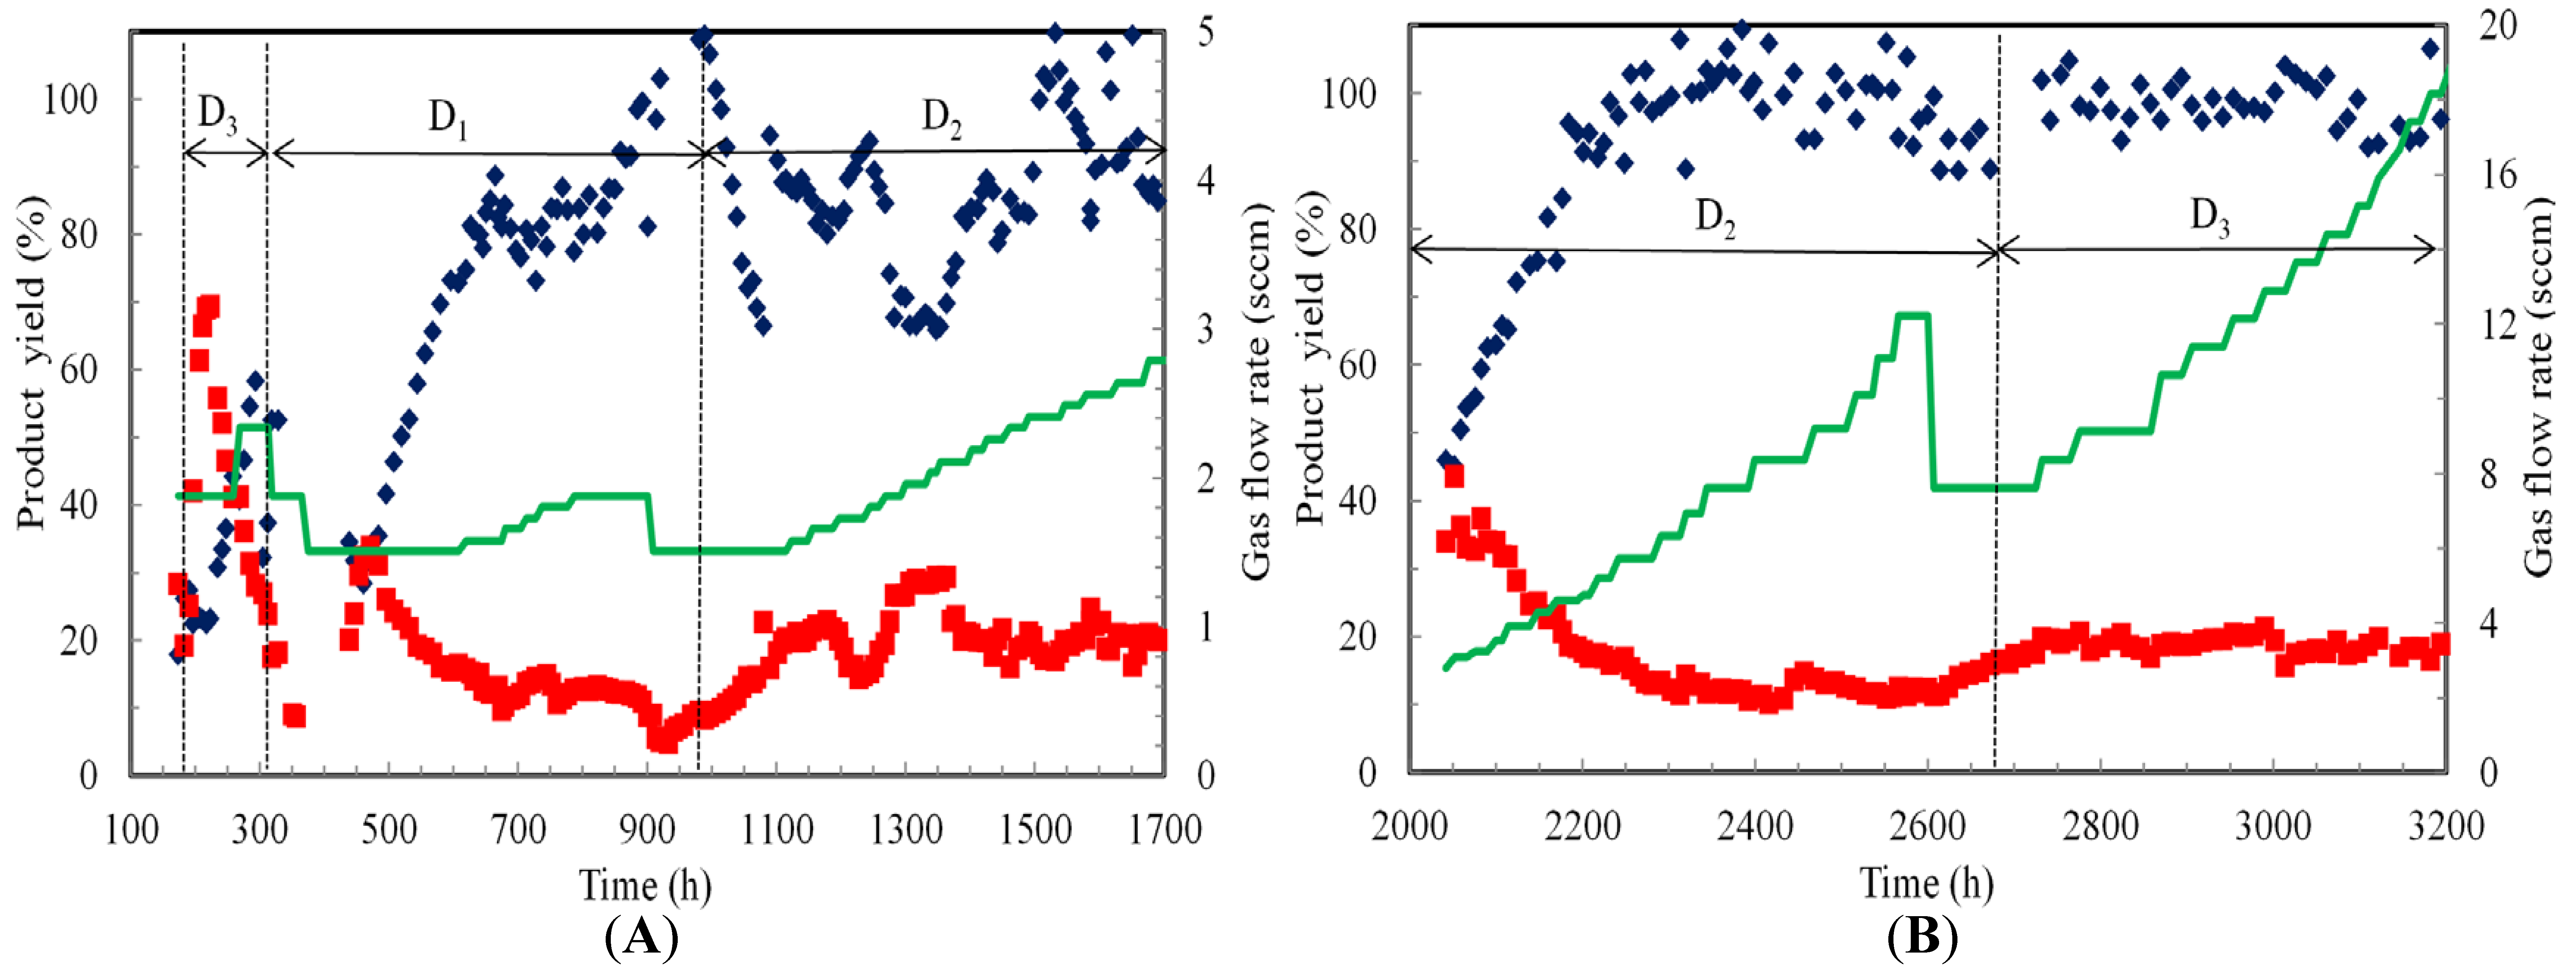
Ethanol and acetic acid productivities were estimated by multiplying the dilution rate by the product concentration. Ethanol and acetic acid yields were estimated based on CO consumed as previously reported [27]. One mole of ethanol is formed from six moles of CO and one mole of acetic acid is produced from four moles of CO.
During counter-current operation, the highest ethanol productivity of 45 mg/L·h was obtained during operation at 0.009 h−1 and 1556 h. However, the highest acetic acid productivity was 63 mg/L·h at 0.009 h−1 and 1611 h. During counter-current mode, acetic acid productivity was always higher than ethanol productivity. However, ethanol productivity was higher during co-current mode. The maximum ethanol productivity during co-current operation was 158 mg/L·h at 0.012 h−1 and 3200 h, while a maximum acetic acid productivity of 68 mg/L·h was obtained at 0.009 h−1 at 2083 h. The ethanol productivity achieved in the present study with continuous syngas fermentation in the TBR was over four times higher than reported during semi-continuous fermentation (37 mg/L·h) in the TBR [18].
Moreover, the molar ratio of ethanol to acetic acid produced in the present study during continuous fermentation at 0.012 h−1 and 18.9 sccm in the TBR was 4:1, which was higher than in semi-continuous TBR fermentation (1:2). In semi-continuous fermentation, as nutrients were depleted from the medium, the gas conversion efficiencies and uptake rates decreased. Replacement of the medium in semi-continuous fermentations resulted in a nutrient-rich environment at pH 5.8 that promoted cell growth and thus more acetic acid production. However, during continuous fermentation the nutrients levels were maintained by altering the dilution rate and the pH was maintained at 4.5 that favored ethanol production. This clearly shows the advantages of the continuous syngas fermentation process.
During counter-current mode, ethanol yield was 22% while acetic acid yield was 42% at 197 h and 1.9 sccm (Figure 6). However, acetic acid yield slowly dropped to 15% while ethanol yield increased to 58% at 294 h. At dilution rate of 0.006 h−1 from 305 h to 989 h, the ethanol yield increased from 28% at 461 h to 85% at 850 h, while acetic acid yield decreased from 38% at 461 h to 13% at 850 h. At a dilution rate of 0.009 h−1 between 989 and 1700 h, the average ethanol yield was about 85%, while the average acetic acid yield was about 20%. As the gas flow rate was increased and the pH was maintained at 4.5, ethanol yields increased due to the availability of more reductants (CO and H2) and pH values that favored solvent production conditions.
In co-current operation at 0.009 h−1, ethanol yield increased from 46% at 2042 h to 100% at 2232 h. Ethanol yield remained close to 100% during fermentation from 2232 to 2607 h. However, the acetic acid yield decreased from 34% at 2042 h to 16% at 2232 h. It remained close to about 13% from 2232 to 2607 h. Ethanol and acetic acid yields were about 100% and 20%, respectively, during operation at 0.012 h−1. The higher ethanol yield in co-current mode was due to higher cell activity that processed more gas.
4. Discussion
As discussed in Section 3.2, high dilution rates provided more nutrients to cells, which increased the cells’ activity. The increase in the gas flow rate increased CO and H2 transfer rates into the medium, which supported ethanol production. Ethanol produced in the present study (13.2 g/L) was higher than that reported in a CSTR with cell recycle using A. bacchi (6 g/L), a bubble column reactor (1.6 g/L) and a monolithic biofilm reactor (4.9 g/L) using C. carboxidivorans [1,5,28]. However, 19 g/L ethanol was reported in a two-stage continuous syngas fermentation in a CSTR followed by a bubble column with gas and cell recycling [23] and 48 g/L ethanol was reported in a CSTR with cell recycle using C. ljungdahlii [14]. Up to 24 g/L ethanol production was reported with hollow fiber membrane biofilm reactor (HFM-BR) using C. carboxidivorans [29]. However in addition to syngas, the presence of 10 g/L of fructose in ATCC 1745 PETC medium as previously reported [29] could have contributed to more ethanol production.
Compared to other microorganisms and reactor designs, the maximum ethanol productivity of 158 mg/L∙h achieved by C. ragsdalei in the TBR in the present study was higher than ethanol productivity of 140 mg/L∙h reported for C. carboxidivorans in HFM-BR, 110 mg/L·h reported for C. ljungdahlii in CSTR without cell recycle or for A. bacchi in a CSTR (70 mg/L·h) [1,29,30]. However, ethanol productivity in the present study was lower than the 301 mg/L·h ethanol productivity reported for C. ljungdahlii in a two stage CSTR and bubble column with gas and cell recycling [23].
The results also showed the many advantages of using continuous syngas fermentation in a TBR compared to other reactors. The cells’ activity in the TBR was recovered after power shutdown and multiple flooding issues occurred during counter-current flow. Intermittent increase in liquid recirculation rate cleared cell debris in the TBR and improved gas uptake and ethanol production. However, further improvements in TBR performance are expected by utilizing better packing material for immobilization of cells and increasing the H2:CO ratio in the syngas. Glass beads used in this study have a void fraction of 0.38, which is lower than the void fraction provided by other packing materials such as intalox saddles (0.6 to 0.9) and pall rings (0.9) [31]. Low void fraction reduces the availability of free space for gas-liquid mass transfer and decreases the reactive holdup volume. Further, use of cell immobilization techniques [32,33] such as covalent coupling using cross linking agents, entrapment, and adsorption on packing with rough surfaces can reduce the time of the biofilm formation and improve the TBR performance. Additionally, there is a need to grow more cells in the TBR, recycle unused gas, perform two-stage reactors using TBRs or in combination with other reactors to increase syngas utilization and productivity, which warrant further investigation.
5. Conclusions
To our knowledge, this is the first study on continuous operation of syngas fermentations in TBR for ethanol and acetic acid production, and this report highlighted the operational constraints and challenges of continuous syngas fermentation in TBR, and how the bioreactor operation can be restarted after major accidents such as flooding and power shutdown. The highest ethanol concentration, productivity and ethanol to acetic acid molar ratio of 13.2 g/L, 158 mg/L·h and 4:1, respectively, were obtained during co-current continuous syngas fermentation at a dilution rate of 0.012 h−1. In co-current mode, the total gas uptake rates more than doubled and ethanol productivity increased over fivefold with the increase in the gas flow rate from 2.8 to 18.9 sccm and dilution rate from 0.009 to 0.012 h−1. Operating TBR in co-current mode avoided flooding issues that occurred during counter-current mode and allowed production of over twofold more ethanol than in counter current mode.
Acknowledgments
This research was supported by the Sun Grant Initiative through the U.S. Department of Transportation, USDA-NIFA Project No. OKL03005 and Oklahoma Agricultural Experiment Station.
Author Contributions
Mamatha Devarapalli, Randy S. Lewis and Hasan K. Atiyeh conceived and designed the experiments; Mamatha Devarapalli performed the experiments; Mamatha Devarapalli, Randy S. Lewis and Hasan K. Atiyeh analyzed the data and wrote the paper.
Conflicts of Interest
The authors declare no conflict of interest.
References
- Liu, K.; Atiyeh, H.K.; Stevenson, B.S.; Tanner, R.S.; Wilkins, M.R.; Huhnke, R.L. Continuous syngas fermentation for the production of ethanol, n-propanol and n-butanol. Bioresour. Technol. 2014, 151, 69–77. [Google Scholar] [CrossRef] [PubMed]
- Phillips, J.R.; Clausen, E.C.; Gaddy, J.L. Synthesis gas as substrate for the biological production of fuels and chemicals. Appl. Biochem. Biotechnol. 1994, 45, 145–157. [Google Scholar] [CrossRef]
- Ukpong, M.N.; Atiyeh, H.K.; de Lorme, M.J.; Liu, K.; Zhu, X.; Tanner, R.S.; Wilkins, M.R.; Stevenson, B.S. Physiological response of Clostridium carboxidivorans during conversion of synthesis gas to solvents in a gas-fed bioreactor. Biotechnol. Bioeng. 2012, 109, 2720–2728. [Google Scholar] [CrossRef] [PubMed]
- Maddipati, P.; Atiyeh, H.K.; Bellmer, D.D.; Huhnke, R.L. Ethanol production from syngas by clostridium strain p11 using corn steep liquor as a nutrient replacement to yeast extract. Bioresour. Technol. 2011, 102, 6494–6501. [Google Scholar] [CrossRef] [PubMed]
- Datar, R.P.; Shenkman, R.M.; Cateni, B.G.; Huhnke, R.L.; Lewis, R.S. Fermentation of biomass-generated producer gas to ethanol. Biotechnol. Bioeng. 2004, 86, 587–594. [Google Scholar] [CrossRef] [PubMed]
- Cotter, J.L.; Chinn, M.S.; Grunden, A.M. Ethanol and acetate production by Clostridium ljungdahlii and Clostridium autoethanogenum using resting cells. Bioprocess Biosyst. Eng. 2009, 32, 369–380. [Google Scholar] [CrossRef] [PubMed]
- Babu, B.K.; Atiyeh, H.; Wilkins, M.; Huhnke, R. Effect of the reducing agent dithiothreitol on ethanol and acetic acid production by clostridium strain p11 using simulated biomass-based syngas. Biol. Eng. 2010, 3, 19–35. [Google Scholar] [CrossRef]
- Gao, J.; Atiyeh, H.K.; Phillips, J.R.; Wilkins, M.R.; Huhnke, R.L. Development of low cost medium for ethanol production from syngas by Clostridium ragsdalei. Bioresour. Technol. 2013, 147, 508–515. [Google Scholar] [CrossRef] [PubMed]
- Hu, P. Thermodynamic, Sulfide, Redox Potential and pH Effects on Syngas Fermentation. Dissertation, Bringham Young University, Provo, UT, USA, 2011. [Google Scholar]
- Klasson, K.; Ackerson, M.; Clausen, E.; Gaddy, J. Bioreactor design for synthesis gas fermentations. Fuel 1991, 70, 605–614. [Google Scholar] [CrossRef]
- Saxena, J.; Tanner, R.S. Effect of trace metals on ethanol production from synthesis gas by the ethanologenic acetogen, Clostridium ragsdalei. J. Ind. Microbiol. Biotechnol. 2011, 38, 513–521. [Google Scholar] [CrossRef] [PubMed]
- Yasin, M.; Park, S.; Jeong, Y.; Lee, E.Y.; Lee, J.; Chang, I.S. Effect of internal pressure and gas/liquid interface area on the co mass transfer coefficient using hollow fibre membranes as a high mass transfer gas diffusing system for microbial syngas fermentation. Bioresour. Technol. 2014, 169, 637–643. [Google Scholar] [CrossRef] [PubMed]
- Kim, Y.-K.; Lee, H. Use of magnetic nanoparticles to enhance bioethanol production in syngas fermentation. Bioresour. Technol. 2016, 204, 139–144. [Google Scholar] [CrossRef] [PubMed]
- Phillips, J.R.; Klasson, T.K.; Clausen, E.C.; Gaddy, J.L. Biological production of ethanol from coal synthesis gas. Appl. Biochem. Biotechnol. 1993, 39–40, 559–571. [Google Scholar] [CrossRef]
- Munasinghe, P.C.; Khanal, S.K. Syngas fermentation to biofuel: Evaluation of carbon monoxide mass transfer coefficient (kLa) in different reactor configurations. Biotechnol. Prog. 2010, 26, 1616–1621. [Google Scholar] [CrossRef] [PubMed]
- Lee, P.-H.; Ni, S.-Q.; Chang, S.-Y.; Sung, S.; Kim, S.-H. Enhancement of carbon monoxide mass transfer using an innovative external hollow fiber membrane (HFM) diffuser for syngas fermentation: Experimental studies and model development. Chem. Eng. J. 2012, 184, 268–277. [Google Scholar] [CrossRef]
- Ungerman, A.J.; Heindel, T.J. Carbon monoxide mass transfer for syngas fermentation in a stirred tank reactor with dual impeller configurations. Biotechnol. Prog. 2007, 23, 613–620. [Google Scholar] [CrossRef] [PubMed]
- Devarapalli, M.; Atiyeh, H.K.; Phillips, J.R.; Lewis, R.S.; Huhnke, R.L. Ethanol production during semi-continuous syngas fermentation in a trickle bed reactor using Clostridium ragsdalei. Bioresour. Technol. 2016, 209, 56–65. [Google Scholar] [CrossRef] [PubMed]
- Orgill, J.J.; Atiyeh, H.K.; Devarapalli, M.; Phillips, J.R.; Lewis, R.S.; Huhnke, R.L. A comparison of mass transfer coefficients between trickle-bed, hollow fiber membrane and stirred tank reactors. Bioresour. Technol. 2013, 133, 340–346. [Google Scholar] [CrossRef] [PubMed]
- Kundiyana, D.K.; Huhnke, R.L.; Wilkins, M.R. Effect of nutrient limitation and two-stage continuous fermentor design on productivities during “Clostridium ragsdalei” syngas fermentation. Bioresour. Technol. 2011, 102, 6058–6064. [Google Scholar] [CrossRef] [PubMed]
- Rajagopalan, S.; Datar, R.P.; Lewis, R.S. Formation of ethanol from carbon monoxide via a new microbial catalyst. Biomass Bioenerg. 2002, 23, 487–493. [Google Scholar] [CrossRef]
- Richter, H.; Martin, M.; Angenent, L. A two-stage continuous fermentation system for conversion of syngas into ethanol. Energies 2013, 6, 3987–4000. [Google Scholar] [CrossRef]
- Martin, M.E.; Richter, H.; Saha, S.; Angenent, L.T. Traits of selected clostridium strains for syngas fermentation to ethanol. Biotechnol. Bioeng. 2016, 113, 531–539. [Google Scholar] [CrossRef] [PubMed]
- Hurst, K.M.; Lewis, R.S. Carbon monoxide partial pressure effects on the metabolic process of syngas fermentation. Biochem. Eng. J. 2010, 48, 159–165. [Google Scholar] [CrossRef]
- Köpke, M.; Held, C.; Hujer, S.; Liesegang, H.; Wiezer, A.; Wollherr, A.; Ehrenreich, A.; Liebl, W.; Gottschalk, G.; Dürre, P. Clostridium ljungdahlii represents a microbial production platform based on syngas. Proc. Natl. Acad. Sci. USA 2010, 107, 13087–13092. [Google Scholar] [CrossRef] [PubMed]
- Klasson, T.K.; Ackerson, M.D.; Clausen, E.C.; Gaddy, J.L. Biological conversion of coal and coal-derived synthesis gas. Fuel 1993, 72, 1673–1678. [Google Scholar] [CrossRef]
- Liu, K.; Atiyeh, H.K.; Tanner, R.S.; Wilkins, M.R.; Huhnke, R.L. Fermentative production of ethanol from syngas using novel moderately alkaliphilic strains of Alkalibaculum bacchi. Bioresour. Technol. 2012, 104, 336–341. [Google Scholar] [CrossRef] [PubMed]
- Shen, Y.; Brown, R.; Wen, Z. Enhancing mass transfer and ethanol production in syngas fermentation of Clostridium carboxidivorans P7 through a monolithic biofilm reactor. Appl. Energy 2014, 136, 68–76. [Google Scholar] [CrossRef]
- Shen, Y.; Brown, R.; Wen, Z. Syngas fermentation of Clostridium carboxidivoran P7 in a hollow fiber membrane biofilm reactor: Evaluating the mass transfer coefficient and ethanol production performance. Biochem. Eng. J. 2014, 85, 21–29. [Google Scholar] [CrossRef]
- Mohammadi, M.; Younesi, H.; Najafpour, G.; Mohamed, A.R. Sustainable ethanol fermentation from synthesis gas by Clostridium ljungdahlii in a continuous stirred tank bioreactor. J. Chem. Technol. Biotechnol. 2012, 87, 837–843. [Google Scholar] [CrossRef]
- Coulson, J.; Richardson, J.; Sinnot, R. Chemical engineering. In An Introduction to Chemical Engineering Design; Pergamon Press: New York, NY, USA, 1999; p. 838. [Google Scholar]
- Klein, J.; Ziehr, H. Immobilization of microbial cells by adsorption. J. Biotechnol. 1990, 16, 1–15. [Google Scholar] [CrossRef]
- Núñez, M.; Lema, J. Cell immobilization: Application to alcohol production. Enzym. Microb. Technol. 1987, 9, 642–651. [Google Scholar] [CrossRef]
Figure 1.
Continuous syngas fermentation in trickle bed reactor (TBR) setup for counter-current flow. (1) Nitrogen cylinder; (2) Syngas cylinder; (3) Rotameter; (4) mass flow controller; (5) TBR; (6) Sump to hold medium; (7) ORP probe; (8) pH probe; (9) Masterflex pump; (10) Liquid sample port; (11) Acid/base addition port in liquid circulation loop; (12) TBR gas sample port; (13) Pressure gauge; (14) Back pressure regulator; (15) By pass safety line with solenoid valve and pressure switch; (16) Gas bubbler; (17) Ball valve to exhaust line. Dashed lines indicate gas lines and solid lines indicate liquid lines. For co-current flow, gas was fed with the liquid medium from the top of the TBR and exited to the sump. Dashed lines with arrows point in feed and product tanks contain N2 to ensure anaerobic conditions.

Figure 2.
pH and cell mass optical density (OD660) profiles during continuous syngas fermentation in (A) Counter-current and (B) Co-current flow modes at various dilution rates (D1, D2 and D3 of 0.006, 0.009 and 0.012 h−1, respectively); (♦) pH (■) OD660 (━) Gas flow rate (Open symbols indicate flooded TBR; 0 to 174 h: lag phase resulted in no data).
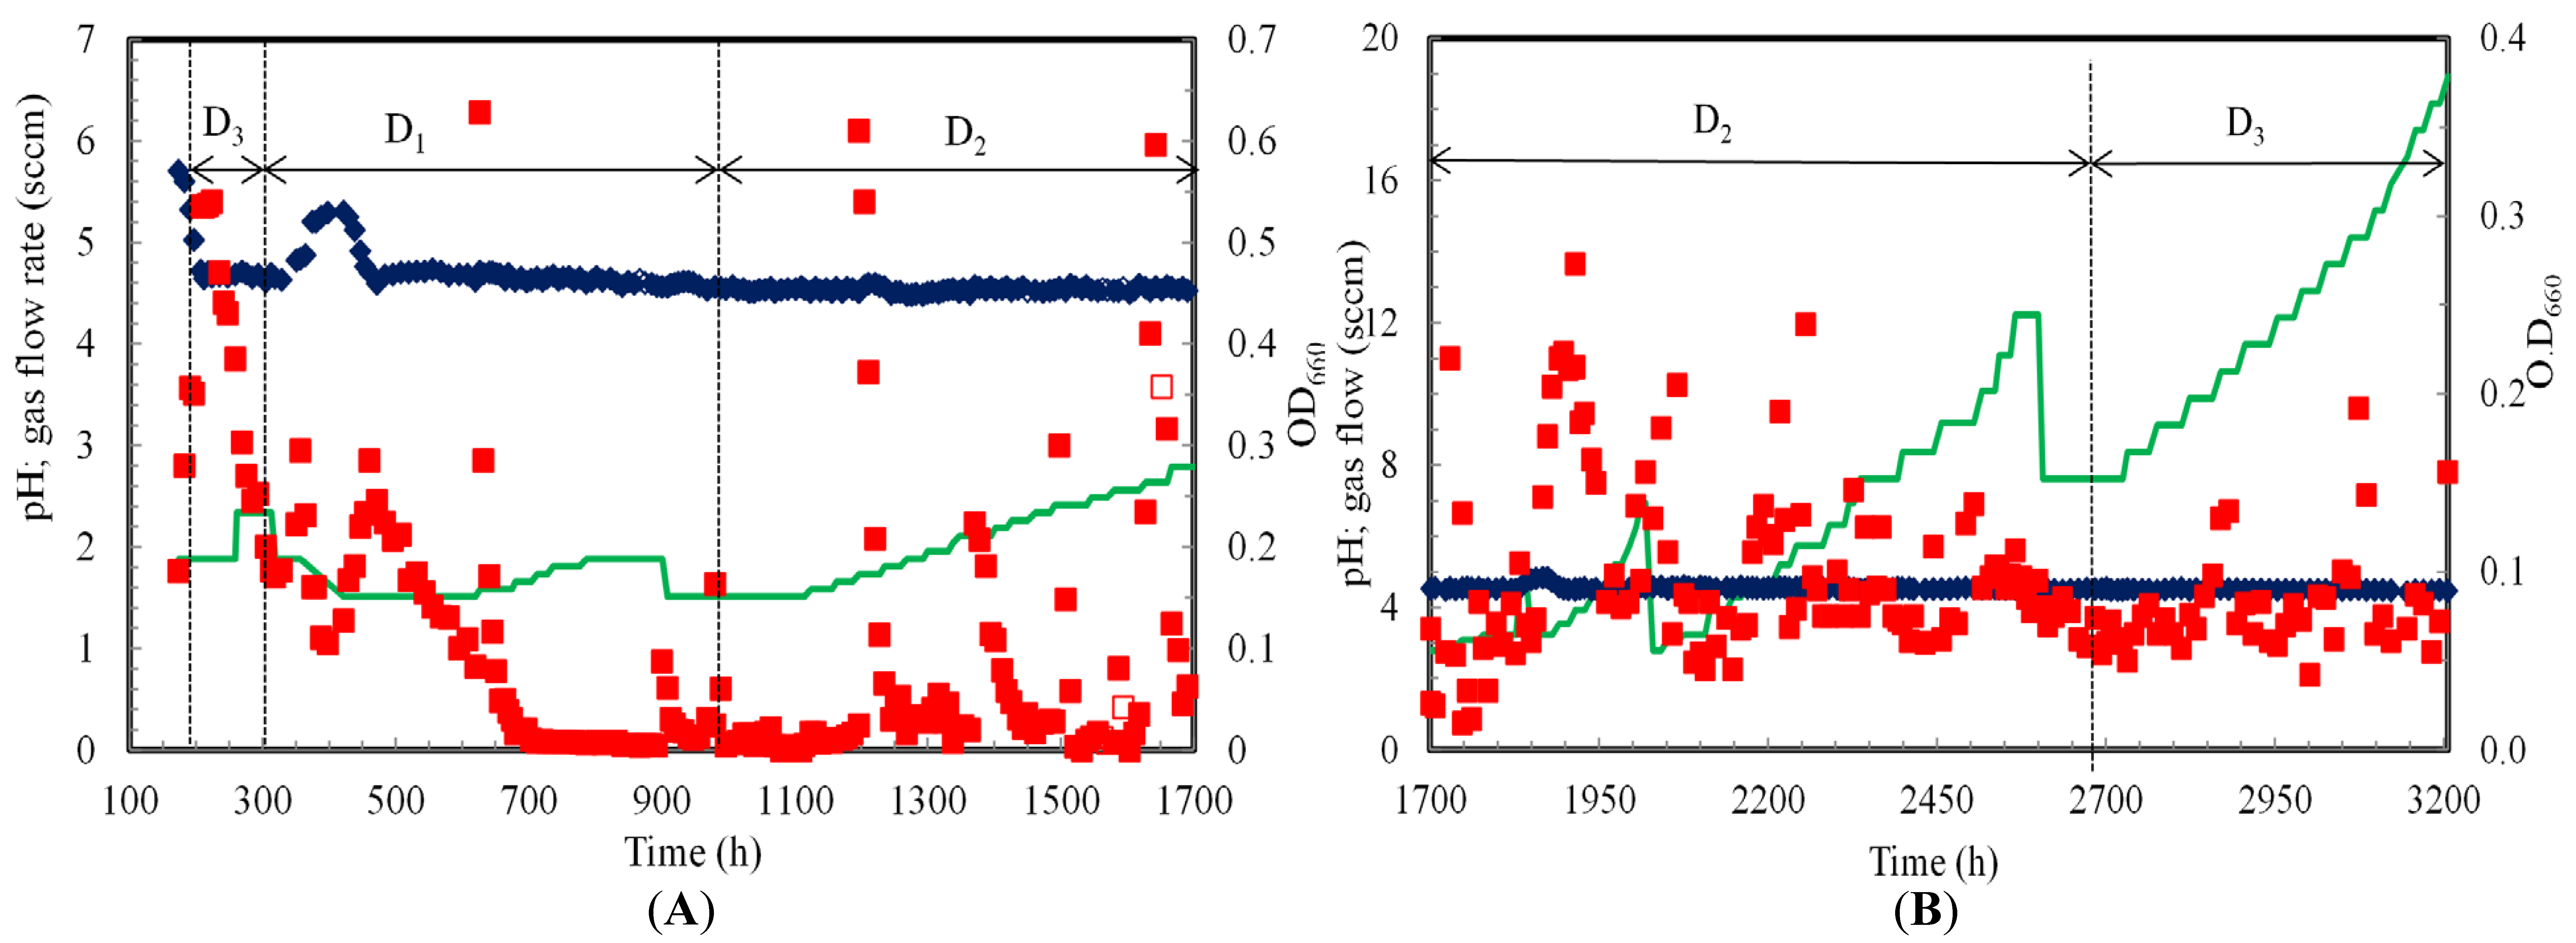
Figure 3.
Gas conversion efficiencies during continuous syngas fermentation in TBR (A) Counter-current and (B) Co-current flow modes at various dilution rates (D1, D2 and D3 are 0.006, 0.009 and 0.012 h−1, respectively); (♦) CO (■) H2 (━) Gas flow rate (Open symbols indicate flooded TBR; 0 h to 174 h: lag phase resulted in no data; 1700 to 2042 h: gas leak resulted in no data).
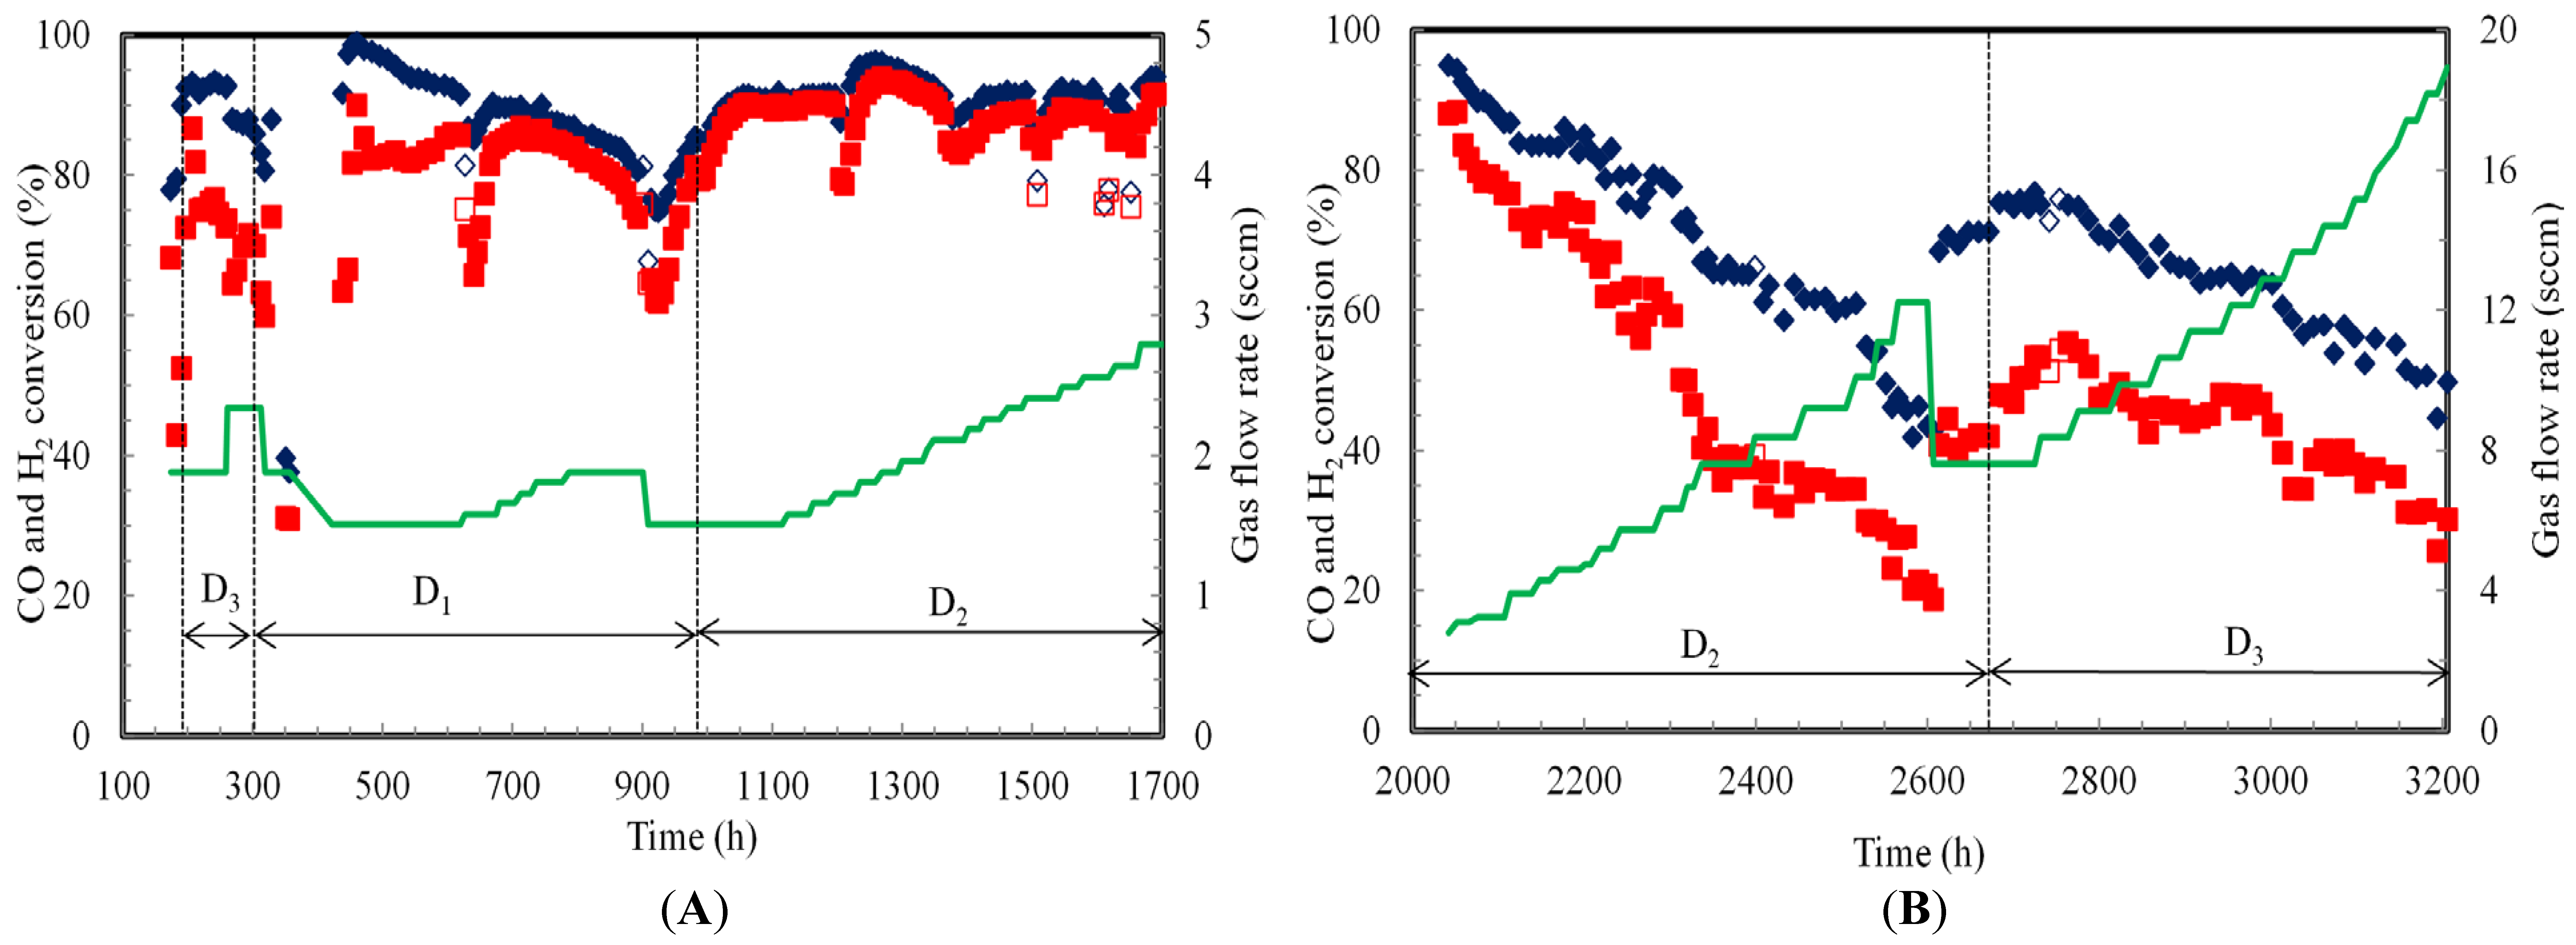
Figure 4.
Gas uptake rates during continuous syngas fermentation in TBR (A) Counter-current and (B) Co-current flow modes at various dilution rates (D1, D2 and D3 are 0.006, 0.009 and 0.012 h−1, respectively); (♦) CO (■) H2 (●) CO+H2 (━) Gas flow rate (Open symbols indicate flooded TBR; 0 h to 174 h: lag phase resulted in no data; 1700 to 2042 h: gas leak resulted in no data).

Figure 5.
Product concentrations during continuous syngas fermentation in TBR. (A) Counter-current and (B) Co-current flow modes at various dilution rates (D1, D2 and D3 are 0.006 h−1, 0.009 h−1 and 0.012 h−1, respectively); (♦) Ethanol (■) Acetic acid (━) Gas flow rate (Open symbols indicate flooded TBR; 0 h to 174 h: lag phase resulted in no data).
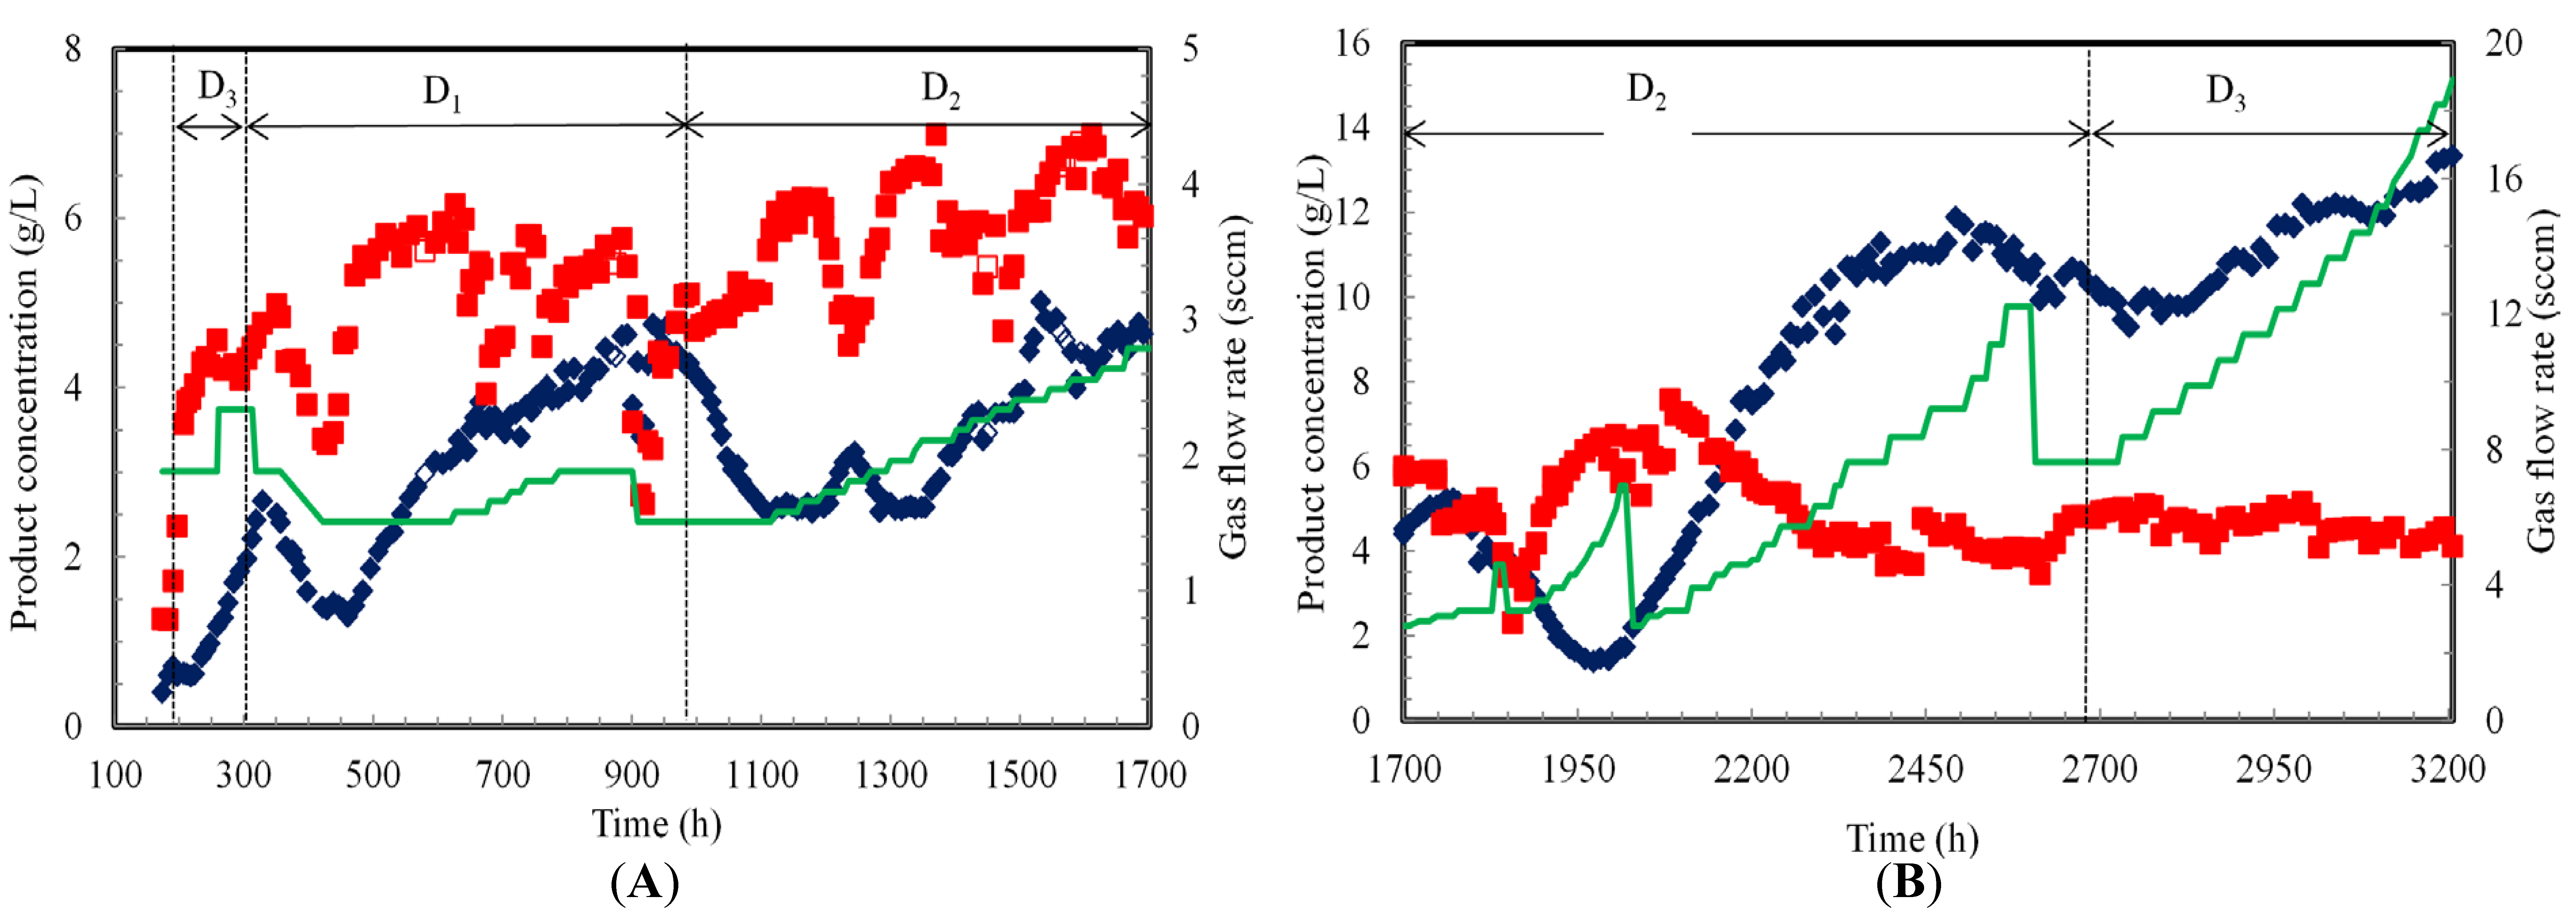
Figure 6.
Product yields based on CO consumed during continuous syngas fermentation in TBR. (A) Counter-current and (B) Co-current flow modes at various dilution rates (D1, D2 and D3 are 0.006, 0.009 and 0.012 h−1, respectively); (♦) Ethanol (■) Acetic acid (━) Gas flow rate. (0 to 174 h: lag phase resulted in no data. 1700 to 2042 h: gas leak resulted in no data.
© 2017 by the authors. Licensee MDPI, Basel, Switzerland. This article is an open access article distributed under the terms and conditions of the Creative Commons Attribution (CC BY) license (http://creativecommons.org/licenses/by/4.0/).
Share and Cite
MDPI and ACS Style
Devarapalli, M.; Lewis, R.S.; Atiyeh, H.K. Continuous Ethanol Production from Synthesis Gas by Clostridium ragsdalei in a Trickle-Bed Reactor. Fermentation 2017, 3, 23. https://doi.org/10.3390/fermentation3020023
AMA Style
Devarapalli M, Lewis RS, Atiyeh HK. Continuous Ethanol Production from Synthesis Gas by Clostridium ragsdalei in a Trickle-Bed Reactor. Fermentation. 2017; 3(2):23. https://doi.org/10.3390/fermentation3020023
Chicago/Turabian StyleDevarapalli, Mamatha, Randy S. Lewis, and Hasan K. Atiyeh. 2017. "Continuous Ethanol Production from Synthesis Gas by Clostridium ragsdalei in a Trickle-Bed Reactor" Fermentation 3, no. 2: 23. https://doi.org/10.3390/fermentation3020023
Note that from the first issue of 2016, this journal uses article numbers instead of page numbers. See further details here.