Development of Probiotic Fruit Juices Using Lactobacillus rhamnosus GR-1 Fortified with Short Chain and Long Chain Inulin Fiber

School of Food and Nutritional Sciences, Brescia University College, Western University, London N6G 1H2, ON, Canada
*
Author to whom correspondence should be addressed.
Fermentation 2018, 4(2), 27; https://doi.org/10.3390/fermentation4020027
Submission received: 14 March 2018
/
Revised: 9 April 2018
/
Accepted: 11 April 2018
/
Published: 16 April 2018
(This article belongs to the Special Issue Microbiota of Fermented Beverages)
Abstract
:Typically, probiotics are consumed in dairy based products such as yogurt. However, given the rise in various diet types, non-dairy alternatives have been developed, such as inoculating fruit juices with probiotics. Lactobacillus rhamnosus GR-1 is a probiotic strain exerting a number of human health benefits such as the prevention of urinary tract infections. Therefore, the objective of this study was to determine the viability of L. rhamnosus GR-1 in apple cider, orange, and grape juice when fortified with either 4% short chain or 4% long chain inulin fiber over 72 h of fermentation and 30 days of refrigerated storage. The secondary objective was to determine consumer acceptability of apple cider and orange juice samples using the hedonic scale. All of the fruit juice samples achieved a mean viable count of at least 107 CFU/mL during 72 h of fermentation and 30 days of refrigerated storage. According to the sensory evaluation, which evaluated samples according to appearance, flavor, texture, and overall acceptability, apple cider juice with long chain inulin fiber proved to have the highest score for all characteristics except appearance. Therefore, this study indicated a potential for probiotic fruit juices as a valid alternative to dairy based probiotic products.
1. Introduction
Probiotics are defined by the World Health Organization as “live microorganisms that when administered in adequate amounts confer a health benefit on the host” [1]. A food product is considered a probiotic if a minimum of CFU/mL (colony forming units per mL) is reached [2,3]. There are many different probiotic strains used in food, but the most commonly used strains belong to the genus of Lactobacillus and Bifidobacterium [4]. The probiotic Lactobacillus rhamnosus GR-1 is bile and acid resistant and can survive passage through the gastrointestinal tract. It has been shown to have a protective effect against urinary tract infections by interfering with the adhesion of urogenital pathogens [5]. This strain is used to produce probiotic yogurt as part of the Western Heads East Initiative (WHE) in Eastern Africa. This project has provided probiotic yogurt to a number of communities in Eastern Africa, and has been shown to be safely consumed by HIV/AIDS patients [5].
Historically, probiotics have been consumed in fermented dairy products such as yogurt. However, there has been a trend for lower cholesterol, lactose free, dairy free, vegetarian, and vegan friendly options [3,6]. A number of studies have investigated the use of fruit juices as a medium for probiotic growth and viability [7,8,9,10,11,12,13,14,15,16,17,18,19,20]. These studies have demonstrated a potential for probiotics in a variety of different fruit juices such as orange, grape, pomegranate, peach, and apple. Furthermore, many studies have investigated microencapsulation methods of preserving probiotic viability in fruit juices [21,22,23,24,25,26,27,28]. Incorporating probiotics into fruit juices has major implications given its popularity as a common drink consumed by North Americans, especially by children. However, an increase in sugar sweetened beverage consumption, including some fruit juices, has raised concerns along with the rising rates of obesity and type two diabetes [29]. Nevertheless, L. rhamnosus GR-1 is a facultative heterofermentative bacterium that utilizes fructose (or fruit sugar) as a substrate for energy to produce organic acids such as lactic acid [30,31]. It has been shown that sugar supports the growth of probiotics [6]. Therefore, in theory, the utilization of sugar by the probiotic in the juices will decrease the sugar content and increase the acidity of the juice. Furthermore, fruit juices provide vitamins, minerals, polyphenols, and flavonoids, which are known for their health promoting effects in reducing chronic disease [8,32].
Prebiotics act as the fuel for probiotics and are found naturally in a variety of foods such as leeks, onions, garlic, and asparagus [33]. Prebiotics have been defined as “a selectively fermented ingredient that allows specific changes, both in composition and/or activity in the gastrointestinal microflora, that confer health benefits” [34]. Prebiotics have been shown to enhance the viability of probiotics and improve gastrointestinal health as well as enhance calcium absorption [33]. Inulin fiber is a type of prebiotic that is a low calorie sweetener and fat substitute that acts as a bulking agent and promotes a healthy gut microflora [35,36]. Short chain inulin fiber has been shown to increase the viability of L. rhamnosus more so than long chain inulin when added to yogurt [35]. Since many North Americans are failing to meet the RDA (recommended dietary allowance) for fiber each day [34], the fortification of inulin fiber to probiotic fruit juices will enable consumers to enhance their fiber intake. Epidemiologic studies suggest that adequate fiber intake is associated with a reduction in cardiovascular disease outcomes and coronary heart disease, mainly by lowering LDL (low-density lipoprotein) cholesterol levels [34]. Inulin fiber has been shown to increase fecal bifidobacteria when consumed in amounts ranging from five to eight grams per day [34].
Although there are many studies evaluating the efficacy of probiotics in fruit juices, none have used L. rhamnosus GR-1 as a strain of choice. Therefore, the aim of this study is to analyze the probiotic potential of L. rhamnosus GR-1 in orange, grape, and apple cider juice fortified with inulin fiber over 30 days of storage and to determine consumer acceptability of these products by conducting sensory evaluation.
2. Materials and Methods
2.1. Probiotic Stock Solution Preparation
L. rhamnosus GR-1 (10% w/v) was inoculated into sterilized De Man, Rogosa, and Sharpe, MRS broth (EMD Millipore Corporation, EMD Chemicals Inc., Gibbstown, NJ, USA) and anaerobically incubated using a gas pack (BD GasPak™ EZ Anaerobe Container System, Becton Dickinson & Co., Sparks, BD, USA) at 37 C for 24 h. After incubation, the stock solution was transferred to a refrigerator at 4 C. Stock solutions were prepared each week to ensure continual viability of L. rhamnosus GR-1.
2.2. Fruit Juice Preparation
Three different types of commercially available 100% pure fruit juices without any added sugars, preservatives, and additives were selected from two local supermarkets. Fresh-pressed Sweet Apple Cider was purchased from Farm Boy™ in London ON Canada, Tropicana Orange Juice® without pulp and R.W Knudsen Organic Concord Grape Juice® were purchased from Loblaws® in London, ON, Canada.
2.2.1. Fruit Juice Fermentation
In a water bath, seven beakers containing 80 mL of each juice was heated until 85 C, this temperature was maintained for 10 min. The juices were cooled to 37 C, subsequently 3.75% (w/v) of the stock culture containing L. rhamnosus GR-1 was added. The bacterial load was based on the percent inoculum which is the method used in other published studies [37]. The juices were covered and gently swirled to ensure the contents were well-mixed. Each of the seven beakers represented a fermentation or storage time. Beaker 1 (time 0) was set aside, while beakers 2–7 (24, 48, 72 h, respectively) were placed in an anaerobic container with a gas pack (BD GasPak™ EZ Anaerobe Container System, Becton Dickinson & Co., Sparks, BD, USA) and incubated at 37 C. Beaker 2 was removed from the incubator after 24 h of fermentation, Beaker 3 after 48 h, and Beakers 4–7 after 72 h. Beakers 5–7 were stored in the refrigerator at 4 C. The fruit juice samples in Beakers 5–7 remained in the fridge for 10, 20, and 30 days of storage respectively. The experiment was done in duplicate, and therefore two true replications were taken for each juice sample.
2.2.2. Fruit Juice with Short and Long Chain Inulin Fiber
Prior to the water bath as mentioned in Section 2.2.1, 4% (w/v) of short chain or long chain inulin fiber (Orafti® P95 Oligofructose Powder, Quadra Chemicals, Burlington, ON, Canada) were added to the respective juice and stirred. This concentration of inulin fiber was used because it is considered an acceptable amount to see an increase in fecal bifidobacteria, when half a cup of juice is consumed. The beakers containing 80 mL of juice plus fiber were then heated until 85 C. This temperature was maintained for 10 min while frequently stirring to ensure the inulin fiber dissolved. The juices were cooled to 37 C and subsequently 3.75% (w/v) of the stock culture containing L. rhamnosus GR-1 was added. The juices were covered and gently swirled to ensure the contents were well-mixed. Each of the beakers represented different fermentation or storage times. For each treatment, Beaker 1 (time 0) was set aside, while Beakers 2–7 (24, 48, 72 h, respectively) were placed in an anaerobic container with a gas pack (BD GasPak™ EZ Anaerobe Container System, Becton Dickinson & Co., Sparks, BD, USA) and incubated at 37 C. Beaker 2 was removed from the incubator after 24 h of fermentation, Beaker 3 after 48 h, and Beakers 4–7 after 72 h. Beakers 5–7 were stored in the refrigerator at 4 C. The fruit juice samples in Beakers 5–7 remained in the fridge for 10, 20, and 30 days of storage respectively. The experiment was done in duplicate, and therefore two true replications were taken for each juice sample.
2.3. Microbial Analysis
Enumeration of L. rhamnosus GR-1 from all fruit juice samples was carried out for fermentation times of 0, 24, 48, and 72 h and during storage period (1, 10, 20, 30 days). Serial dilutions and subsequent plating were used to determine microbial counts of L. rhamnosus GR-1. From the fruit juice samples, 1 mL aliquots were diluted in sterile 0.85% saline solution at the respective dilution factors of , , , , and . Using a pipette, 0.1 mL of each fruit juice sample was plated. Agar plates were prepared using 5.22% (w/v) MRS (EMD Millipore Corporation, Gibbstown, NJ, USA), 1.5% (w/v) agar (EMD Millipore Corporation, Gibbstown, NJ, USA) and 0.0015% (w/v) fusidic acid (Enzo Life Sciences, 10 Executive Blvd, Farmingdale, NY, USA). The plates were inverted and incubated anaerobically at 37 C for 48 h using an anaerobic container and gas pack (BD GasPak™ EZ Anaerobe Container System, Becton Dickinson & Co., Sparks, BD, USA). Viable counts were analyzed and recorded as colony forming units per mL (CFU/mL).
2.4. Analysis of pH
The pH of all fruit juice samples were measured after 0, 24, 48, and 72 h of fermentation as well as after day 1, 10, 20, and 30 (VWR® sympHony™ B10P pH Meter, VMR International, Radnor, PA, USA). An average of two replicates of each juice at each fermentation and storage time was taken.
2.5. Sensory Evaluation
The sensory evaluation procedure was reviewed and approved by Western’s Research Ethics Board. A sensory evaluation of six different fruit juice samples was conducted in the Sensory Lab at Brescia University College, Western University, London, ON, Canada, to determine consumer acceptability. Apple cider juice (control, short chain, and long chain) and orange juice (control, short chain, and long chain) samples were prepared, portioned into randomly coded 30 mL taste-testing cups and stored at 4 C prior to the sensory analysis. A total of 80 untrained panelists between the ages of 18 and 55 provided written consent, and took part in the sensory evaluation. Each participant was provided a letter of information, a consent form, a questionnaire to complete during the analysis, a tray consisting of a cup of water, six different samples with a random three-digit codes, and a $4 Tim Hortons gift card for compensation. Each panelist was instructed to take a seat in the sensory lab room which consists of individualized booths, to refrain from talking and to taste samples from left to right cleansing the palate with the water provided in between samples. Panelists were also invited to complete the questionnaire provided, which consisted of a hedonic scale on the first page, where individuals were able to rate samples from 1 (“dislike extremely”) to 9 (“like extremely”) according to appearance, flavor, texture, and overall acceptability. The second page of the questionnaire consisted of questions relating to consumption patterns of yogurt and fruit juice, preferred samples, favourite fruit juice, and comments on the juices.
2.6. Statistical Analysis
All statistical analyses were conducted using SAS® 9.4 Software (SAS Institute Inc., Cary, NC, USA). A one-way repeated measures analysis of variance (ANOVA) was used to analyze the relationship between samples and between the 30 days of storage on the viability of L. rhamnosus GR-1. A one-way ANOVA and the least significant difference test (LSD) was used to analyze pairwise comparisons of the means when there was a significant difference (p < 0.05). A repeated measures ANOVA was used to determine if there was a significant difference (p < 0.05) amongst mean scores according to the hedonic ratings for appearance, flavor, texture, and overall appearance. Tukey’s studentized range test was used to adjust for multiple comparisons when examining pairwise differences amongst hedonic scores.
3. Results
3.1. Microbial Analysis
L. rhamnosus GR-1 reached viable counts of at least CFU/mL in all of the fruit juice samples (apple cider, orange, and grape) during fermentation. There was no significant difference (p > 0.05) in mean microbial counts over the duration of the fermentation time (Table 1). However, there was a significant difference (p < 0.05) between the juice and the fermentation time. For example, after 24 h of fermentation, the OC sample had an average count of 7.35 (7.28) which was significantly higher (p < 0.05) compared to AC having an average count of 2.86 (1.95) (Table 1). The average count of apple cider juice samples, for example ASC was 3.47 (1.63) after 48 h compared to GSC which had a significantly (p < 0.05) lower mean count of 0.37 (0.00) after 48 h (Table 1). When analyzing the orange juice samples after 24, 48, and 72 h, the mean count of OLC for example, was 6.60 ( 2.70), 5.53 (1.25), and 5.91 (4.69) respectively. These mean counts were significantly higher (p < 0.05) when compared to OLC at time 0, in which the mean count was 2.83 (2.05) (Table 1). There was no significant difference on the viability of L. rhamnosus GR-1 in juices when either short chain or long chain inulin fiber was added.
L. rhamnosus GR-1 reached viable counts of at least CFU/mL in all fruit juice samples (apple cider, orange, and grape) during refrigerated storage. Interestingly, only the orange juice samples did not have a significant difference (p > 0.05) in mean microbial counts over 30 days of storage. For example, the mean count for the OC sample after 10, 20, and 30 days of storage was 6.02 (1.40), 8.01 (2.69), and 10.7 (2.34) respectively (Table 2). However, in the apple cider and grape juice samples, there was a significant difference (p < 0.05) in mean microbial counts over 30 days of storage (Table 2). The mean count for the AC sample was 0.45 (0.40) after 30 days of storage. This was significantly lower when compared to the mean count of 3.00 (2.23) on day 1 (Table 2). Furthermore, the mean count in the GC sample was 0.05 (0.04) and 0.01 (0.01) after 20 and 30 days of storage, respectively. This was significantly lower (p < 0.05) when compared to day 1 which had a mean count of 2.37 (1.68). When comparing the mean counts of the OC, AC, and GC samples after 30 days of storage, the OC sample had a mean count of 10.7 (2.34), which was significantly higher than GC and AC having mean counts of 0.01 (0.01) and 0.45 (0.40), respectively. There was no significant difference on the viability of L. rhamnosus GR-1 in juices when either short chain or long chain inulin fiber was added.
3.2. pH Analysis
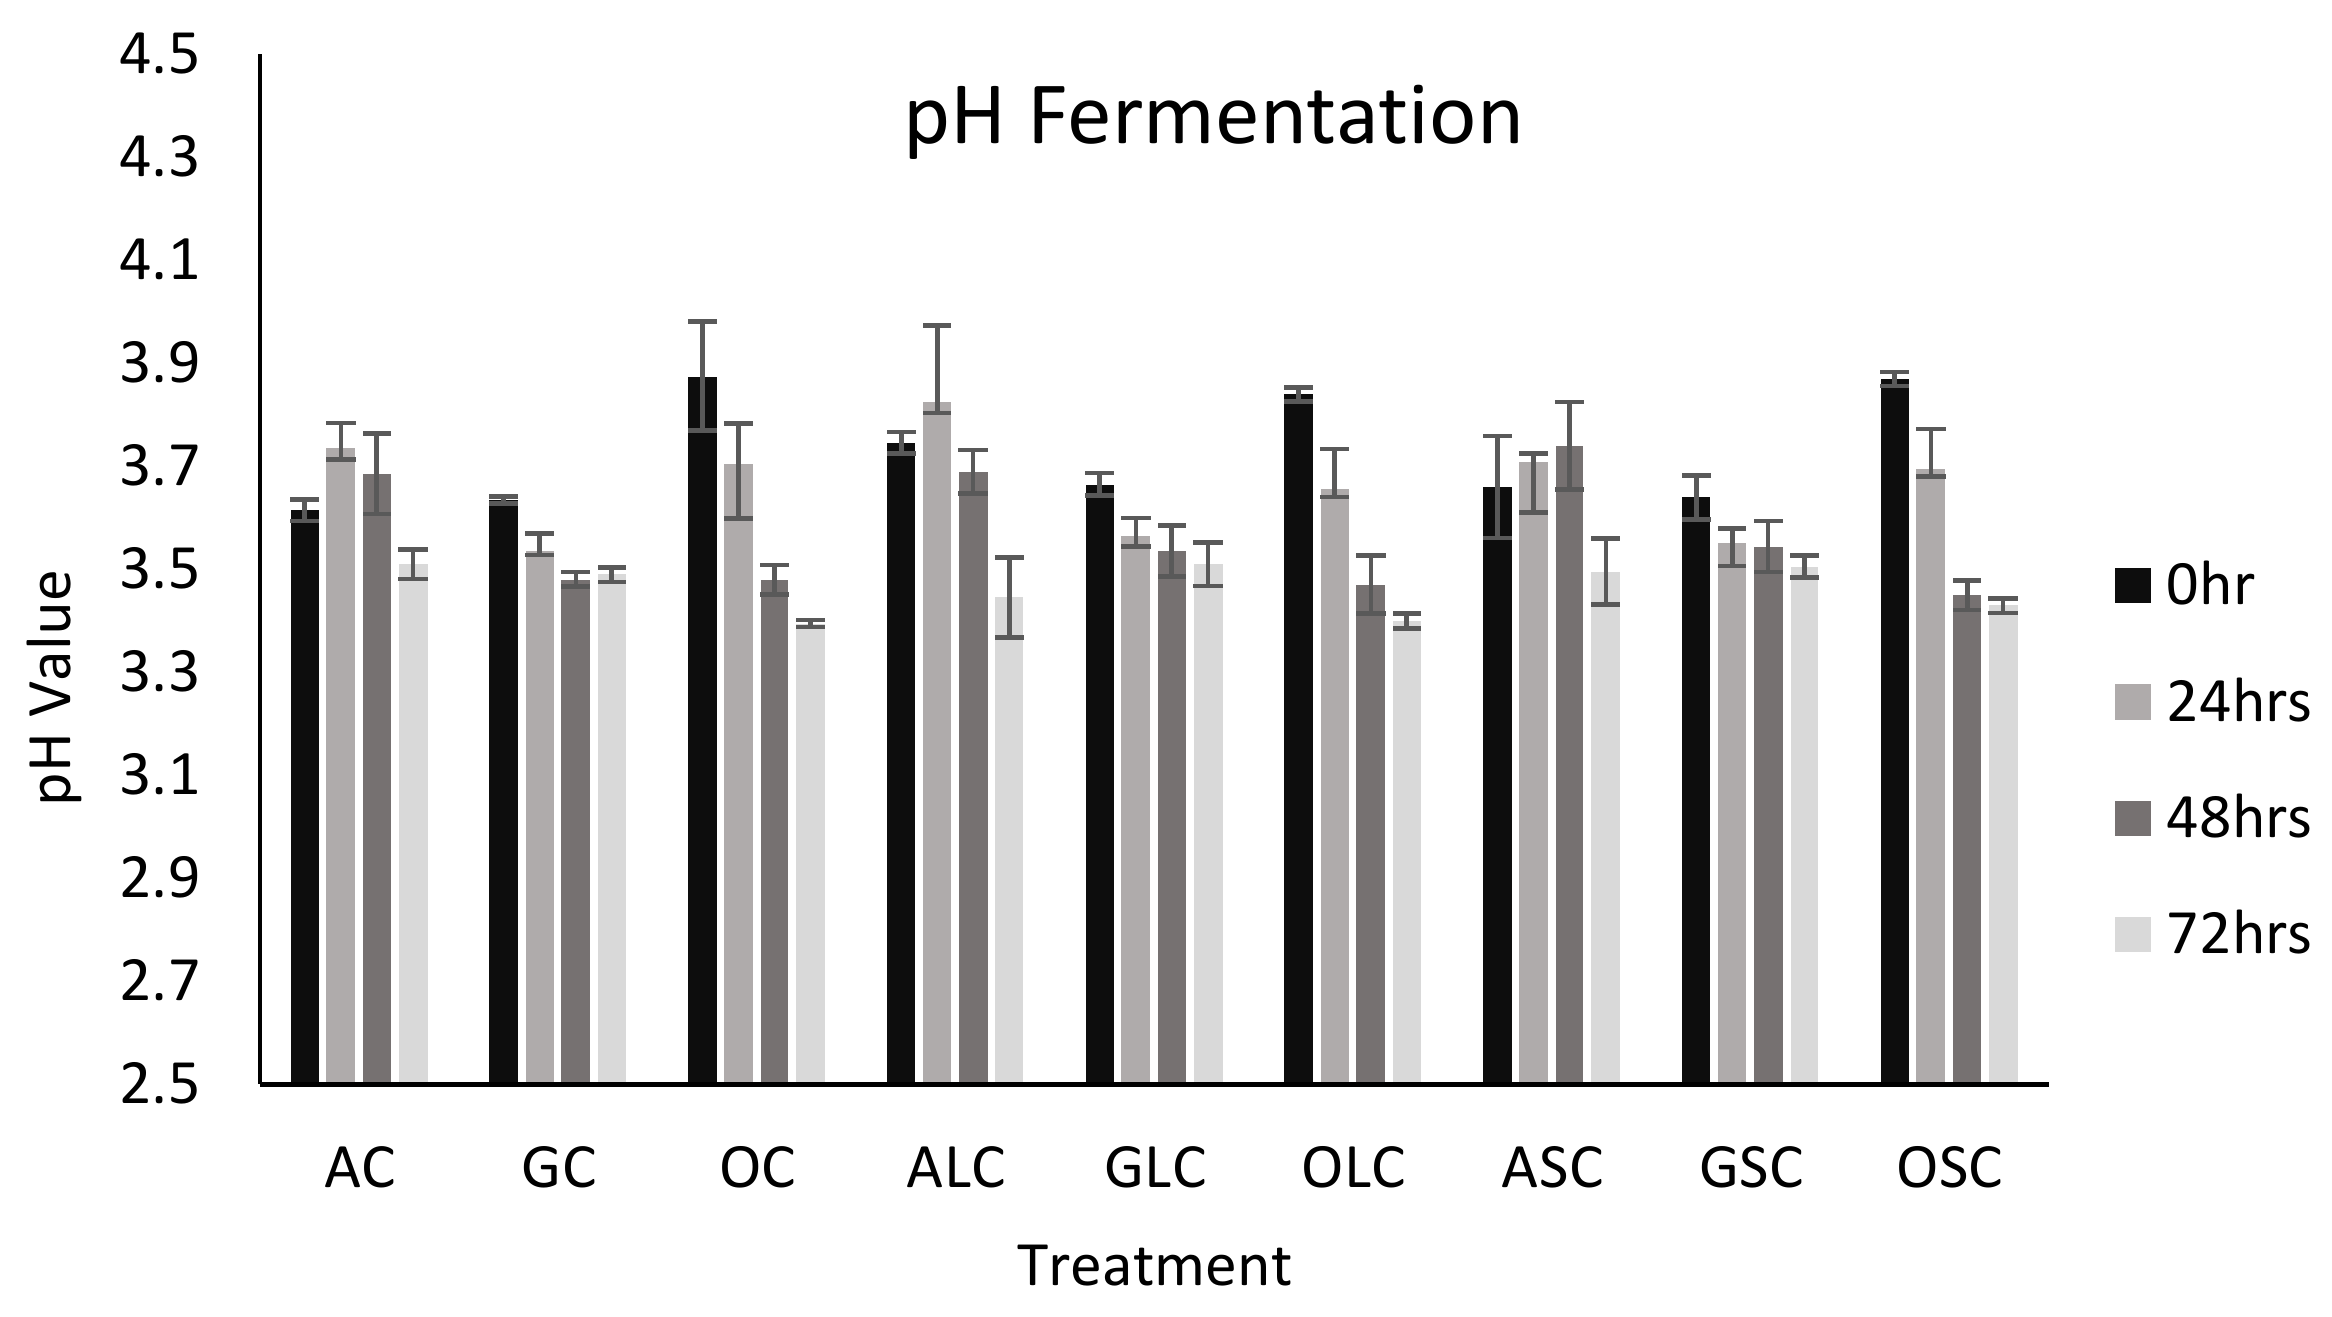
Bacterial counts and pH were both measured from the same sample during fermentation and the storage period. There was a general decrease in pH over 72 h of fermentation in all fruit juices which resulted from the production of lactic acid. For example, the average pH after time 0 for GLC was 3.66 (0.02), this was significantly higher (p < 0.05) when compared to 72 h, where the average pH value was 3.51 (0.04) (Figure 1). When analyzing the type of juice and the length of fermentation, there was a significant difference (p < 0.05). For example, the average pH of the AC sample was 3.51 (0.02) after 72 h of fermentation. This was significantly lower (p < 0.05) when compared to the average pH of 3.61 (0.02) after 0 h (Figure 1). When comparing orange juice samples to apple cider juice samples at time 0, OSC had a mean pH value of 3.87 (0.01) which was significantly higher (p < 0.05) than the mean pH value of 3.66 (0.09) for ASC. Interestingly, after 72 h of fermentation, the pH of orange juice was significantly lower compared to apple cider juice. This result was also similar between the orange juice and grape juice samples, but differed between the grape and apple cider juice samples, where the pH of the apple cider juice was significantly higher than the grape juice samples (p < 0.05). The type of fiber, either short or long chain inulin, did not have an effect on the pH of the juices.
There was an increase in the pH of the fruit juices over the 30 day storage period except in orange juice samples which did not have a significant change (Figure 2). This increase in pH was likely due to the breakdown of acids. The buffering capacity of the acids in the orange juice samples, allowed the pH to remain constant [20]. For example when analyzing the change in pH amongst grape and apple cider juice samples, there was a significant increase (p < 0.05) in pH. The average pH value in GC was 3.49 (0.01) after day 1 and 3.63 (0.01) after day 30. Similarly, the pH of AC was 3.51 (0.02) and 3.78 (0.09) after day 1 and day 30, respectively. This result differed from orange juice samples which did not significantly (p > 0.05) change in pH when comparing day 10, 20, and 30 to day 1. For example, in the OLC sample, the pH after day 10, 20, and 30 was 3.43 (0.1), 3.47 (0.02), and 3.43 (0.08) respectively which compares to 3.40 (0.01) after day 1. The chain length, either short or long chain inulin fiber, did not have an effect on the pH of the juices during refrigerated storage.
3.3. Sensory Analysis
A total of six different samples (three apple ciders and three orange juices) were presented to the panelists to taste. These two juices were selected based upon the experimental data which indicated that these juices had the highest viability after fermentation and refrigerated storage. Furthermore, six was the maximum number of samples used to avoid overwhelming the panelists with too many samples. The mean appearance scores are shown in Figure 3. Overall, there was a significantly higher (p < 0.05) mean score based on appearance for orange juice samples compared to apple cider juice samples. This was likely attributed to the residue left at the bottom of the apple juice samples, which may have not been well-liked by the panelists. The highest mean score was 7.49 for OSC. The hedonic score of 7 correlates with “like moderately”, whereas the highest mean score for apple cider juice was 5.96 for AC. The hedonic score of 5 correlates with “neither like nor dislike.”
In terms of flavour, the apple cider juice samples had a significantly higher (p < 0.05) mean score for flavour compared to the orange juice samples (Figure 4). This was likely attributed to the more acidic/sour taste of the orange juice samples. There was no significant difference (p > 0.05) between OC and OLC nor between OLC and OSC; however, OSC had a significantly higher mean score compared to OC. The highest mean score for flavour was 7.23 for ALC, whereas the lowest mean score was 4.94 for OC. A hedonic score of 7 correlates with “like moderately”, while a score of 4 correlates with “dislike slightly.”
The panelists ratings according to texture were fairly consistent across all orange and apple cider juice samples (Figure 5). The apple cider juice samples had a significantly higher score compared to OC and similarly, the orange juice samples had a significantly lower score (p < 0.05) compared to the ALC sample. The highest mean score was 7.74 for ALC and the lowest was 6.82 for OC. A hedonic score of 7 correlates with “like moderately”, whereas a score of 6 correlates with “like slightly”.
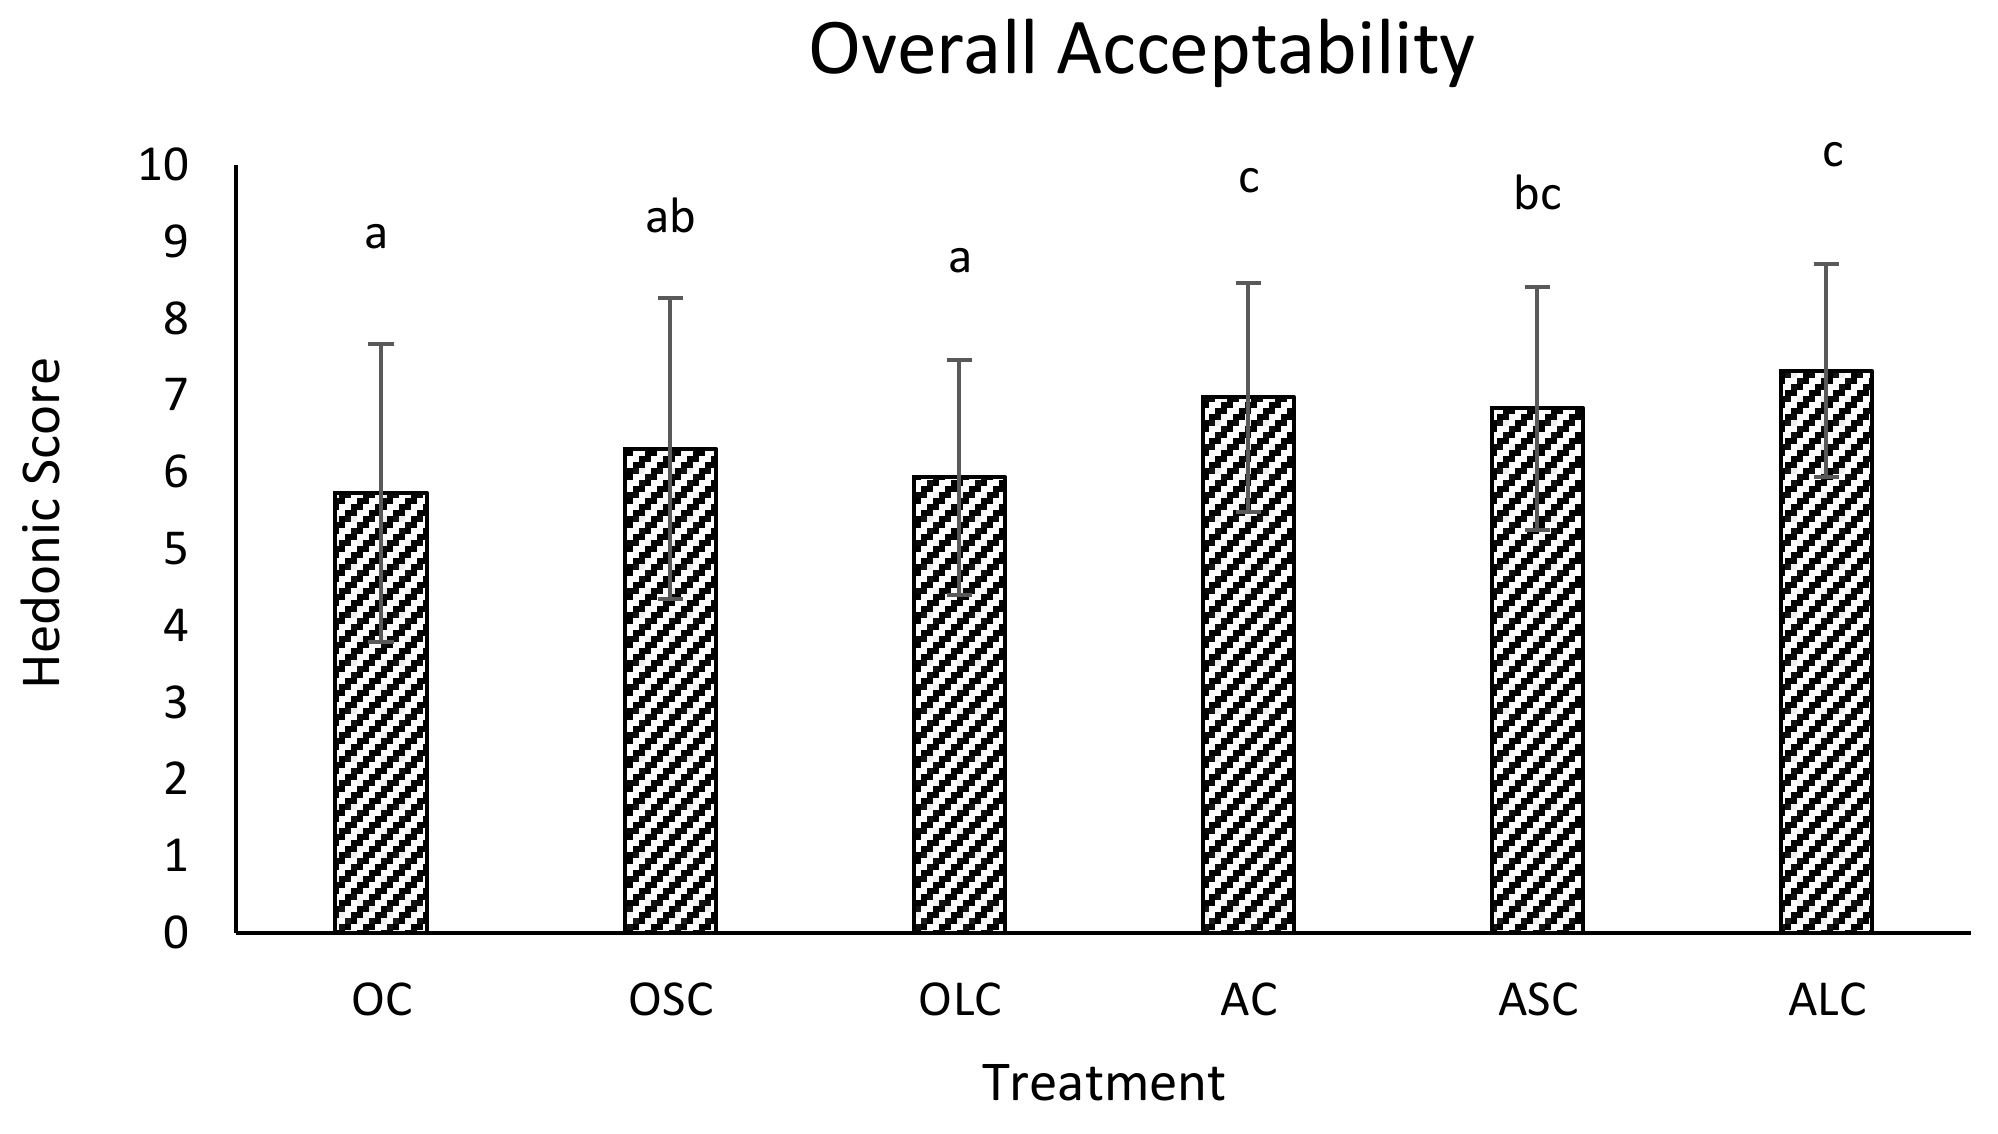
There was a significant difference in mean scores for overall acceptability between OC, OLC, and the apple cider juice samples (AC, ASC, and ALC) (Figure 6). However, there was no significant difference (p > 0.05) between OSC and ASC. The AC and ALC sample had significantly higher mean scores compared to OC and OLC. (p < 0.05) The highest hedonic score was 7.32 for ALC and the lowest mean score was 5.73 for OC. A hedonic score of 7 correlates to “like moderately”, and a score of 5 correlates to “neither like nor dislike”.
The second part of the questionnaire consisted of questions pertaining to the participants consumption patterns and preferences (data not shown). When asked if there were any samples that would be purchased, 94.7% indicated yes and, among these responses, the majority would purchase ALC. When asked if fruit juice or yogurt was preferred, 61.4% of respondents preferred to consume yogurt compared to 36% of respondents that preferred fruit juices. The participants who preferred yogurt over fruit juice indicated that it was due to the high sugar content in fruit juices. When asked what type of juice in general was their favourite, the top three reported juices were orange juice, apple juice or apple cider juice, and mango juice.
4. Discussion
The objective of this research was to determine the viability of L. rhamnosus GR-1 in apple cider, and grape and orange juice and whether or not the fortification of inulin fiber would have an effect on viability. The secondary objective, was to determine consumer acceptability of the fruit juices based on appearance, flavour, texture, and overall acceptability. Based on the results of this study, L. rhamnosus GR-1 reached viable counts of at least CFU/mL (Table 1 and Table 2), which exceeds the minimum requirement to be considered a probiotic [2,3]. Orange juice had the greatest viability during fermentation and storage, whilst grape juice had showed the lowest viability, especially during the 30 day storage period (Table 2).
Several studies have reported the ability of probiotic strains to grow in fruit juices. The work of Pakbin et al., showed that the combination of L. casei, L. delbrueckii, and L. plantarum were able to grow in peach juice and reached viable counts of CFU/mL [7]. The work of Espirito-Santo et al., analyzed the growth of various strains of lactobacilli in apple, grape, and orange juice showed that there were higher counts in apple juice compared to grape and orange juice after 48 h of fermentation [15]. This differed from our results, as we observed a higher increase in orange juice samples compared to apple cider and grape juice. This difference may be attributed to differences in lactobacilli strains as Espirito-Santo et al., found that commercial lactobacilli strains reached higher counts compared to the same lactobacilli species but isolated from artisanal products [15]. Furthermore, differences in brands and types of juice used could have an effect as well, such as using apple juice vs. apple cider juice. In another study by Nagpal et al., fermented orange, apple, grape, and tomato juice were incubated with lactobacilli isolates (L. plantarum and L. acidophilus) which reached CFU/mL after 72 h of fermentation [12]. This study also aligns with our results as we saw a similar, yet lower CFU/mL and a comparable decline in pH after 72 h of fermentation [12]. The work of Champagne et al., determined the stability and viability of L. rhamnosus in pineapple, orange, and apple juice with dairy, L. rhamnosus showed greater viability in orange and pineapple juice compared to apple juice when stored for 28 days [18]. This supports our findings as orange juice had the highest viability and no significant change in viable counts after 30 days of storage.
In our study, we found that there was no effect on the growth and viability of L. rhamnosus GR-1 when short chain and long chain inulin fiber was added. However, other studies have shown that the addition of inulin fiber increases cell viability in yogurt [30,37]. The work of Nikmaram et al., added inulin fiber to pomegranate juice supplemented with yogurt, and found that the survival of L. casei was increased [38]. In another study by Anvari et al., when inulin fiber was added to apple juice fermented with Bifidobacterium animalis subsp lactis PTCC 1736, there was a significant effect on the growth of this probiotic [39]. These distinctions could be attributed to differences in inulin concentration and or chain length as well as variations in bacterial strains used.
According to the results of the sensory analysis, apple cider juice samples were preferred over orange juice samples based on mean hedonic scores for flavour (Figure 4). In a study by Luckow et al., L. paracasei was added to orange juice. Three different samples of orange juice were provided to the participants. A control, an orange juice sample containing probiotics and a “mask” sample of orange juice, probiotics and tropical fruit. Participants responded favourably towards the “masked sample” [40]. This is similar to the results of our study, as the orange juice sample was not as well liked compared to the apple cider sample. Some participants commented on the acidity of the orange juice deeming it unfavourable. Furthermore, fermented cashew apple juice by L. casei showed to be well accepted [41]. Although we did not use cashew apple juice, the apple cider juice samples were well liked.
There have also been a number of studies that have investigated and compared the growth and viability of microencapsulated probiotics to free probiotic cells. It has been shown that microencapsulated probiotics are better able to survive compared to free cells. In a study by Gandomi et al., L. rhamnosus GG was encapsulated with alginate and chitosan in apple juice. This study showed that apple juice with free probiotic cells was considered less desirable in terms of flavour compared to encapsulated probiotics [22]. This is something that could be considered for future research, to determine if encapsulating L. rhamnosus GR-1 would increase the viability and sensory characteristics of the juices.
5. Conclusions
Apple cider, and grape and orange juice—when fortified with inulin fiber and fermented with L. rhamnosus GR-1—proved to be an acceptable alternative to dairy based probiotic products. These juices had viable counts greater than the minimum requirement to be considered probiotic. Notably, orange juice had the highest viable counts throughout fermentation and 30 days of refrigerated storage. The results from the sensory evaluation indicate an optimistic response for apple cider juice, and therefore a potential for probiotic fruit juices. The role of probiotics and prebiotics on gut health has been established through many studies. The use of probiotics to prevent and mitigate disease such as the use of L. rhamnosus GR-1 in the prevention of urinary tract infections is well known. Therefore, probiotic fruit juices provide a viable and non-dairy alternative to consumers.
Acknowledgments
The authors acknowledge Brescia University College at Western University, Ontario Canada, for providing the use of the food science lab, and the lab equipment necessary to conduct this study.
Author Contributions
Jessica White performed the experiments, analyzed the data, and drafted this paper. Sharareh Hekmat designed the experiments, revised the manuscript, and approved the final version for publication. All authors read and approved the final manuscript.
Conflicts of Interest
The authors declare no conflict of interest.
References
- FAO/WHO. Guidelines for the Evaluation of Probiotics in Food; FAO/WHO: London, ON, Canada, 2002. [Google Scholar]
- Shah, N. Probiotic Bacteria: Selective enumeration and survival in dairy foods. J. Dairy Sci. 2000, 83, 894–907. [Google Scholar] [CrossRef]
- Bansal, S.; Mangal, M.; Sharma, S.K.; Gupta, R.K. Non-dairy Based Probiotics: A Healthy Treat for Intestine. Crit. Rev. Food Sci. Nutr. 2016, 56, 1856–1867. [Google Scholar] [CrossRef] [PubMed]
- Sanchez, B.; Delgado, S.; Blanco-Miguez, A.; Lourenco, A.; Gueimonde, M.; Margolles, A. Probiotics, gut microbiota, and their influence on host health and disease. Mol. Nutr. Food Res. 2017, 61, 1–15. [Google Scholar] [CrossRef] [PubMed]
- Reid, G. The development of probiotics for women’s health. Can. J. Microbiol. 2017, 63, 269–277. [Google Scholar] [CrossRef] [PubMed]
- Kumar, B.V.; Vijayendra, S.V.N.; Reddy, O.V.S. Trends in dairy and non-dairy probiotic products—A review. J. Food Sci. Technol. 2015, 52, 6112–6124. [Google Scholar] [CrossRef] [PubMed]
- Pakbin, B.; Razavi, S.H.; Mahmoudi, R.; Gajarbeygi, P. Producing Probiotic Peach Juice. Biotechnol. Health Sci. 2014, 1, 1–5. [Google Scholar] [CrossRef]
- Pimentel, T.C.; Madrona, G.S.; Garcia, S.; Prudencio, S.H. Probiotic viability, physicochemical characteristics and acceptability during refrigerated storage of clarified apple juice supplemented with Lactobacillus paracasei ssp. paracasei and oligofructose in different package type. LWT Food Sci. Technol. 2015, 63, 415–422. [Google Scholar] [CrossRef]
- De Souza Neves Ellendersen, L.; Granato, D.; Guergoletto, K.B.; Wosiacki, G. Development and sensory profile of a probiotic beverage from apple fermented with Lactobacillus casei. Eng. Life Sci. 2012, 12, 475–485. [Google Scholar] [CrossRef]
- Pereira, A.L.F.; Maciel, T.C.; Rodrigues, S. Probiotic beverage from cashew apple juice fermented with Lactobacillus casei. Food Res. Int. 2011, 44, 1276–1283. [Google Scholar] [CrossRef]
- Dimitrovski, D.; Velickova, E.; Langerholc, T.; Winkelhausen, E. Apple juice as a medium for fermentation by the probiotic Lactobacillus plantarum PCS 26 strain. Ann. Microbiol. 2015, 65, 2161–2170. [Google Scholar] [CrossRef]
- Nagpal, R.; Kumar, A.; Kumar, M. Fortification and fermentation of fruit juices with probiotic lactobacilli. Ann. Microbiol. 2012, 62, 1573–1578. [Google Scholar] [CrossRef]
- Fonteles, T.V.; Costa, M.G.M.; de Jesus, A.L.T.; Rodrigues, S. Optimization of the Fermentation of Cantaloupe Juice by Lactobacillus casei NRRL B-442. Food Bioprocess Technol. 2011, 1–8. [Google Scholar] [CrossRef]
- Mousavi, Z.; Mousavi, S.; Razavi, S.; Emam-Djomeh, Z.; Kiani, H. Fermentation of pomegranate juice by probiotic lactic acid bacteria. World J. Microbiol. Biotechnol. 2011, 27, 123–128. [Google Scholar] [CrossRef]
- Paula Espirito-Santo, A.; Carlin, F.; Renard, C.M.G. Apple, grape or orange juice: Which one offers the best substrate for lactobacilli growth?—A screening study on bacteria viability, superoxide dismutase activity, folates production and hedonic characteristics. Food Res. Int. 2015, 78, 352–360. [Google Scholar] [CrossRef] [PubMed]
- Da Costa, G.M.; de Carvalho Silva, J.V.; Mingotti, J.D.; Barao, C.E.; Klososki, S.J.; Pimentel, T.C. Effect of ascorbic acid or oligofructose supplementation on L. paracasei viability, physicochemical characteristics and acceptance of probiotic orange juice. LWT Food Sci. Technol. 2017, 75, 195–201. [Google Scholar] [CrossRef]
- Bevilacqua, A.; Campaniello, D.; Corbo, M.R.; Maddalena, L.; Sinigaglia, M. Suitability of Bifidobacterium spp. and Lactobacillus plantarum as Probiotics Intended for Fruit Juices Containing Citrus Extracts. J. Food Sci. 2013, 78, 1764–1771. [Google Scholar] [CrossRef] [PubMed]
- Champagne, C.P.; Gardner, N.J. Effect of storage in a fruit drink on subsequent survival of probiotic lactobacilli to gastro-intestinal stresses. Food Res. Int. 2008, 41, 539–543. [Google Scholar] [CrossRef]
- Giang, N.T.T.; Kieu, N.T.; Nam, T.N.; Dao, D.T.A.; Minh, N.P. Cashew Apple Juice Anacardium Occidentale L Probiotic Fermented from Lactobacillus acidophilus. Eur. J. Sustain. Dev. 2013, 2, 99–108. [Google Scholar] [CrossRef]
- Nualkaekul, S.; Charalampopoulos, D. Survival of Lactobacillus plantarum in model solutions and fruit juices. Int. J. Food Microbiol. 2011, 146, 111–117. [Google Scholar] [CrossRef] [PubMed]
- Mishra, A.; Athmaselvi, K. Stress Tolerance and Physicochemical Properties of Encapsulation Processes for Lactobacillus rhamnosus in Pomegranate (Punica granatum L.) Fruit Juice. Food Sci. Biotechnol. 2016, 25, 125–129. [Google Scholar] [CrossRef]
- Gandomi, H.; Abbaszadeh, S.; Misaghi, A.; Bokaie, S.; Noori, N. Effect of chitosan-alginate encapsulation with inulin on survival of Lactobacillus rhamnosus GG during apple juice storage and under simulated gastrointestinal conditions. LWT Food Sci. Technol. 2016, 69, 365–371. [Google Scholar] [CrossRef]
- Krasaekoopt, W.; Watcharapoka, S. Effect of addition of inulin and galactooligosaccharide on the survival of microencapsulated probiotics in alginate beads coated with chitosan in simulated digestive system, yogurt and fruit juice. LWT Food Sci. Technol. 2014, 57, 761–766. [Google Scholar] [CrossRef]
- Mokhtari, S.; Khomeiri, M.; Jafari, S.M.; Maghsoudlou, Y.; Ghorbani, M. Descriptive analysis of bacterial profile, physicochemical and sensory characteristics of grape juice containing Saccharomyces cerevisiae cell wall-coated probiotic microcapsules during storage. Int. J. Food Sci. Technol. 2017, 52, 1042–1048. [Google Scholar] [CrossRef]
- Nualkaekul, S.; Cook, M.T.; Khutoryanskiy, V.V.; Charalampopoulos, D. Influence of encapsulation and coating materials on the survival of Lactobacillus plantarum and Bifidobacterium longum in fruit juices. Food Res. Int. 2013, 53, 304–311. [Google Scholar] [CrossRef]
- Nualkaekul, S.; Lenton, D.; Cook, M.T.; Khutoryanskiy, V.V.; Charalampopoulos, D. Chitosan coated alginate beads for the survival of microencapsulated Lactobacillus plantarum in pomegranate juice. Carbohydr. Polym. 2012, 90, 1281–1287. [Google Scholar] [CrossRef] [PubMed]
- Teanpaisan, R.; Chooruk, A.; Kampoo, T. Survival of free and microencapsulated human-derived oral probiotic Lactobacillus paracasei SD1 in orange and aloe vera juices. Songklanakarin J. Sci. Technol. 2015, 37, 265–270. [Google Scholar]
- Ying, D.; Schwander, S.; Weerakkody, R.; Sanguansri, L.; Gantenbein-demarchi, C.; Augustin, M.A. Microencapsulated Lactobacillus rhamnosus GG in whey protein and resistant starch matrices: Probiotic survival in fruit juice. J. Funct. Foods 2013, 5, 98–105. [Google Scholar] [CrossRef]
- Helm, L.; Macdonald, I.A. Impact of beverage intake on metabolic and cardiovascular health. Nutr. Rev. 2017, 73 (Suppl. S2), 120–129. [Google Scholar] [CrossRef]
- De Souza Oliveira, R.P.; Perego, P.; de Oliveira, M.N.; Converti, A. Effect of inulin on the growth and metabolism of a probiotic strain of Lactobacillus rhamnosus in co-culture with Streptococcus thermophilus. LWT Food Sci. Technol. 2012, 47, 358–363. [Google Scholar] [CrossRef] [Green Version]
- Di Stefano, E.; White, J.; Seney, S.; Hekmat, S.; Mcdowell, T.; Sumarah, M.; Reid, G. A Novel Millet-Based Probiotic Fermented Food for the Developing World. Nutrients 2017, 9, 529. [Google Scholar] [CrossRef] [PubMed]
- Hyson, D.A. A Comprehensive Review of Apples and Apple Components and Their Relationship to Human Health. Adv. Nutr. 2011, 2, 408–420. [Google Scholar] [CrossRef] [PubMed]
- Newgent, J. Prebiotics and Probiotics: The Dynamic Duo; Academy of Nutrition and Dietetics: Chicago, IL, USA, 2013; pp. 1–2. [Google Scholar]
- Slavin, J. Fiber and Prebiotics: Mechanisms and Health Benefits. Nutrients 2013, 5, 1417–1435. [Google Scholar] [CrossRef] [PubMed]
- Canbulat, Z.; Ozcan, T. Effects of short-chain and long-chain inulin on the quality of probiotic yogurt containing Lactobacillus rhamnosus. J. Food Process. Preserv. 2015, 39, 1251–1260. [Google Scholar] [CrossRef]
- Hekmat, S.; Morgan, K.; Soltani, M.; Gough, R. Sensory Evaluation of Locally-grown Fruit Purees and Inulin Fibre on Probiotic Yogurt in Mwanza, Tanzania and the Microbial Analysis of Probiotic Yogurt Fortified with Moringa oleifera. J. Health Popul. Nutr. 2015, 33, 60–67. [Google Scholar]
- Williams, M.; Hekmat, S. Lactobacillus rhamnosus GR-1 in Fermented Rice Pudding Supplemented with Short Chain Inulin, Long Chain Inulin, and Oat as a Novel Functional Food. Fermentation 2017, 3, 1–12. [Google Scholar] [CrossRef]
- Nikmaram, P.; Mousavi, S.M.; Emam-Djomeh, Z.; Kiani, H.; Razavi, S.H. Evaluation and Prediction of Metabolite Production, Antioxidant Activities, and Survival of Lactobacillus casei 431 in a Pomegranate Juice Supplemented Yogurt Drink Using Support Vector Regression. Food Sci. Biotechnol. 2015, 24, 2105–2112. [Google Scholar] [CrossRef]
- Anvari, M.; Khayati, G.; Rostami, S. Optimisation of medium composition for probiotic biomass production using response surface methodology. J. Dairy Res. 2014, 81, 59–64. [Google Scholar] [CrossRef] [PubMed]
- Luckow, T.; Sheehan, V.; Fitzgerald, G.; Delahunty, C. Exposure, health information and flavour-masking strategies for improving the sensory quality of probiotic juice. Appetite 2006, 47, 315–323. [Google Scholar] [CrossRef] [PubMed]
- Pereira, A.L.F.; Almeida, F.D.L.; de Jesus, A.L.T.; da Costa, J.M.C.; Rodrigues, S. Storage Stability and Acceptance of Probiotic Beverage from Cashew Apple Juice. Food Bioprocess Technol. 2013, 6, 3155–3165. [Google Scholar] [CrossRef]
Figure 1.
pH values of the various fruit juice samples taken over 72 h of fermentation. AC, GC, OC (apple, grape, and orange juice control); ALC, GLC, OLC (orange, grape, and orange juice with long chain inulin fiber); ASC, GSC, OSC (apple, grape, and orange juice with short chain inulin fiber).
Figure 1.
pH values of the various fruit juice samples taken over 72 h of fermentation. AC, GC, OC (apple, grape, and orange juice control); ALC, GLC, OLC (orange, grape, and orange juice with long chain inulin fiber); ASC, GSC, OSC (apple, grape, and orange juice with short chain inulin fiber).

Figure 2.
pH values of various fruit juice samples over 30 days of refrigerated storage. AC, GC, OC (apple, grape, and orange juice control); ALC, GLC, OLC (orange, grape, and orange juice with long chain inulin fiber); ASC, GSC, OSC (apple, grape, and orange juice with short chain inulin fiber).
Figure 2.
pH values of various fruit juice samples over 30 days of refrigerated storage. AC, GC, OC (apple, grape, and orange juice control); ALC, GLC, OLC (orange, grape, and orange juice with long chain inulin fiber); ASC, GSC, OSC (apple, grape, and orange juice with short chain inulin fiber).
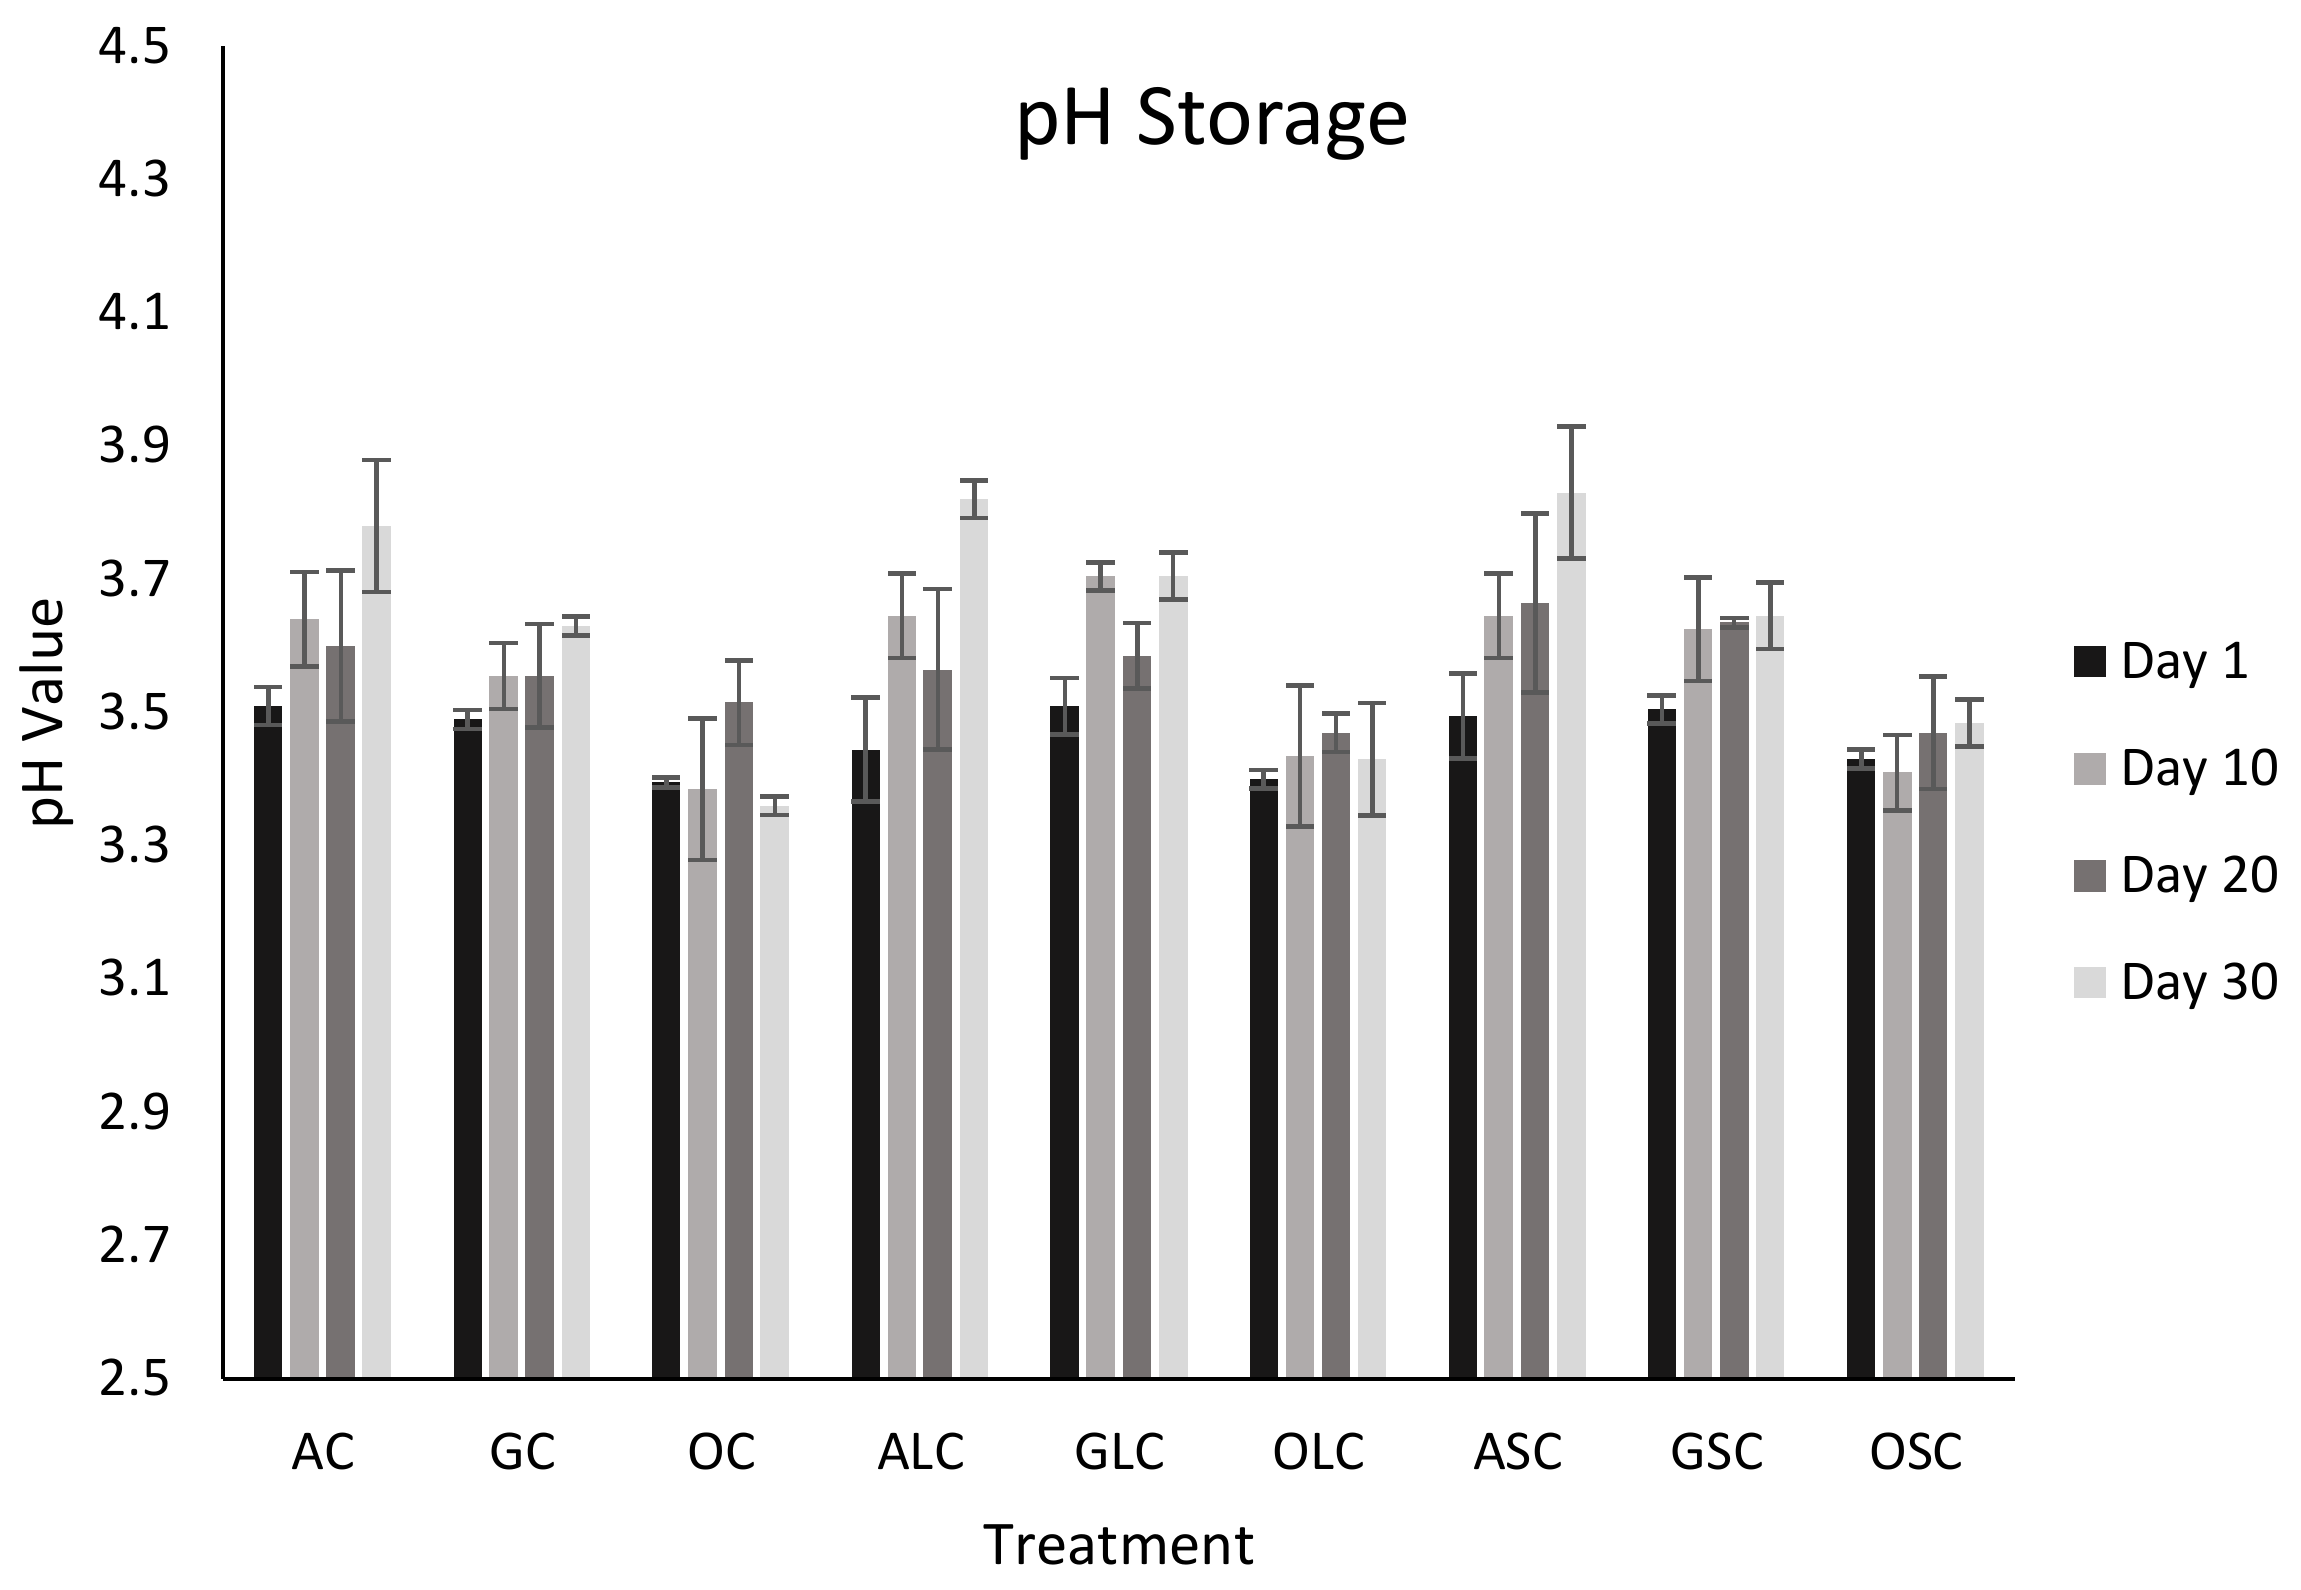
Figure 3.
The hedonic scores (Mean SD) on the appearance of all 6 fruit juice samples from the panellists. The same letter above each bar graph indicates that there was no significant difference (p > 0.05), while bar graphs with different letters indicate that there was a significant difference (p < 0.05) according to Tukey’s studentized range test. OC, OSC, OLC (orange juice control, short chain and long chain inulin fiber).
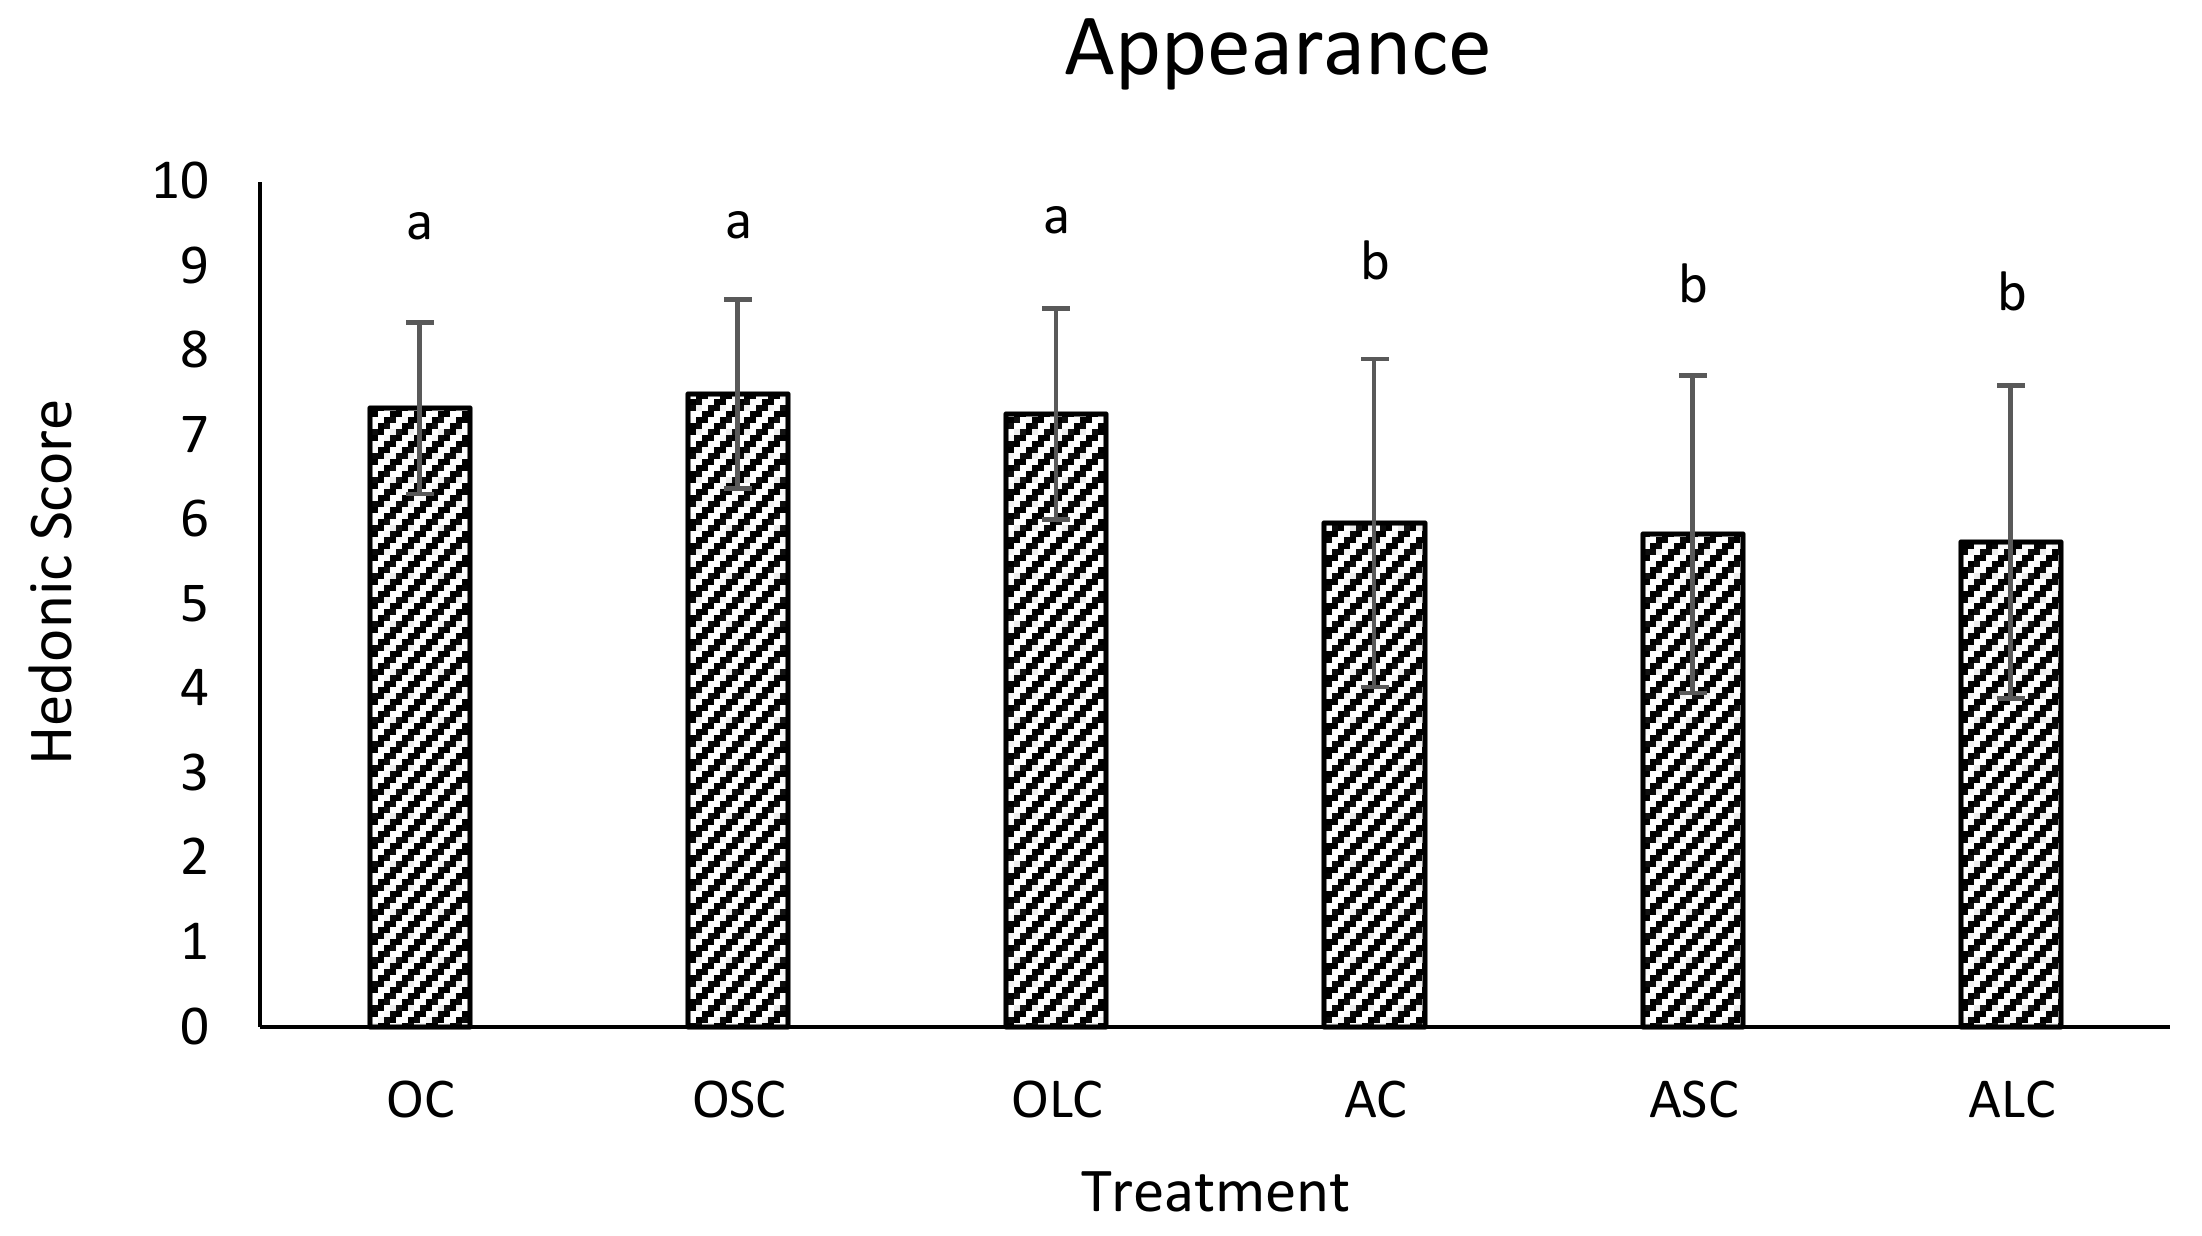
Figure 4.
The hedonic scores (Mean SD) on the flavour of all six fruit juice samples from the panellists. The same letter above each bar graph indicates that there was no significant difference (p > 0.05), while bar graphs with different letters indicate that there was a significant difference (p < 0.05) according to Tukey’s studentized range test. OC, OSC, OLC (orange juice control, short chain and long chain inulin fiber).
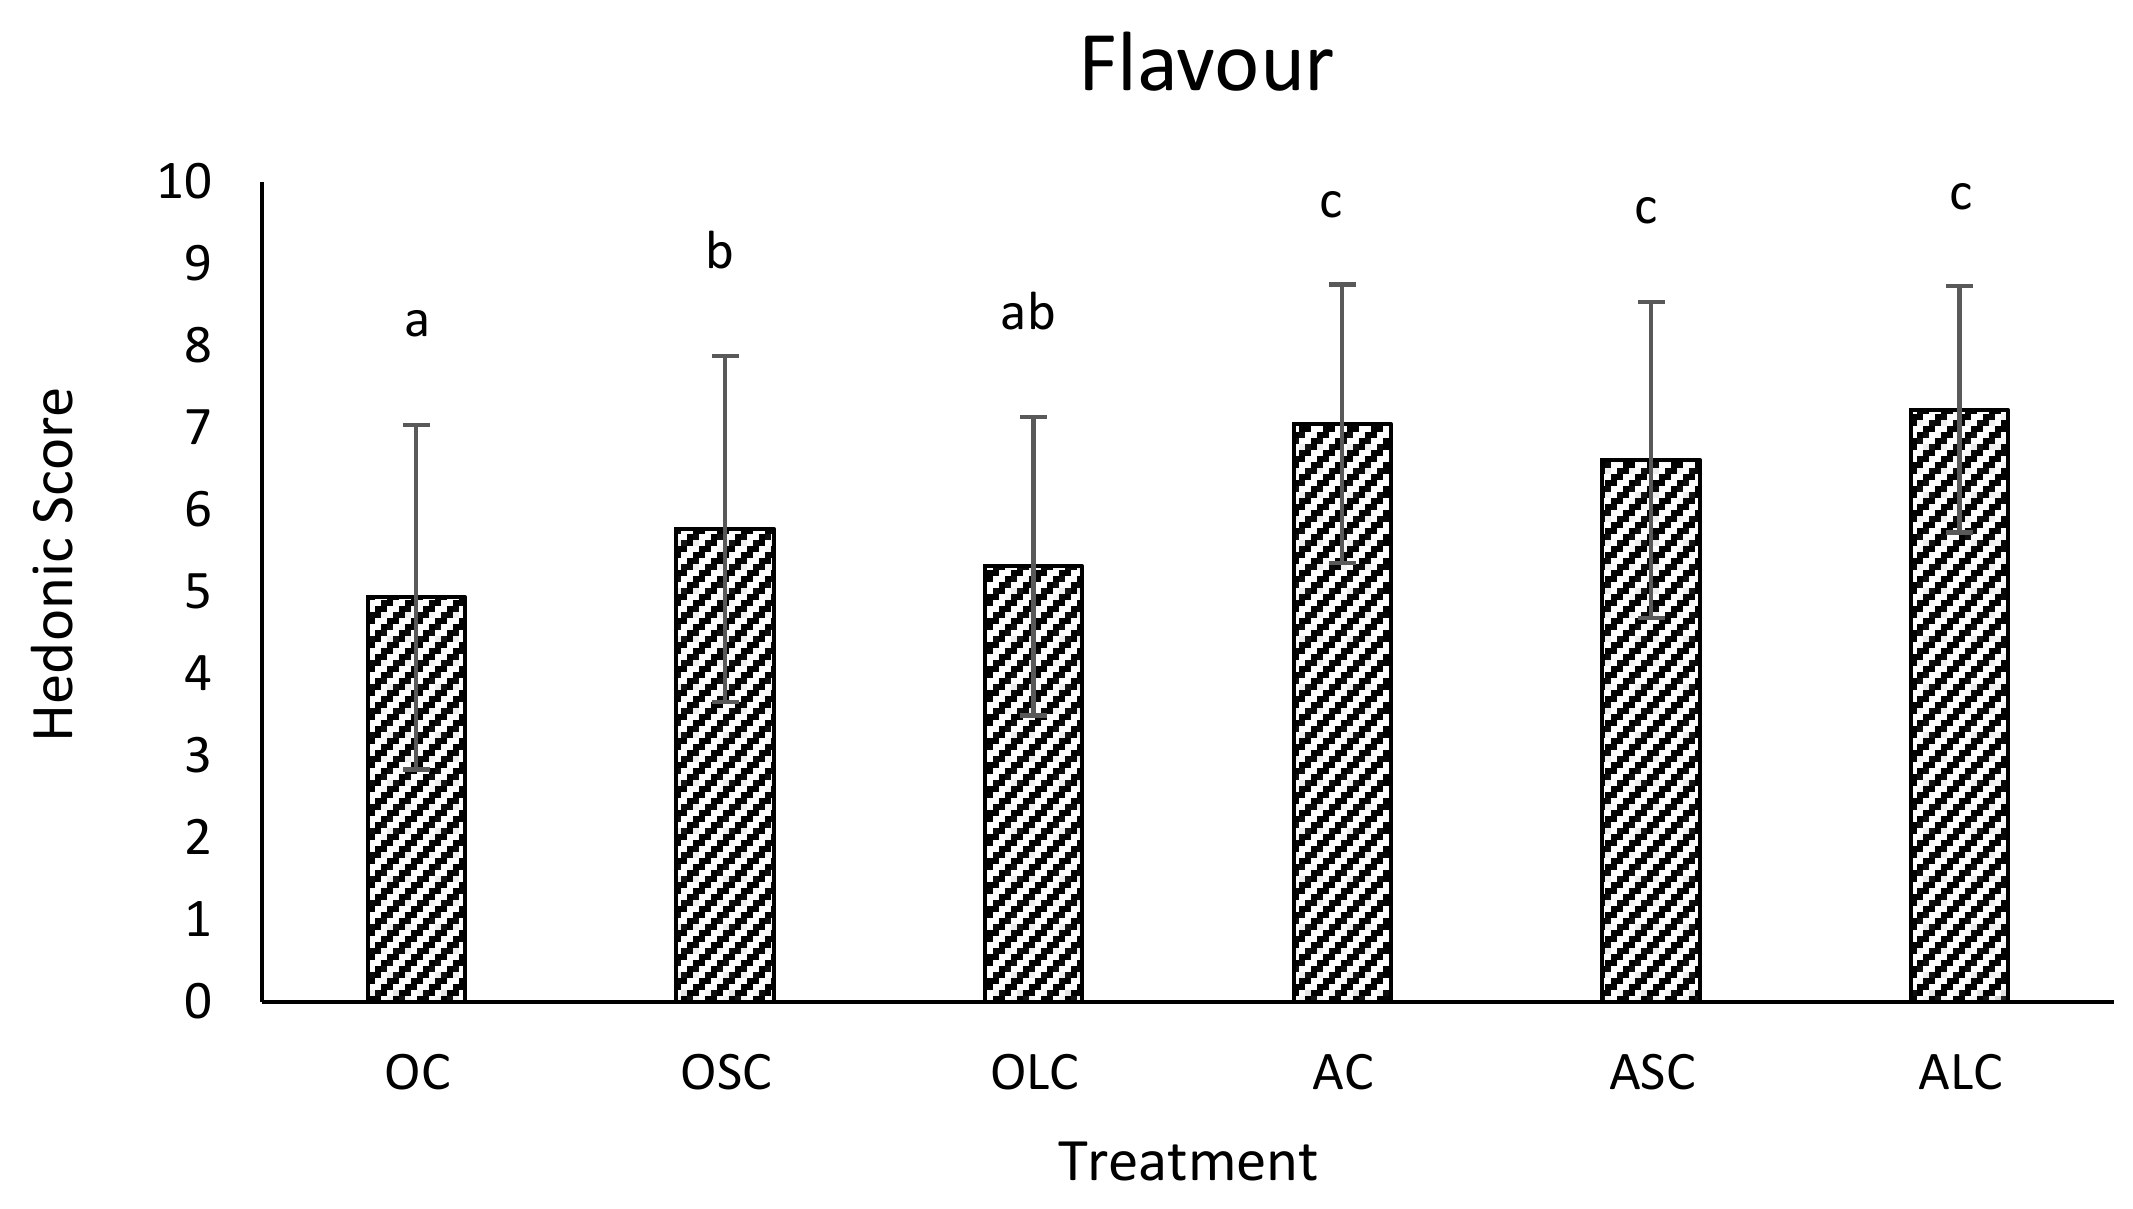
Figure 5.
The hedonic scores (Mean SD) on the texture of all six fruit juice samples from the panellists. The same letter above each bar graph indicates that there was no significant difference (p > 0.05), while bar graphs with different letters indicate that there was a significant difference (p < 0.05) according to Tukey’s studentized range test. OC, OSC, OLC (orange juice control, short chain and long chain inulin fiber).
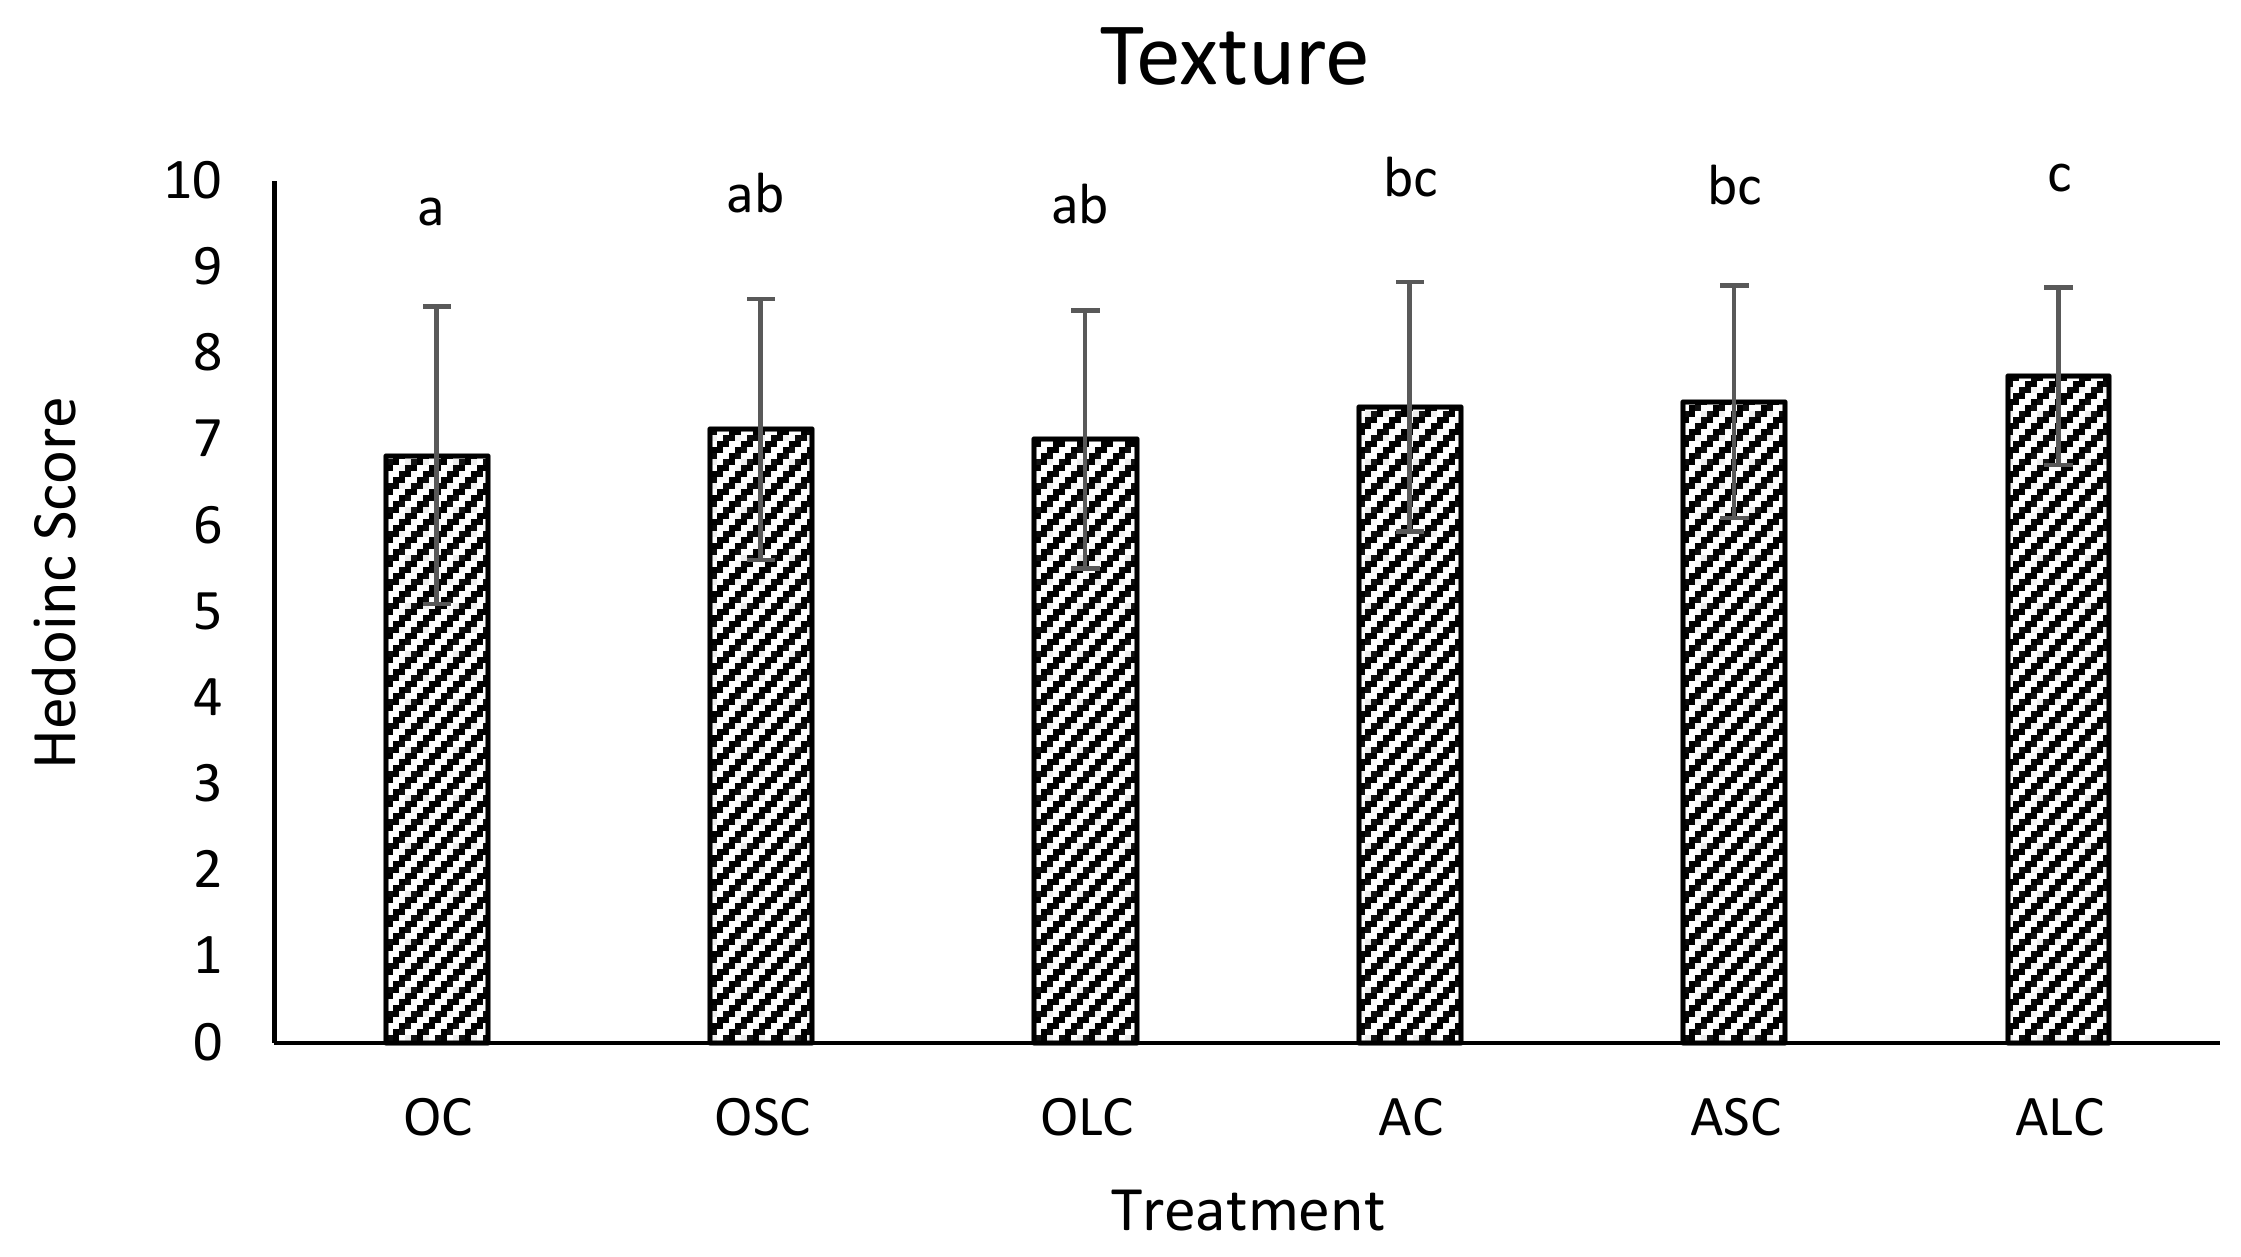
Figure 6.
The hedonic scores (Mean SD) on the overall acceptability of all 6 fruit juice samples from the panellists. The same letter above each bar graph indicates that there was no significant difference (p > 0.05), while bar graphs with different letters indicate that there was a significant difference (p < 0.05) according to Tukey’s studentized range test. OC, OSC, OLC (orange juice control, short chain and long chain inulin fiber).


Table 1.
Viable counts (Mean SD) of L. rhamnosus GR-1 in probiotic non-dairy fruit juices fortified with inulin fiber after 0, 24, 48, and 72 h of fermentation.
Table 1.
Viable counts (Mean SD) of L. rhamnosus GR-1 in probiotic non-dairy fruit juices fortified with inulin fiber after 0, 24, 48, and 72 h of fermentation.
| Mean Counts (× CFU/mL) of L. rhamnosus GR-1 | |||||
|---|---|---|---|---|---|
| Treatment | 0 h | 24 h | 48 h | 72 h | p-Value |
| AC | 4.85 3.79 | 2.86 1.95 | 8.55 7.42 | 3.00 2.23 | >0.05 |
| ALC | 5.86 4.75 | 1.18 0.87 | 3.96 2.35 | 7.58 5.12 | >0.05 |
| ASC | 1.91 0.84 | 2.38 1.92 | 3.47 1.63 | 1.67 0.49 | >0.05 |
| GC | 1.06 0.24 | 1.72 1.58 | 2.66 2.14 | 2.37 1.68 | >0.05 |
| GLC | 0.62 0.11 | 4.25 1.07 | 0.28 0.15 | 0.50 0.33 | >0.05 |
| GSC | 1.06 0.10 | 1.99 1.79 | 0.37 0.00 | 1.73 1.72 | >0.05 |
| OC | 1.07 0.27 | 7.35 7.28 | 13.0 4.00 | 6.45 0.87 | >0.05 |
| OLC | 2.83 2.05 | 6.60 2.70 | 5.53 1.25 | 5.91 4.69 | >0.05 |
| OSC | 2.27 1.73 | 4.49 3.68 | 6.58 1.27 | 5.64 1.65 | >0.05 |
CFU (colony forming units), AC (apple juice control), ALC (apple juice long chain inulin fiber), ASC (apple juice short chain inulin fiber), GC (grape juice control), GLC (grape juice long chain inulin fiber), GSC (grape juice short chain inulin fiber), OC (orange juice control), OLC (orange juice long chain inulin), and OSC (orange juice short chain inulin fiber).
Table 2.
Viable counts (Mean SD) of L. rhamnosus GR-1 in probiotic non-dairy fruit juices fortified with inulin fiber after 1, 10, 20, and 30 days of refrigerated storage.
Table 2.
Viable counts (Mean SD) of L. rhamnosus GR-1 in probiotic non-dairy fruit juices fortified with inulin fiber after 1, 10, 20, and 30 days of refrigerated storage.
| Mean Counts (× CFU/mL) of L. rhamnosus GR-1 | |||||
|---|---|---|---|---|---|
| Treatment | 1 day | 10 days | 20 days | 30 days | p-Value |
| AC | 3.00 2.23 | 1.46 0.89 | 2.18 1.38 | 0.45 0.40 | <0.05 |
| ALC | 7.58 5.12 | 1.35 0.55 | 0.67 0.37 | 0.74 0.32 | <0.05 |
| ASC | 1.67 0.49 | 1.96 1.63 | 1.66 1.47 | 1.16 0.81 | <0.05 |
| GC | 2.37 1.68 | 0.76 0.50 | 0.05 0.04 | 0.01 0.01 | <0.05 |
| GLC | 0.50 0.33 | 0.34 0.01 | ND | ND | <0.05 |
| GSC | 1.73 1.72 | 0.69 0.44 | 0.14 0.09 | ND | <0.05 |
| OC | 6.45 0.87 | 6.02 1.40 | 8.01 2.69 | 10.7 2.34 | >0.05 |
| OLC | 5.91 4.69 | 9.25 0.42 | 5.86 0.20 | 14.3 4.03 | >0.05 |
| OSC | 5.64 1.65 | 8.05 5.87 | 9.84 2.07 | 8.20 2.55 | >0.05 |
CFU (colony forming units), ND (not determined), AC (apple juice control), ALC (apple juice long chain inulin fiber), ASC (apple juice short chain inulin fiber), GC (grape juice control), GLC (grape juice long chain inulin fiber), GSC (grape juice short chain inulin fiber), OC (orange juice control), OLC (orange juice long chain inulin), and OSC (orange juice short chain inulin fiber).
© 2018 by the authors. Licensee MDPI, Basel, Switzerland. This article is an open access article distributed under the terms and conditions of the Creative Commons Attribution (CC BY) license (http://creativecommons.org/licenses/by/4.0/).
Share and Cite
MDPI and ACS Style
White, J.; Hekmat, S. Development of Probiotic Fruit Juices Using Lactobacillus rhamnosus GR-1 Fortified with Short Chain and Long Chain Inulin Fiber. Fermentation 2018, 4, 27. https://doi.org/10.3390/fermentation4020027
AMA Style
White J, Hekmat S. Development of Probiotic Fruit Juices Using Lactobacillus rhamnosus GR-1 Fortified with Short Chain and Long Chain Inulin Fiber. Fermentation. 2018; 4(2):27. https://doi.org/10.3390/fermentation4020027
Chicago/Turabian StyleWhite, Jessica, and Sharareh Hekmat. 2018. "Development of Probiotic Fruit Juices Using Lactobacillus rhamnosus GR-1 Fortified with Short Chain and Long Chain Inulin Fiber" Fermentation 4, no. 2: 27. https://doi.org/10.3390/fermentation4020027
Note that from the first issue of 2016, this journal uses article numbers instead of page numbers. See further details here.