Article

The Use of Drought-Tolerant Vegetation on Green Roofs: A Method for the Digital Photographic Monitoring of Its Development

by
Madalena Rodrigues
1,
Pedro Arsénio
1,2 and
Teresa Afonso do Paço
1,2,*
1
Instituto Superior de Agronomia, Universidade de Lisboa, Tapada da Ajuda, 1349-017 Lisboa, Portugal
2
LEAF—Linking Landscape, Environment, Agriculture and Food Research Center, Associate Laboratory TERRA, Tapada da Ajuda, 1349-017 Lisboa, Portugal
*
Author to whom correspondence should be addressed.
Horticulturae 2024, 10(1), 106; https://doi.org/10.3390/horticulturae10010106
Submission received: 22 December 2023 / Revised: 15 January 2024 / Accepted: 18 January 2024 / Published: 22 January 2024
(This article belongs to the Section Floriculture, Nursery and Landscape, and Turf)

Abstract

:
The increased number of buildings in urban areas limits the creation of vegetated areas, leading to the search for alternatives to create spaces to promote contact with nature. In this context, green roofs have been increasingly studied. These structures have specific microclimatic conditions requiring an accurate study of the most appropriate vegetation to use. This study aims to analyze the long-term viability of vegetation installed on an experimental green roof open-air lab. This analysis was performed using images obtained from photographic records and later inserted into the ImageJ program, in order to identify species and evaluate the area covered by vegetation. Only a few of the species that were planted in the test beds over the years have persisted to the present, while other species have spontaneously appeared. Also, surveys were used to learn about people’s preferences for the vegetation on these test beds. These showed that people favor recognizable plants with plenty of vibrantly colored blossoms. It is feasible to choose the best plants for green roofs in the studied conditions as a result of this analysi sconsidering the ground cover percentage by vegetation, its persistence, and the preferences of the respondents.

1. Introduction

Vegetation, namely trees, plays an essential role in urban ecosystems, also assuming a cultural role [1]. Just as all science and technology have evolved, so have the appreciation and knowledge of nature [2,3]. Since ancient times, several predecessors of green roofs, such as the Ziggurats of Ur and the Hanging Gardens of Babylon, or even the Sod Roofs created by the Vikings of Norway, have been identified [4]. Therefore, according to the principles of ecological continuity, green roofs have become a new area of activity that is increasingly desired by the population [5,6,7].
In the late 1980s, the need to pursue a development that does not compromise future generations arose, leading to the adoption of the concept of “sustainable development” [5,8]. Through the use of this concept, similar to the concept of conservation [9], humanity’s cooperation with nature has allowed for using it while maintaining its balance. Since then, in Europe, there has also been a great increase in the number of green roofs, since they are seen as a solution to many of the problems in cities, namely, the lack of space for the creation of new gardens and parks, as well as reductions in rainwater runoff, preventing the degradation of water and air quality and mitigating the heat island effect [7,10]. As such, a growing number of studies and projects related to this type of structure are emerging, namely, regarding their plant and substrate composition and their benefits to the environment and for private owners [11], including economic aspects. Thus, projects such as GENESIS are emerging, which aim to analyze the cost benefits of having a green roof [12].
Although there is a lot of information about the various structures designated as green roofs, there is less research about the vegetation to select under Mediterranean conditions. Some studies are, however, available, for example, [13,14,15], addressing the interaction between plants and (i) sub-surface runoff, (ii) substrate type and irrigation frequency, and (iii) rainfall conditions, respectively.
The substrate type can play a determinant role in plant adaptation under such conditions, as concluded by [16]. These authors compared different substrate types but recommended the use of lightweight and highly porous substrates as the foundation for cultivating herbaceous species native to the Mediterranean region, stating that these substrates are particularly beneficial for promoting robust root development. Further, they advised that incorporating a mix of perennial and annual species in such substrates makes it possible to establish lasting plant cover. Similarly, a lighter, soilless substrate was suggested by [17] for Convolvulus cneorum, under comparable conditions.
Frequently, there is a suggestion to use native plants, since they have greater adaptability to the local climate and are more resistant than exotic plants to the harsh conditions on rooftops. Rooftop microclimates often present strong and constant winds, high exposure to solar radiation, high temperatures, and high levels of humidity and precipitation during part of the year [18,19,20]. Native plants generally have a lower water consumption than exotic plants and need less maintenance, which presents some advantages when compared to the latter. Also, they attract and promote fauna, including birds and their preys [21,22].
Concerning the water use of native species on green roofs, in [23], five Mediterranean species (Brachypodium phoenicoides, Crithmum maritimum, Limonium virgatum, Sedum sediforme, and Sporobolus pungens) were tested for their adaptation to extensive green roofs under two different irrigation levels. It was concluded that, in a general way, all the species presented an interesting aesthetic value for both treatments. Studies with a similar purpose were performed [17,18,24,25] with other plant species, leading to a likewise conclusion with very few exceptions. Other authors [26,27] have studied the adaptation of halophyte plants to different substrates combined with different sites and the accumulation of toxic elements.
Some tools for plant species selection for use in green roofs have been studied, for example, addressing plants in habitat analogues or the identification of morpho-functional characters, capable of discriminating the response to abiotic stress [28] or related to ecological indicators [29].
Knowledge about adequate plant species to use in the implementation of green roofs, under a Mediterranean climate, is of the utmost importance, since plants undergo harsh conditions enduring dry, hot summers, even when irrigation is available. Commercially, there are not many species available that can cope with such conditions while being low-water consumers. The study of species that are not currently used in green roofs might lead to the discovery of new possibilities for the plant production of drought-tolerant species that do not require large amounts of irrigation water. For this, it is useful to analyze and quantify the development of such species under the real conditions of green roofs, collecting information about their adaptation, aesthetic value, and persistence.
The objective of this study was to analyze the development of the native vegetation installed over the years (planted, sowed, or spontaneous) in the green roof lab (http://www.facebook.com/thegreenrooflab/, accessed on 20 December 2023). This rooftop open-air laboratory (School of Agriculture, University of Lisbon, Lisboa, Portugal) has several test beds that simulate different green roofs under Mediterranean conditions, allowing for studying the adaptation of native vegetation. The persistence and development of plants installed since 2014, in the frame of several projects (NativeScapeGR—Native Scape Green Roof, ApiWall—Another Plant in the Wall, and ApiMat—Another Plant in the Mat [20,30,31,32,33]), were studied, as well as colonization by spontaneous herbaceous species, native, or non-invasive exotics.
Photographic records during 2022 allowed for measuring the percentage of vegetation covering each test bed and identifying the plant species responsible for it. Species identification was also conducted to understand which species persisted from the plantings/sowings made over time in the green roof lab projects and which ones emerged spontaneously.
Finally, to obtain a set of species that are the most suitable for installation in green roofs, population surveys (vd. Figure A1 in Appendix A) were used to determine which plants are preferred from the ones that were maintained from the initial set, comprising the ones with the ability to persist after planting/sowing or to be installed spontaneously.

2. Materials and Methods

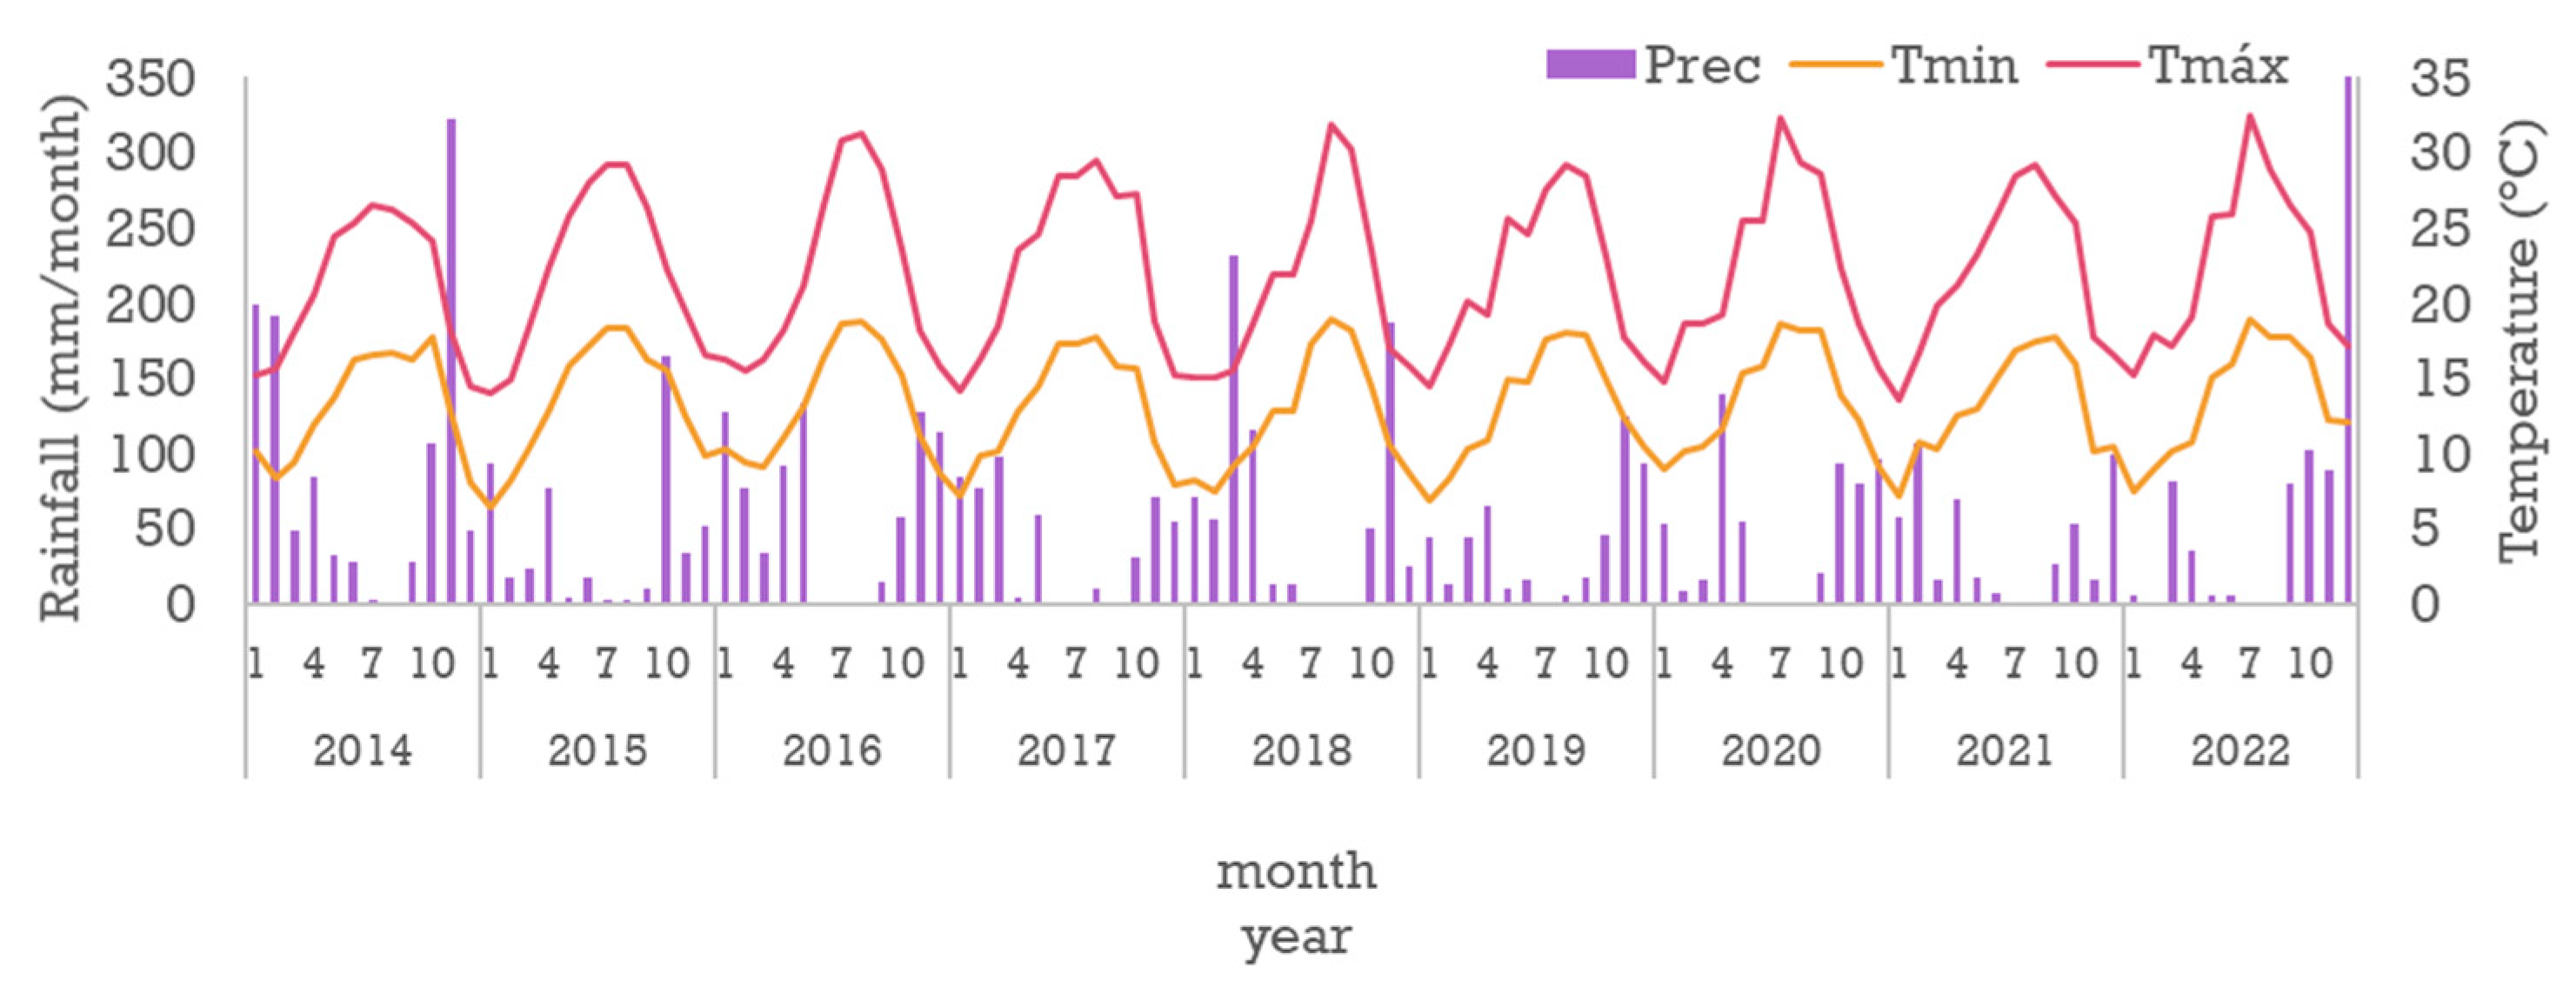
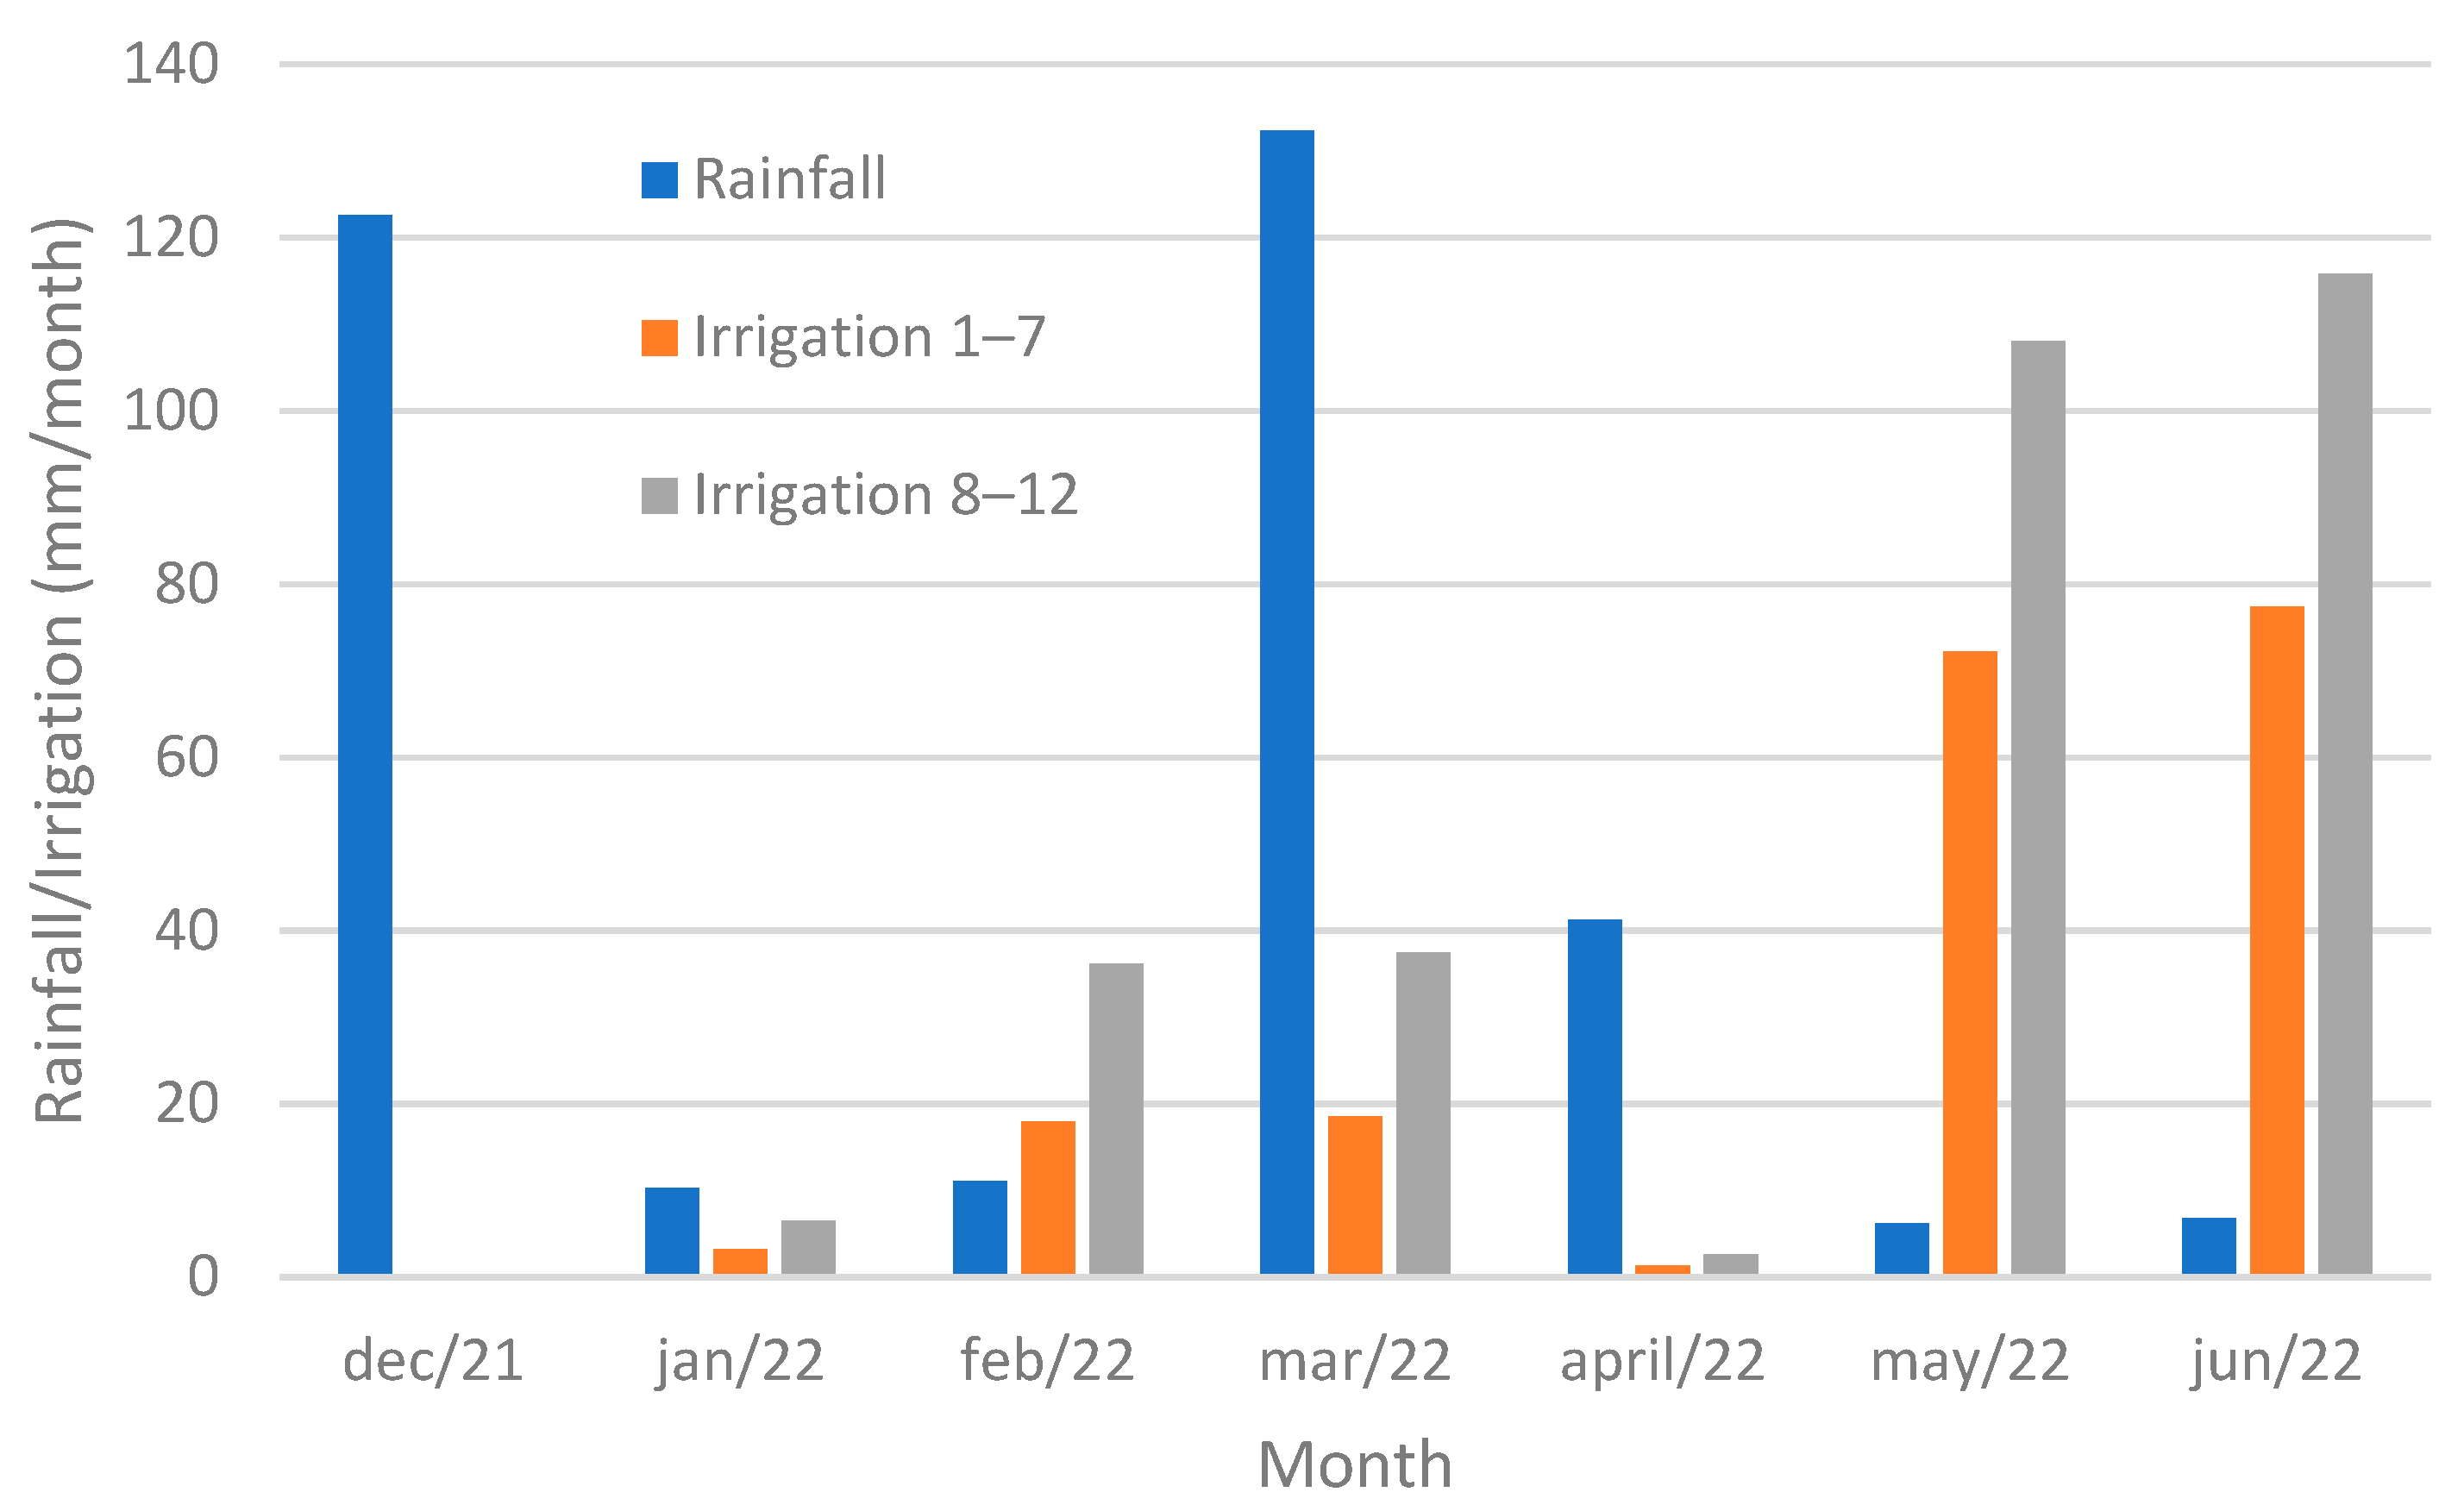
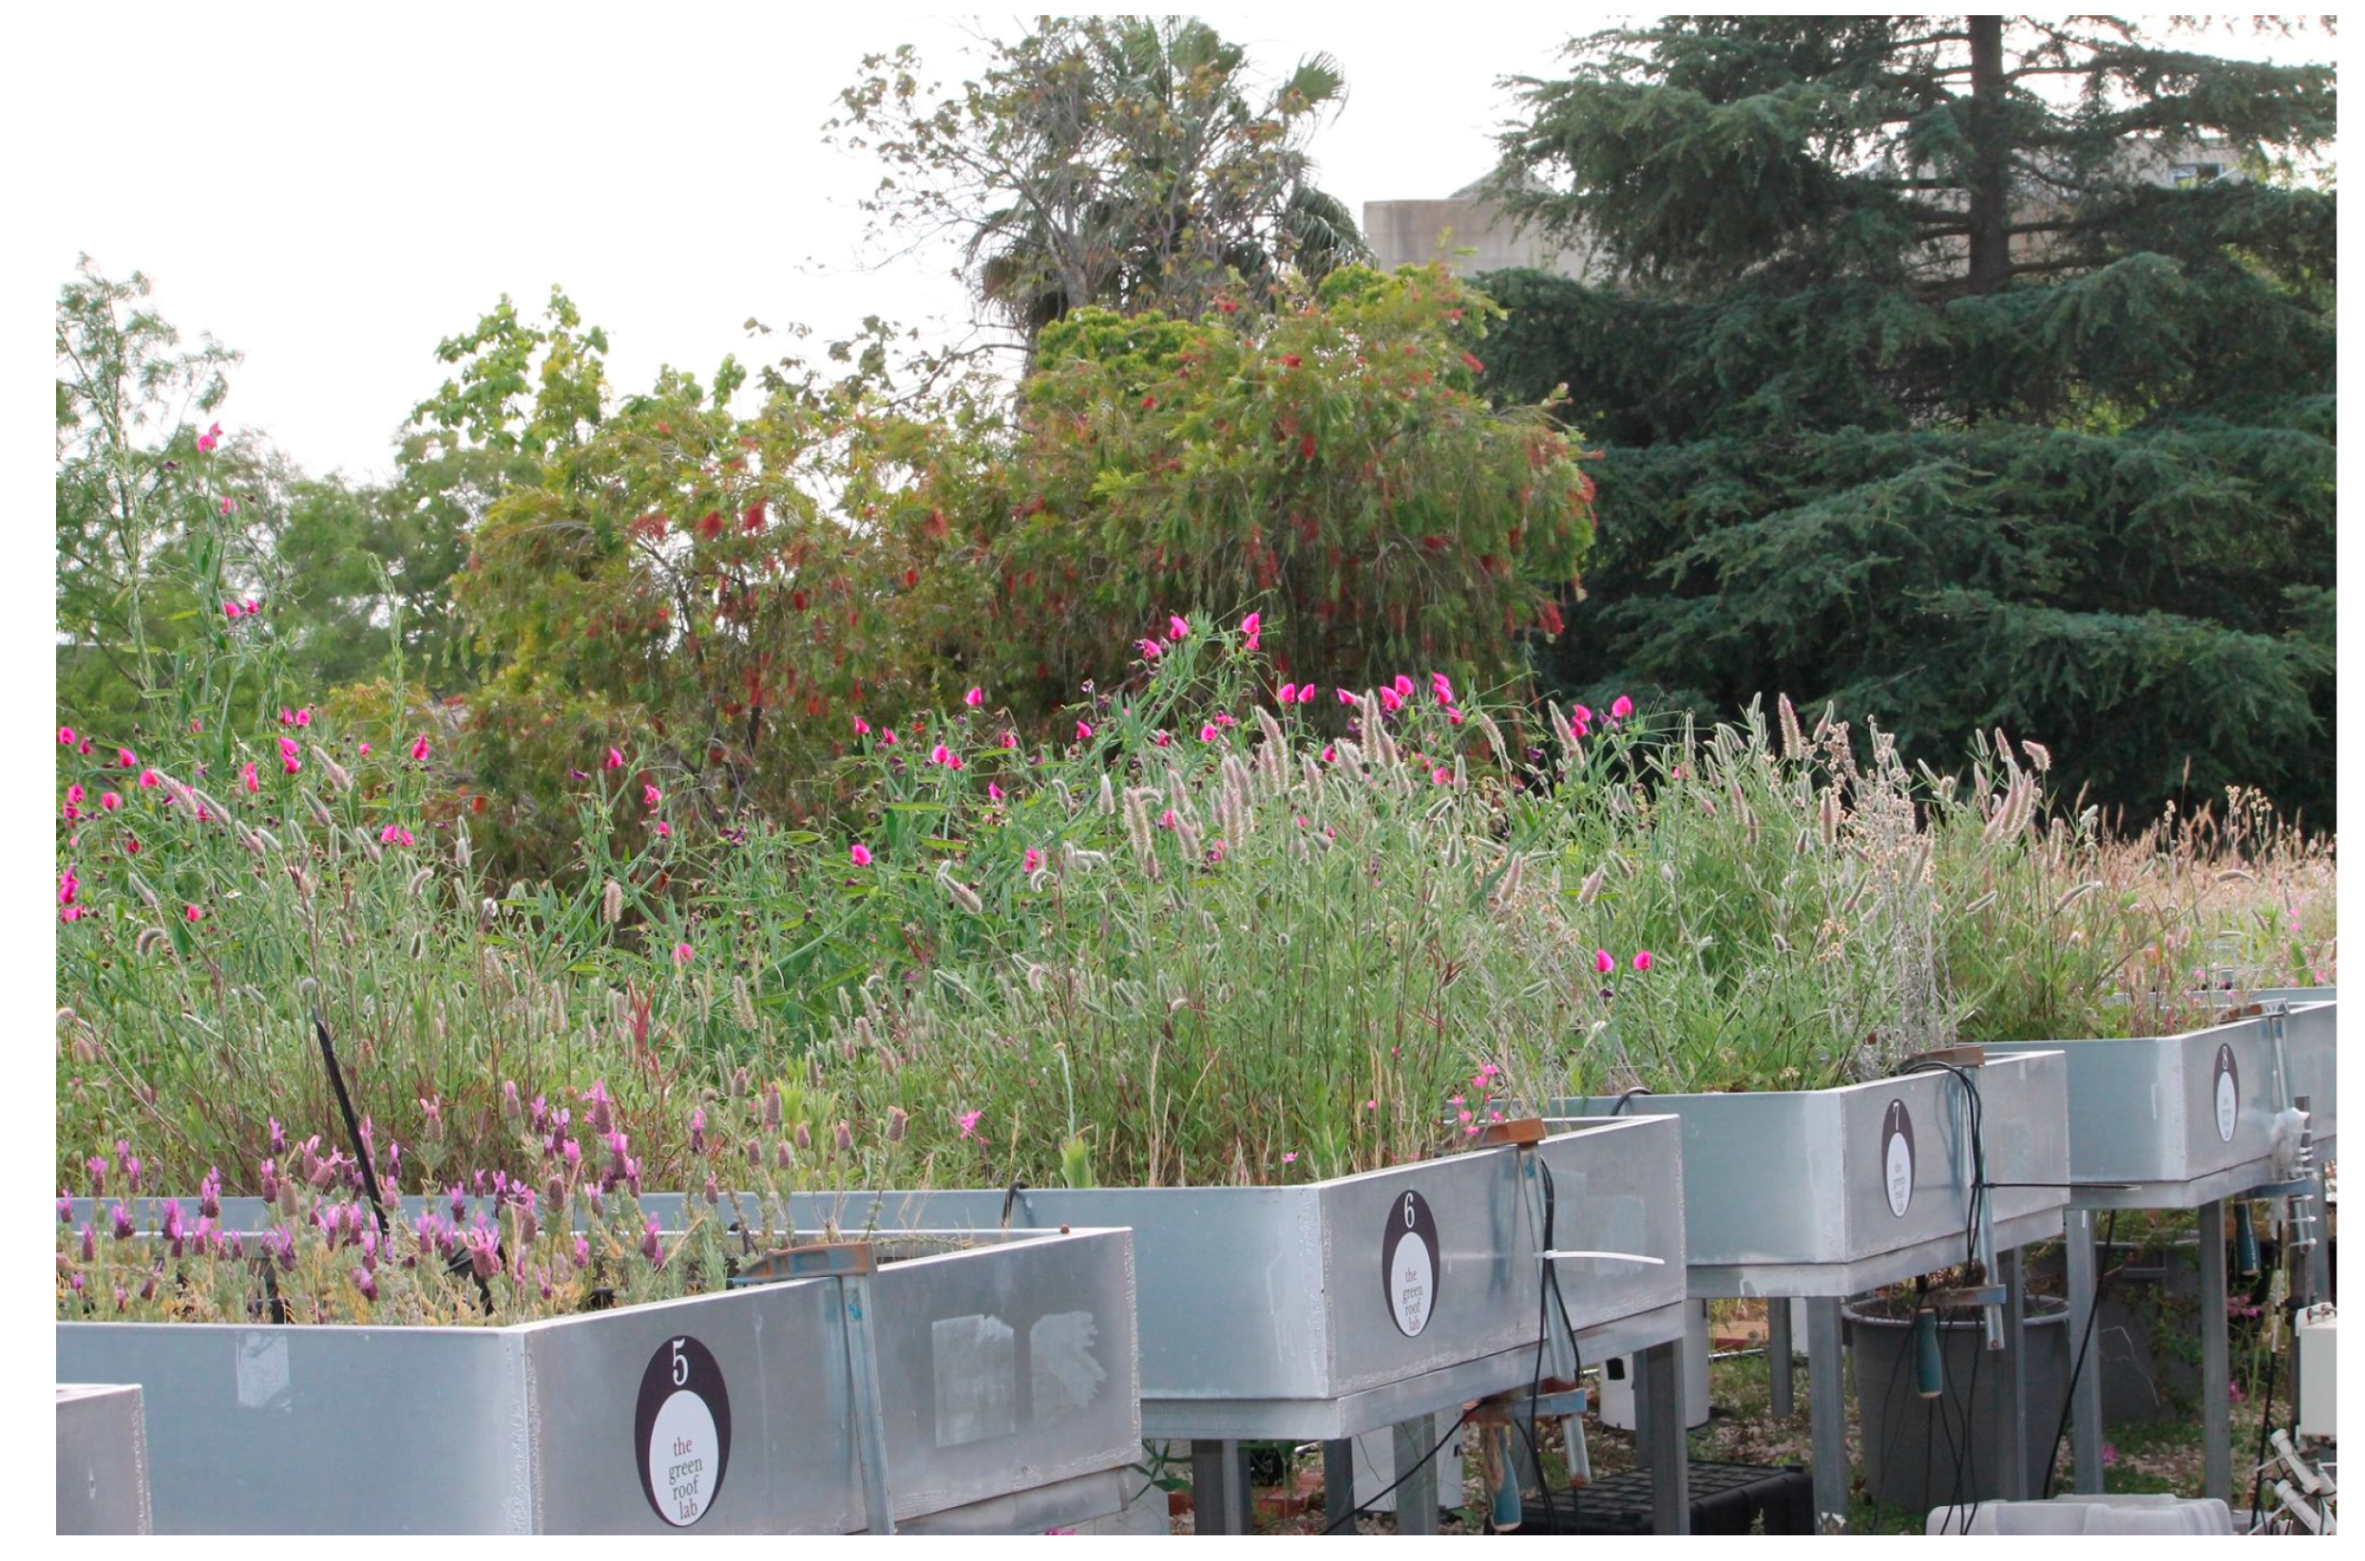
2.1. Experimental Site

The experimental site, the green roof lab, is located on the rooftop of the “João de Carvalho e Vasconcellos” Herbarium building, School of Agriculture, University of Lisbon, Portugal (38°42′28.8″ N 9°11′04.4″ W, Figure 1).
According to the Köppen–Geiger classification, Lisbon has a Csa climate type with hot, dry summers and rainy winters. The mean annual temperature is 17.0 °C and the mean annual maximum and minimum temperatures are 21.4 °C and 13.5 °C, respectively. The mean annual rainfall is 744.6 mm (IPMA, Instituto Português do Mar e da Atmosfera https://www.ipma.pt/bin/file.data/climate-normal/cn_81-10_LISBOA_GAGO_COUTINHO.pdf, accessed on 21 December 2023, boletim normal climatológica). Figure 2 indicates the monthly rainfall and the minimum and maximum temperatures, collected at a nearby (approx. 9 km away to the east direction) automated weather station (IPMA Lisboa—Gago Coutinho, 38°45′, 9°7′, and 104 m, a.s.l.) during the period addressed in this study (2014–2022).
In the period from April to June 2022, it was possible to obtain data from an automatic weather station installed on the roof of the Herbarium building (T_METEO all in one, Terrapro, Samora Correia, Portugal). Figure 3 presents the precipitation and irrigation data from December 2021 until June 2022, including those corresponding to the period during the collection of the photographic records, which were necessary to analyze and understand the vegetation development. The precipitation data from December to March were obtained from IPMA Lisbon/Gago Coutinho station. For the period from December 2021 to June 2022, the maximum precipitation was registered in March, with a total of 132.20 mm.
Irrigation amounts were registered according to the information introduced in the irrigation programmer equipped with a rain sensor. Irrigation increased towards the end of the study period, which corresponds to the months of May and June. Irrigation was applied at two different levels, calculated as 60% and 100% of the reference evapotranspiration (test beds 1 to 7 and 8 to 12, respectively, from a total of 12, as explained further).
The experimental set is composed of an array of twelve horizontal metallic test beds (2.5 × 1 × 0.2 m3), elevated 1 m above the roof surface, with a slope of 2.5% towards the south direction (Figure 4). The test beds are used to mimic different types of green roofs and were constructed with technical characteristics similar to commercial green roofs: a protection and retention mat (SSM45—ZinCo, Neoturf, Senhora da Hora, Portugal), a drainage and water storage element of thermoformed recycled polyolefin (Floradrain® FD 25E, ZinCo, Neoturf, Portugal), a thermally strengthened filter sheet of polypropylene (filter sheet SF, Zinco, Neoturf, Portugal), and a specific commercial substrate for green roofs, made up mostly of organic material, humus, and blond peat mulches (Siro Roof, Siro, Mira Portugal) [19,22]. Although it has a high organic matter content (70%), which is higher than that advised (FLL, 2018), this substrate was chosen because it was the one available at the market for this purpose and it was intended to carry the study as close as possible to real conditions.

2.2. Vegetation Analysis

In the first project of the green roof lab (NativeScapeGR, 2014 [30] http://www.isa.utl.pt/proj/NativeScapeGR/, accessed on 20 December 2023), an analysis of the behavior of a group of native species (Lavandula luisieri subsp. luisieri (L.), Rosmarinus officinalis L., Brachypodium phoenicoides (L.) Roem. & Schult., Pleurochaete squarrosa (Brid.) Lindb., Homalothecium sp., and Brachythecium plumosum Schimp., Neckera sp.) was carried out, which, in the case of vascular plants, were lent by the company SIGMETUM (https://sigmetum.com/, accessed on 20 December 2023) or were collected from nature, as in the case of bryophytes. In the ApiWall [31] project, all plant material to be studied was initially collected from the facades, walls, and roofs of old buildings in the city of Lisbon, namely, the Ajuda National Palace, and further cultivated. Consequently, 15 new vegetation species were inserted, and care was also taken to keep, from the previous project, the moss species Pleurochaete squarrosa [34]. Finally, the last project, ApiMat [32], aimed to develop vegetation mats with a mix of native species, namely from the Estremadura region in Portugal. All seeds of the 23 species included were purchased from the company “Sementes de Portugal” (https://www.sementesdeportugal.pt/. accessed on 20 December 2023) and sowed in mats in a nursery, to be later selected and some transferred to the test beds of the green roof lab [32].
Table 1 presents the list of the species installed (planted or sowed) during those three projects and Table 2 presents their distribution in each test bed at the time of planting/sowing. All the introduced plants were native species.
To analyze the vegetation, a mixed methodology was created: (i) an analysis of the vegetation persistence and development; and (ii) population acceptance concerning the best-suited species from the previous analysis.
The method developed to analyze the evolution and identification of vegetation allowed for obtaining the vegetation areas through overhead photographs inserted into and worked on in the ImageJ program [34]. The area of vegetation that has developed over time was monitored and the species present were identified and photographically recorded. The gathered data allowed for its use in surveys, to study which vegetation the population prefers for use on green roofs.
One of the objectives of the present study was to analyze which species survived after being sown or planted and which species emerged spontaneously without human intervention. Spontaneous species were allowed to stay in the test beds as long as they were not invasive or woody.

2.3. Image Acquisition

In the first phase of the study, digital overhead photographs of the laboratory test beds’ vegetation were obtained every week. Photographs were taken from the first day of winter 2021 (22 December) to the first day of next spring (20 March 2022), every week (i.e., every Wednesday). With the onset of spring, vegetation tends to grow quickly, and, to keep up with this development, photographs were taken every Monday and Friday until the beginning of summer, 21 June 2022. Photographs were taken from December until June, allowing for studying the vegetation’s development throughout these six months. The identification of the plant species present in the test beds was performed on 20 June 2022.
The images were taken with the aid of a structure, a giraffe—PHOTTIX Giraffe Balance 395 with a maximum height of 395 cm, with a 3/8 STUDIOKING mounting spike and MANFROTTO MHXPRO-BHQ2 XPRO Ball Head in Magnesium, with a 200PL shoe, which allowed for placing the camera—a Canon PowerShot SX740 HS—at a height of 2.20 m. Since this placement height did not allow manual access to the shutter, the Camera Connect application from Canon was installed on a cell phone to allow for taking pictures without having to remove the camera from the location.
The structure was placed between two test beds and aligned by the identification of what was being photographed, by the “N”—north—or “S”—south—side of each test bed.
Each test bed was 2.5 m long by 1 m wide and 20 cm deep with a 2.5% slope. They were photographed twice because the camera could not reach enough height to be able to frame the whole test bed in one picture. Each of the test beds, and consequently each photograph, was identified with the north and south sides of the test beds, with a mark in the middle of the board at 1.25 m.
The inclination of the test bed, of 2.5% from north to south, had to be accounted for, and it could be concluded that this generated a difference of 6.25 cm between the north and south heights of the bed edges. Associated with this difference, 2.20 m of the giraffe’s height was added, which meant that the camera on the north side took the pictures at a distance of 1.20 m from the board. However, on the south side, this difference became 1.26 m. Considering this 6.25 cm increase in the distance from the camera to the south side of the bed, it is estimated that the error in this evaluation of the photographs was 4.95% ((0.06 ×100)/1.26). It is also necessary to consider the effect that the gravel on the floor caused on the placement of the giraffe, which cannot be accounted for. By accounting for the 4.95% error of the photographs, with the effect of the gravel, it is reasonable to estimate that, in the end, the error was less than 10% in these measurements.

2.4. Image Analysis

To obtain results with the photographs previously taken (Figure 5), it was necessary to work on the images in two different programs, first in Photoshop and then in Java ImageJ. The first step, in Photoshop, was to crop the images by the inner limit of the test bed, leaving visible only the substrate area and the vegetation there, and all the rest of the image was left with a black background (Figure 6).
Once arranged in Photoshop, the images were then placed in ImageJ (v. 1.54g). To be able to work with the images in this program, it was necessary to install a 64-bit version of ImageJ and, subsequently, that its Memory & Threads settings (Edit—Options) were changed. This was achieved by selecting a maximum memory value that was, at most, 1000 MB below the computer’s RAM (if the computer had 16 GB of RAM, then the maximum memory would be changed to 14,000 MB or 15,000 MB).
Afterward, the Trainable Weka Segmentation plug-in (https://imagej.net/plugins/tws/index, accessed on 20 December 2023) [12] was used, which allowed for the segmentation of the images of the boards, that is, it simplified the images so that their analysis was made easier. This simplification was achieved through colors, coloring all the areas referring to the substrate in green and the vegetation in red (Figure 7) [32].
With the plug-in already open, the classifier was defined. In this case, only two classes were used for all the images inserted in the program, Substrate and Vegetation. This classifier was then saved in the folder to be used on the remaining photographs. To be able to use the same analysis criteria on all the photographs, it was necessary to create, for each one of them, associated data. To create these data, it was necessary to indicate to the program, manually selecting three to four areas (Figure 8) that corresponded to the substrate and another three to four areas that corresponded to the vegetation, that is, to indicate what the content of each class of the classifier was.
After marking the areas, the data settings that corresponded to each photograph were saved so that the data created could be used again for the following week’s photographs. To simplify, for all the photographs taken on 22 December 2021, two classifiers (to identify vegetation and substrate) and twenty-four data sets (one for each half of the test bed) were created. Data one corresponds to the definitions of the north side of test bed one, data two corresponded to the definitions of the south side of test bed one, data three corresponded to the definitions of the north side of test bed two, and so on.
With the data and the classifier already inserted in the plug-in, the program was run by clicking on Train classifier. In the end, it originated an image of only two colors: green, which were the areas marked as substrate, and red, which were the areas corresponding to vegetation. For the remaining photographs, the classifier and the data were uploaded to keep the same evaluation in all photographs.
Referring to the cuts in the images, it should be noted that these were made by the inner limit of the test bed, so that all plants that grew outside the limits of the test bed were not accounted for.

2.5. Quantification of Vegetation-Covered Areas

Following segmentation, images were reintroduced into the ImageJ program to calculate the vegetation areas, previously marked in red. Furthermore, they were transformed into an 8-bit image, which means a black-and-white image. This transformation was performed using the Image—Type—8-bit functions. To select the area to be evaluated, each image was submitted to the Image—Adjust—Autothreshold settings, where only the options Default on the Method and White object on the black ground were selected. Afterward, the Polygon selection tool was used to select the entire surroundings of the test bed.
Once all the vegetation areas of the test bed were selected, the functions Analyze—Analyze particles were used to find out the percentage occupied by them, and then the data were centralized in an Excel spreadsheet file, where further analysis was performed.
The photographs that were taken throughout the study (December 2021 until June 2022) were transformed, as described in 2.2, to obtain the necessary data for the analysis of the vegetation area. However, from 900 photographs taken, only 618, maintaining the chaining of 1 photograph per test bed every week, were selected.
In the case of test bed one, there were no data between 25 April and 27 May, since a peacock used it as a nest to hatch her eggs.
At the end of the study, to select the test beds with a greater development of vegetation area, those that had an increase of 0.50 m2 or more were considered, which corresponded, at least, to a 20% increase in the covered area of the test bed between the beginning and the end of the study.

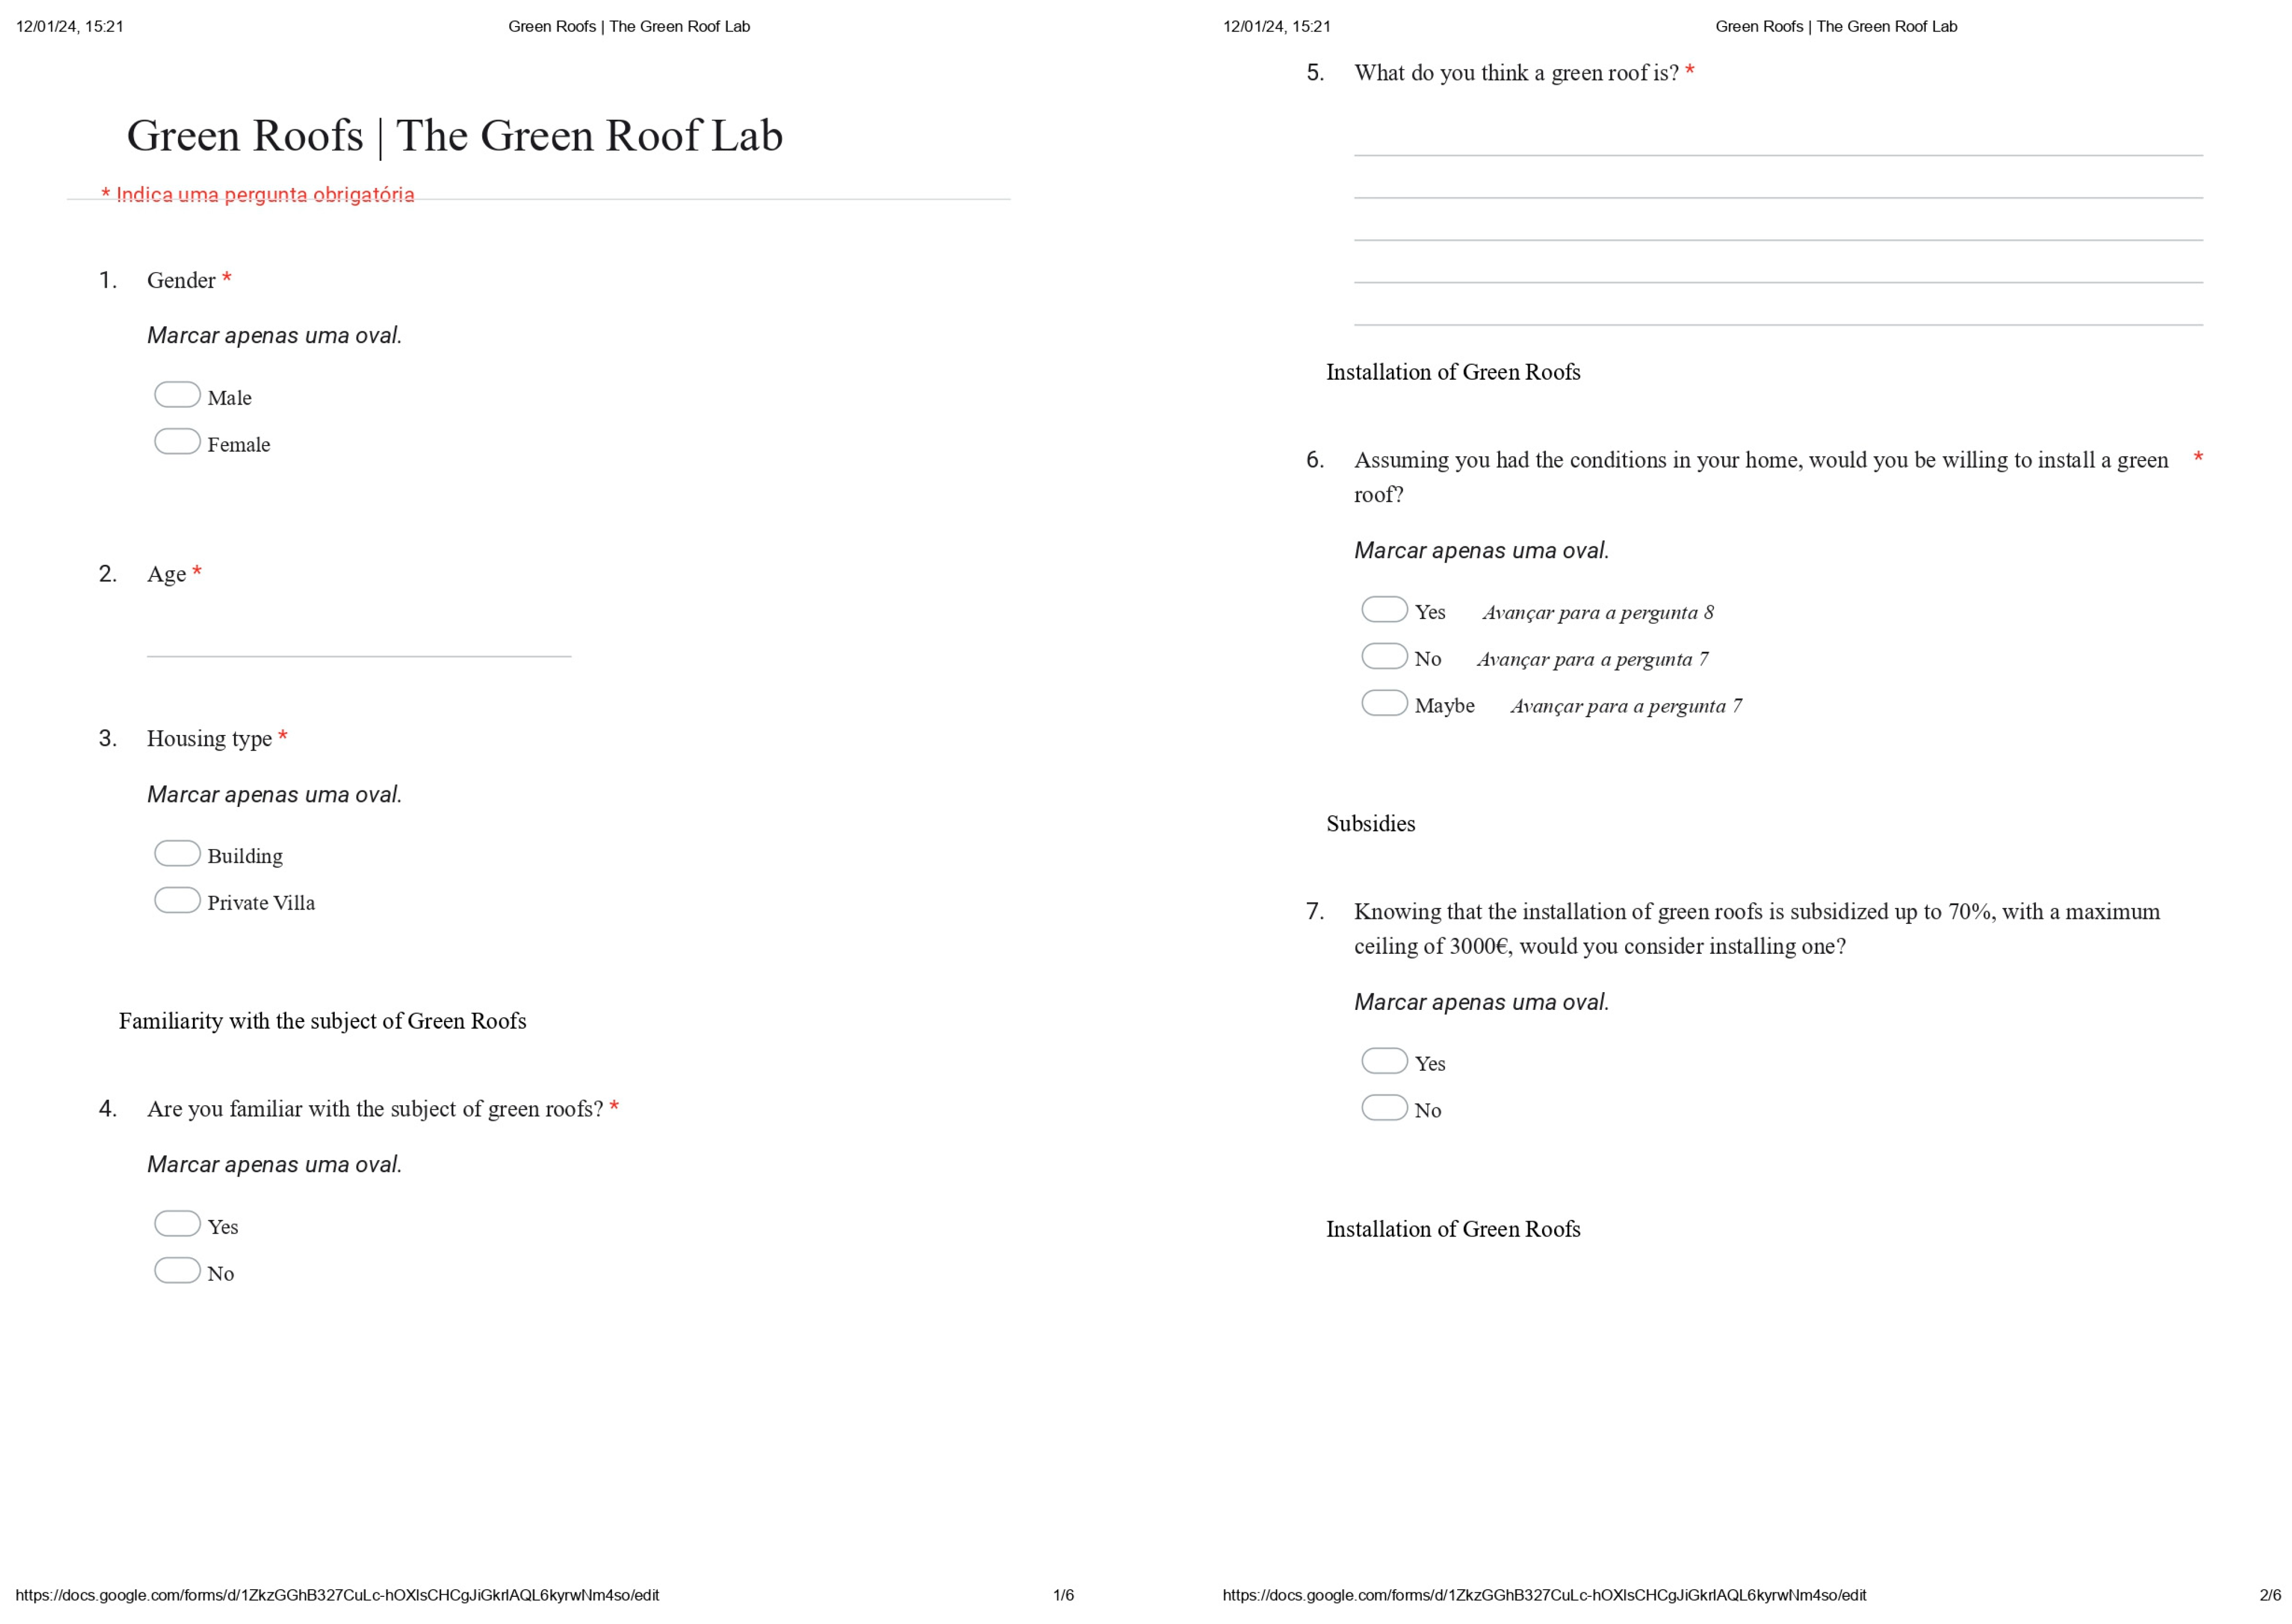
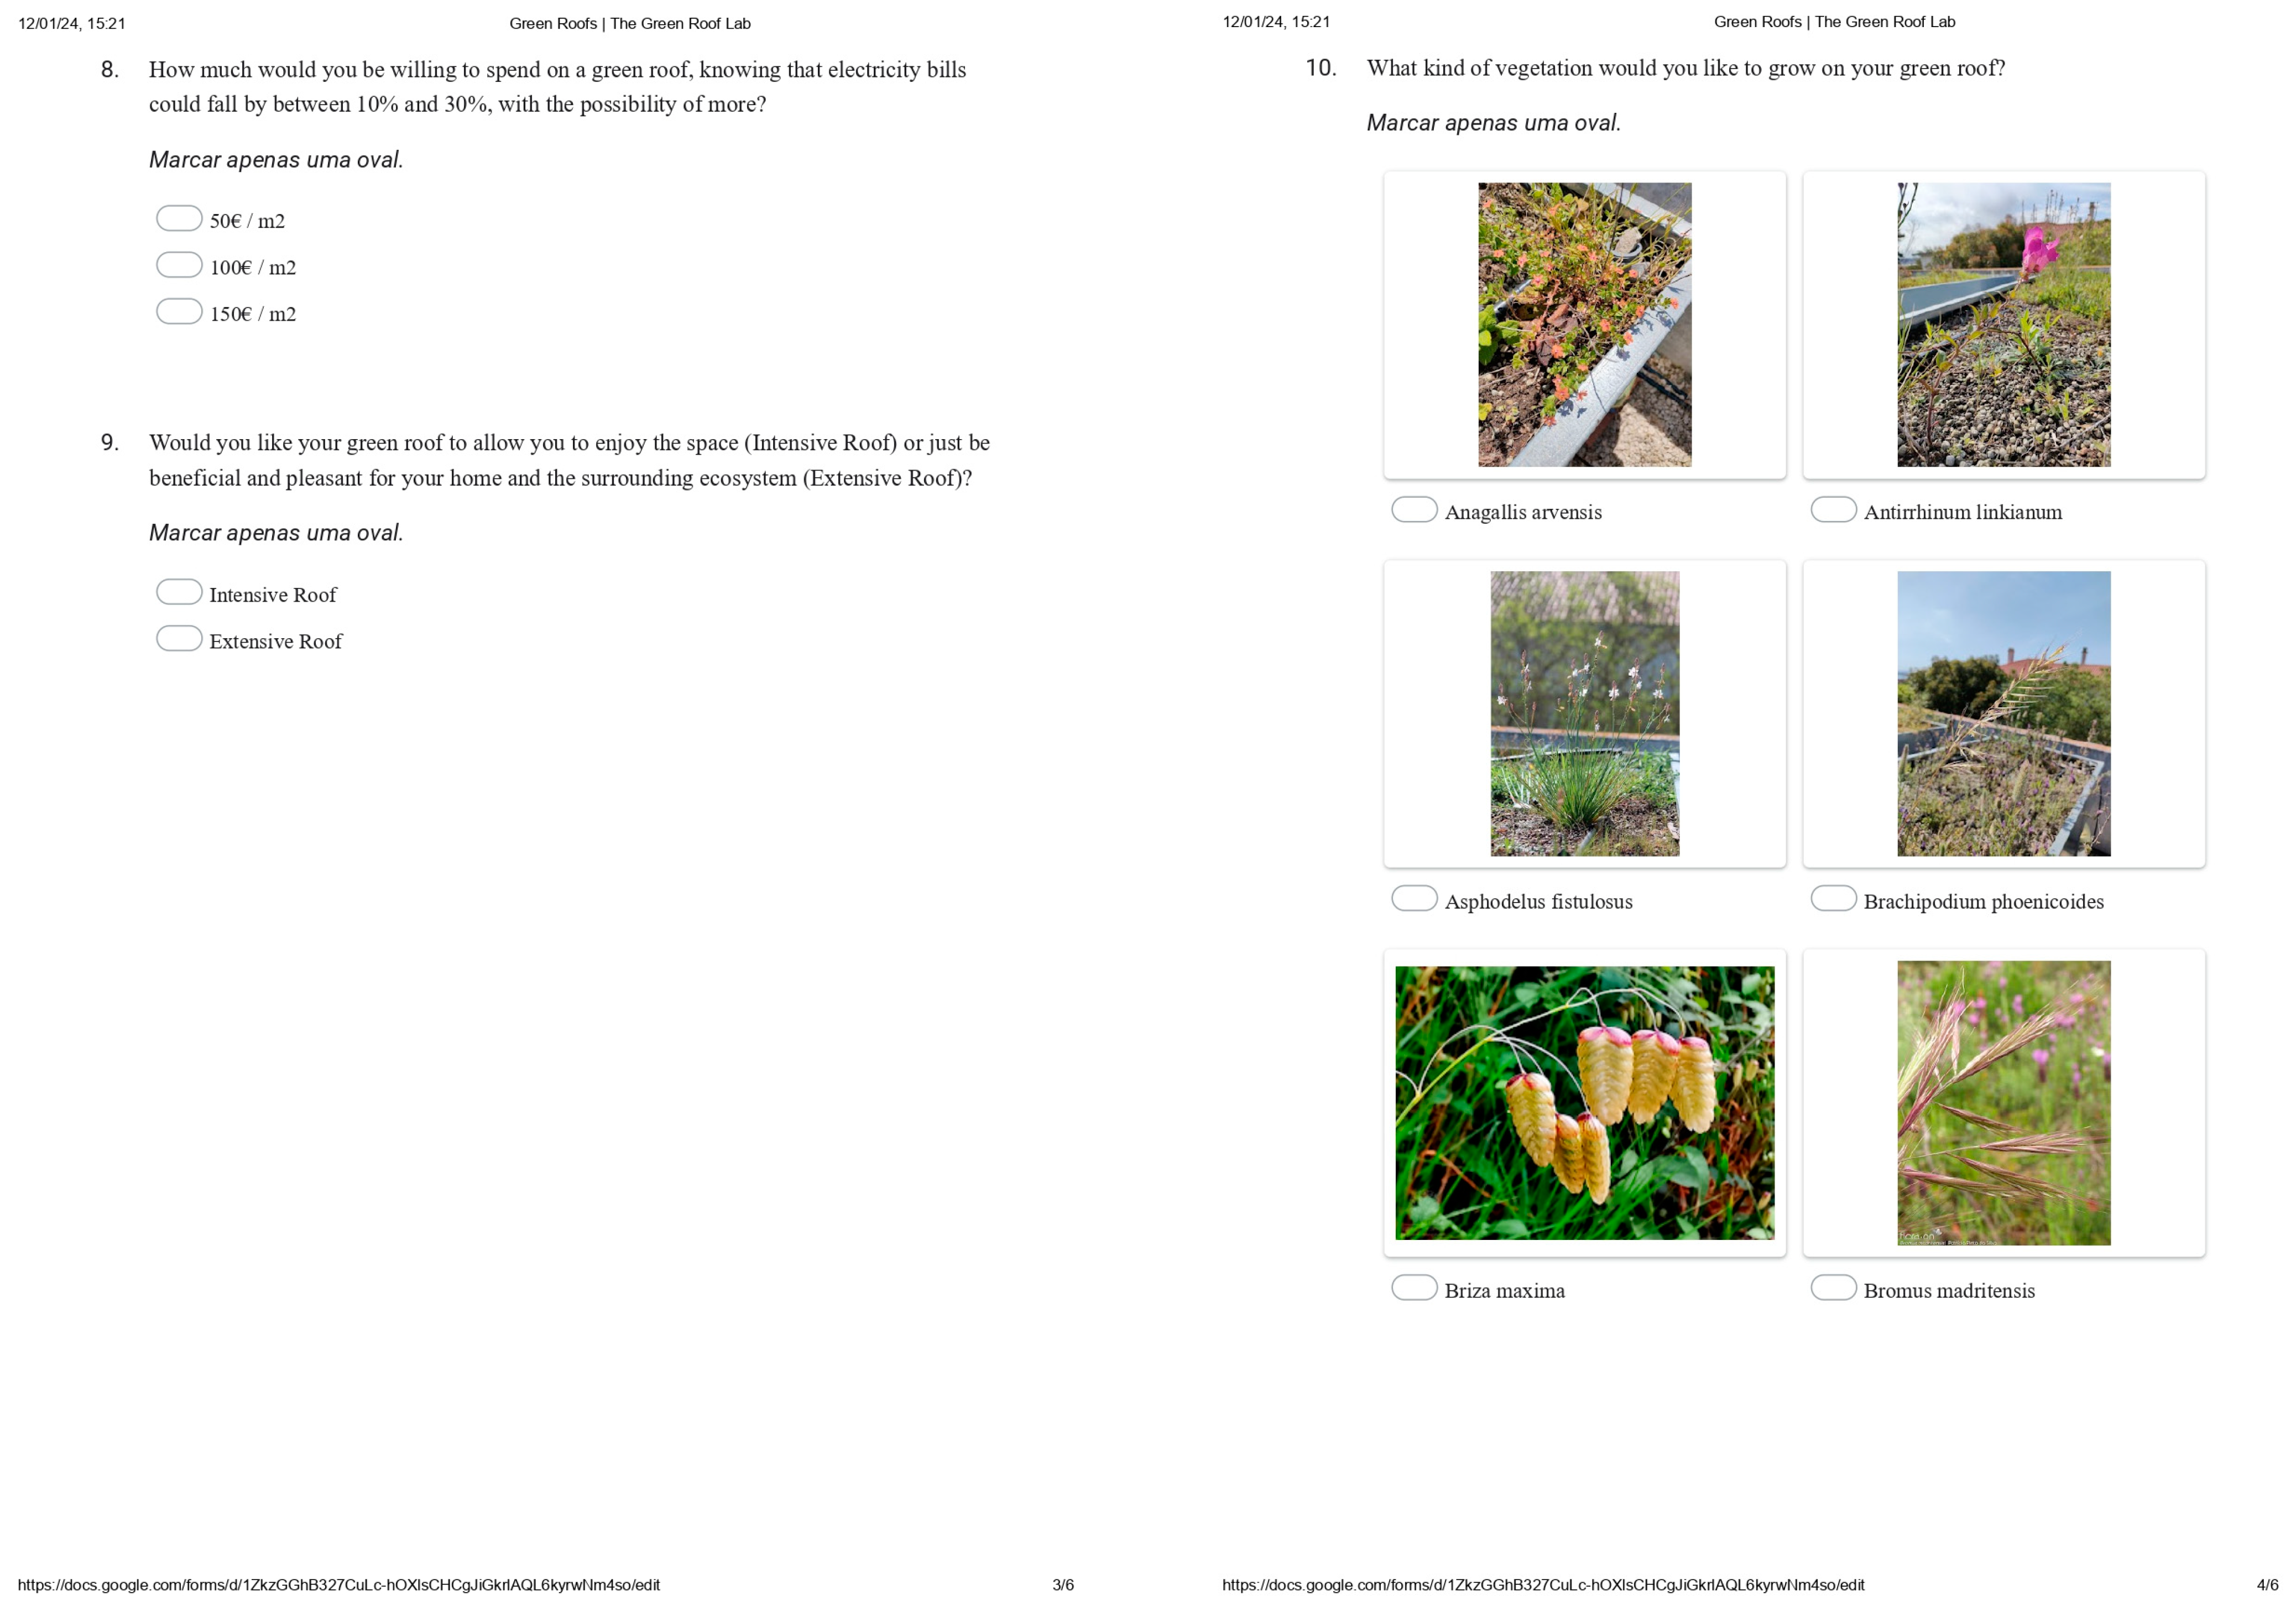
2.6. Surveys to Understand the Population’s Preferences

Green roofs are becoming more common in cities, and, along with this, public preference questions arise, since, for many citizens, the subject of green roofs is still unfamiliar. However, people are the main driver for the implementation of green roofs. With this in mind, an exploratory survey was created (vd. Figure A1) with the aims of better understanding people’s preferences regarding the potential to use spontaneous plant species in green roofs and assessing people’s understanding and willingness to install a green roof on their dwelling, if they had the necessary means.
The questionnaire was shared through Google Forms and requests were sent via e-mails, the authors’ LinkedIn networks and WhatsApp groups, and the green roof lab’s Facebook page (https://www.facebook.com/thegreenrooflab, accessed on 20 December 2023). The estimated target group would reach a minimum of 2000 people, some of whom were related to Landscape Architecture professional practice. From 29 May 2022 to 12 August 2023, a total of 220 responses were received, from which an estimated survey response rate of about 11% was estimated.
The survey was structured in five parts. The first consisted of collecting information about the respondent and the second was about their familiarity with the topic of green roofs. The next part focused on understanding each respondent’s willingness to install a green roof and the fourth part aimed to determine how much each respondent was willing to spend on the installation of green roofs. Finally, the fifth and last part aimed to understand each respondent’s preferences regarding the use of spontaneous plant species in the construction of green roofs. For this, pictures of the vegetation installed in the experimental test beds of the green roof lab were used. A simple descriptive statistics analysis was performed with R software (R4.3.2, https://www.r-project.org/, accessed on 20 December 2023).to describe the representability and structure of the sample and the results, including an age frequency distribution, with seven categories of age ranges defined. The Chi-square test was used to determine whether there was a significant difference in proportion between the responses for questions three and four.

3. Results

3.1. Image Analysis

Table 3 presents the measurement results for the percentages of area covered by vegetation in the 12 test beds at the green roof lab. The values are presented for the north and south areas and for the dates of 22 December 2021, the first day of photographs, and 20 June 2022, the last day of photographs. The total coverage area of the referred test bed, in both days of photographs, is also presented.
Figure 9a synthesizes the information about the total surface coverage area by vegetation: from a total area of 30 m2 (12 test beds with an area of 2.5 m2 each), 14.18 m2 was covered with vegetation, almost equally divided between the north and south sides (Figure 9b).

3.2. Vegetation Analysis

Considering the vegetation introduced in previous projects, it was possible to understand which species appeared spontaneously.
Many plants have been introduced over the years—37 species—however, few have persisted, as only 16 have remained until the last observation in June 2022 (Table 4). The presence of the following species was identified in the test beds: Antirrhinum linkianum, Anagallis arvensis, Asphodelus fistulosus, Briza maxima, Brachypodium phoenicoides, Bromus madritensis, Centaurium grandiflorum, Centranthus ruber, Dittrichia viscosa, Geranium purpureum, Holcus lanatus, Lavandula stoechas, Laphangium luteoalbum, Lathyrus tingitanus, Papaver rhoeas, Reichardia picroides, Rosmarinus officinalis, Silene vulgaris, Stachys germanica, Teucrium scorodonia, Trifolium angustifolium, Trifolium arvense, and Vulpia myuros.
For each test bed, the analysis of which species were preserved and which were spontaneous was carried out and the results are presented in Table 5. At the end of the period under analysis, the number of spontaneous species was higher than the number of installed species, particularly in the test beds receiving higher irrigation amounts. The species Brachypodium phoenicoides, Lavandula stoechas, and Rosmarinus officinalis have remained since 2014, originating from reseeding.

3.3. Responses Obtained from the Survey

The survey was answered by 220 respondents with a proportion of returned questionnaires (survey response rate) of 10%. Among the respondents, 139 (63%) were women and 81 (37%) were men, with a range of ages from 17 to 80. Regarding the age frequency distribution, seven age groups were considered, as presented in Figure 10.
Regarding housing typology, for the “Building” option, 157 answers (ca. 71% of total respondents) were obtained, and the “Private House” option was chosen by 63 respondents (ca. 29%). A chi-square statistical test for independence (Table 6) indicated that there was a significant difference in proportions between the responses for “building” and “private house”, since the calculated χ2 (78.63) was larger than the critical χ2 for a p-value below 0.05 (5.991).
In the fourth question, which was about their familiarity with the topic of green roofs, 157 respondents answered that they were familiar with the topic, but 63 respondents answered that they were not. Therefore, for around 29% of the total respondents, a green roof was not a familiar concept. As for the previous question, the results were again significantly different regarding both groups (Table 6).
The answers to the fifth question were extremely varied, since this was an open-ended question. To evaluate the answers, a simplified version of keyword manual coding [35] was used; the number of persons who mentioned some commonly used keywords in the definition of green roofs was counted. Therefore, responses with the co-occurrence of the keywords ‘vegetation’, ‘canopy’, and ’building’, or their synonyms, were considered as tentative definitions of the ‘green roof’ concept’. Out of 220 respondents, 28 did not use any of the keywords, or their synonyms, and their answers were considered to deviate from the concept, and 12 answered that they did not know what green roofs were. Thus, removing the incorrect answers and those who declared not to know what to answer, the number of answers to be analyzed was 180. From this total, 68 respondents used the three main keywords related to green roofs; 136 people identified that a green roof involved the construction of a structure on a roof, 83 people recognized that a green roof would be associated with buildings and construction; and finally, 146 people indicated that a green roof would be composed of vegetation. In all these answers, synonyms of the keywords were accepted.
The next two questions referred to the willingness of each person to install a green roof, assuming they had the conditions in their dwelling to do so. In question six, of a total of 220 respondents, 141 answered that they would install a green roof, 60 answered that they might install a green roof, and only 19 answered that they would not. The Chi-square statistical test, performed to investigate whether the distribution of responses was independent of the groups responding, yielded the results presented in Table 6. The calculated χ2 (105.12) was larger than the critical χ2 for a p-value below 0.05 (5.991). Therefore, the null hypothesis could be rejected, meaning that the results were significantly different from what would be expected by chance.
For those respondents answering “maybe” and “no”, an additional question was asked, the seventh question of the survey, where they were asked whether they would install a green roof if they had some kind of financial support from the state. Of those 60 who answered maybe, 44 responded that they would consider installing a green roof, however, 16 reversed their previous response by answering that they would not install it despite the subsidy. Of the 19 who answered “no”, only 2 changed their answer to “yes” and 17 kept their answer. Therefore, in the end, a total of 46 people answered “yes” to the question and 33 “no” if financial support would be provided. The p-value calculated from the chi-square test (Table 6) was slightly below the significance level (0.05), therefore, it is not possible to conclude that there was a significant difference in proportion between those who answered “yes” and those who answered “no”; thus, the results for this question must be interpreted with caution.
How much each respondent would be willing to spend to install a green roof (Question 8) was also asked. For 115 people, representing 61% of the respondents, the answer was EUR 50 per m2, while 62 would spend up to EUR 100 per m2 and only 10 would be willing to spend EUR 150 per m2. In this case, the chi-square test indicated that there was a significant difference between the observed and expected counts of answers (Table 6).
In the next question (Question 9), the respondents were asked about the purpose of the green roof, that is, if they would like it to be a space they could enjoy. The option “Intensive Covering” was chosen by 101 and the other option, “Extensive Covering”, was answered by 86 respondents, and 33 didn’t answer/know. As previously, the chi-square test indicated that the observed counts significantly differed from the expected counts, validating the answers (Table 6).
The last question was intended to assess the public’s preferences and to understand which plants they would eventually appreciate and choose for green roofs. For this, there were several options with their respective photographs, and, of these options, only one had more than 90 votes (Lavandula stoechas)—equivalent to 50% of the respondents (Figure 11).
Thus, of the 220 people who answered the survey, 187 demonstrated a willingness to install a green roof if they had the necessary conditions (money to invest and maintain, space, and load capacity in a building’s roof). For these respondents, the preferred species were Lavandula stoechas, Papaver rhoeas, Anagallis arvensis, and Rosmarinus officinalis.

4. Discussion

4.1. Image Analysis

Figure 12 summarizes the evolution of the area covered by the vegetation of the different test beds. The percentage of change in the area covered between the months of study, namely, between 22 December 2021 and 20 June 2022, is marked with dark points. There was a generalized increase in the area covered by vegetation during the period when the digital analysis was performed, with a global average of 19.55% and a maximum of 39.2% for test bed 10. An exception was observed for test bed five, which presented a negative coverage change.
In the northern part of test bed three, there was a small increase in the area covered, but, in the southern zone, there was almost a doubling of the area covered with vegetation, which can be justified by the strong presence of Trifolium angustifolium. This species showed a high capacity to reseed in the test beds where it was previously sown, as, at the end of the period under analysis, it was present in all of them. Also, it showed the ability to colonize other test beds, since it spontaneously appeared in test beds 3, 4, 5, and 6. The high persistence of this species has already been documented previously by other authors in similar climates, in comparison to other annual self-reseeding legumes [36].
For test bed four, there was an increase of 0.68 m2 in vegetation and it was completely dominated by the annual climbing species Lathyrus tingitanus. This is in accordance with the growth and development habits of this species, documented by other authors as having the greatest canopy heights and providing the most ground cover, in comparative trials with other legume species [37,38].
Regarding test bed seven, there was an increase of 0.48 m2 in vegetation, and, for test bed eight, as in most of the other test beds, an increase in the area of vegetation occurred for both areas. At the end of the study, the total increase in vegetation was 0.62 m2 for this test bed. Concerning test bed nine, the values in Table 2 indicate that there was an increase of 0.92 m2 in vegetation area. This was justified by the presence of specimens of Trifolium arvense, which predominated in the test bed.
For test bed 10, on both sides of the test bed, there was an increase of 0.98 m2, and this increase was higher in the southern zone. This could have been caused by the existence and great development of Holcus lanatus specimens, which prevailed in the southern zone of this test bed. This species is frequently found in floodplain wetlands [39] and is associated with poor drainage [40]. Since the southern zone of the test beds tends to cumulate more water than the northern zone, given the slope of the test beds, the prevalence of this species in the southern zone could be explained by its good adaptation to more humid environments.
Regarding test bed 11, the area in the northern zone increased more than that in the southern area. Thus, at the beginning of the study, the area of covered vegetation was 0.64 m2 and, at the end of the records, this area became 1.07 m2, which translates to an increase of 0.43 m2. This increase can be reflected by the large growth of Trifolium arvense, which began to develop during the month of April. A similar situation occurred for test bed 12, where there was an increase of 0.46 m2 in the area of vegetation, which may have been a consequence of the presence of a high number of Trifolium arvense specimens in the southern part of the test bed, and, in the northern part, by the existence of specimens of Vulpia myuros, which, in the meantime, have developed.
Trifolium arvense is referred to by other authors as being relatively independent of dormancy habits, with the ability to germinate whenever soil moisture and temperature conditions are favorable, particularly in spring, and well adapted to low-rainfall and extreme-temperature environments [41]. Specifically, for green roofs, it is also referred to as being a drought-tolerant and dominant species [42]. This corroborates the observed behavior of this species in the test beds, in relation to dominance and its relatively easy adaptation to the conditions of the rooftop.
Two of the species used in the present study (Brachypodium phoenicoides and Sedum sediforme) were also tested in a previous study [23], and the authors pointed out an adequate aesthetic value and development in a two-year experiment. In our study, Brachypodium phoenicoides was able to persist for 8 years, as it was present at the time of the photographic monitoring in 2022. This was not the case, however, for Sedum sediforme, suggesting that the persistence of these species might be a relevant feature to follow, recurring in long-term studies.
Some small sources of error could be identified and must be noted. In the spring months—from the end of March until the end of June—some flowers began to appear, thus contributing to an increase in the vegetation area, but these were not in bloom throughout all these months, and some did not develop at all. In addition to these, there are also factors resulting from meteorological conditions, such as wind, that, in taller plants, can cause them to occupy a larger area momentarily because they are inclined.
As mentioned in Section 2.3, test beds with an increase of 0.50 m2 or more were considered for further analysis (test beds two, four, eight, nine, and ten). For these, it was possible to see that the species that occupied a larger area were the sowed specimens of Teucrium scorodonia and Trifolium angustifolium (test bed two), the specimen of Lathyrus tingitanus (spontaneous, test bed four), Dittrichia viscosa (spontaneous), Teucrium scorodonia, and Trifolium angustifolium (both sowed) for test bed eight. For test bed nine, Trifolium angustifolium, Trifolium arvense, Teucrium scorodonia, and Rosmarinus officinalis (all spontaneous) and, finally, for test bed ten, specimens of Teucrium scorodonia, Trifolium angustifolium, Holcus lanatus, and Dittrichia viscosa (all spontaneous).
Except for test bed number five, it is possible to conclude that, in general, the percentage of area covered by vegetation had an increasing trend during the study period, as expected, and that the information gathered provides insight into how the different species mixtures grew and covered the green roof surface.
Finally, it should also be noted that there were species that, despite not being relevant in contributing to the increase in vegetation cover, were present in most of the test beds, being the spontaneous species Geranium purpureum, Laphangium luteoalbum, and Vulpia myuros and, sometimes, of those previously planted, Trifolium angustifolium.

4.2. Vegetation Analysis

Considering the data presented in Section 3.2, it is possible to note that several plant species appeared spontaneously: Bromus madritensis, Centaurium grandiflorum, Dittrichia viscosa, Geranium purpureum, Holcus lanatus, Laphangium luteoalbum, Lathyrus tingitanus, Silene vulgaris, Trifolium arvense, and Vulpia myuros, being all native species, except for L. luteoalbum, which is a non-invasive exotic, and that some of the vegetation emerged from previous introductions: Lavandula stoechas, Rosmarinus officinalis, Brachypodium phoenicoides, Asphodelus fistulosus, Antirrhinum linkianum, Briza maxima, Centranthus ruber, Papaver rhoeas, Reichardia picroides, Stachys germanica, Teucrium scorodonia, Trifolium angustifolium, and Anagallis arvensis (Table 4).
The Brachypodium phoenicoides specimens present in test beds six, seven, eleven, and twelve may have arisen from the NativeScapeGR project in 2014, which planted them in test beds one, three, five, seven, and nine.
On the other hand, the existence of Antirrhinum linkianum in test beds three, seven, and eleven could be justified by its pre-planting in 2018, following the ApiWall project, in test beds one, two, three, four, eight, nine, and ten.
Regarding Reichardia picroides specimens, they were installed in test beds two, three, four, eight, nine, and ten at the time of the ApiWall project in 2018, and, at the end of the study, they were still in test beds three, eight, nine, and ten, and, unintentionally, in test beds seven, eleven, and twelve, indicating a good persistence of this species under the study conditions and also the capacity to colonize.
Stachys germanica specimens existed only in test bed seven, however, they were planted in test beds one, two, six, and eight in 2018 by the ApiWall project, and, in 2020, they were installed in test beds six and seven according to the ApiMat project. Their persistence was therefore low. In the natural environment, this species is found on the edges and clearings of evergreen forests and thickets, often on limestone substrates, sometimes somewhat ruderalized. The high exposure to radiation on the roof might have compromised the persistence of this plant over the years.
The spontaneous existence of Teucrium scorodonia specimens in test beds seven and nine, on the other hand, should be based on their previous sowing in test beds one, two, six, and eight in 2018 for the ApiWall project, and in test beds six and seven at the time of planting for the ApiMat project. The existence of Briza maxima specimens in test bed nine derived from their installation in 2018 for the ApiWall project in test beds one, two, six, and eight, or else from their subsequent planting in test beds six and seven on behalf of the ApiMat project. As for Rosmarinus officinalis specimens (test bed nine), they originated from their planting in 2014 by the NativeScapeGR project, which installed them in test beds one, five, six, and eight. The existence of Centranthus ruber specimens in test bed ten may have come from the ApiWall project, which planted them in test beds one, two, three, four, five, seven, and eight. Contrasting with this study, this species has been tested for adaptation in similar conditions with good results [43]. The species is well adapted to Mediterranean conditions and calcareous and rocky soils. Possibly the high organic matter content of the substrate used for the present study, contrasting with the natural habitat (rocky soils), was not adequate for the species, hampering its persistence.
Finally, it is possible to understand that, despite the plantations, the sowing, and the transplantations in certain test beds, the vegetation could propagate to other test beds, which means that, in a green roof, for these species and conditions, it is likely to expect such behavior. As previously noted [44], the colonization by spontaneous species in a green roof may not necessarily be considered as a failure, as it is also an opportunity to improve the functioning of the system and achieve a more balanced system, closer to natural conditions. In the present situation, not only the colonization by spontaneous species, but also that of neighbor test beds by introduced species, denote an approach to the natural equilibrium of the green roofs mimicked in this study, as, in general, the better adapted species thrive and are able to be installed in new locations.

4.3. Responses Obtained to the Survey

Through the survey, it was possible to understand the preferences of the population, their willingness and availability to install a green cover, and how much information they had about the subject. The results indicate that the most chosen plants by the population were Lathyrus tingitanus, Rosmarinus officinalis, Lavandula stoechas, Papaver rhoeas, and Anagallis arvensis. That is, people chose the plants they were more familiar with and that brought more color—through larger flowers and, consequently, more visibility—to the green roofs.
Regarding familiarity with the subject of green roofs, from the 220 respondents, only 157 said they were familiar with the subject (and 63 were not), which indicates that there is still some lack of information on the subject among the population. Even so, from the 63 respondents that were not familiar with the theme, 39 were receptive to installing a green roof.
Aligned with the third objective of this survey, which consisted of understanding the disposition of the respondents towards the possibility of installing green roofs on their residences, from the total sample, 141 answered that they would install one without any kind of financial incentive from the government, 46 would only install them if they had access to support, and 33 answered they would not install them, regardless of existing support. This indicates that the existence of a financial incentive would be appellative for around 20% of the total respondents. The adoption of incentive policies by many municipalities over the world is actually promoting the installation of green roofs, since these structures have high initial costs and annual maintenance needs [45]. Monetary incentives would allow more people to be willing to install green roofs, which would end up having an impact on the common lives of all citizens.
The results also show that more research is needed on this topic to increase knowledge and the variety of species available, and to find more attractive and equally favorable specimens for green roofs.

5. Conclusions

This study had, as its primary objective, the analysis of the evolution of the vegetation that has been installed, since 2014, in the test beds of an outdoor laboratory at the School of Agriculture of the University of Lisbon, Portugal—the green roof lab—as well as the adoption of a methodology that would allow for this evaluation.
From all the species that have been planted or seeded throughout the years, the specimens of Antirrhinum linkianum, Asphodelus fistulosus, Brachypodium phoenicoides, Briza maxima, Lavandula stoechas, Reichardia picroides, Rosmarinus officinalis, Teucrium scorodonia, Trifolium angustifolium, and Papaver rhoeas were the ones that persisted until June 2022. Simultaneously, it was possible to observe that species once planted in certain test beds were later found in other test beds. This suggests that birds, insects, and wind may have been the elements that provided the transfer of seeds between test beds, as is the case for Centranthus ruber, Stachys germanica, and Anagallis arvensis.
Regarding the appearance of Anagallis arvensis, Bromus madritensis, Centaurium grandiflorum, Dittrichia viscosa, Geranium purpureum, Holcus lanatus, Laphangium luteoalbum, Lathyrus tingitanus, Silene vulgaris, Trifolium arvense, and Vulpia myuros, it was possible to conclude that these specimens spontaneously appeared in the test beds without being introduced on the behalf of previous projects.
Concerning the percentage of vegetation cover, the test beds with an increase of at least 0.50 m2 between the beginning and the end of the study were test beds two, four, eight, nine, and ten. For these test beds, it was possible to determine, through the digital analysis, which species stood out the most, and, from there, make a selection of plants—Dittrichia viscosa, Rosmarinus officinalis, Teucrium scorodonia Trifolium angustifolium, Trifolium arvense (all introduced natives), Holcus lanatus, and Lathyrus tingitanus (both spontaneous).
The methodology adopted for the digital image analysis in this project proved to be effective, however, with some sensibility for human error. As far as the photographs are concerned, the system should be static and not repeatedly assembled and disassembled, to reduce the probability of errors. As for the image analysis, the images were worked in a succession of operations to obtain the percentages of vegetation areas. Although, in general, an increasing trend for the percentages of the areas covered with vegetation over the time of the study was observed, it was also possible to observe that the values obtained were quite oscillating. This may indicate that the images may have accumulated successive errors resulting from the constant transformations they underwent, which may have then impacted the results. For further studies, it is suggested to minimize the steps to avoid errors.
Conjugating the results obtained from the surveys, with the results relating to the species with the highest occupation in the test beds, it was possible to obtain a set of 10 species that proved to be the most resilient, with the greatest development and preference by people enquired. These were Anagallis arvensis, Dittrichia viscosa, Holcus lanatus, Lathyrus tingitanus, Lavandula stoechas, Rosmarinus officinalis, Teucrium scorodonia, Trifolium angustifolium, Trifolium arvense, and Papaver rhoeas.

Author Contributions

Conceptualization, P.A. and T.A.d.P.; data curation, T.A.d.P.; formal analysis, P.A.; funding acquisition, T.A.d.P.; investigation, M.R.; methodology, M.R., P.A. and T.A.d.P.; resources, T.A.d.P.; supervision, P.A. and T.A.d.P.; validation, P.A. and T.A.d.P.; writing—original draft, M.R.; writing—review and editing, M.R., P.A. and T.A.d.P. All authors have read and agreed to the published version of the manuscript.

Funding

This work was funded by national funds through FCT—Fundação para a Ciência e a Tecnologia, I.P., under the projects NativeScapeGR (EXPL/ATP-ARP/0252/2013) and UIDB/04129/2020 (LEAF-Linking Landscape, Environment, Agriculture and Food, Research Unit).

Data Availability Statement

Data are contained within the article.

Acknowledgments

The authors wish to acknowledge the contribution of the enterprises Sigmetum and Neoturf.

Conflicts of Interest

The authors declare no conflict of interest.

Appendix A

Figure A1. Questionnaire addressing the people’s preferences for the vegetation on the test beds used in the present study (“Marcar apenas uma oval” means “select only one oval”).
Horticulturae 10 00106 g0a1aHorticulturae 10 00106 g0a1bHorticulturae 10 00106 g0a1c

References

  1. Darma, I.D.P.; Sutomo, S.; Hanum, S.F.; Iryadi, R.; Rahayu, A. Flowers and Value of Conservation in The Culture of Hindu Community in Bali. Biosaintifika J. Biol. Biol. Educ. 2021, 13, 34–40. [Google Scholar] [CrossRef]
  2. Friberg, C.; Vasquez, R. (Eds.) Experiencing the Everyday; NSU Press: Copenhagen, Denmark, 2017. [Google Scholar]
  3. Matthews, P. Scientific Knowledge and the Aesthetic Appreciation of Nature. J. Aesthet. Art Crit. 2002, 60, 37–48. [Google Scholar] [CrossRef]
  4. Jim, C.Y. An archaeological and historical exploration of the origins of green roofs. Urban For. Urban Green. 2017, 27, 32–42. [Google Scholar] [CrossRef]
  5. Almeida, C.; Teotónio, I.; Silva, C.M.; Cruz, C.O. Socioeconomic feasibility of green roofs and walls in public buildings: The case study of primary schools in Portugal. Eng. Econ. 2021, 66, 27–50. [Google Scholar] [CrossRef]
  6. Caldeira Cabral, F. Os Fundamentos da Arquitectura Paisagista (2a); Instituto da Conservação da Natureza: Lisboa, Portugal, 2003. [Google Scholar]
  7. William, R.; Goodwell, A.; Richardson, M.; Le, P.V.V.; Kumar, P.; Stillwell, A.S. An environmental cost-benefit analysis of alternative green roofing strategies. Ecol. Eng. 2016, 95, 1–9. [Google Scholar] [CrossRef]
  8. Du Pisani, J.A. Sustainable development–historical roots of the concept. Environ. Sci. 2006, 3, 83–96. [Google Scholar] [CrossRef]
  9. Ducarme, F. Qu’est-ce que la nature qu’on cherche à conserver? Une approche sémiologique de l’action écologique. Nouv. Perspect. En Sci. Soc. 2019, 14, 23–60. [Google Scholar] [CrossRef]
  10. Peck, S.W.; Kuhn, M. Design Guidelines for Green Roofs (Ontario Association of Architects); Ontario Association of Architects, Ontario, Canada: 2003. Available online: https://books.google.pt/books?id=YDGrYgEACAAJ (accessed on 5 December 2023).
  11. Matos Silva, C.; Oliveira Cruz, C.; Teotónio, I. Project GENESIS: An All-inclusive Model to Perform Cost-Benefit Analysis of Green Roofs and Walls. Eur. J. Sustain. Dev. 2019, 8, 85. [Google Scholar] [CrossRef]
  12. Anico, A. Plantas Autóctones em Coberturas Verdes: Avaliação do Desenvolvimento e Valor Estético vs. Rega e Tipo de Substrato. Ph.D. Thesis, Universidade de Lisboa, Lisboa, Portugal, 2016. [Google Scholar]
  13. Papafotiou, M.; Pergialioti, N.; Tassoula, L.; Massas, I.; Kargas, G. Growth of Native Aromatic Xerophytes in an Extensive Mediterranean Green Roof as Affected by Substrate Type and Depth and Irrigation Frequency. HortScience 2013, 48, 1327–1333. [Google Scholar] [CrossRef]
  14. Benvenuti, S.; Bacci, D. Initial agronomic performances of Mediterranean xerophytes in simulated dry green roofs. Urban Ecosyst. 2010, 13, 349–363. [Google Scholar] [CrossRef]
  15. Carbone, M.; Nigro, G.; Garofalo, G.; Piro, P. Experimental Testing for Evaluating the Influence of Substrate Thickness on the Sub-Surface Runoff of a Green Roof. In Applied Mechanics and Materials; Trans Tech Publications, Ltd.: Bäch, Switzerland, 2015; Volume 737, pp. 705–709. [Google Scholar] [CrossRef]
  16. Ondoño, S.; Martínez-Sánchez, J.J.; Moreno, J.L. Evaluating the growth of several Mediterranean endemic species in artificial substrates: Are these species suitable for their future use in green roofs? Ecolog. Engin. 2015, 81, 405–417. [Google Scholar] [CrossRef]
  17. Tassoula, L.; Papafotiou, M.; Liakopoulos, G.; Kargas, G. Growth of the Native Xerophyte Convolvulus cneorum L. on an Extensive Mediterranean Green Roof under Different Substrate Types and Irrigation Regimens. Hortscience 2015, 50, 1118–1124. [Google Scholar] [CrossRef]
  18. Cascone, S.; Coma, J.; Gagliano, A.; Pérez, G. The evapotranspiration process in green roofs: A review. Build. Environ. 2019, 147, 337–355. [Google Scholar] [CrossRef]
  19. Klein, P.M.; Coffman, R. Establishment and performance of an experimental green roof under extreme climatic conditions. Sci. Total Environ. 2015, 512–513, 82–93. [Google Scholar] [CrossRef] [PubMed]
  20. Paço, T.; Cruz De Carvalho, R.; Arsénio, P.; Martins, D. Green Roof Design Techniques to Improve Water Use under Mediterranean Conditions. Urban Sci. 2019, 3, 14. [Google Scholar] [CrossRef]
  21. Wooster, E.I.F.; Fleck, R.; Torpy, F.; Ramp, D.; Irga, P.J. Urban green roofs promote metropolitan biodiversity: A comparative case study. Build. Environ. 2022, 207, 108458. [Google Scholar] [CrossRef]
  22. Partridge, D.R.; Clark, J.A. Urban green roofs provide habitat for migrating and breeding birds and their arthropod prey. PLoS ONE 2018, 13, e0202298. [Google Scholar] [CrossRef]
  23. Azeñas, V.; Janner, I.; Medrano, H.; Gulías, J. Performance evaluation of five Mediterranean species to optimize ecosystem services of green roofs under water-limited conditions. J. Environ. Manag. 2018, 212, 236–247. [Google Scholar] [CrossRef]
  24. Martini, A.N.; Tassoula, L.; Papafotiou, M. Adaptation of Salvia fruticosa, S. officinalis, S. ringens and interspecific hybrids in an extensive green roof under two irrigation frequencies. Notulae 2022, 50, 12767. [Google Scholar] [CrossRef]
  25. Papafotiou, M.; Martini, A.N.; Tassoula, L.; Stylias, E.G.; Kalantzis, A.; Dariotis, E. Acclimatization of Mediterranean native sages (Salvia spp.) and interspecific hybrids in an urban green roof under regular and reduced irrigation. Sustainability 2022, 14, 4978. [Google Scholar] [CrossRef]
  26. Martini, A.N.; Papafotiou, M.; Massas, I.; Chorianopoulou, N. Using the Halophyte Crithmum maritimum in Green Roofs for Sustainable Urban Horticulture: Effect of Substrate and Nutrient Content Analysis including Potentially Toxic Elements. Sustainability 2022, 14, 4713. [Google Scholar] [CrossRef]
  27. Martini, A.N.; Papafotiou, M.; Massas, I.; Chorianopoulou, N. Growing of the Cretan Therapeutic Herb Origanum Dictamnus in The Urban Fabric: The Effect of Substrate and Cultivation Site on Plant Growth and Potential Toxic Element Accumulation. Plants 2023, 12, 336. [Google Scholar] [CrossRef] [PubMed]
  28. Leotta, L.; Toscano, S.; Romano, D. Which Plant Species for Green Roofs in the Mediterranean Environment? Plants 2023, 12, 3985. [Google Scholar] [CrossRef] [PubMed]
  29. Cruz De Carvalho, R.; Varela, Z.; Do Paço, T.A.; Branquinho, C. Selecting Potential Moss Species for Green Roofs in the Mediterranean Basin. Urban Sci. 2019, 3, 57. [Google Scholar] [CrossRef]
  30. Esfahani, R.E.; Paço, T.A.; Martins, D.; Arsénio, P. Increasing the resistance of Mediterranean extensive green roofs by using native plants from old ceilings and walls. Ecol. Eng. 2022, 178, 106576. [Google Scholar] [CrossRef]
  31. Figueiredo, C. Desenvolvimento de Tapetes de Vegetação com Espécies Autóctones com Potencial Para Instalação em Coberturas Verdes. Ph.D. Thesis, Universidade de Lisboa, Lisboa, Portugal, 2020. [Google Scholar]
  32. Arganda-Carreras, I.; Kaynig, V.; Rueden, C.; Schindelin, J.; Cardona, A.; Seung, H.S. Trainable_Segmentation: Release v3.1.Zenodo. 2016. Available online: https://zenodo.org/record/Acedido (accessed on 14 March 2022).
  33. Rocha, B.; Paço, T.; Luz, A.; Palha, P.; Milliken, S.; Kotzen, B.; Branquinho, C.; Pinho, P.; De Carvalho, R. Are Biocrusts and Xerophytic Vegetation a Viable Green Roof Typology in a Mediterranean Climate? A Comparison between Differently Vegetated Green Roofs in Water Runoff and Water Quality. Water 2021, 13, 94. [Google Scholar] [CrossRef]
  34. Martins, D. Estabelecimento de Coberturas Verdes com Plantas Autóctones na Região de Lisboa Desenvolvimento de Técnica Inovadora de Instalação de Vegetação. Ph.D. Thesis, Universidade de Lisboa, Lisboa, Portugal, 2018. [Google Scholar]
  35. Zhang, R.; Gong, J.; Ma, S.; Firdaus, A.; Xu, J. Automatic Coding Mechanisms for Open-Ended Questions in Journalism Surveys: An Application Guide. Digit. Journal. 2023, 11, 321–342. [Google Scholar] [CrossRef]
  36. Driouech, N.; Abou Fayad, F.; Ghanem, A.; Al-Bitar, L. Agronomic performance of annual self-reseeding legumes and their self-establishment potential in the Apulia region of Italy. In Cultivating the Future Based on Science: Proceeding of the Second Conference of the International Society of Organic Agriculture Research (ISOFAR); ISOFAR: Bonn, Germany, 2008; pp. 396–399. [Google Scholar]
  37. Douglas, G.B.; Foote, A.G. Performance of several annual legumes which have potential for soil conservation. New Zealand J. Exp. Agric. 1985, 13, 13–17. [Google Scholar] [CrossRef]
  38. Petrova, S.; Chipilski, R. Agrobiological and physiological evaluation of the accessions of the Lathyrus sp. Collection from the Genebank in Sadovo. Phytol. Balc. 2021, 26, 457–460. [Google Scholar] [CrossRef]
  39. Boigné, A.; Bureau, F.; Husté, A.; Levesque, S.; Delorme, A.; Quillet, L.; Langlois, E. Effects of waterlogging levels on Holcus lanatus response traits in different created topsoils. Flora 2017, 234, 106–118. [Google Scholar] [CrossRef]
  40. Becker, T.; Isselstein, J.; Jürschik, R.; Benke, M.; Kayser, M. Performance of Modern Varieties of Festuca arundinacea and Phleum pratense as an Alternative to Lolium perenne in Intensively Managed Sown Grasslands. Agronomy 2020, 10, 540. [Google Scholar] [CrossRef]
  41. Boswell, C.C.; Lucas, R.J.; Lonati, M.; Fletcher, A.; Moot, D.J. The ecology of four annual clovers adventive in New Zealand grasslands. NZGA Res. Pract. Ser. 2003, 11, 175–184. [Google Scholar] [CrossRef]
  42. Bates, A.J.; Sadler, J.P.; Mackay, R. Vegetation development over four years on two green roofs in the UK. Urban For. Urban Green. 2013, 12, 98–108. [Google Scholar] [CrossRef]
  43. Vestrella, A.; Savé, R.; Biel, C. An Experimental Study in Simulated Greenroof in Mediterranean Climate. J. Agric. Sci. 2015, 7, 95. [Google Scholar] [CrossRef]
  44. Vanstockem, J.; Somers, B.; Hermy, M. Weeds and gaps on extensive green roofs: Ecological insights and recommendations for design and maintenance. Urban For. Urban Green. 2019, 46, 126484. [Google Scholar] [CrossRef]
  45. Liberalesso, T.; Silva, C.M.; Cruz, C.O. Assessing financial subsidies for green roofs: A micro-scale analysis of Lisbon (Portugal). Cities 2023, 137, 104295. [Google Scholar] [CrossRef]
Figure 1. Aerial view of the green roof lab (School of Agriculture, University of Lisbon, Portugal) and localization map.
Horticulturae 10 00106 g001
Figure 2. Monthly rainfall and minimum and maximum temperatures, collected at a nearby automated weather station (IPMA Lisboa—Gago Coutinho, 38° 45′, 9° 7′, and 104 m, a.s.l.).
Horticulturae 10 00106 g002
Figure 3. Rainfall and irrigation from December 2021 to June 2022 at the green roof lab (Irrigation 1–7 refers to an amount calculated as 60% of reference evapotranspiration and Irrigation 8–12 to an amount calculated as 100% of reference evapotranspiration).
Horticulturae 10 00106 g003
Figure 4. Partial view of the test beds at the green roof lab (School of Agriculture, University of Lisbon, Portugal).
Horticulturae 10 00106 g004
Figure 5. Original image as acquired by the camera.
Horticulturae 10 00106 g005
Figure 6. The same image of Figure 1, after being worked in Photoshop.
Horticulturae 10 00106 g006
Figure 7. The same image of Figure 5 and Figure 6 worked on WEKA Segmentation (red indicates vegetation, green indicates substrate surface).
Horticulturae 10 00106 g007
Figure 8. Vegetation-selected areas (Red) and Substrate-selected areas (Green) by using Trainable Weka Segmentation in ImageJ.
Horticulturae 10 00106 g008
Figure 9. Surface coverage area by vegetation (%) and non-coverage area (a); mean percentage of vegetation coverage on each side of the test beds (b).
Horticulturae 10 00106 g009
Figure 10. Age frequency distribution of the questionnaire respondents.
Horticulturae 10 00106 g010
Figure 11. Public’s preferences regarding plant species (question 11 of the questionnaire). Frequency distribution of plant species.
Horticulturae 10 00106 g011
Figure 12. Total areas of vegetation coverage.
Horticulturae 10 00106 g012
Table 1. Vegetation that was installed (planted or sowed) in projects before this study in the green roof lab, (dates refer to project beginning).
NativeScapeGR (2014)ApiWall (2018)ApiMat (2020)
Brachypodium phoenicoidesAntirrhinum linkianumBriza maxima
Brachythecium plumosumAsphodelus fistulosusSedum sediforme
HomalotheciumBriza maximaSilene scabriflora
Lavandula stoechasCapsella bursa-pastorisStachys germanica
NeckeraCentranthus ruberTeucrium scorodonia
Pleurochaete squarrosaCentranthus calcitrapaeTrifolium angustifolium
Rosmarinus officinalisPapaver rhoeasTrifolium incarnatum
Phagnalon saxatile
Pleurochaete squarrosa
Reichardia picroides
Sanguisorba verrucosa
Sedum sediforme
Silene scabriflora
Stachys germanica
Teucrium scorodonia
Trifolium angustifolium
Table 2. Vegetation distribution in the test beds as originally planted or sowed in projects before this study in the green roof lab.
Species/Test Beds123456789101112
Antirrhinum linkianum
Asphodelus fistulosus
Brachypodium phoenicoides
Brachythecium plumosum
Briza maxima
Capsella bursa-pastoris
Centranthus calcitrapae
Centranthus ruber
Homalothecium
Lavandula stoechas
Papaver rhoeas
Neckera
Phagnalon saxatile
Pleurochaete squarrosa
Reichardia picroides
Rosmarinus officinalis
Sanguisorba verrucosa
Sedum sediforme
Silene scabriflora
Stachys germanica
Teucrium scorodonia
Trifolium angustifolium
Trifolium incarnatum
Table 3. Areas covered by vegetation for the 12 test beds.
Test BedDateNorth Area % (m2)South Area % (m2)Total Area (m2)
122 December45.25 (0.57)37.10 (0.46)1.03
20 June53.84 (0.67)44.13 (0.55)1.22
222 December21.50 (0.27)30.20 (0.38)0.65
20 June42.03 (0.53)57.75 (0.72)1.25
322 December31.80 (0.40)31.80 (0.40)0.80
20 June38.91 (0.49)60.70 (0.79)1.28
422 December24.00 (0.30)19.40 (0.24)0.54
20 June42.43 (0.53)55.43 (0.69)1.22
522 December40.70 (0.51)22.80 (0.29)0.80
20 June31.97 (0.40)29.61 (0.37)0.77
622 December65.0 (0.81)32.30 (0.40)1.21
20 June51.49 (0.64)50.71 (0.63)1.27
722 December25.10 (0.31)24.30 (0.30)0.61
20 June30.99 (0.39)55.79 (0.70)1.09
822 December23.20 (0.29)34.70 (0.43)0.72
20 June45.79 (0.57)61.48 (0.77)1.34
922 December28.80 (0.36)17.70 (0.22)0.58
20 June63.57 (0.79)56.65 (0.71)1.50
1022 December17.40 (0.22)12.20 (0.15)0.37
20 June47.17 (0.59)61.08 (0.76)1.35
1122 December21.20 (0.27)29.20 (0.37)0.64
20 June44.00 (0.55)41.24 (0.52)1.07
1222 December9.40 (0.12)19.50 (0.24)0.36
20 June27.19 (0.34)38.31 (0.48)0.82
Average 36.3638.500.94
Standard deviation 14.3415.660.34
Table 4. Vegetation that remained in the test beds from previous projects (planted or sowed; observations performed on 20 June 2022; dates refer to projects beginning).
NativeScapeGR (2014)ApiWall (2018)ApiMat (2020)
Lavandula stoechasAsphodelus fistulosusBriza maxima
Rosmarinus officinalisAntirrhinum linkianumStachys germanica
Brachypodium phoenicoidesBriza maximaTeucrium scorodonia
Centranthus ruberTrifolium angustifolium
Papaver rhoeas
Reichardia picroides
Stachys germanica
Teucrium scorodonia
Trifolium angustifolium
Table 5. Vegetation that remained from previous projects and spontaneous species that appeared in each test bed (observations performed on 20 June 2022).
Test Bed123456
Installed
vegetation
L. stoechasT. angustifoliumA. linkianumA. fistulosusL. stoechasB. maxima
R. officinalisT. scorodoniaA. fistulosus T. angustifolium
T. angustifolium R. picroides T. scorodonia
T. scorodonia B. maxima
Spontaneous vegetationV. myurosL. luteoalbumG. purpureumL. luteoalbumL. luteoalbumA. arvensis
C. grandiflorumV. myurosL. luteoalbumL. tingitanusV. myurosB. phoenicoides
T. angustifoliumV. myurosT. angustifoliumL. tingitanus
T. angustifolium V. myuros
Test bed789101112
Installed
vegetation
B. phoenicoidesB. maximaR. picroidesA. fistulosus
P. rhoeasR. picroides R. picroides
S. germanicaT. angustifolium
T. angustifoliumT. scorodonia
T. scorodonia
Spontaneous vegetationA. linkianumD. viscosaB. maximaB. madritensisA. linkianumB. phoenicoides
G. purpureumL. luteoalbumG. purpureumC. ruberB. phoenicoidesB. madritensis
R. picroidesL. tingitanusL. luteoalbumD. viscosaB. madritensisG. purpureum
V. myurosS. vulgarisR. officinalisG. purpureumG. purpureumR. picroides
V. myurosS. vulgarisL. luteoalbumH. lanatusT. angustifolium
T. scorodoniaH. lanatusR. picroidesT. arvense
T. angustifoliumT. angustifoliumT. arvenseV. myuros
T. arvenseV. myurosV. myuros
V. myuros
Table 6. Chi-square statistical test applied to the results of selected questions of the questionnaire.
Question NumberCalculated χ2dfp-Value
378.6312.2 × 10−16
478.6312.2 × 10−16
6105.1222.2 × 10−16
73.6510.0562
888.4422.2 × 10−16
934.8122.8 × 10−8
Disclaimer/Publisher’s Note: The statements, opinions and data contained in all publications are solely those of the individual author(s) and contributor(s) and not of MDPI and/or the editor(s). MDPI and/or the editor(s) disclaim responsibility for any injury to people or property resulting from any ideas, methods, instructions or products referred to in the content.

