
Seedling Growth Stress Quantification Based on Environmental Factors Using Sensor Fusion and Image Processing


 ,
,  ,
, 
Abstract
:1. Introduction
2. Materials and Methods
2.1. Experimental Site Preparation and Seedling Growth Conditions
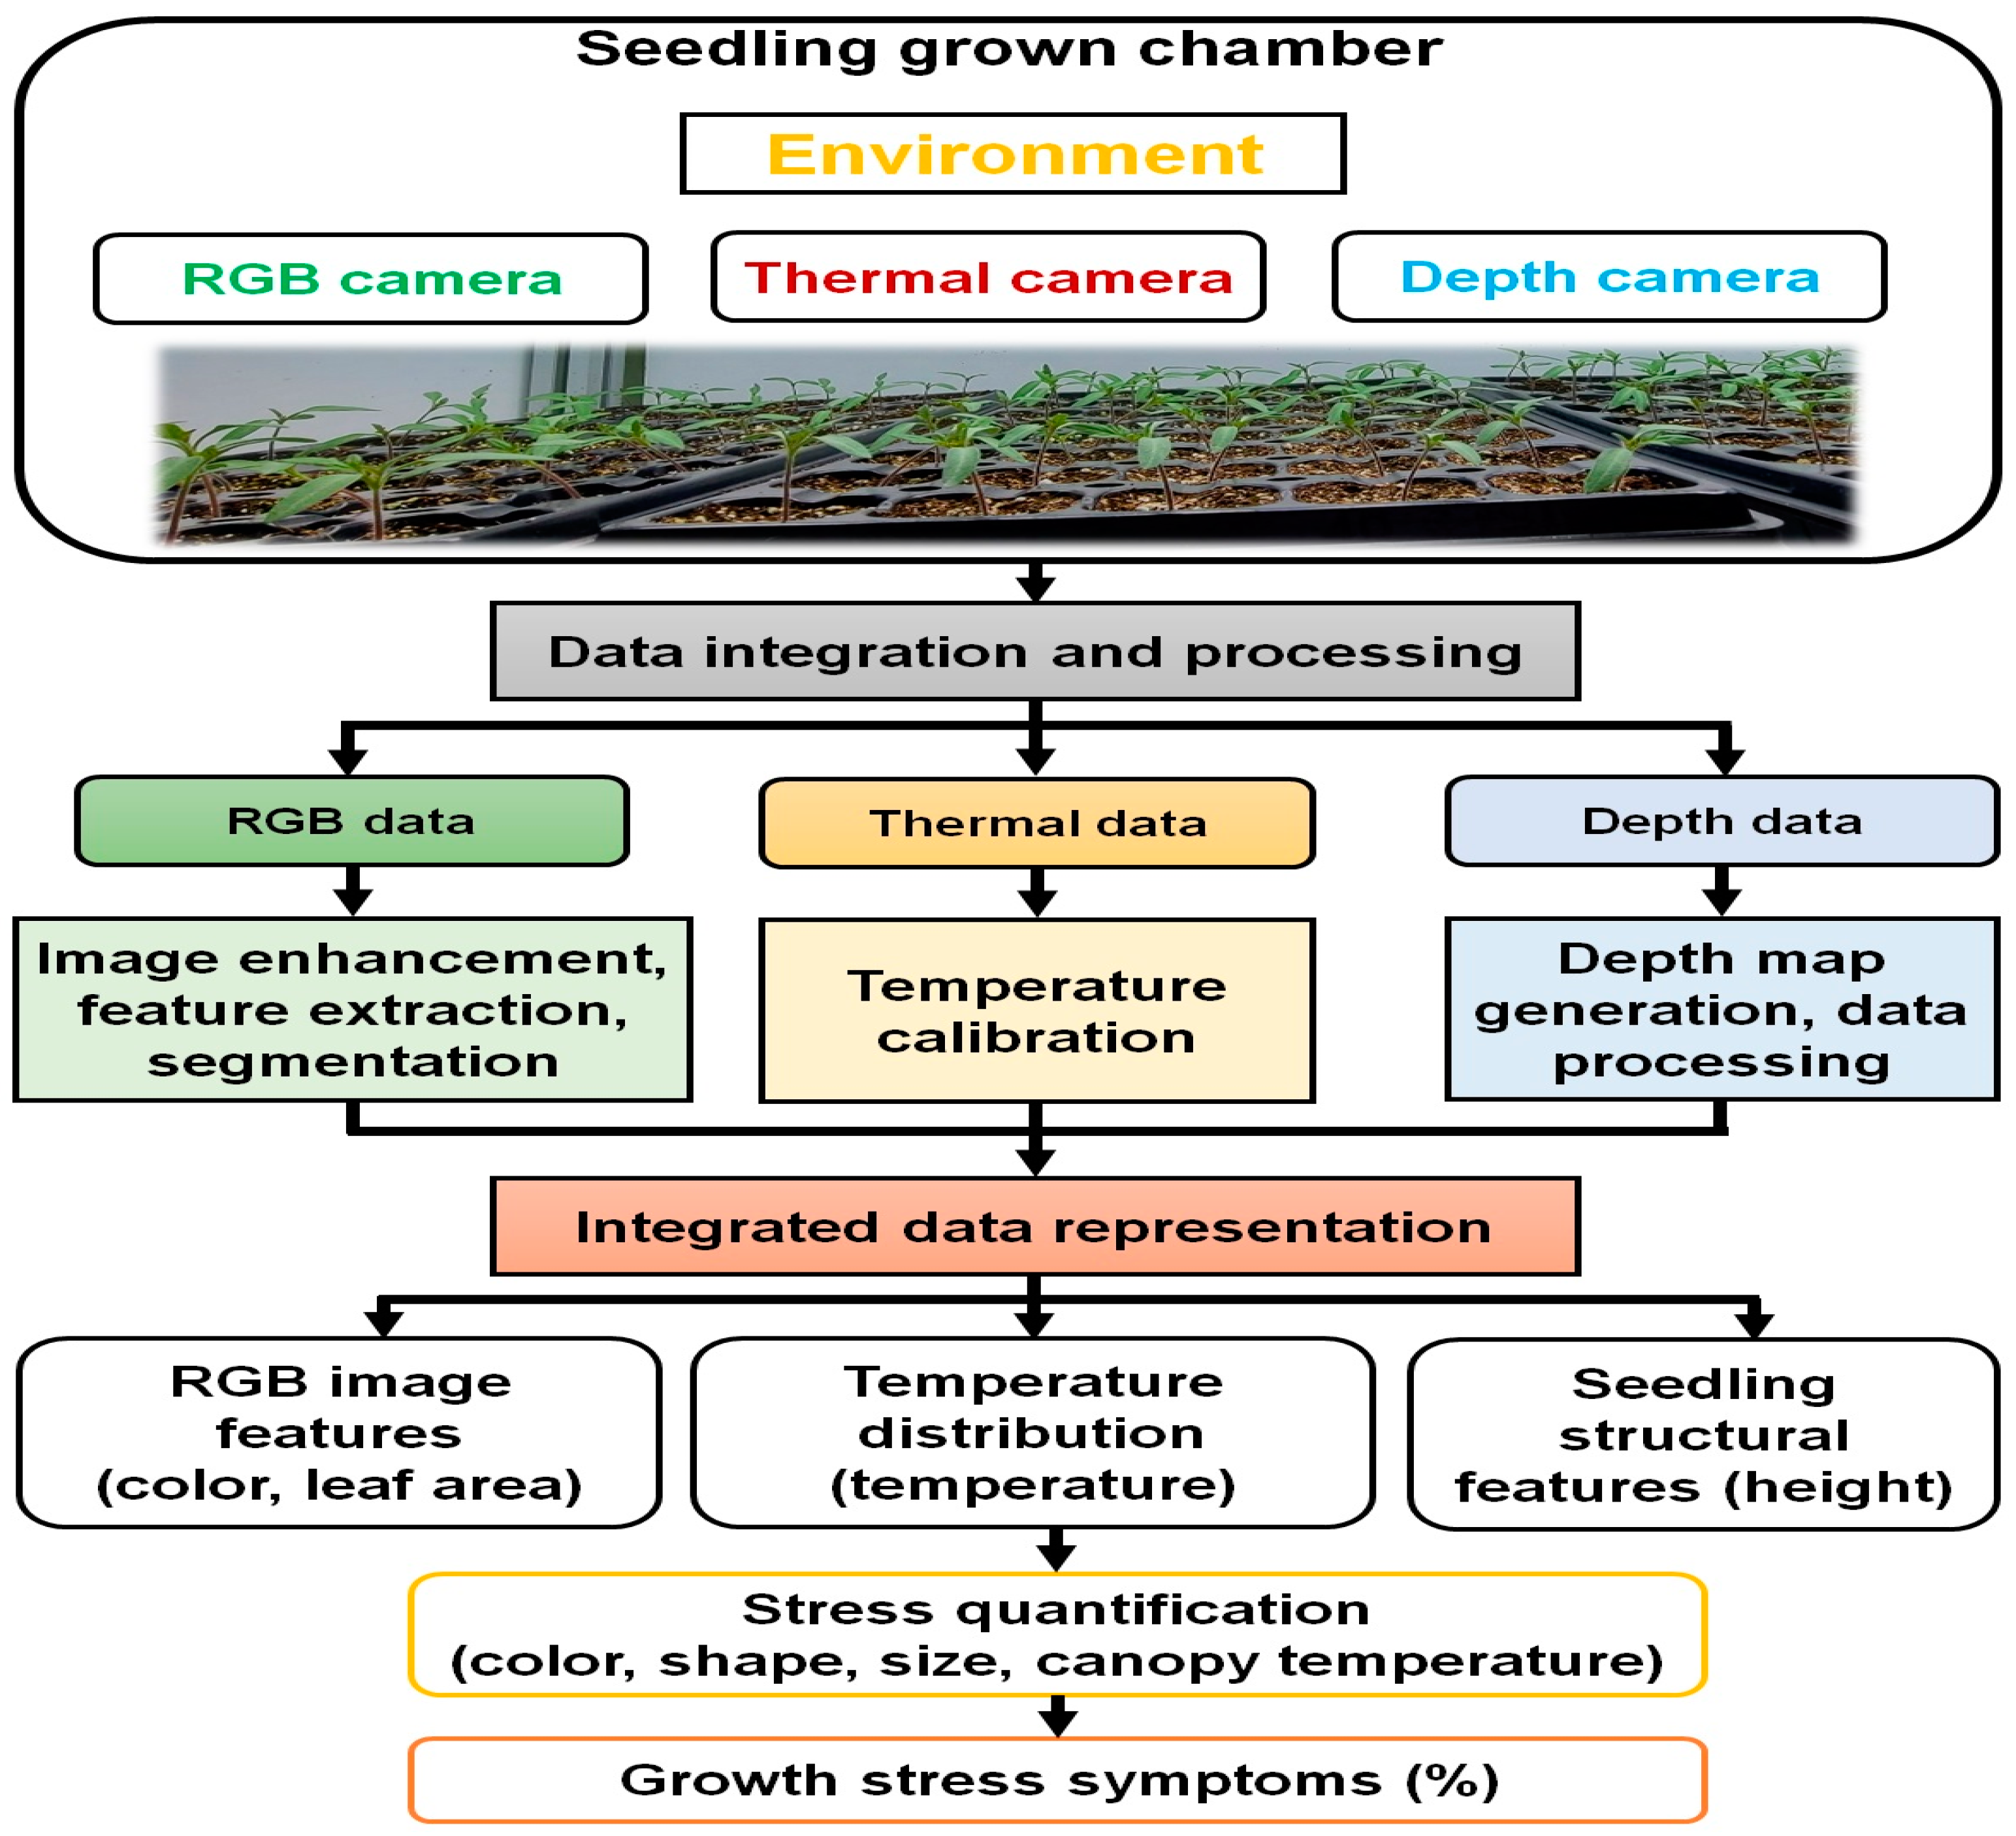
2.2. Sensor Selection and Image Acquisition
2.3. Data Processing and Analytical Procedures
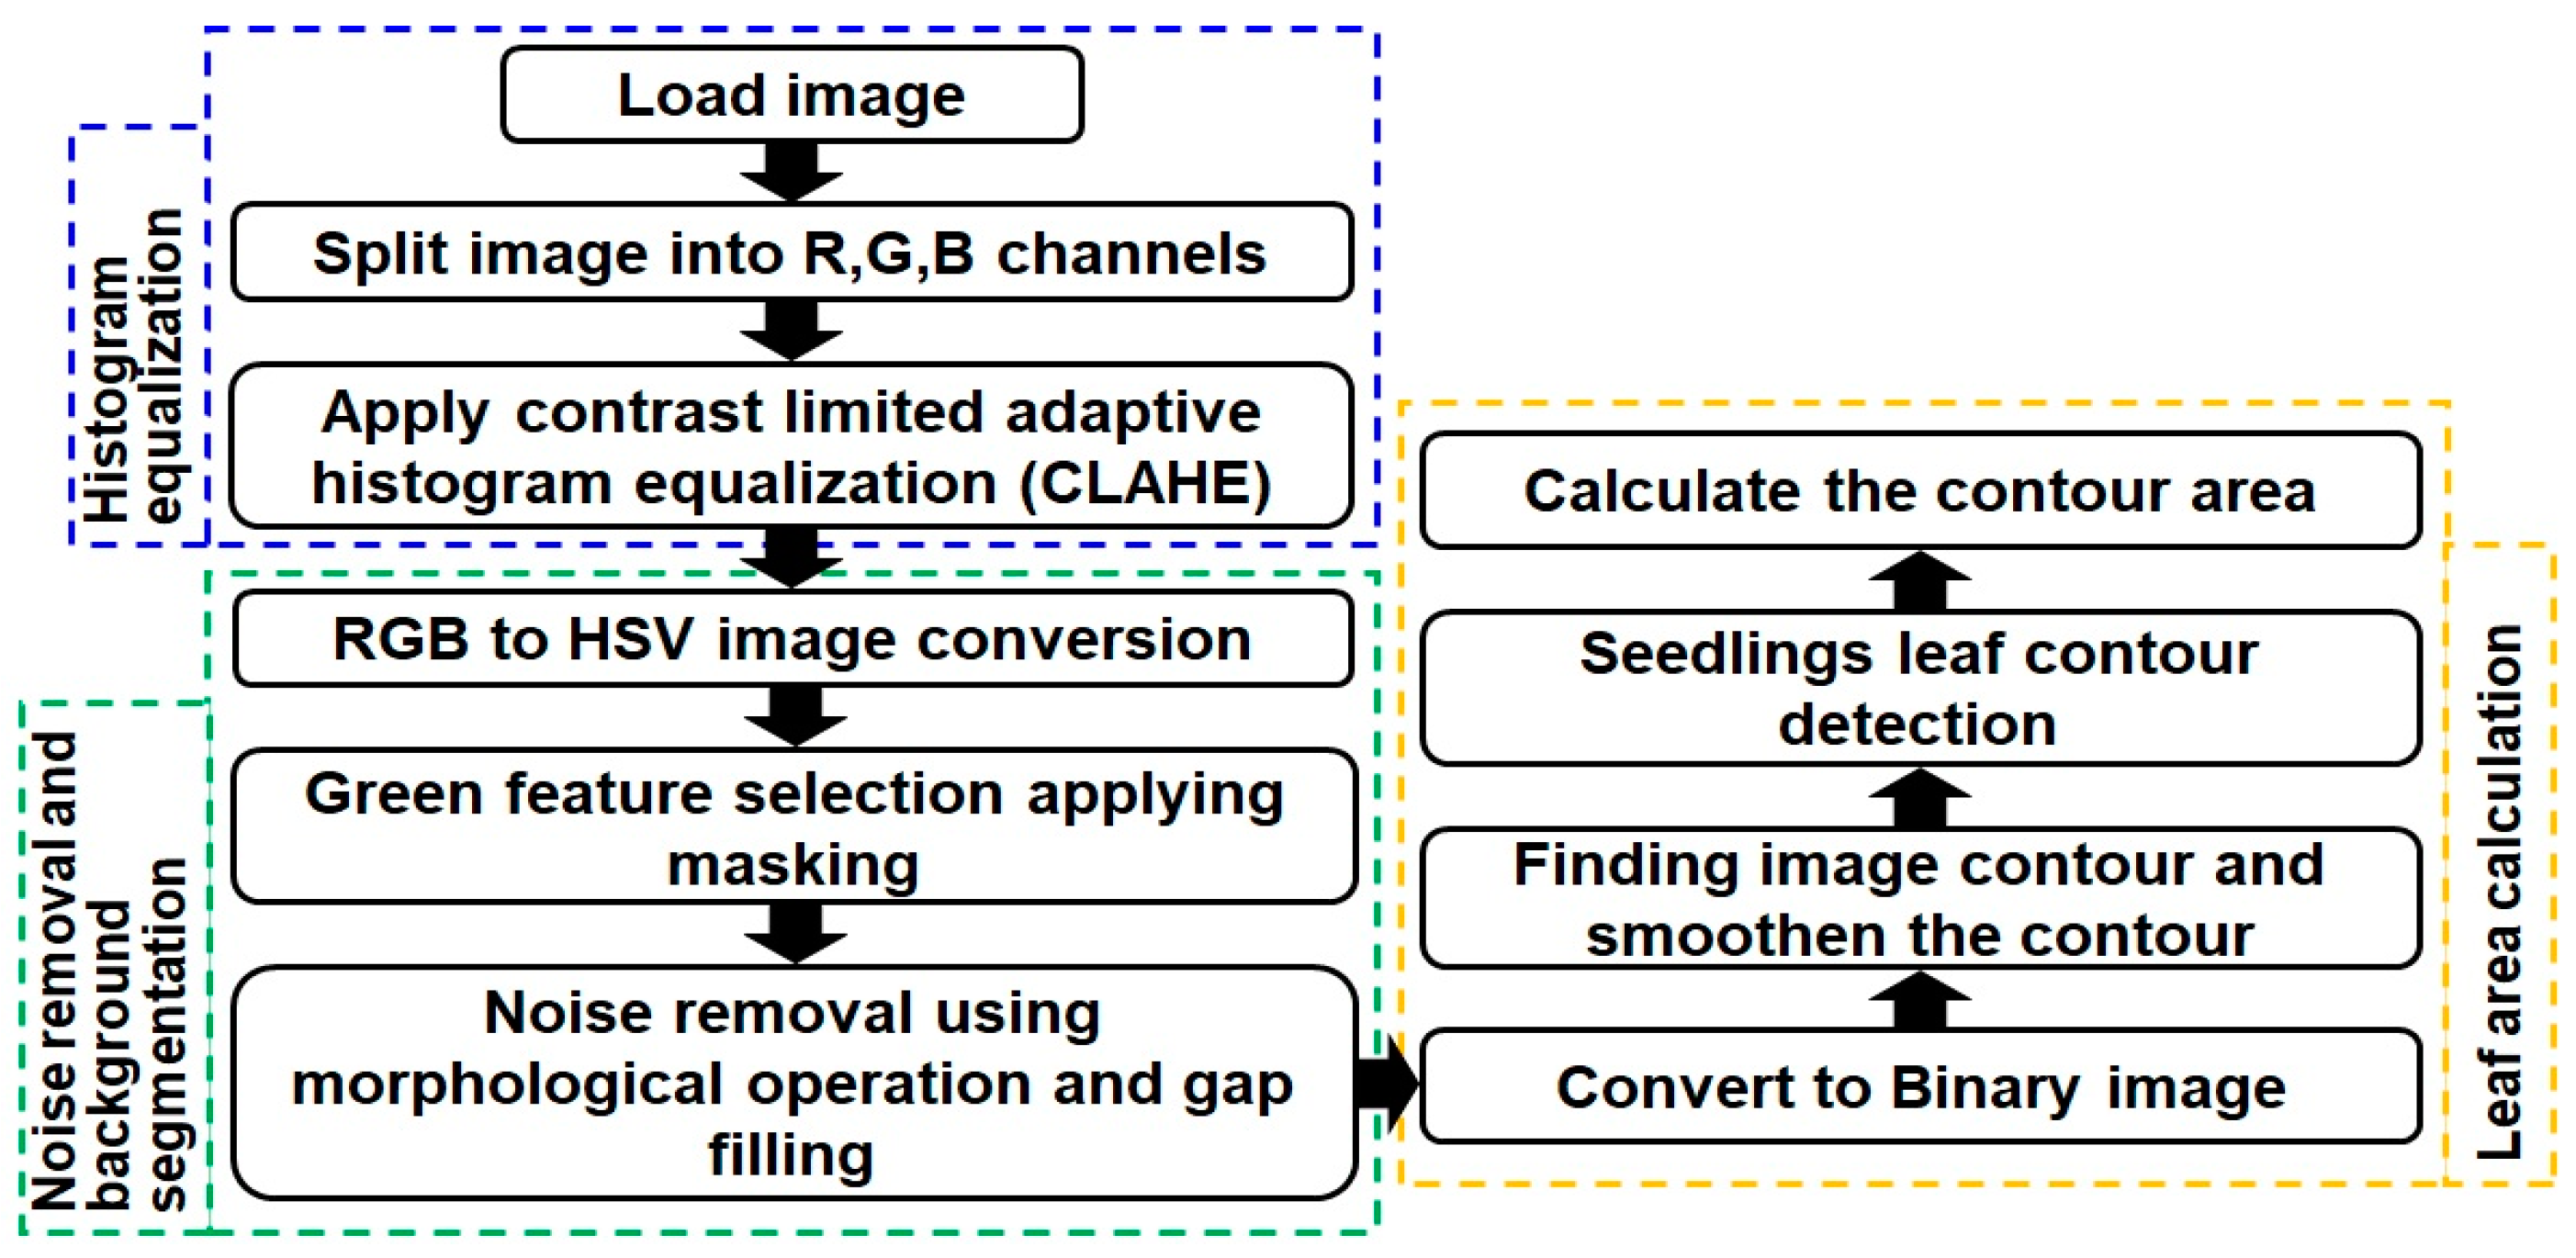
2.3.1. RGB Image Processing for Stress Symptom Features
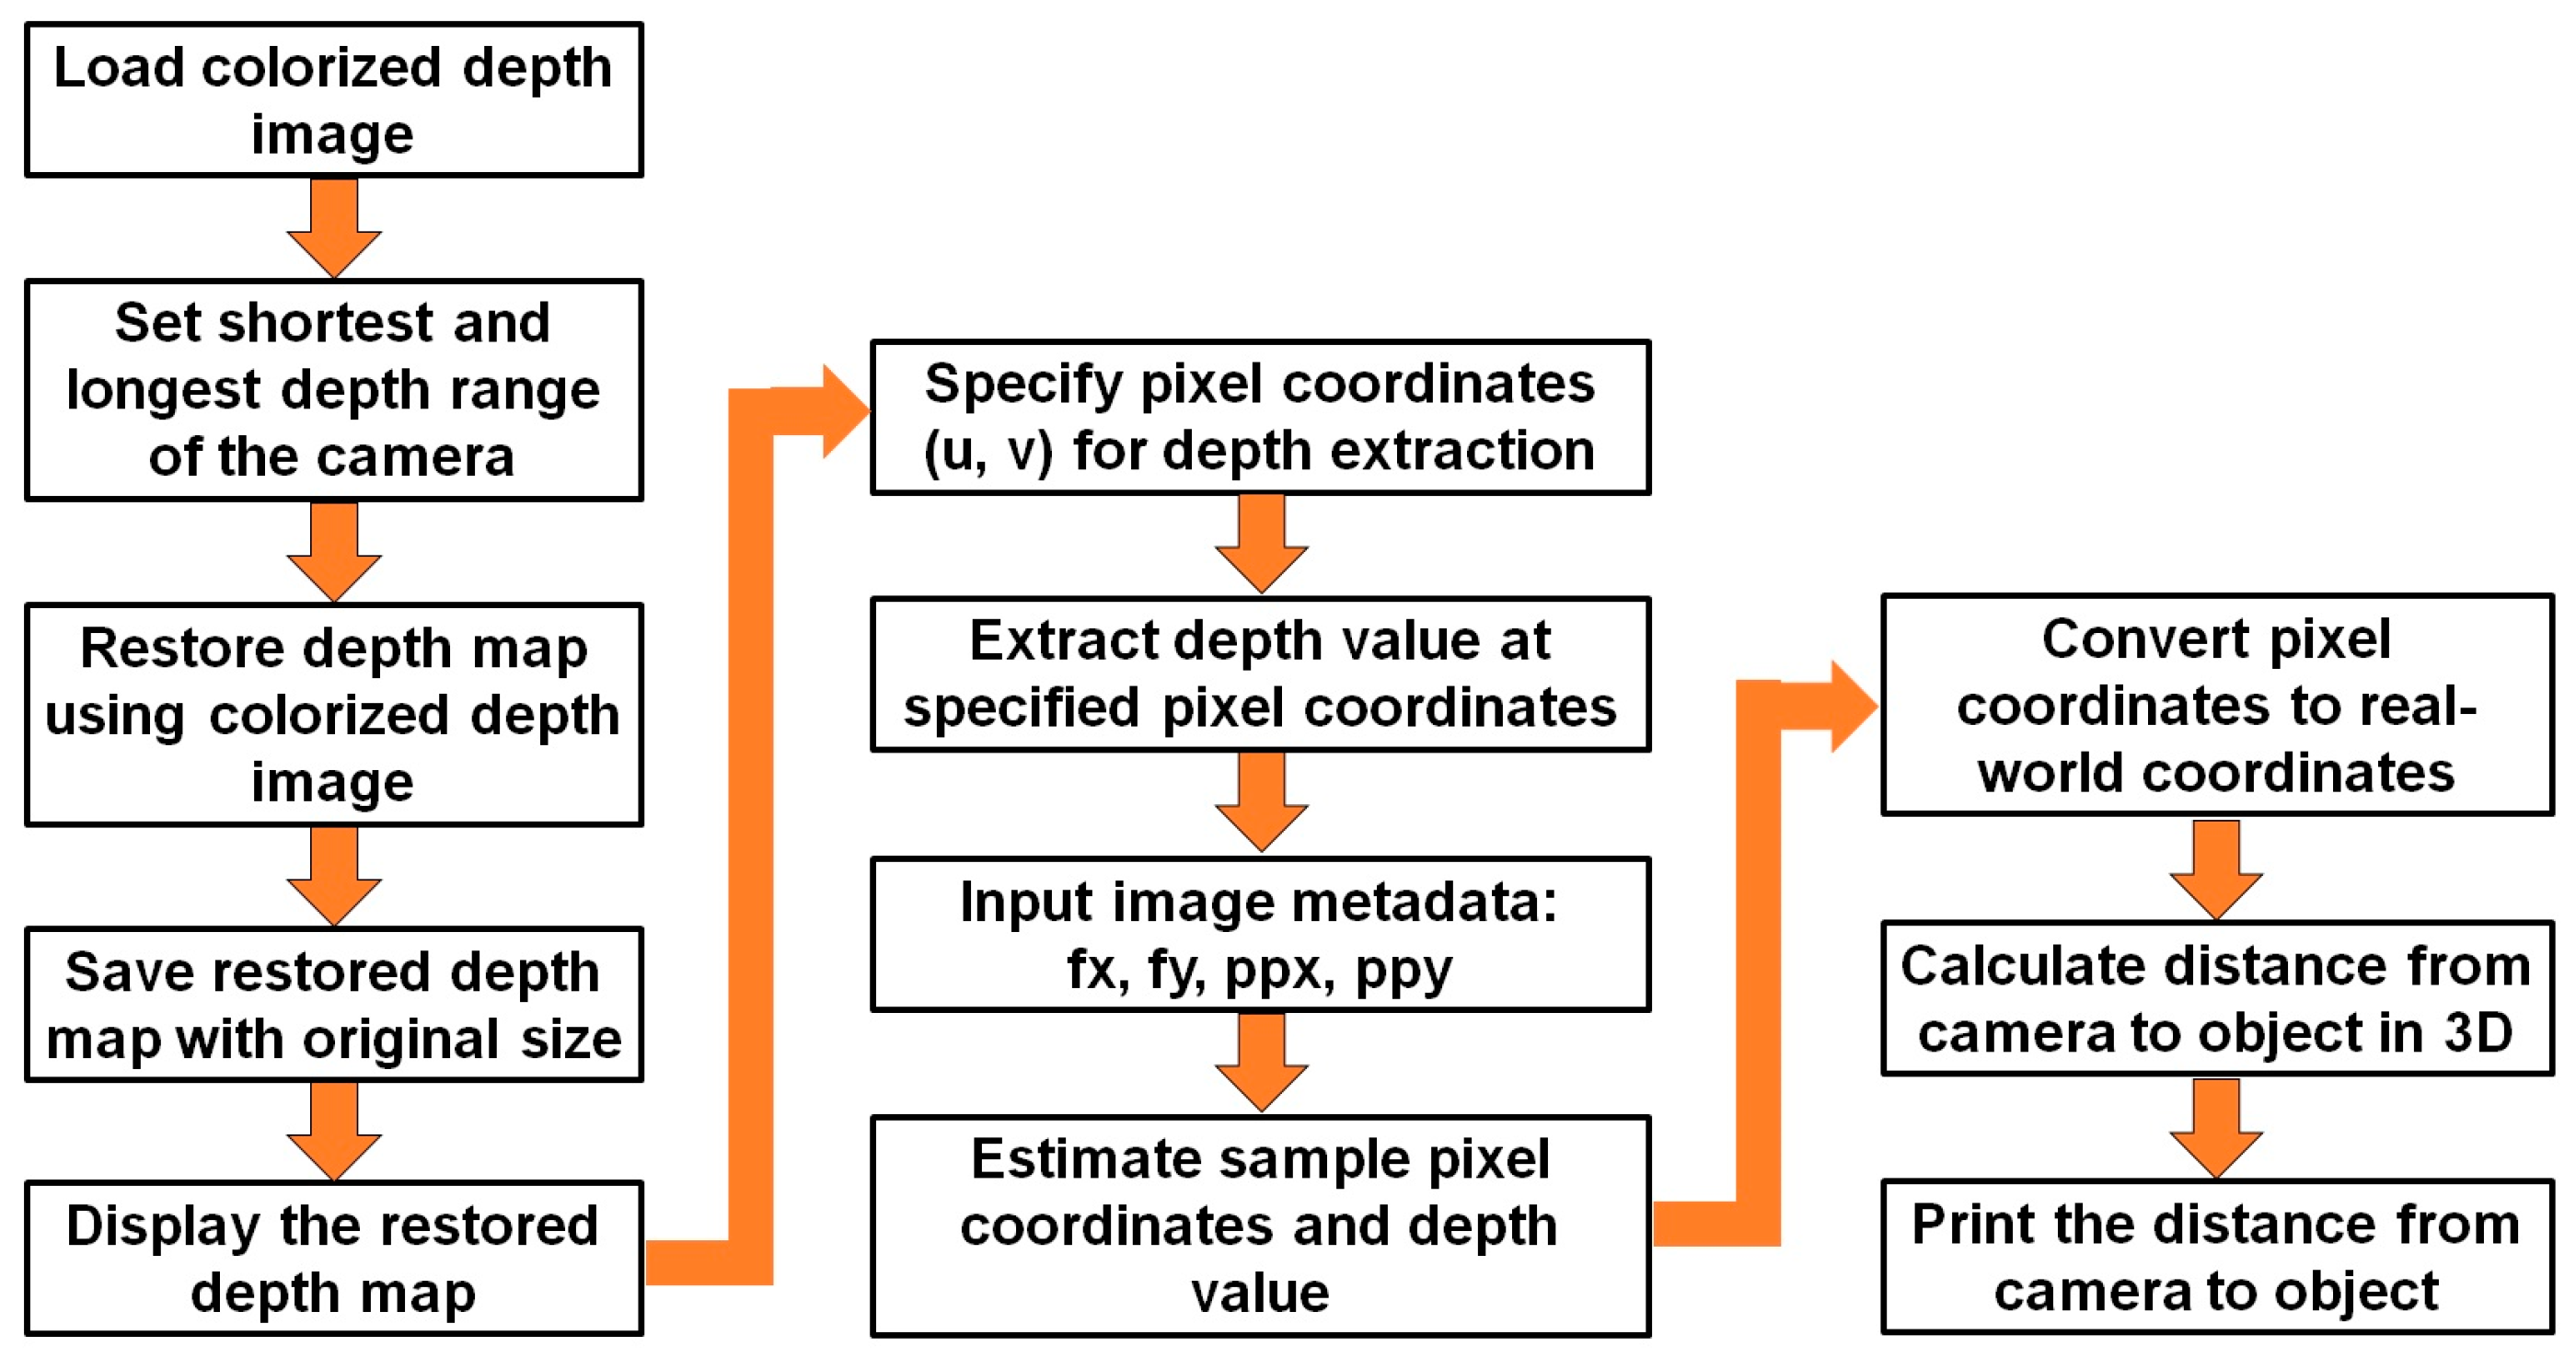
2.3.2. Depth Image Processing for Stress Symptom Features
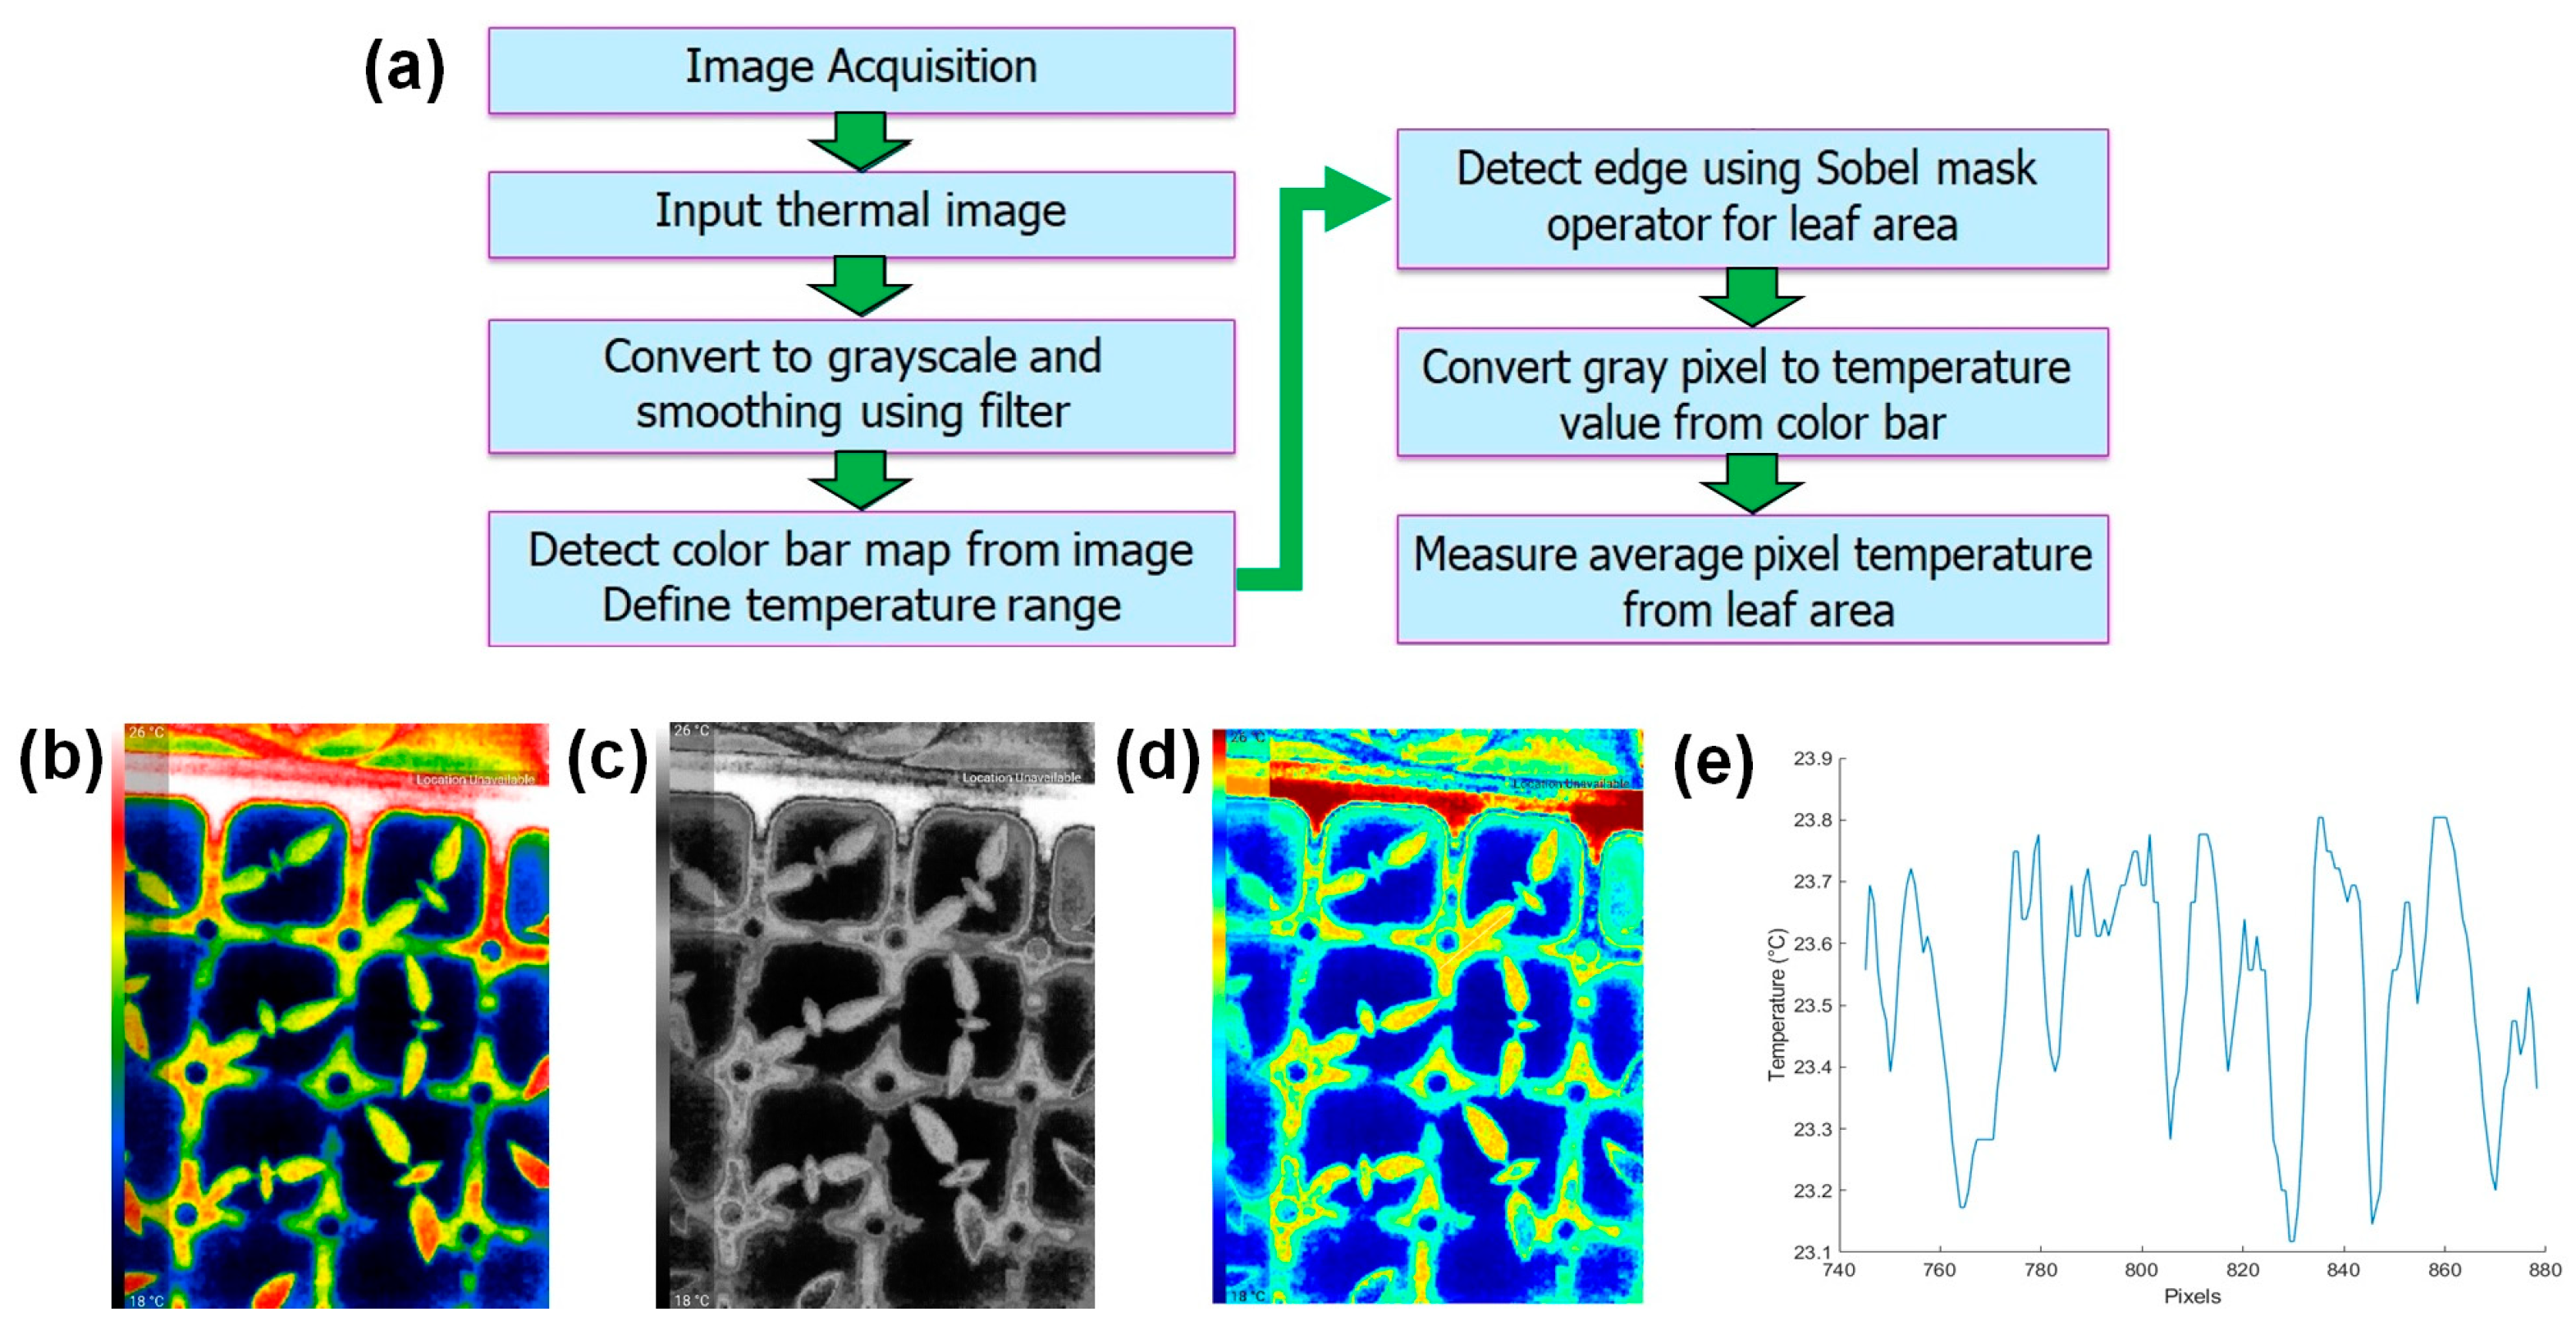
2.3.3. Canopy Temperature Measurement
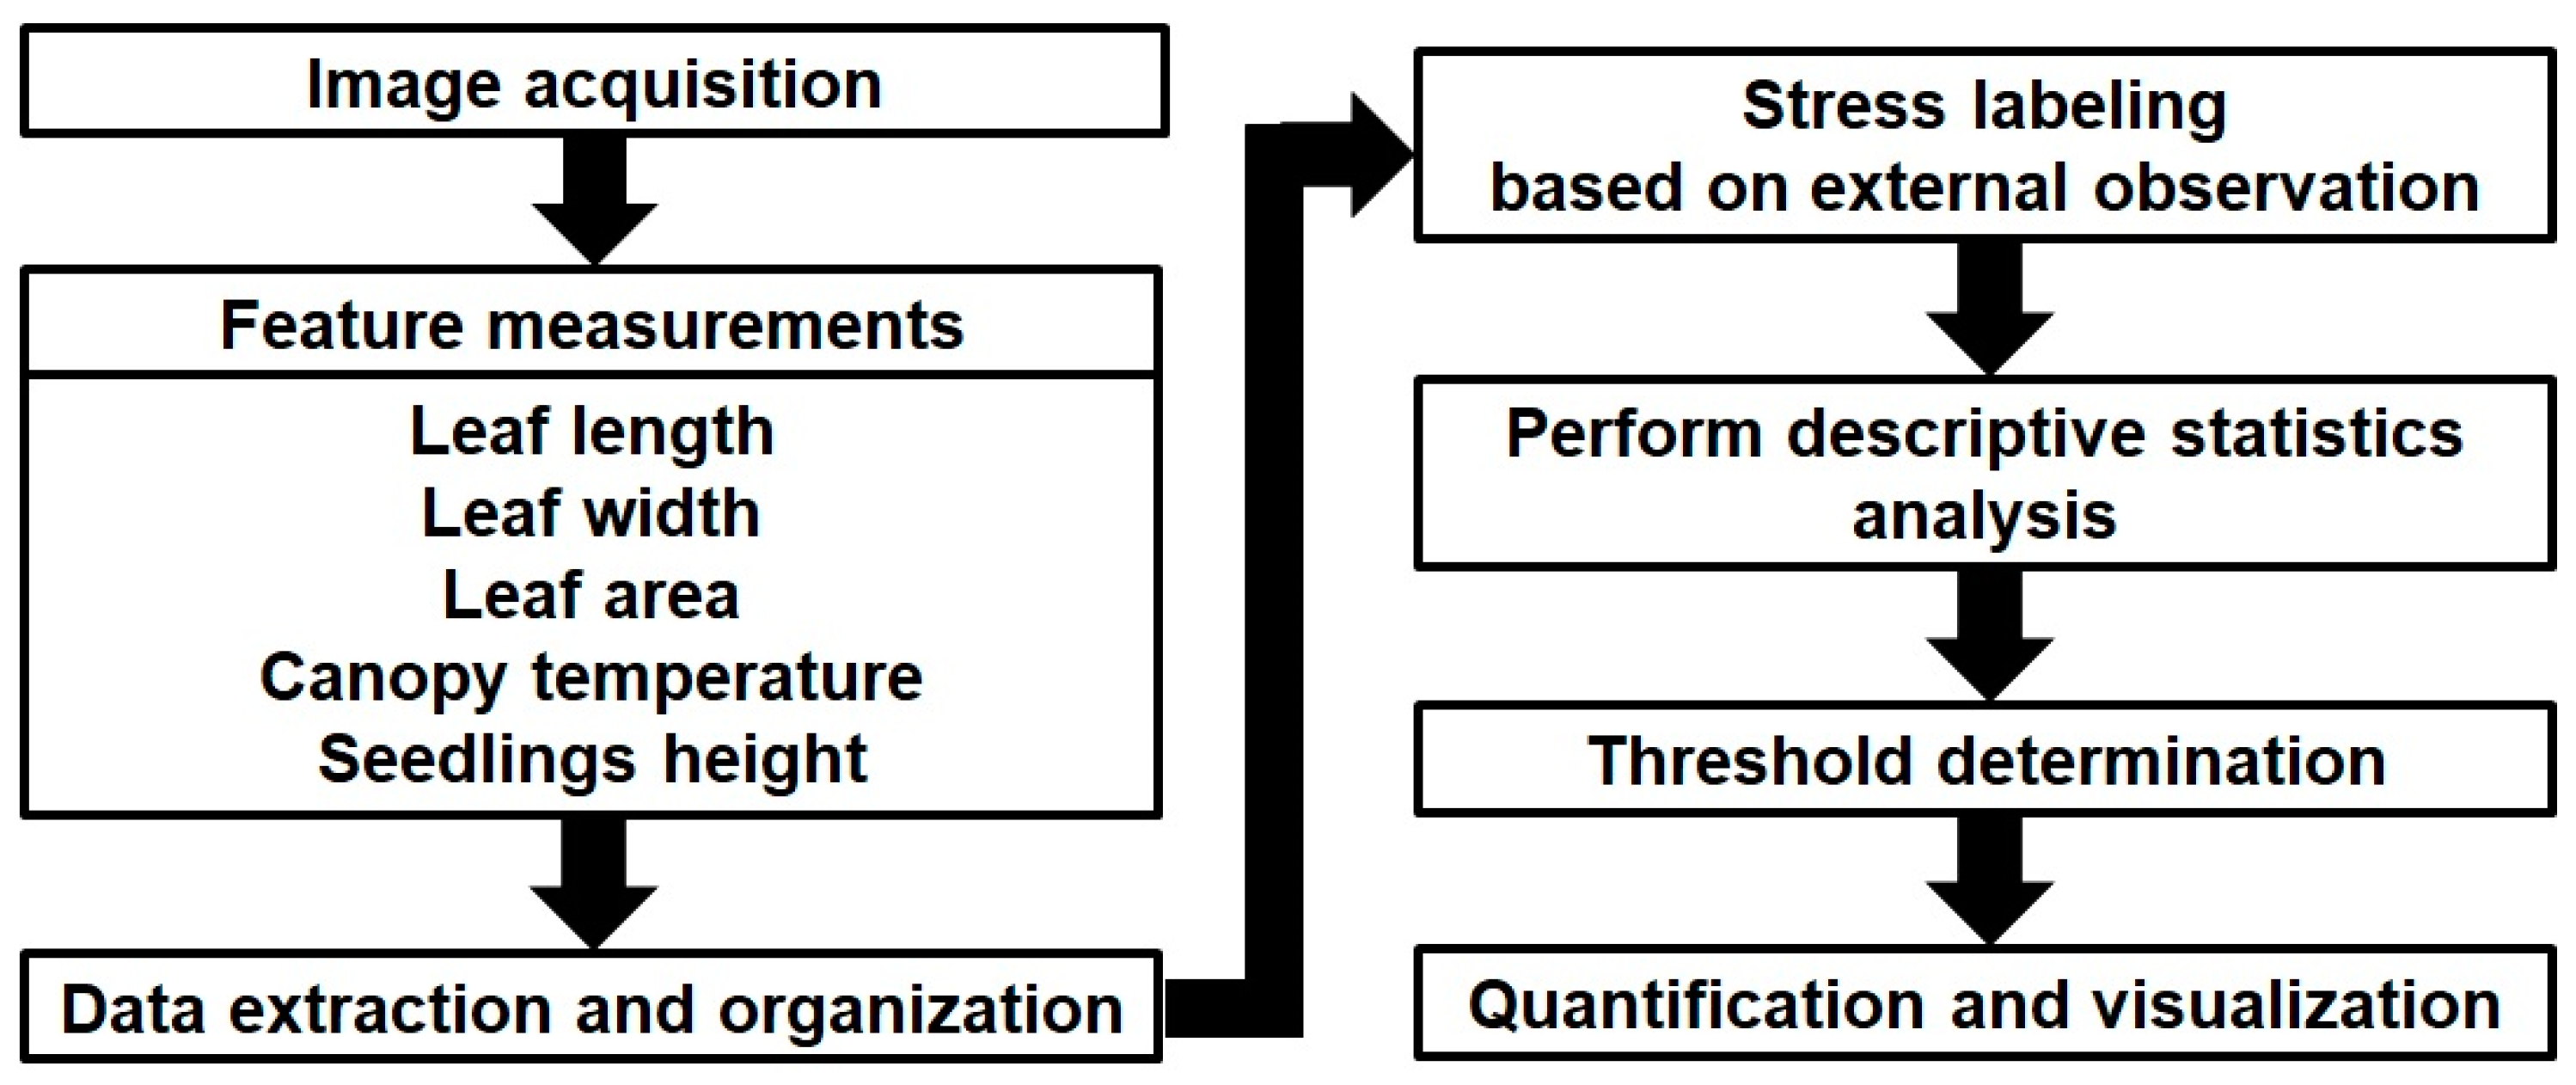
2.4. Quantification of Stress Symptoms
3. Results
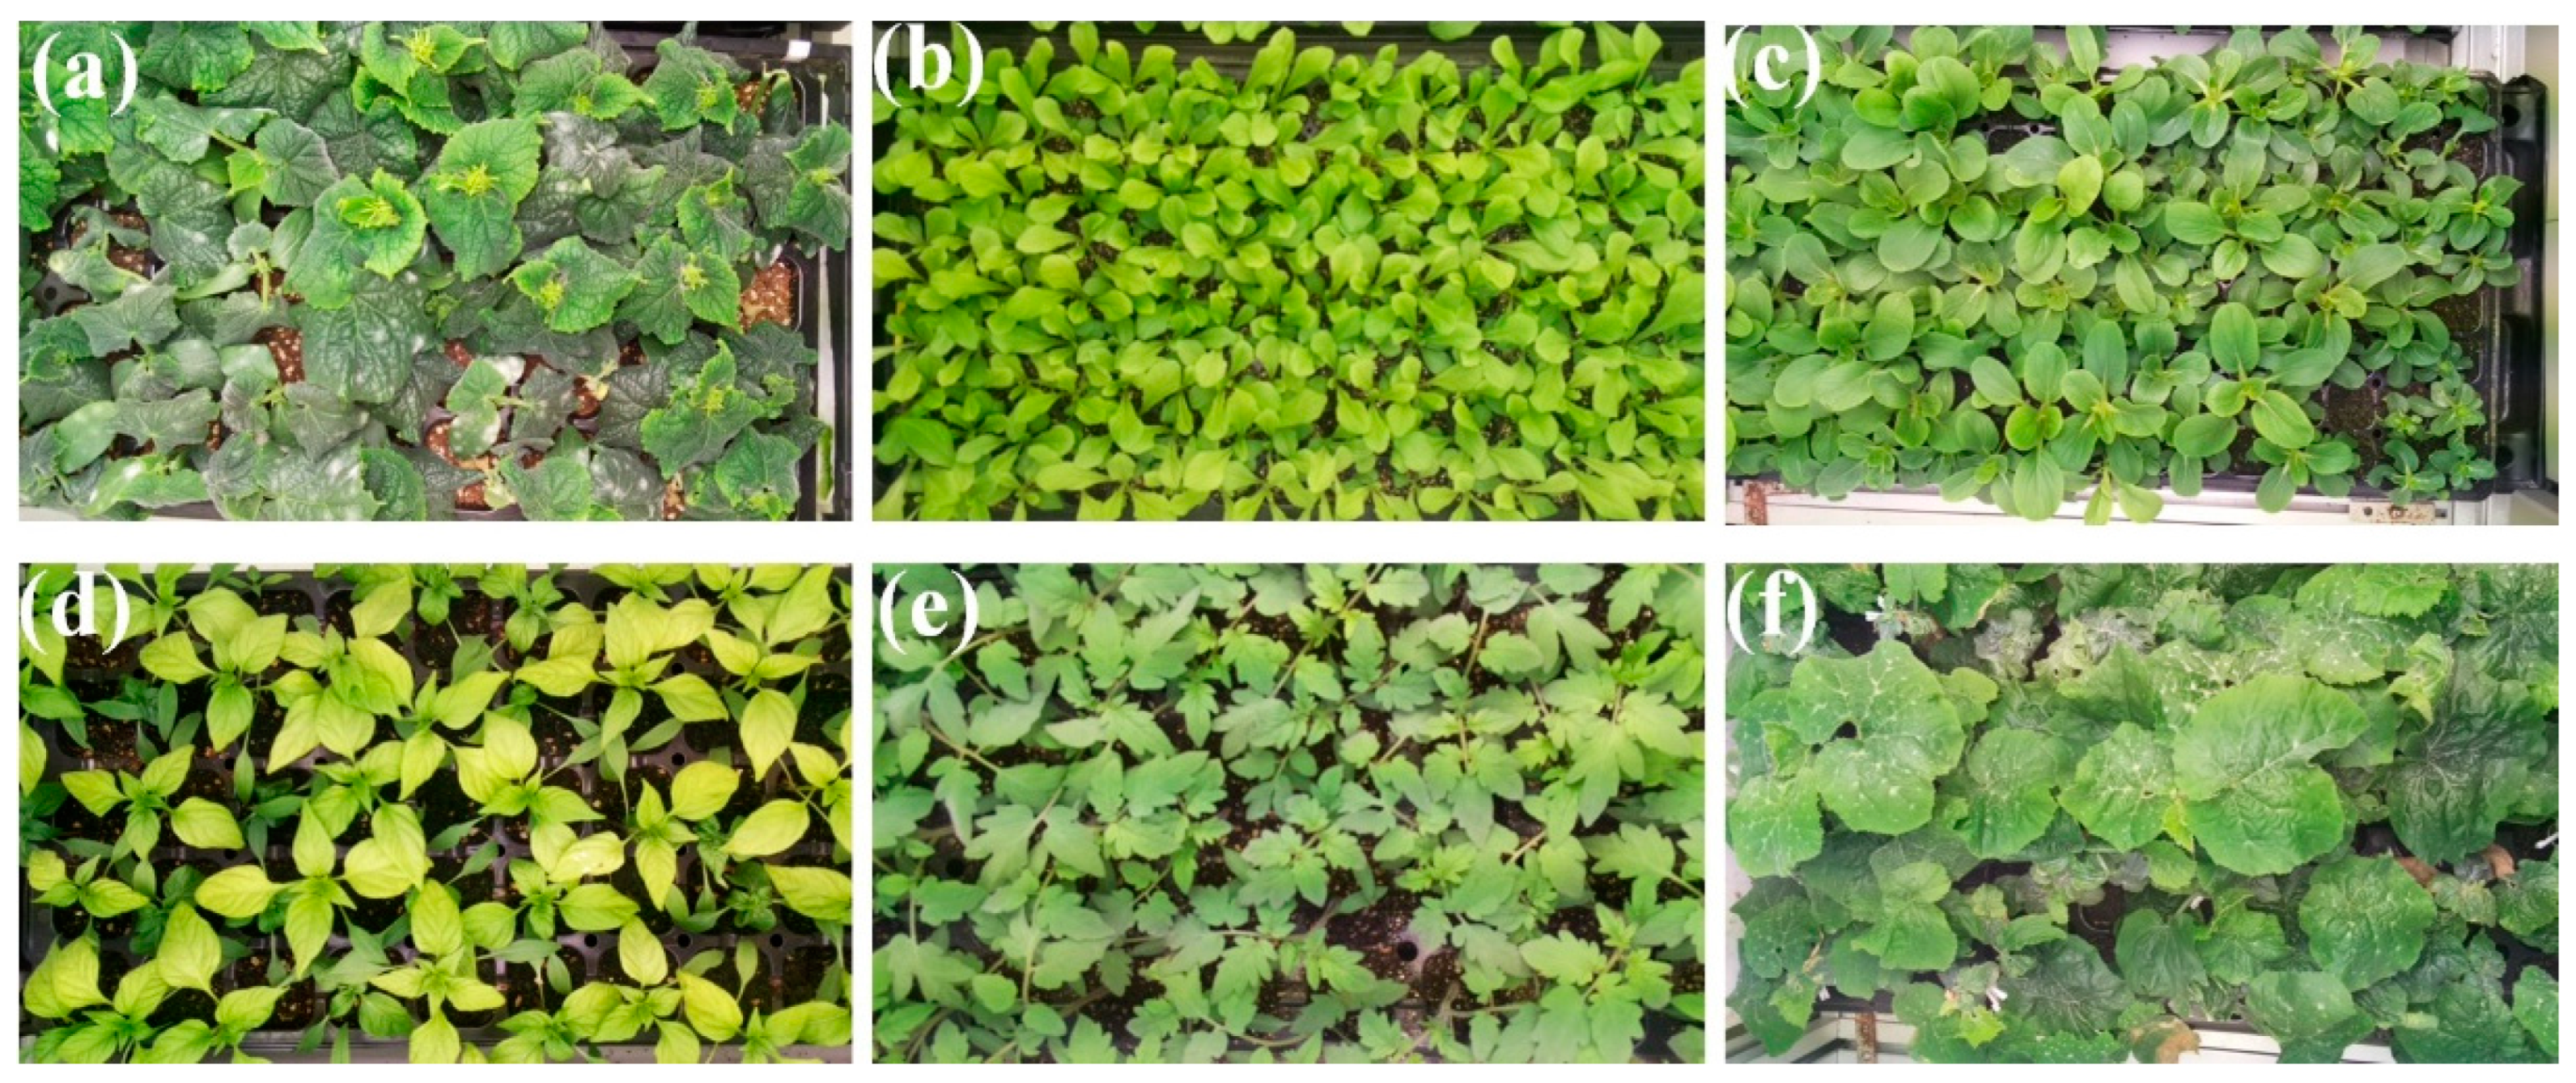
3.1. Stress Symptom Visualization Based on Seedling Color and Size
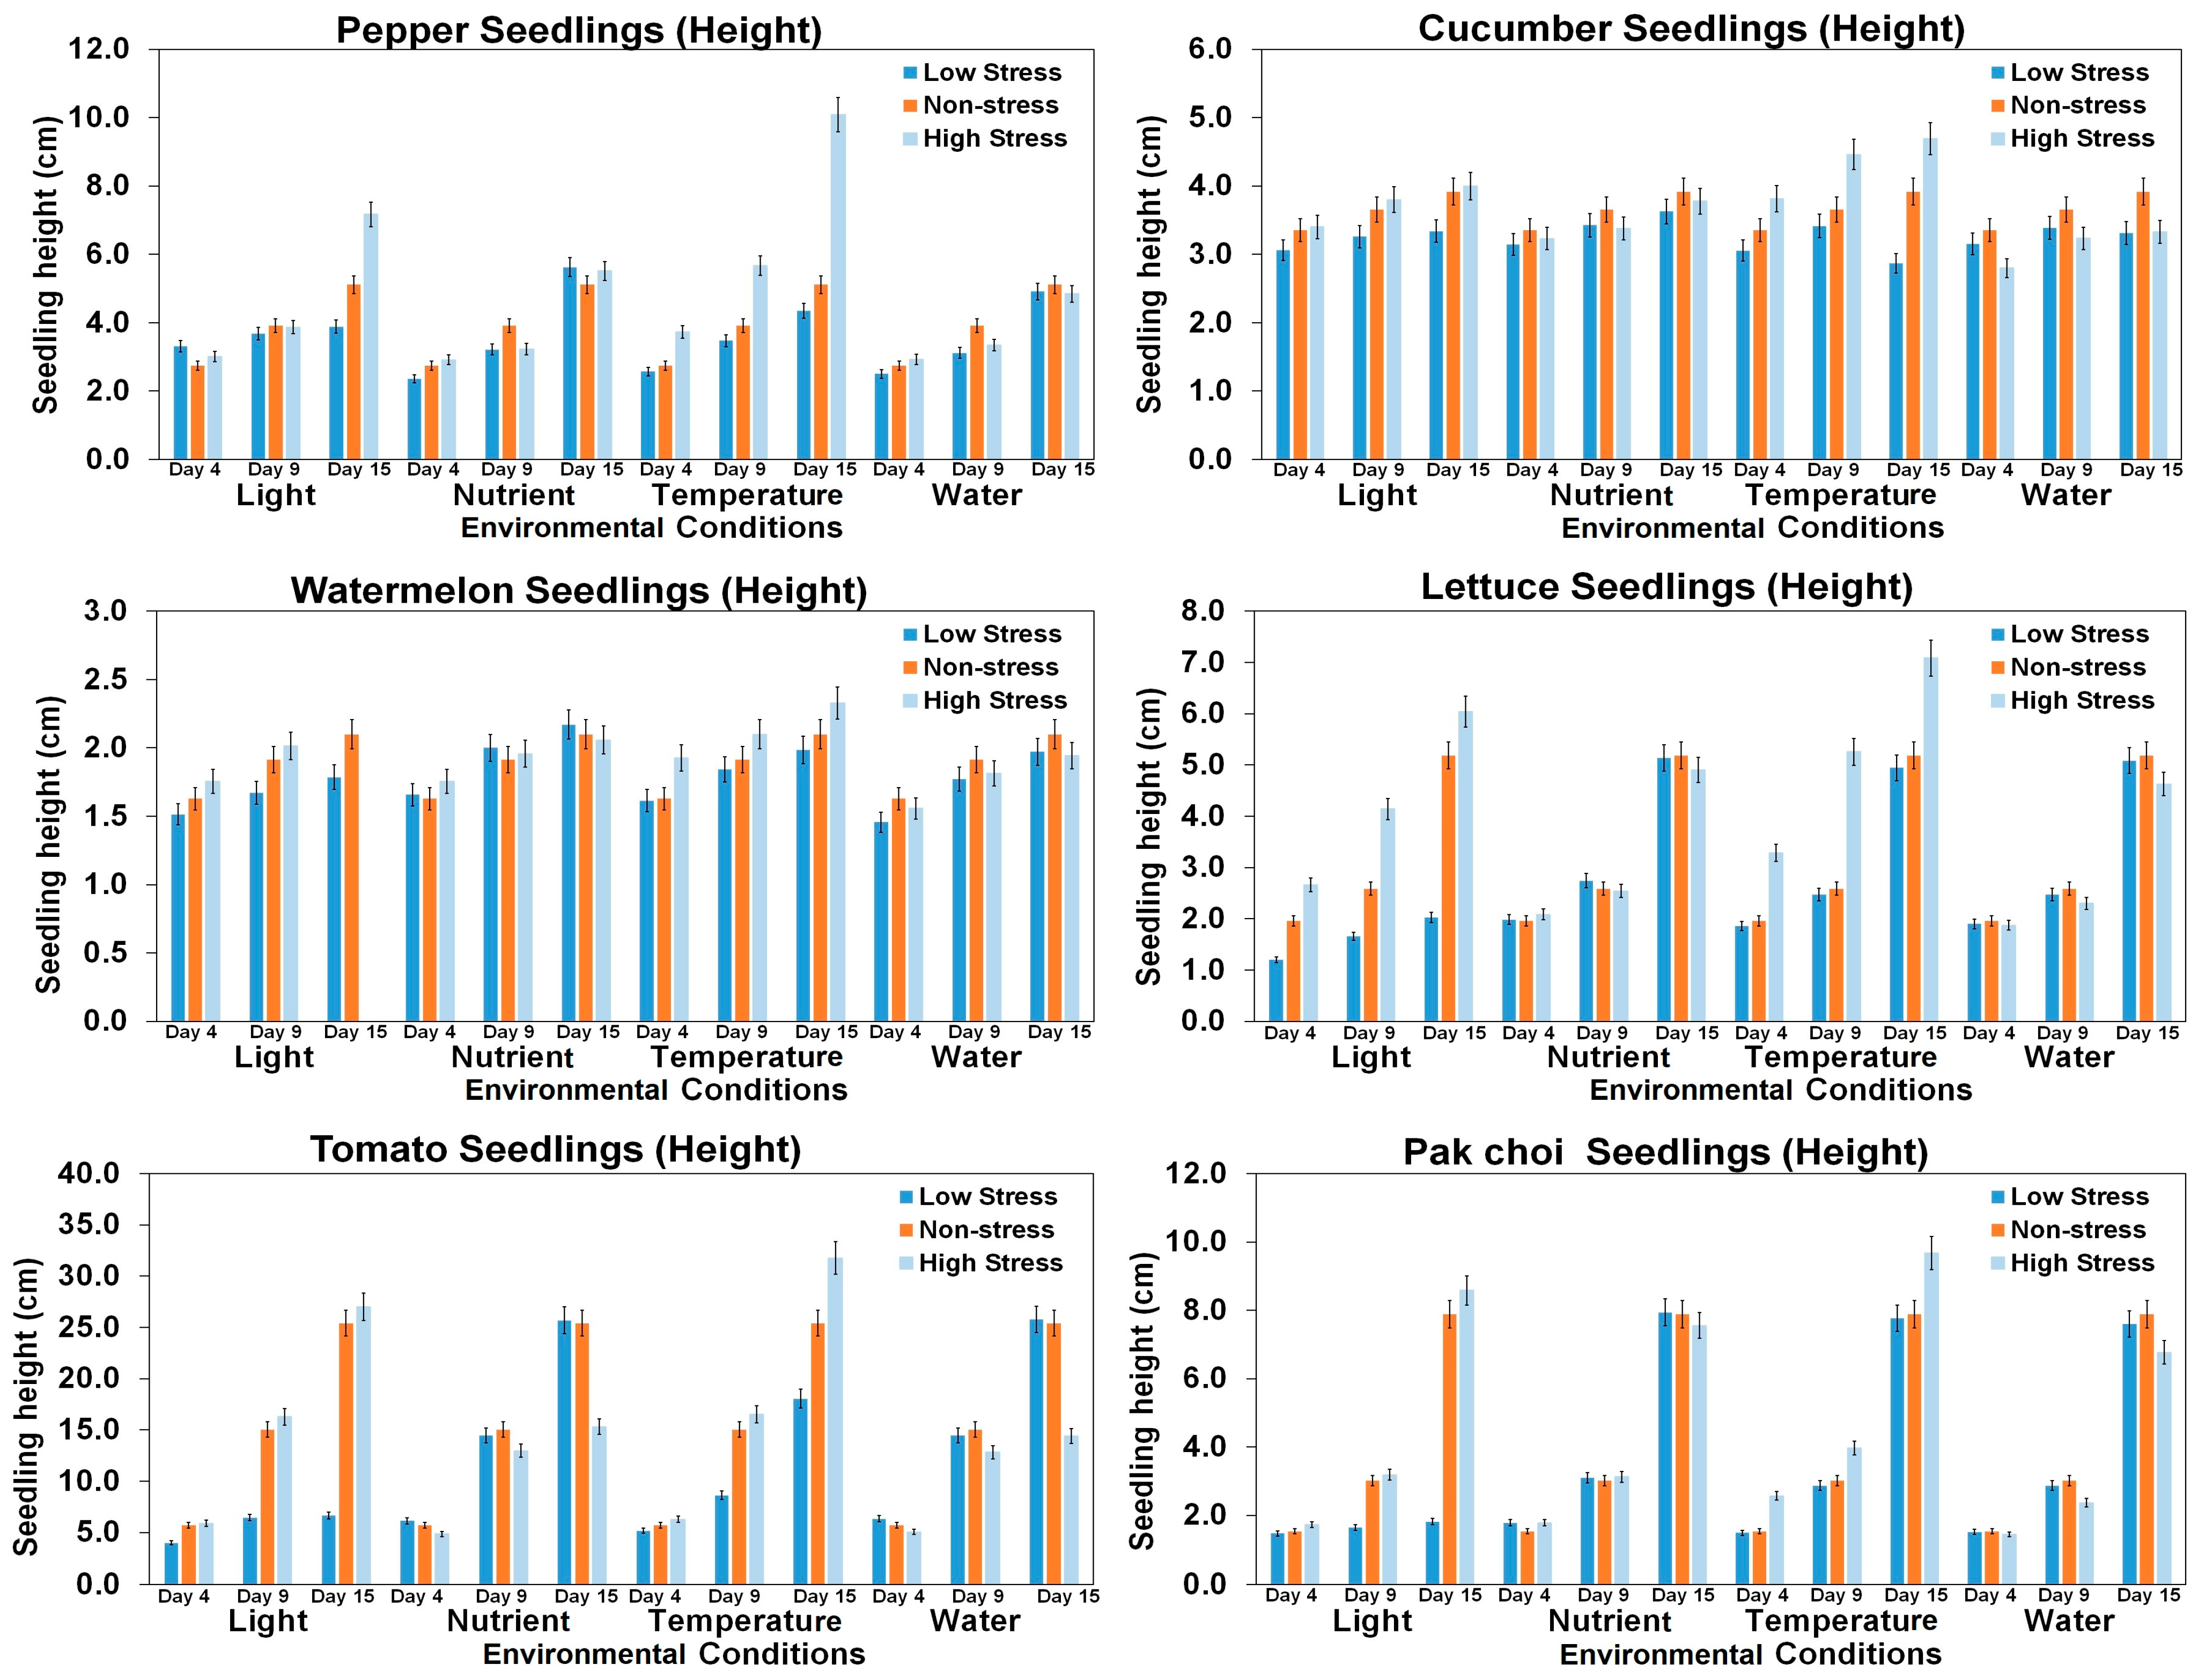
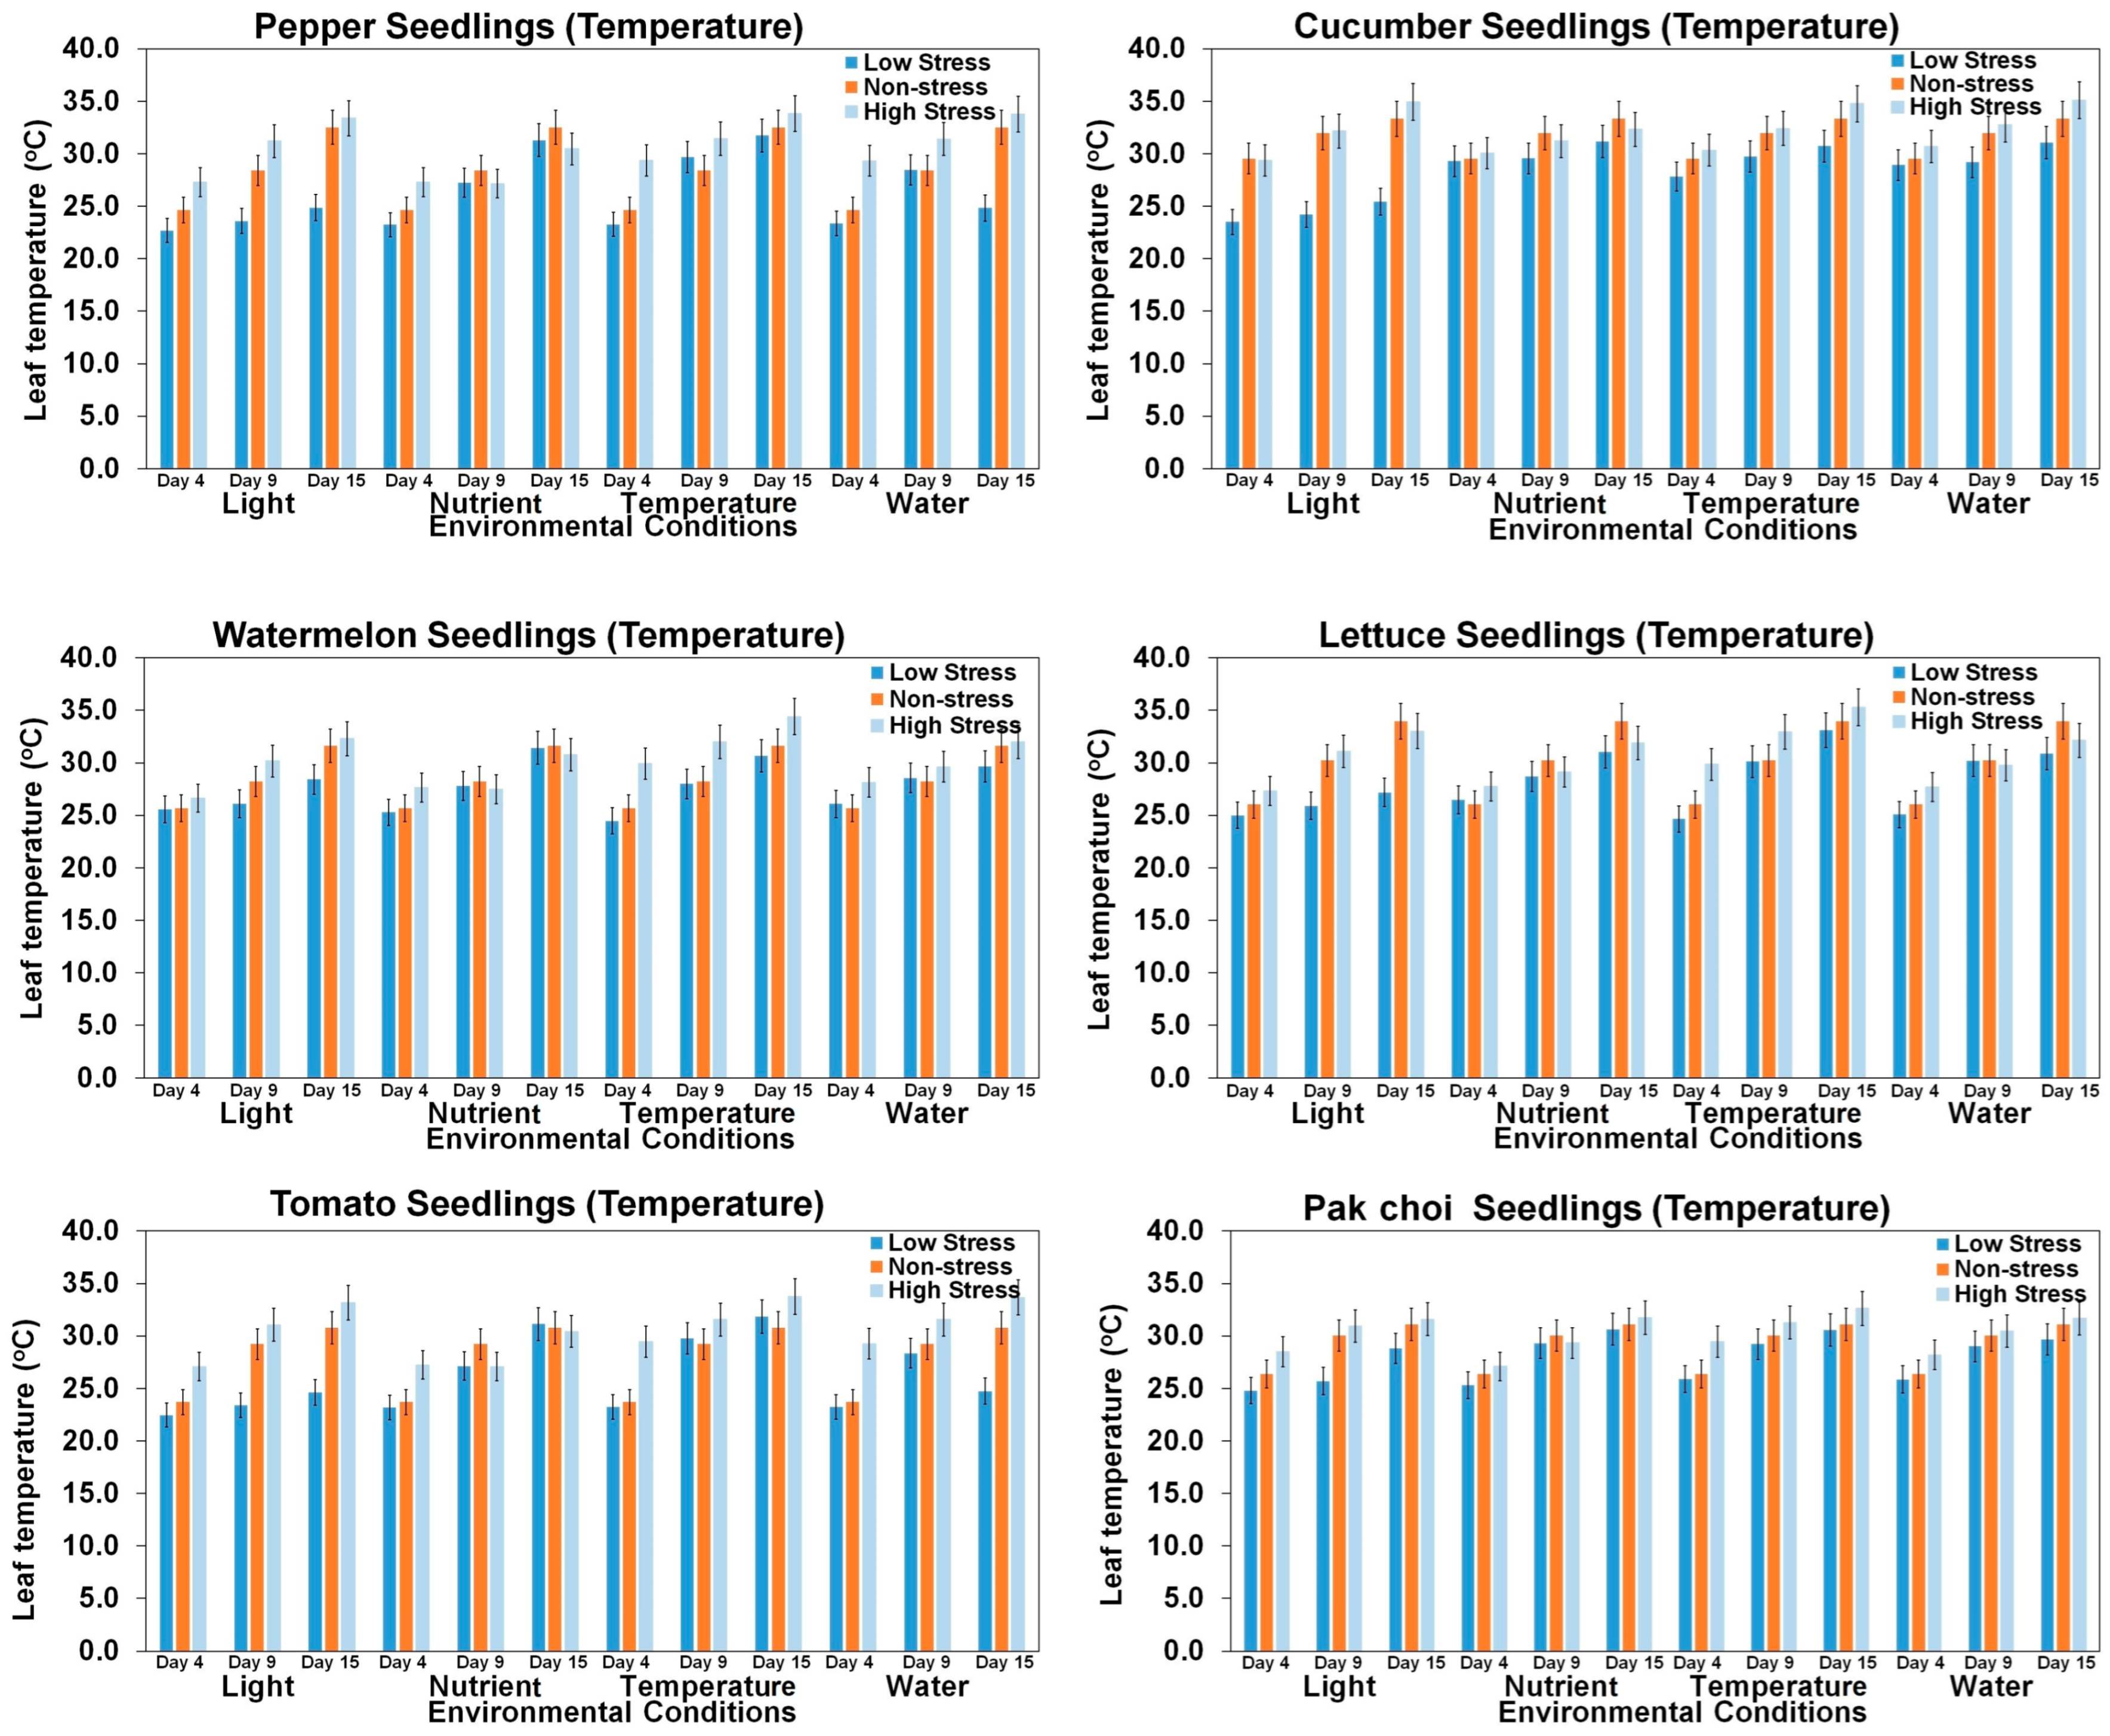
3.2. Growth Features Based on Environmental Conditions and Growth Period
3.3. Stress Quantification Based on Leaf Area Parameter
4. Discussion
5. Conclusions
Author Contributions
Funding
Data Availability Statement
Conflicts of Interest
Appendix A

| Pepper seedling | |||||||||
| Days | 4th | 9th | 15th | 4th | 9th | 15th | 4th | 9th | 15th |
| Light | 50 | 50 | 50 | 250 | 250 | 250 | 450 | 450 | 450 |
| Max | 963.1 | 1477.0 | 2901.8 | 1003.3 | 4467.9 | 7488.1 | 1873.4 | 4702.0 | 8322.5 |
| Min | 602.2 | 861.2 | 1678.2 | 822.4 | 3082.7 | 5823.5 | 952.7 | 3182.8 | 6125.8 |
| Avg | 731.4 | 1048.5 | 2279.3 | 915.9 | 3607.6 | 6425.5 | 1226.6 | 3772.7 | 6997.3 |
| STD | 118.1 | 196.3 | 429.2 | 60.5 | 448.6 | 539.7 | 301.9 | 446.7 | 756.0 |
| Nutrient | 3 | 3 | 3 | 1 | 1 | 1 | 6 | 6 | 6 |
| Max | 1083.2 | 2464.6 | 5539.8 | 1003.3 | 4467.9 | 7488.1 | 966.8 | 2633.1 | 6208.7 |
| Min | 617.6 | 1148.7 | 4463.3 | 822.4 | 3082.7 | 5823.5 | 676.4 | 1843.8 | 3993.5 |
| Avg | 846.5 | 1651.6 | 4859.1 | 915.9 | 3607.6 | 6425.5 | 770.6 | 2230.5 | 5242.5 |
| STD | 145.3 | 397.9 | 403.9 | 60.5 | 448.6 | 539.7 | 96.1 | 276.4 | 668.7 |
| Temp. | 20 | 20 | 20 | 25 | 25 | 25 | 30 | 30 | 30 |
| Max | 843.0 | 1970.9 | 4033.0 | 1003.3 | 4467.9 | 7488.1 | 1470.0 | 4888.0 | 12,138.0 |
| Min | 615.5 | 1486.6 | 2498.4 | 822.4 | 3082.7 | 5823.5 | 877.0 | 3009.0 | 7254.0 |
| Avg | 732.1 | 1811.5 | 3340.3 | 915.9 | 3607.6 | 6425.5 | 1183.6 | 3919.7 | 9512.7 |
| STD | 84.5 | 173.4 | 439.4 | 60.5 | 448.6 | 539.7 | 172.3 | 620.2 | 1701.2 |
| Water | high | high | high | normal | normal | normal | low | low | low |
| Max | 1075.7 | 2050.3 | 5478.3 | 1003.3 | 4467.9 | 7488.1 | 946.9 | 2259.9 | 5081.2 |
| Min | 689.3 | 1665.9 | 4298.7 | 822.4 | 3082.7 | 5823.5 | 609.2 | 1512.2 | 3546.9 |
| Avg | 868.7 | 1855.3 | 5042.2 | 915.9 | 3607.6 | 6425.5 | 700.3 | 1906.3 | 4143.4 |
| STD | 118.5 | 127.4 | 384.3 | 60.5 | 448.6 | 539.7 | 104.9 | 268.6 | 464.0 |
| Cucumber seedling | |||||||||
| Days | 4th | 9th | 15th | 4th | 9th | 15th | 4th | 9th | 15th |
| Light | 50 | 50 | 50 | 250 | 250 | 250 | 450 | 450 | 450 |
| Max | 6905.9 | 12,921.8 | 12,362.5 | 6842.3 | 15,435.3 | 18,722.0 | 6842.3 | 13,469.5 | 16,853.2 |
| Min | 4322.2 | 2688.3 | 5618.2 | 4290.0 | 9263.5 | 9786.6 | 5236.6 | 10,456.4 | 11,854.9 |
| Avg | 5641.4 | 7560.8 | 7999.5 | 5609.6 | 11,944.6 | 14,173.0 | 5953.2 | 12,115.3 | 14,447.9 |
| STD | 794.9 | 4011.0 | 2148.5 | 790.6 | 1936.1 | 2736.8 | 627.2 | 1020.8 | 1610.4 |
| Nutrient | 3 | 3 | 3 | 1 | 1 | 1 | 6 | 6 | 6 |
| Max | 6342.1 | 14,935.1 | 16,874.5 | 6842.3 | 15,435.3 | 18,722.0 | 6539.4 | 15,133.4 | 18,427.9 |
| Min | 4736.4 | 9452.3 | 9286.4 | 4290.0 | 9263.5 | 9786.6 | 5163.5 | 8960.6 | 11,362.5 |
| Avg | 5407.4 | 11,542.8 | 13,387.9 | 5609.6 | 11,944.6 | 14,173.0 | 5737.0 | 11,760.5 | 14,129.3 |
| STD | 697.7 | 1810.8 | 2466.1 | 790.6 | 1936.1 | 2736.8 | 494.9 | 1834.2 | 2374.8 |
| Temp. | 20 | 20 | 20 | 25 | 25 | 25 | 30 | 30 | 30 |
| Max | 6325.6 | 12,962.3 | 16,727.8 | 6842.3 | 15,435.3 | 18,722.0 | 6312.2 | 15,194.7 | 18,847.8 |
| Min | 4569.3 | 6060.4 | 9613.7 | 4290.0 | 9263.5 | 9786.6 | 5095.1 | 10,951.0 | 12,615.3 |
| Avg | 5437.1 | 10,079.2 | 12,859.0 | 5609.6 | 11,944.6 | 14,173.0 | 5714.1 | 13,107.5 | 15,290.8 |
| STD | 540.3 | 2180.1 | 2657.1 | 790.6 | 1936.1 | 2736.8 | 385.6 | 1783.3 | 1720.0 |
| Water | high | high | high | normal | normal | normal | low | low | low |
| Max | 6442.9 | 13,648.3 | 18,341.6 | 6842.3 | 15,435.3 | 18,722.0 | 6041.6 | 12,162.8 | 12,779.0 |
| Min | 4836.2 | 9562.1 | 9785.6 | 4290.0 | 9263.5 | 9786.6 | 3896.3 | 8462.8 | 8986.9 |
| Avg | 5458.3 | 11,478.0 | 13,826.9 | 5609.6 | 11,944.6 | 14,173.0 | 4867.0 | 10,518.3 | 11,172.3 |
| STD | 583.2 | 1431.9 | 2663.0 | 790.6 | 1936.1 | 2736.8 | 701.3 | 1323.3 | 1157.3 |
| Tomato seedling | |||||||||
| Days | 4th | 9th | 15th | 4th | 9th | 15th | 4th | 9th | 15th |
| Light | 50 | 50 | 50 | 250 | 250 | 250 | 450 | 450 | 450 |
| Max | 1506.0 | 4062.0 | 9653.0 | 2980.0 | 10,057.0 | 29,595.0 | 7785.0 | 21,365.0 | 42,369.0 |
| Min | 733.0 | 2586.0 | 7062.0 | 1610.0 | 4969.0 | 25,147.0 | 5628.0 | 12,635.0 | 28,963.0 |
| Avg | 1035.0 | 3220.6 | 8445.6 | 2245.3 | 7701.6 | 28,183.4 | 6836.1 | 17,392.1 | 37,076.1 |
| STD | 245.2 | 499.6 | 922.9 | 422.4 | 1742.5 | 1575.6 | 673.0 | 3033.6 | 4493.5 |
| Nutrient | 3 | 3 | 3 | 1 | 1 | 1 | 6 | 6 | 6 |
| Max | 2980.0 | 10,057.0 | 29,595.0 | 2980.0 | 10,057.0 | 29,595.0 | 2980.0 | 10,057.0 | 30,159.0 |
| Min | 1610.0 | 5863.0 | 28,436.0 | 1610.0 | 4969.0 | 25,147.0 | 1843.0 | 4969.0 | 27,456.0 |
| Avg | 2312.0 | 8102.9 | 29,104.7 | 2245.3 | 7701.6 | 28,183.4 | 2334.7 | 8012.0 | 29,032.6 |
| STD | 440.3 | 1308.0 | 441.0 | 422.4 | 1742.5 | 1575.6 | 335.8 | 1536.6 | 827.1 |
| Temp. | 20 | 20 | 20 | 25 | 25 | 25 | 30 | 30 | 30 |
| Max | 2502.0 | 9746.0 | 28,763.0 | 2980.0 | 10,057.0 | 29,595.0 | 3265.0 | 14,365.0 | 38,752.0 |
| Min | 1610.0 | 4969.0 | 25,147.0 | 1610.0 | 4969.0 | 25,147.0 | 1610.0 | 7895.0 | 29,568.0 |
| Avg | 2170.4 | 7546.6 | 26,910.4 | 2245.3 | 7701.6 | 28,183.4 | 2567.3 | 11,633.4 | 33,582.7 |
| STD | 319.4 | 1593.6 | 1334.0 | 422.4 | 1742.5 | 1575.6 | 526.6 | 2052.6 | 3082.0 |
| Water | high | high | high | normal | normal | normal | low | low | low |
| Max | 2258.0 | 8742.0 | 29,595.0 | 2980.0 | 10,057.0 | 29,595.0 | 2245.0 | 8452.0 | 29,595.0 |
| Min | 1610.0 | 4969.0 | 24,695.0 | 1610.0 | 4969.0 | 25,147.0 | 1610.0 | 4969.0 | 22,459.0 |
| Avg | 2054.7 | 7243.4 | 27,003.1 | 2245.3 | 7701.6 | 28,183.4 | 1924.9 | 6823.6 | 25,682.9 |
| STD | 221.5 | 1315.2 | 1779.7 | 422.4 | 1742.5 | 1575.6 | 205.1 | 1114.6 | 2359.5 |
| Watermelon seedling | |||||||||
| Days | 4th | 9th | 15th | 4th | 9th | 15th | 4th | 9th | 15th |
| Light | 50 | 50 | 50 | 250 | 250 | 250 | 450 | 450 | 450 |
| Max | 5631.0 | 5305.0 | 7476.0 | 6023.0 | 12,728.0 | 26,421.0 | 6016.0 | 12,701.0 | 26,389.0 |
| Min | 693.0 | 1994.0 | 4137.0 | 4216.0 | 4983.0 | 7190.0 | 4409.0 | 5496.0 | 9038.0 |
| Avg | 2786.6 | 3995.7 | 5126.1 | 4956.7 | 7000.4 | 13,730.3 | 5191.6 | 7355.7 | 15,333.9 |
| STD | 2008.5 | 1231.4 | 1050.9 | 697.0 | 2448.8 | 6268.0 | 547.4 | 2307.9 | 5718.7 |
| Nutrient | 3 | 3 | 3 | 1 | 1 | 1 | 6 | 6 | 6 |
| Max | 6323.8 | 10,456.0 | 19,442.8 | 6023.0 | 12,728.0 | 26,421.0 | 6444.4 | 13,149.4 | 19,563.4 |
| Min | 4516.8 | 5283.8 | 9745.0 | 4216.0 | 4983.0 | 7190.0 | 4637.4 | 5404.4 | 7611.4 |
| Avg | 5257.5 | 6933.7 | 12,728.2 | 4956.7 | 7000.4 | 13,730.3 | 5377.9 | 7421.8 | 12,636.3 |
| STD | 697.0 | 1611.5 | 2966.9 | 697.0 | 2448.8 | 6268.0 | 697.1 | 2448.8 | 3821.5 |
| Temp. | 20 | 20 | 20 | 25 | 25 | 25 | 30 | 30 | 30 |
| Max | 5727.0 | 8965.0 | 12,683.0 | 6023.0 | 12,728.0 | 26,421.0 | 6542.0 | 13,147.0 | 12,986.0 |
| Min | 3865.2 | 5623.0 | 7185.0 | 4216.0 | 4983.0 | 7190.0 | 3452.0 | 4561.0 | 9563.0 |
| Avg | 4700.2 | 6676.9 | 10,526.7 | 4956.7 | 7000.4 | 13,730.3 | 5237.1 | 9097.1 | 11,102.6 |
| STD | 664.0 | 1094.9 | 1883.6 | 697.0 | 2448.8 | 6268.0 | 1007.4 | 2908.0 | 1107.0 |
| Water | high | high | high | normal | normal | normal | low | low | low |
| Max | 5499.4 | 11,741.0 | 15,236.0 | 6023.0 | 12,728.0 | 26,421.0 | 5277.8 | 11,982.8 | 12,543.0 |
| Min | 3692.4 | 4459.4 | 6666.4 | 4216.0 | 4983.0 | 7190.0 | 3470.8 | 4237.8 | 6544.8 |
| Avg | 4484.0 | 6366.4 | 11,099.0 | 4956.7 | 7000.4 | 13,730.3 | 4366.7 | 6155.9 | 10,018.3 |
| STD | 668.7 | 2290.4 | 2913.9 | 697.0 | 2448.8 | 6268.0 | 642.2 | 2466.0 | 2133.7 |
| Lettuce seedling | |||||||||
| Days | 4th | 9th | 15th | 4th | 9th | 15th | 4th | 9th | 15th |
| Light | 50 | 50 | 50 | 250 | 250 | 250 | 450 | 450 | 450 |
| Max | 275.0 | 592.0 | 1025.0 | 412.0 | 2191.0 | 2469.0 | 475.3 | 2187.0 | 3264.0 |
| Min | 102.0 | 145.0 | 343.0 | 256.0 | 1045.0 | 1986.0 | 246.0 | 1037.0 | 1863.0 |
| Avg | 195.9 | 365.7 | 573.6 | 314.4 | 1371.6 | 2259.7 | 351.4 | 1507.0 | 2397.4 |
| STD | 54.7 | 156.8 | 248.6 | 55.5 | 361.7 | 161.8 | 69.2 | 436.0 | 517.0 |
| Nutrient | 3 | 3 | 3 | 1 | 1 | 1 | 6 | 6 | 6 |
| Max | 414.0 | 2193.0 | 2946.0 | 412.0 | 2191.0 | 2469.0 | 414.3 | 1963.0 | 2947.0 |
| Min | 264.0 | 1047.0 | 2115.0 | 256.0 | 1045.0 | 1986.0 | 270.3 | 1164.3 | 2209.3 |
| Avg | 330.8 | 1493.4 | 2398.6 | 314.4 | 1371.6 | 2259.7 | 340.7 | 1519.0 | 2419.9 |
| STD | 51.4 | 449.0 | 252.3 | 55.5 | 361.7 | 161.8 | 44.4 | 235.8 | 233.5 |
| Temp. | 20 | 20 | 20 | 25 | 25 | 25 | 30 | 30 | 30 |
| Max | 376.5 | 1652.3 | 2428.8 | 412.0 | 2191.0 | 2469.0 | 418.4 | 2197.4 | 2654.0 |
| Min | 252.8 | 1041.8 | 1982.8 | 256.0 | 1045.0 | 1986.0 | 274.4 | 1051.4 | 2214.4 |
| Avg | 305.1 | 1291.8 | 2167.0 | 314.4 | 1371.6 | 2259.7 | 338.7 | 1440.9 | 2380.0 |
| STD | 43.9 | 201.5 | 134.6 | 55.5 | 361.7 | 161.8 | 47.1 | 382.7 | 144.7 |
| Water | high | high | high | normal | normal | normal | low | low | low |
| Max | 405.0 | 1845.0 | 2462.0 | 412.0 | 2191.0 | 2469.0 | 370.1 | 1796.0 | 2464.1 |
| Min | 255.0 | 1038.0 | 1846.0 | 256.0 | 1045.0 | 1986.0 | 251.1 | 1040.1 | 1879.0 |
| Avg | 308.7 | 1316.2 | 2180.0 | 314.4 | 1371.6 | 2259.7 | 301.1 | 1304.5 | 2155.8 |
| STD | 46.1 | 256.0 | 207.4 | 55.5 | 361.7 | 161.8 | 43.1 | 236.5 | 176.3 |
| Pak choi seedling | |||||||||
| Days | 4th | 9th | 15th | 4th | 9th | 15th | 4th | 9th | 15th |
| Light | 50 | 50 | 50 | 250 | 250 | 250 | 450 | 450 | 450 |
| Max | 126.0 | 135.0 | 312.0 | 156.0 | 581.0 | 1638.0 | 201.0 | 522.0 | 1554.0 |
| Min | 86.0 | 106.0 | 163.0 | 89.0 | 306.0 | 664.0 | 68.0 | 351.0 | 1232.0 |
| Avg | 106.1 | 120.1 | 242.9 | 122.9 | 415.3 | 1331.6 | 143.7 | 425.3 | 1404.1 |
| STD | 13.1 | 8.7 | 48.8 | 27.2 | 85.6 | 342.3 | 45.4 | 49.1 | 104.3 |
| Nutrient | 3 | 3 | 3 | 1 | 1 | 1 | 6 | 6 | 6 |
| Max | 159.2 | 489.0 | 1641.2 | 156.0 | 581.0 | 1638.0 | 159.2 | 489.0 | 1641.2 |
| Min | 100.2 | 309.2 | 1123.0 | 89.0 | 306.0 | 664.0 | 105.0 | 352.2 | 1189.2 |
| Avg | 123.2 | 423.9 | 1388.6 | 122.9 | 415.3 | 1331.6 | 127.5 | 438.7 | 1445.3 |
| STD | 22.6 | 62.4 | 196.5 | 27.2 | 85.6 | 342.3 | 19.8 | 42.6 | 166.7 |
| Temp. | 20 | 20 | 20 | 25 | 25 | 25 | 30 | 30 | 30 |
| Max | 159.2 | 484.0 | 1637.2 | 156.0 | 581.0 | 1638.0 | 155.0 | 489.0 | 1641.2 |
| Min | 92.2 | 309.2 | 667.2 | 89.0 | 306.0 | 664.0 | 101.5 | 326.0 | 1086.2 |
| Avg | 120.9 | 408.7 | 1307.8 | 122.9 | 415.3 | 1331.6 | 127.2 | 432.4 | 1420.2 |
| STD | 23.6 | 65.8 | 324.0 | 27.2 | 85.6 | 342.3 | 22.6 | 47.3 | 216.5 |
| Water | high | high | high | normal | normal | normal | low | low | low |
| Max | 151.3 | 576.3 | 1633.3 | 156.0 | 581.0 | 1638.0 | 151.3 | 479.0 | 1633.3 |
| Min | 84.3 | 330.0 | 659.3 | 89.0 | 306.0 | 664.0 | 84.3 | 301.3 | 640.0 |
| Avg | 119.3 | 406.8 | 1259.0 | 122.9 | 415.3 | 1331.6 | 115.3 | 396.7 | 1277.0 |
| STD | 27.1 | 79.7 | 322.1 | 27.2 | 85.6 | 342.3 | 24.4 | 62.2 | 324.7 |
| Pepper seedling | |||||||||
| Days | 4th | 9th | 15th | 4th | 9th | 15th | 4th | 9th | 15th |
| Light | 50 | 50 | 50 | 250 | 250 | 250 | 450 | 450 | 450 |
| Max | 3.4 | 4.1 | 4.1 | 3.1 | 4.2 | 5.9 | 3.3 | 4.2 | 8.3 |
| Min | 3.2 | 3.2 | 3.6 | 2.3 | 3.4 | 2.6 | 2.7 | 3.5 | 6.0 |
| Avg | 3.3 | 3.7 | 3.9 | 2.7 | 3.9 | 5.1 | 3.0 | 3.9 | 7.2 |
| STD | 0.1 | 0.3 | 0.2 | 0.2 | 0.2 | 1.1 | 0.2 | 0.2 | 0.7 |
| Nutrient | 3 | 3 | 3 | 1 | 1 | 1 | 6 | 6 | 6 |
| Max | 2.7 | 3.6 | 6.2 | 3.1 | 4.2 | 5.9 | 3.2 | 3.9 | 6.1 |
| Min | 1.8 | 2.8 | 5.2 | 2.3 | 3.4 | 2.6 | 2.6 | 2.9 | 5.1 |
| Avg | 2.4 | 3.2 | 5.6 | 2.7 | 3.9 | 5.1 | 2.9 | 3.2 | 5.5 |
| STD | 0.3 | 0.3 | 0.4 | 0.2 | 0.2 | 1.1 | 0.2 | 0.4 | 0.3 |
| Temp. | 20 | 20 | 20 | 25 | 25 | 25 | 30 | 30 | 30 |
| Max | 2.8 | 3.8 | 4.7 | 3.1 | 4.2 | 5.9 | 4.9 | 6.1 | 11.6 |
| Min | 2.3 | 2.9 | 4.1 | 2.3 | 3.4 | 2.6 | 2.7 | 5.4 | 8.4 |
| Avg | 2.6 | 3.5 | 4.3 | 2.7 | 3.9 | 5.1 | 3.7 | 5.7 | 10.1 |
| STD | 0.2 | 0.3 | 0.2 | 0.2 | 0.2 | 1.1 | 0.6 | 0.2 | 1.0 |
| Water | high | high | high | normal | normal | normal | low | low | low |
| Max | 2.8 | 3.6 | 5.2 | 3.1 | 4.2 | 5.9 | 3.2 | 3.8 | 5.3 |
| Min | 1.9 | 2.8 | 4.6 | 2.3 | 3.4 | 2.6 | 2.5 | 2.9 | 4.2 |
| Avg | 2.5 | 3.1 | 4.9 | 2.7 | 3.9 | 5.1 | 2.9 | 3.3 | 4.8 |
| STD | 0.3 | 0.3 | 0.2 | 0.2 | 0.2 | 1.1 | 0.2 | 0.3 | 0.4 |
| Cucumber seedling | |||||||||
| Days | 4th | 9th | 15th | 4th | 9th | 15th | 4th | 9th | 15th |
| Light | 50 | 50 | 50 | 250 | 250 | 250 | 450 | 450 | 450 |
| Max | 3.5 | 3.8 | 4.1 | 4.0 | 4.3 | 4.3 | 3.6 | 4.5 | 4.4 |
| Min | 2.6 | 3.0 | 2.6 | 2.6 | 3.0 | 3.5 | 3.2 | 3.4 | 3.5 |
| Avg | 3.1 | 3.3 | 3.3 | 3.4 | 3.7 | 3.9 | 3.4 | 3.8 | 4.0 |
| STD | 0.3 | 0.2 | 0.4 | 0.4 | 0.5 | 0.3 | 0.2 | 0.3 | 0.3 |
| Nutrient | 3 | 3 | 3 | 1 | 1 | 1 | 6 | 6 | 6 |
| Max | 3.5 | 4.4 | 4.1 | 4.0 | 4.3 | 4.3 | 4.1 | 3.8 | 4.4 |
| Min | 2.8 | 2.8 | 2.9 | 2.6 | 3.0 | 3.5 | 2.3 | 3.1 | 3.2 |
| Avg | 3.1 | 3.4 | 3.6 | 3.4 | 3.7 | 3.9 | 3.2 | 3.4 | 3.8 |
| STD | 0.2 | 0.5 | 0.4 | 0.4 | 0.5 | 0.3 | 0.5 | 0.3 | 0.4 |
| Temp. | 20 | 20 | 20 | 25 | 25 | 25 | 30 | 30 | 30 |
| Max | 3.6 | 4.2 | 3.9 | 4.0 | 4.3 | 4.3 | 4.6 | 5.5 | 5.4 |
| Min | 2.4 | 2.8 | 1.9 | 2.6 | 3.0 | 3.5 | 3.0 | 3.6 | 3.6 |
| Avg | 3.1 | 3.4 | 2.9 | 3.4 | 3.7 | 3.9 | 3.8 | 4.5 | 4.7 |
| STD | 0.4 | 0.4 | 0.6 | 0.4 | 0.5 | 0.3 | 0.5 | 0.5 | 0.6 |
| Water | high | high | high | normal | normal | normal | low | low | low |
| Max | 4.1 | 4.7 | 4.0 | 4.0 | 4.3 | 4.3 | 3.3 | 3.5 | 3.6 |
| Min | 2.3 | 2.9 | 2.6 | 2.6 | 3.0 | 3.5 | 2.2 | 3.1 | 2.9 |
| Avg | 3.2 | 3.4 | 3.3 | 3.4 | 3.7 | 3.9 | 2.8 | 3.2 | 3.3 |
| STD | 0.5 | 0.6 | 0.4 | 0.4 | 0.5 | 0.3 | 0.4 | 0.1 | 0.2 |
| Tomato seedling | |||||||||
| Days | 4th | 9th | 15th | 4th | 9th | 15th | 4th | 9th | 15th |
| Light | 50 | 50 | 50 | 250 | 250 | 250 | 450 | 450 | 450 |
| Max | 5.3 | 7.5 | 7.4 | 8.6 | 16.8 | 33.4 | 6.4 | 19.3 | 31.4 |
| Min | 2.9 | 5.8 | 5.5 | 4.5 | 13.5 | 18.4 | 5.3 | 13.1 | 21.8 |
| Avg | 4.0 | 6.4 | 6.7 | 5.7 | 15.0 | 25.4 | 5.9 | 16.3 | 27.0 |
| STD | 0.8 | 0.5 | 0.6 | 1.3 | 1.0 | 4.8 | 0.4 | 2.1 | 3.3 |
| Nutrient | 3 | 3 | 3 | 1 | 1 | 1 | 6 | 6 | 6 |
| Max | 7.1 | 15.8 | 29.3 | 8.6 | 16.8 | 33.4 | 5.4 | 15.6 | 18.7 |
| Min | 5.4 | 12.8 | 22.4 | 4.5 | 13.5 | 18.4 | 4.1 | 9.0 | 12.6 |
| Avg | 6.1 | 14.5 | 25.7 | 5.7 | 15.0 | 25.4 | 4.9 | 13.0 | 15.3 |
| STD | 0.7 | 1.1 | 2.2 | 1.3 | 1.0 | 4.8 | 0.4 | 2.5 | 2.2 |
| Temp. | 20 | 20 | 20 | 25 | 25 | 25 | 30 | 30 | 30 |
| Max | 6.5 | 11.7 | 23.2 | 8.6 | 16.8 | 33.4 | 7.2 | 22.2 | 33.6 |
| Min | 4.2 | 1.3 | 14.5 | 4.5 | 13.5 | 18.4 | 4.1 | 14.8 | 29.0 |
| Avg | 5.2 | 8.6 | 18.1 | 5.7 | 15.0 | 25.4 | 6.3 | 16.5 | 31.8 |
| STD | 0.8 | 3.3 | 3.3 | 1.3 | 1.0 | 4.8 | 1.0 | 2.4 | 1.8 |
| Water | high | high | high | normal | normal | normal | low | low | low |
| Max | 7.3 | 15.6 | 29.1 | 8.6 | 16.8 | 33.4 | 5.6 | 15.4 | 18.2 |
| Min | 5.6 | 12.6 | 22.6 | 4.5 | 13.5 | 18.4 | 4.3 | 8.8 | 10.4 |
| Avg | 6.3 | 14.4 | 25.8 | 5.7 | 15.0 | 25.4 | 5.1 | 12.8 | 14.4 |
| STD | 0.7 | 1.0 | 2.1 | 1.3 | 1.0 | 4.8 | 0.4 | 2.4 | 2.2 |
| Watermelon seedling | |||||||||
| Days | 4th | 9th | 15th | 4th | 9th | 15th | 4th | 9th | 15th |
| Light | 50 | 50 | 50 | 250 | 250 | 250 | 450 | 450 | 450 |
| Max | 1.7 | 2.2 | 2.1 | 2.3 | 2.4 | 2.6 | 2.1 | 2.3 | 2.5 |
| Min | 1.4 | 1.2 | 1.5 | 1.2 | 1.4 | 1.7 | 1.3 | 1.6 | 2.5 |
| Avg | 1.5 | 1.7 | 1.8 | 1.6 | 1.9 | 2.1 | 1.8 | 2.0 | 2.4 |
| STD | 0.1 | 0.4 | 0.2 | 0.4 | 0.3 | 0.3 | 0.3 | 0.2 | 2.4 |
| Nutrient | 3 | 3 | 3 | 1 | 1 | 1 | 6 | 6 | 6 |
| Max | 1.8 | 2.4 | 2.4 | 2.3 | 2.4 | 2.6 | 2.2 | 2.2 | 2.6 |
| Min | 1.5 | 1.8 | 1.8 | 1.2 | 1.4 | 1.7 | 1.5 | 1.8 | 1.6 |
| Avg | 1.7 | 2.0 | 2.2 | 1.6 | 1.9 | 2.1 | 1.8 | 2.0 | 2.1 |
| STD | 0.1 | 0.2 | 0.2 | 0.4 | 0.3 | 0.3 | 0.2 | 0.1 | 0.3 |
| Temp. | 20 | 20 | 20 | 25 | 25 | 25 | 30 | 30 | 30 |
| Max | 1.9 | 2.1 | 2.1 | 2.3 | 2.4 | 2.6 | 2.2 | 2.4 | 2.7 |
| Min | 1.4 | 1.7 | 1.8 | 1.2 | 1.4 | 1.7 | 1.6 | 1.8 | 2.1 |
| Avg | 1.6 | 1.8 | 2.0 | 1.6 | 1.9 | 2.1 | 1.9 | 2.1 | 2.3 |
| STD | 0.2 | 0.1 | 0.1 | 0.4 | 0.3 | 0.3 | 0.2 | 0.2 | 0.2 |
| Water | high | high | high | normal | normal | normal | low | low | low |
| Max | 1.6 | 2.0 | 2.2 | 2.3 | 2.4 | 2.6 | 2.0 | 2.2 | 2.4 |
| Min | 1.3 | 1.6 | 1.6 | 1.2 | 1.4 | 1.7 | 1.3 | 1.6 | 1.7 |
| Avg | 1.5 | 1.8 | 2.0 | 1.6 | 1.9 | 2.1 | 1.6 | 1.8 | 1.9 |
| STD | 0.1 | 0.1 | 0.2 | 0.4 | 0.3 | 0.3 | 0.2 | 0.2 | 0.2 |
| Lettuce seedling | |||||||||
| Days | 4th | 9th | 15th | 4th | 9th | 15th | 4th | 9th | 15th |
| Light | 50 | 50 | 50 | 250 | 250 | 250 | 450 | 450 | 450 |
| Max | 1.4 | 1.9 | 2.8 | 2.3 | 3.2 | 5.9 | 3.1 | 5.1 | 6.8 |
| Min | 1.0 | 1.4 | 1.7 | 1.7 | 1.9 | 4.3 | 2.3 | 3.6 | 5.2 |
| Avg | 1.2 | 1.7 | 2.0 | 2.0 | 2.6 | 5.2 | 2.7 | 4.1 | 6.0 |
| STD | 0.1 | 0.2 | 0.3 | 0.2 | 0.5 | 0.6 | 0.2 | 0.5 | 0.5 |
| Nutrient | 3 | 3 | 3 | 1 | 1 | 1 | 6 | 6 | 6 |
| Max | 2.6 | 3.4 | 6.0 | 2.3 | 3.2 | 5.9 | 2.6 | 3.1 | 5.4 |
| Min | 1.5 | 2.3 | 4.2 | 1.7 | 1.9 | 4.3 | 1.8 | 2.1 | 4.6 |
| Avg | 2.0 | 2.7 | 5.1 | 2.0 | 2.6 | 5.2 | 2.1 | 2.5 | 4.9 |
| STD | 0.3 | 0.4 | 0.5 | 0.2 | 0.5 | 0.6 | 0.3 | 0.3 | 0.3 |
| Temp. | 20 | 20 | 20 | 25 | 25 | 25 | 30 | 30 | 30 |
| Max | 2.4 | 3.6 | 6.0 | 2.3 | 3.2 | 5.9 | 4.2 | 6.0 | 8.1 |
| Min | 1.5 | 1.4 | 4.2 | 1.7 | 1.9 | 4.3 | 2.6 | 4.7 | 6.1 |
| Avg | 1.9 | 2.5 | 4.9 | 2.0 | 2.6 | 5.2 | 3.3 | 5.3 | 7.1 |
| STD | 0.3 | 0.6 | 0.7 | 0.2 | 0.5 | 0.6 | 0.5 | 0.5 | 0.7 |
| Water | high | high | high | normal | normal | normal | low | low | low |
| Max | 2.6 | 2.8 | 6.0 | 2.3 | 3.2 | 5.9 | 2.4 | 2.6 | 5.1 |
| Min | 1.5 | 1.8 | 4.1 | 1.7 | 1.9 | 4.3 | 1.4 | 1.8 | 4.2 |
| Avg | 1.9 | 2.5 | 5.1 | 2.0 | 2.6 | 5.2 | 1.9 | 2.3 | 4.6 |
| STD | 0.3 | 0.3 | 0.5 | 0.2 | 0.5 | 0.6 | 0.3 | 0.3 | 0.3 |
| Pak choi seedling | |||||||||
| Days | 4th | 9th | 15th | 4th | 9th | 15th | 4th | 9th | 15th |
| Light | 50 | 50 | 50 | 250 | 250 | 250 | 450 | 450 | 450 |
| Max | 1.6 | 1.8 | 2.1 | 2.4 | 4.5 | 9.1 | 2.0 | 3.9 | 10.7 |
| Min | 1.3 | 1.5 | 1.4 | 1.1 | 1.5 | 7.0 | 1.5 | 2.6 | 7.1 |
| Avg | 1.5 | 1.6 | 1.8 | 1.5 | 3.0 | 7.9 | 1.7 | 3.2 | 8.6 |
| STD | 0.1 | 0.1 | 0.2 | 0.4 | 1.0 | 0.7 | 0.2 | 0.5 | 1.3 |
| Nutrient | 3 | 3 | 3 | 1 | 1 | 1 | 6 | 6 | 6 |
| Max | 2.0 | 4.2 | 9.2 | 2.4 | 4.5 | 9.1 | 2.2 | 3.7 | 8.2 |
| Min | 1.5 | 2.5 | 7.3 | 1.1 | 1.5 | 7.0 | 1.4 | 2.5 | 6.5 |
| Avg | 1.8 | 3.1 | 7.9 | 1.5 | 3.0 | 7.9 | 1.8 | 3.1 | 7.6 |
| STD | 0.2 | 0.6 | 0.6 | 0.4 | 1.0 | 0.7 | 0.3 | 0.5 | 0.5 |
| Temp. | 20 | 20 | 20 | 25 | 25 | 25 | 30 | 30 | 30 |
| Max | 1.7 | 3.4 | 8.7 | 2.4 | 4.5 | 9.1 | 3.2 | 4.6 | 10.5 |
| Min | 1.2 | 2.4 | 6.7 | 1.1 | 1.5 | 7.0 | 2.3 | 2.6 | 8.8 |
| Avg | 1.5 | 2.9 | 7.8 | 1.5 | 3.0 | 7.9 | 2.6 | 4.0 | 9.7 |
| STD | 0.2 | 0.3 | 0.7 | 0.4 | 1.0 | 0.7 | 0.3 | 0.6 | 0.6 |
| Water | high | high | high | normal | normal | normal | low | low | low |
| Max | 1.6 | 3.4 | 8.3 | 2.4 | 4.5 | 9.1 | 1.7 | 2.7 | 7.3 |
| Min | 1.4 | 2.3 | 7.1 | 1.1 | 1.5 | 7.0 | 1.3 | 2.1 | 6.3 |
| Avg | 1.5 | 2.9 | 7.6 | 1.5 | 3.0 | 7.9 | 1.4 | 2.4 | 6.8 |
| STD | 0.1 | 0.4 | 0.4 | 0.4 | 1.0 | 0.7 | 0.1 | 0.2 | 0.3 |
| Pepper seedling | |||||||||
| Days | 4th | 9th | 15th | 4th | 9th | 15th | 4th | 9th | 15th |
| Light | 50 | 50 | 50 | 250 | 250 | 250 | 450 | 450 | 450 |
| Max | 23.0 | 23.9 | 25.0 | 25.0 | 29.0 | 33.0 | 27.7 | 31.9 | 33.9 |
| Min | 22.3 | 23.2 | 24.8 | 24.4 | 28.0 | 31.9 | 26.9 | 30.6 | 32.8 |
| Avg | 22.7 | 23.6 | 24.9 | 24.6 | 28.4 | 32.5 | 27.3 | 31.2 | 33.4 |
| STD | 0.2 | 0.3 | 0.1 | 0.2 | 0.3 | 0.4 | 0.3 | 0.5 | 0.4 |
| Nutrient | 3 | 3 | 3 | 1 | 1 | 1 | 6 | 6 | 6 |
| Max | 23.7 | 27.6 | 31.8 | 25.0 | 29.0 | 33.0 | 27.7 | 27.7 | 31.0 |
| Min | 22.9 | 26.8 | 30.7 | 24.4 | 28.0 | 31.9 | 26.9 | 26.8 | 29.9 |
| Avg | 23.2 | 27.2 | 31.3 | 24.6 | 28.4 | 32.5 | 27.3 | 27.2 | 30.5 |
| STD | 0.3 | 0.3 | 0.4 | 0.2 | 0.3 | 0.4 | 0.3 | 0.3 | 0.3 |
| Temp. | 20 | 20 | 20 | 25 | 25 | 25 | 30 | 30 | 30 |
| Max | 23.8 | 30.0 | 32.0 | 25.0 | 29.0 | 33.0 | 30.0 | 32.0 | 34.0 |
| Min | 22.2 | 29.3 | 31.3 | 24.4 | 28.0 | 31.9 | 28.9 | 31.1 | 33.7 |
| Avg | 23.3 | 29.7 | 31.7 | 24.6 | 28.4 | 32.5 | 29.4 | 31.4 | 33.8 |
| STD | 0.5 | 0.3 | 0.2 | 0.2 | 0.3 | 0.4 | 0.4 | 0.3 | 0.1 |
| Water | high | high | high | normal | normal | normal | low | low | low |
| Max | 23.8 | 29.1 | 24.9 | 25.0 | 29.0 | 33.0 | 29.8 | 31.8 | 34.1 |
| Min | 23.0 | 28.0 | 24.8 | 24.4 | 28.0 | 31.9 | 29.0 | 31.2 | 33.6 |
| Avg | 23.3 | 28.5 | 24.8 | 24.6 | 28.4 | 32.5 | 29.3 | 31.4 | 33.8 |
| STD | 0.3 | 0.4 | 0.1 | 0.2 | 0.3 | 0.4 | 0.3 | 0.2 | 0.2 |
| Cucumber seedling | |||||||||
| Days | 4th | 9th | 15th | 4th | 9th | 15th | 4th | 9th | 15th |
| Light | 50 | 50 | 50 | 250 | 250 | 250 | 450 | 450 | 450 |
| Max | 23.8 | 24.5 | 25.5 | 30.5 | 33.2 | 34.4 | 29.8 | 34.0 | 36.5 |
| Min | 23.3 | 23.7 | 25.3 | 28.7 | 31.0 | 31.9 | 28.7 | 30.9 | 34.2 |
| Avg | 23.5 | 24.2 | 25.4 | 29.5 | 32.0 | 33.3 | 29.4 | 32.2 | 34.9 |
| STD | 0.2 | 0.3 | 0.1 | 0.6 | 0.8 | 0.9 | 0.3 | 1.0 | 0.7 |
| Nutrient | 3 | 3 | 3 | 1 | 1 | 1 | 6 | 6 | 6 |
| Max | 30.6 | 30.9 | 31.9 | 30.5 | 33.2 | 34.4 | 31.2 | 32.5 | 33.2 |
| Min | 28.2 | 28.6 | 30.6 | 28.7 | 31.0 | 31.9 | 28.8 | 30.5 | 30.4 |
| Avg | 29.3 | 29.6 | 31.2 | 29.5 | 32.0 | 33.3 | 30.1 | 31.2 | 32.3 |
| STD | 0.9 | 0.8 | 0.5 | 0.6 | 0.8 | 0.9 | 0.8 | 0.7 | 0.9 |
| Temp. | 20 | 20 | 20 | 25 | 25 | 25 | 30 | 30 | 30 |
| Max | 28.3 | 30.6 | 31.9 | 30.5 | 33.2 | 34.4 | 31.2 | 33.0 | 35.2 |
| Min | 26.8 | 28.6 | 29.5 | 28.7 | 31.0 | 31.9 | 29.4 | 31.5 | 34.0 |
| Avg | 27.8 | 29.8 | 30.7 | 29.5 | 32.0 | 33.3 | 30.3 | 32.4 | 34.8 |
| STD | 0.5 | 0.7 | 0.7 | 0.6 | 0.8 | 0.9 | 0.6 | 0.6 | 0.4 |
| Water | high | high | high | normal | normal | normal | low | low | low |
| Max | 30.5 | 30.8 | 32.2 | 30.5 | 33.2 | 34.4 | 31.2 | 33.1 | 35.5 |
| Min | 27.2 | 28.1 | 30.0 | 28.7 | 31.0 | 31.9 | 30.4 | 32.5 | 34.9 |
| Avg | 28.9 | 29.2 | 31.1 | 29.5 | 32.0 | 33.3 | 30.7 | 32.8 | 35.1 |
| STD | 1.2 | 1.0 | 0.8 | 0.6 | 0.8 | 0.9 | 0.3 | 0.2 | 0.2 |
| Tomato seedling | |||||||||
| Days | 4th | 9th | 15th | 4th | 9th | 15th | 4th | 9th | 15th |
| Light | 50 | 50 | 50 | 250 | 250 | 250 | 450 | 450 | 450 |
| Max | 22.8 | 23.7 | 25.2 | 24.5 | 30.1 | 31.5 | 27.5 | 31.8 | 34.0 |
| Min | 22.0 | 23.1 | 24.2 | 22.8 | 28.5 | 29.9 | 26.6 | 30.3 | 32.3 |
| Avg | 22.5 | 23.4 | 24.6 | 23.7 | 29.2 | 30.8 | 27.1 | 31.1 | 33.2 |
| STD | 0.3 | 0.2 | 0.3 | 0.5 | 0.6 | 0.5 | 0.3 | 0.6 | 0.5 |
| Nutrient | 3 | 3 | 3 | 1 | 1 | 1 | 6 | 6 | 6 |
| Max | 23.7 | 27.5 | 31.7 | 24.5 | 30.1 | 31.5 | 27.6 | 27.6 | 30.9 |
| Min | 22.7 | 26.6 | 30.5 | 22.8 | 28.5 | 29.9 | 26.9 | 26.7 | 29.7 |
| Avg | 23.2 | 27.1 | 31.1 | 23.7 | 29.2 | 30.8 | 27.2 | 27.1 | 30.4 |
| STD | 0.3 | 0.3 | 0.4 | 0.5 | 0.6 | 0.5 | 0.3 | 0.3 | 0.4 |
| Temp. | 20 | 20 | 20 | 25 | 25 | 25 | 30 | 30 | 30 |
| Max | 23.7 | 30.1 | 32.1 | 24.5 | 30.1 | 31.5 | 29.9 | 32.1 | 33.9 |
| Min | 22.2 | 29.4 | 31.4 | 22.8 | 28.5 | 29.9 | 29.0 | 31.2 | 33.6 |
| Avg | 23.2 | 29.8 | 31.8 | 23.7 | 29.2 | 30.8 | 29.4 | 31.6 | 33.7 |
| STD | 0.5 | 0.3 | 0.2 | 0.5 | 0.6 | 0.5 | 0.4 | 0.3 | 0.1 |
| Water | high | high | high | normal | normal | normal | low | low | low |
| Max | 23.7 | 29.0 | 24.8 | 24.5 | 30.1 | 31.5 | 29.7 | 31.9 | 34.0 |
| Min | 22.9 | 27.9 | 24.7 | 22.8 | 28.5 | 29.9 | 28.9 | 31.3 | 33.5 |
| Avg | 23.3 | 28.4 | 24.7 | 23.7 | 29.2 | 30.8 | 29.3 | 31.6 | 33.7 |
| STD | 0.3 | 0.4 | 0.1 | 0.5 | 0.6 | 0.5 | 0.3 | 0.2 | 0.2 |
| Watermelon seedling | |||||||||
| Days | 4th | 9th | 15th | 4th | 9th | 15th | 4th | 9th | 15th |
| Light | 50 | 50 | 50 | 250 | 250 | 250 | 450 | 450 | 450 |
| Max | 26.0 | 27.3 | 29.3 | 26.3 | 29.4 | 32.6 | 27.3 | 30.9 | 33.7 |
| Min | 25.2 | 24.6 | 27.5 | 24.8 | 27.3 | 30.5 | 25.9 | 28.9 | 30.6 |
| Avg | 25.6 | 26.1 | 28.4 | 25.7 | 28.2 | 31.6 | 26.7 | 30.2 | 32.3 |
| STD | 0.3 | 0.9 | 0.6 | 0.6 | 0.8 | 0.7 | 0.5 | 0.7 | 0.9 |
| Nutrient | 3 | 3 | 3 | 1 | 1 | 1 | 6 | 6 | 6 |
| Max | 26.4 | 28.1 | 32.0 | 26.3 | 29.4 | 32.6 | 28.0 | 28.0 | 31.3 |
| Min | 24.6 | 27.3 | 30.8 | 24.8 | 27.3 | 30.5 | 27.2 | 27.1 | 30.2 |
| Avg | 25.3 | 27.8 | 31.4 | 25.7 | 28.2 | 31.6 | 27.6 | 27.5 | 30.8 |
| STD | 0.5 | 0.3 | 0.4 | 0.6 | 0.8 | 0.7 | 0.3 | 0.3 | 0.3 |
| Temp. | 20 | 20 | 20 | 25 | 25 | 25 | 30 | 30 | 30 |
| Max | 25.0 | 28.6 | 31.7 | 26.3 | 29.4 | 32.6 | 30.5 | 32.5 | 34.6 |
| Min | 23.9 | 27.4 | 30.0 | 24.8 | 27.3 | 30.5 | 29.4 | 31.7 | 34.2 |
| Avg | 24.5 | 28.0 | 30.7 | 25.7 | 28.2 | 31.6 | 29.9 | 32.0 | 34.4 |
| STD | 0.4 | 0.5 | 0.5 | 0.6 | 0.8 | 0.7 | 0.4 | 0.3 | 0.1 |
| Water | high | high | high | normal | normal | normal | low | low | low |
| Max | 26.9 | 28.6 | 30.6 | 26.3 | 29.4 | 32.6 | 28.9 | 30.0 | 32.3 |
| Min | 25.1 | 28.5 | 28.5 | 24.8 | 27.3 | 30.5 | 27.5 | 29.4 | 31.8 |
| Avg | 26.1 | 28.6 | 29.7 | 25.7 | 28.2 | 31.6 | 28.1 | 29.6 | 32.0 |
| STD | 0.7 | 0.1 | 0.7 | 0.6 | 0.8 | 0.7 | 0.4 | 0.2 | 0.2 |
| Lettuce seedling | |||||||||
| Days | 4th | 9th | 15th | 4th | 9th | 15th | 4th | 9th | 15th |
| Light | 50 | 50 | 50 | 250 | 250 | 250 | 450 | 450 | 450 |
| Max | 25.3 | 26.2 | 27.3 | 26.8 | 31.5 | 35.6 | 27.8 | 31.8 | 33.7 |
| Min | 24.6 | 25.5 | 27.1 | 24.9 | 28.0 | 32.9 | 26.6 | 30.1 | 32.3 |
| Avg | 25.0 | 25.9 | 27.2 | 26.0 | 30.2 | 34.0 | 27.3 | 31.1 | 33.0 |
| STD | 0.2 | 0.3 | 0.1 | 0.6 | 1.3 | 0.9 | 0.4 | 0.6 | 0.5 |
| Nutrient | 3 | 3 | 3 | 1 | 1 | 1 | 6 | 6 | 6 |
| Max | 28.6 | 29.8 | 31.8 | 26.8 | 31.5 | 35.6 | 28.9 | 30.8 | 32.8 |
| Min | 22.9 | 27.2 | 30.6 | 24.9 | 28.0 | 32.9 | 27.0 | 26.9 | 30.4 |
| Avg | 26.5 | 28.7 | 31.0 | 26.0 | 30.2 | 34.0 | 27.8 | 29.1 | 31.9 |
| STD | 1.8 | 1.0 | 0.4 | 0.6 | 1.3 | 0.9 | 0.6 | 1.4 | 0.8 |
| Temp. | 20 | 20 | 20 | 25 | 25 | 25 | 30 | 30 | 30 |
| Max | 25.2 | 31.4 | 33.4 | 26.8 | 31.5 | 35.6 | 31.6 | 33.8 | 36.0 |
| Min | 23.6 | 29.0 | 32.6 | 24.9 | 28.0 | 32.9 | 28.6 | 31.9 | 34.5 |
| Avg | 24.7 | 30.1 | 33.1 | 26.0 | 30.2 | 34.0 | 29.8 | 33.0 | 35.3 |
| STD | 0.5 | 0.8 | 0.2 | 0.6 | 1.3 | 0.9 | 1.0 | 0.6 | 0.5 |
| Water | high | high | high | normal | normal | normal | low | low | low |
| Max | 25.5 | 30.8 | 32.5 | 26.8 | 31.5 | 35.6 | 28.2 | 30.1 | 32.5 |
| Min | 24.7 | 29.7 | 29.6 | 24.9 | 28.0 | 32.9 | 27.4 | 29.5 | 31.9 |
| Avg | 25.1 | 30.2 | 30.9 | 26.0 | 30.2 | 34.0 | 27.7 | 29.8 | 32.1 |
| STD | 0.3 | 0.4 | 0.9 | 0.6 | 1.3 | 0.9 | 0.3 | 0.2 | 0.2 |
| Pak choi seedling | |||||||||
| Days | 4th | 9th | 15th | 4th | 9th | 15th | 4th | 9th | 15th |
| Light | 50 | 50 | 50 | 250 | 250 | 250 | 450 | 450 | 450 |
| Max | 25.1 | 26.0 | 30.2 | 26.7 | 30.4 | 32.0 | 29.3 | 32.0 | 32.1 |
| Min | 24.4 | 25.3 | 27.1 | 26.1 | 29.7 | 29.9 | 27.6 | 30.0 | 31.0 |
| Avg | 24.8 | 25.7 | 28.8 | 26.4 | 30.0 | 31.1 | 28.5 | 31.0 | 31.6 |
| STD | 0.2 | 0.3 | 1.1 | 0.2 | 0.2 | 0.7 | 0.5 | 0.6 | 0.4 |
| Nutrient | 3 | 3 | 3 | 1 | 1 | 1 | 6 | 6 | 6 |
| Max | 25.8 | 29.7 | 31.4 | 26.7 | 30.4 | 32.0 | 27.8 | 30.7 | 32.6 |
| Min | 24.9 | 28.9 | 29.8 | 26.1 | 29.7 | 29.9 | 26.4 | 28.4 | 30.8 |
| Avg | 25.3 | 29.3 | 30.6 | 26.4 | 30.0 | 31.1 | 27.1 | 29.3 | 31.7 |
| STD | 0.3 | 0.3 | 0.5 | 0.2 | 0.2 | 0.7 | 0.5 | 0.8 | 0.6 |
| Temp. | 20 | 20 | 20 | 25 | 25 | 25 | 30 | 30 | 30 |
| Max | 26.6 | 29.9 | 31.9 | 26.7 | 30.4 | 32.0 | 30.0 | 32.0 | 33.4 |
| Min | 24.8 | 28.6 | 29.6 | 26.1 | 29.7 | 29.9 | 28.3 | 30.1 | 30.9 |
| Avg | 25.9 | 29.2 | 30.6 | 26.4 | 30.0 | 31.1 | 29.4 | 31.3 | 32.6 |
| STD | 0.5 | 0.4 | 0.7 | 0.2 | 0.2 | 0.7 | 0.6 | 0.6 | 0.9 |
| Water | high | high | high | normal | normal | normal | low | low | low |
| Max | 26.9 | 29.6 | 30.8 | 26.7 | 30.4 | 32.0 | 29.2 | 31.3 | 33.4 |
| Min | 24.8 | 28.3 | 28.6 | 26.1 | 29.7 | 29.9 | 27.4 | 29.6 | 30.2 |
| Avg | 25.9 | 29.0 | 29.7 | 26.4 | 30.0 | 31.1 | 28.2 | 30.5 | 31.7 |
| STD | 0.8 | 0.4 | 0.7 | 0.2 | 0.2 | 0.7 | 0.6 | 0.6 | 1.1 |
References
- Hussain, M.; Bhat, N. World population statistics: Some key findings. Res. J. Soc. Sci. 2018, 9, 16–25. [Google Scholar]
- Wang, X.J.; Kang, M.Z.; Lewlomphaisarl, U.; Hua, J.; Wang, H.Y. Optimal control of plant growth in a plant factory using a plant model. In Proceedings of the 2022 Australian & New Zealand Control Conference (ANZCC), Gold Coast, Australia, 24–25 November 2022; pp. 166–170. [Google Scholar] [CrossRef]
- Keatinge, J.D.H.; Yang, R.Y.; Hughes, J.D.A.; Easdown, W.J.; Holmer, R. The importance of vegetables in ensuring both food and nutritional security in attainment of the Millennium Development Goals. Food Secur. 2011, 3, 491–501. [Google Scholar] [CrossRef]
- Schreinemachers, P.; Simmons, E.B.; Wopereis, M.C. Tapping the economic and nutritional power of vegetables. Glob. Food Secur. 2018, 16, 36–45. [Google Scholar] [CrossRef]
- Dhandevi, P.E.M.; Jeewon, R. Fruit and vegetable intake: Benefits and progress of nutrition education interventions-narrative review article. Iran. J. Public Health 2015, 44, 1309. [Google Scholar]
- Gregorio, N.O.; Herbohn, J.L.; Harrison, S.R. Guide to Quality Seedling Production in Smallholder Nurseries; Visayas State University: Leyte, Philippines, 2010; pp. 1–43. [Google Scholar]
- Huang, K.L.; Yang, C.L.; Kuo, C.M. Plant factory crop scheduling considering volume, yield changes and multi-period harvests using Lagrangian relaxation. Biosyst. Eng. 2020, 200, 328–337. [Google Scholar] [CrossRef]
- Kozai, T.; Niu, G.; Takagaki, M. Plant Factory: An Indoor Vertical Farming System for Efficient Quality Food Production; Academic Press: New York, NY, USA, 2015; pp. 1–405. [Google Scholar]
- Park, Y.; Gómez, C.; Runkle, E.S. Indoor production of ornamental seedlings, vegetable transplants, and microgreens. In Plant Factory Basics, Applications and Advances; Academic Press: New York, NY, USA, 2022; pp. 351–375. [Google Scholar]
- Singh, H.; Sethi, S.; Kaushik, P.; Fulford, A. Grafting vegetables for mitigating environmental stresses under climate change: A review. J. Water Clim. Chang. 2020, 11, 1784–1797. [Google Scholar] [CrossRef]
- Galieni, A.; D’Ascenzo, N.; Stagnari, F.; Pagnani, G.; Xie, Q.; Pisante, M. Past and future of plant stress detection: An overview from remote sensing to positron emission tomography. Front. Plant Sci. 2021, 11, 609155. [Google Scholar] [CrossRef] [PubMed]
- Gull, A.; Lone, A.A.; Wani, N.U.I. Biotic and abiotic stresses in plants. In Abiotic and Biotic Stress in Plants; IntechOpen: London, UK, 2019; pp. 1–19. [Google Scholar]
- Bhattacharya, A. Effect of low-temperature stress on germination, growth, and phenology of plants: A review. In Physiological Processes in Plants under Low Temperature Stress; Springer: Singapore, 2022; pp. 1–106. [Google Scholar]
- Blum, A.; Blum, A. Plant water relations, plant stress and plant production. In Plant Breeding for Water-Limited Environments; Springer: New York, NY, USA, 2011; pp. 11–52. [Google Scholar]
- Araus, J.L.; Cairns, J.E. Field high-throughput phenotyping: The new crop breeding frontier. Trends Plant Sci. 2014, 19, 52–61. [Google Scholar] [CrossRef]
- Gruda, N.S. Increasing sustainability of growing media constituents and stand-alone substrates in soilless culture systems. Agronomy 2019, 9, 298. [Google Scholar] [CrossRef]
- Finch-Savage, W.E.; Bassel, G.W. Seed vigour and crop establishment: Extending performance beyond adaptation. J. Exp. Bot. 2016, 67, 567–591. [Google Scholar] [CrossRef]
- Reed, R.C.; Bradford, K.J.; Khanday, I. Seed germination and vigor: Ensuring crop sustainability in a changing climate. Heredity 2022, 128, 450–459. [Google Scholar] [CrossRef] [PubMed]
- Riikonen, J.; Luoranen, J. Seedling Production and the Field Performance of Seedlings. Forests 2018, 9, 740. [Google Scholar] [CrossRef]
- Ebone, L.A.; Caverzan, A.; Tagliari, A.; Chiomento, J.L.T.; Silveira, D.C.; Chavarria, G. Soybean Seed Vigor: Uniformity and Growth as Key Factors to Improve Yield. Agronomy 2020, 10, 545. [Google Scholar] [CrossRef]
- Houetohossou, S.C.A.; Houndji, V.R.; Hounmenou, C.G.; Sikirou, R.; Kakaï, R.L.G. Deep learning methods for biotic and abiotic stresses detection and classification in fruits and vegetables: State of the art and perspectives. Artif. Intell. Agric. 2023, 9, 46–60. [Google Scholar] [CrossRef]
- Al-Tamimi, N.; Langan, P.; Bernád, V.; Walsh, J.; Mangina, E.; Negrão, S. Capturing crop adaptation to abiotic stress using image-based technologies. Open Biol. 2022, 12, 210353. [Google Scholar] [CrossRef]
- Rossi, R.; Costafreda-Aumedes, S.; Leolini, L.; Leolini, C.; Bindi, M.; Moriondo, M. Implementation of an algorithm for automated phenotyping through plant 3D-modeling: A practical application on the early detection of water stress. Comput. Electron. Agric. 2022, 197, 106937. [Google Scholar] [CrossRef]
- Mahlein, A.K. Plant disease detection by imaging sensors–parallels and specific demands for precision agriculture and plant phenotyping. Plant Dis. 2016, 100, 241–251. [Google Scholar] [CrossRef]
- Barbedo, J.G.A.; Garcia, J. Digital image processing techniques for detecting, quantifying and classifying plant diseases. SpringerPlus 2013, 2, 660. [Google Scholar] [CrossRef]
- Gebejes, A.; Huertas, R. Texture characterization based on grey-level co-occurrence matrix. Databases 2013, 9, 375–378. [Google Scholar]
- Sun, Y.; Tong, C.; He, S.; Wang, K.; Chen, L. Identification of nitrogen, phosphorus, and potassium deficiencies based on temporal dynamics of leaf morphology and color. Sustainability 2018, 10, 762. [Google Scholar] [CrossRef]
- Latte, M.V.; Shidnal, S.; Anami, B.S. Rule based approach to determine nutrient deficiency in paddy leaf images. Int. J. Agric. Technol. 2017, 13, 227–245. [Google Scholar]
- Franchetti, B.; Ntouskos, V.; Giuliani, P.; Herman, T.; Barnes, L.; Pirri, F. Vision Based Modeling of Plants Phenotyping in Vertical Farming under Artificial Lighting. Sensors 2019, 19, 4378. [Google Scholar] [CrossRef] [PubMed]
- Paul, K.; Chatterjee, S.S.; Pai, P.; Varshney, A.; Juikar, S.; Prasad, V.; Bhadra, B.; Dasgupta, S. Viable smart sensors and their application in data driven agriculture. Comput. Electron. Agric. 2022, 198, 107096. [Google Scholar] [CrossRef]
- Xie, X.; Zhang, X.; He, B.; Liang, D.; Zhang, D.; Huang, L. A System for Diagnosis of Wheat Leaf Diseases Based on Android Smartphone. In Proceedings of the International Symposium on Optical Measurement Technology and Instrumentation, Beijing, China, 9–11 May 2016. [Google Scholar]
- Naik, H.S.; Zhang, J.; Lofquist, A.; Assefa, T.; Sarkar, S.; Ackerman, D.; Singh, A.; Singh, A.K.; Ganapathysubramanian, B. A real-time phenotyping framework using machine learning for plant stress severity rating in soybean. Plant Methods 2017, 13, 23. [Google Scholar] [CrossRef] [PubMed]
- Watchareeruetai, U.; Noinongyao, P.; Wattanapaiboonsuk, C.; Khantiviriya, P.; Duangsrisai, S. Identification of Plant Nutrient Deficiencies Using Convolutional Neural Networks; IEEE: Krabi, Thailand, 2018; pp. 1–4. [Google Scholar]
- Islam, M.; Anh, D.; Wahid, K.; Bhowmik, P. Detection of potato diseases using image segmentation and multiclass support vector machine. In Proceedings of the 2017 IEEE 30th Canadian Conference on Electrical and Computer Engineering (CCECE), Windsor, ON, Canada, 30 April–3 May 2017; pp. 1–4. [Google Scholar]
- Wernick, M.N.; Yang, Y.; Brankov, J.G.; Yourganov, G.; Strother, S.C. Machine learning in medical imaging. IEEE Signal Process. Mag. 2010, 27, 25–38. [Google Scholar] [CrossRef] [PubMed]
- Singh, A.; Ganapathysubramanian, B.; Singh, A.K.; Sarkar, S. Machine learning for high-throughput stress phenotyping in plants. Trends Plant Sci. 2016, 21, 110–124. [Google Scholar] [CrossRef] [PubMed]
- Chemura, A.; Mutanga, O.; Sibanda, M.; Chidoko, P. Machine learning prediction of coffee rust severity on leaves using spectroradiometer data. Trop. Plant Pathol. 2018, 43, 117–127. [Google Scholar] [CrossRef]
- Wicaksono, Y.; Wahono, R.; Suhartono, V. Color and texture feature extraction using gabor filter-local binary patterns for image segmentation with fuzzy C-means. J. Intell. Syst. 2015, 1, 15–21. [Google Scholar]
- Sharma, J.; Upadhyay, A.K.; Adsule, P.G.; Sawant, S.D.; Sharma, A.K.; Satisha, J.; Yadav, D.S.; Ramteke, S.D. Effect of climate change on grape and its value-added products. In Climate-Resilient Horticulture: Adaptation and Mitigation Strategies; Springer: New Delhi, India, 2013; pp. 67–80. [Google Scholar]
- Karadağ, K.; Tenekeci, M.E.; Taşaltın, R.; Bilgili, A. Detection of pepper fusarium disease using machine learning algorithms based on spectral reflectance. Sustain. Comput. Inform. Syst. 2020, 28, 100299. [Google Scholar] [CrossRef]
- Cen, H.; Weng, H.; Yao, J.; He, M.; Lv, J.; Hua, S.; Li, H.; He, Y. Chlorophyll fluorescence imaging uncovers photosynthetic fingerprint of citrus Huanglongbing. Front. Plant Sci. 2017, 8, 1509. [Google Scholar] [CrossRef]
- Prasad, S.; Kumar, P.; Hazra, R.; Kumar, A. Plant Leaf Disease Detection Using Gabor Wavelet Transform. In Proceedings of the 3rd International Conference on Swarm, Evolutionary, and Memetic Computing, Bhubaneswar, India, 20–22 December 2012; Springer: Berlin/Heidelberg, Germany, 2012. [Google Scholar]
- Yan, Z.; He, D.; Niu, G.; Zhai, H. Evaluation of growth and quality of hydroponic lettuce at harvest as affected by the light intensity, photoperiod and light quality at seedling stage. Sci. Hortic. 2019, 248, 138–144. [Google Scholar] [CrossRef]
- Son, K.H.; Kim, E.Y.; Oh, M.M. Growth and development of cherry tomato seedlings grown under various combined ratios of red to blue LED lights and fruit yield and quality after transplanting. J. Bio-Environ. Control 2018, 27, 54–63. [Google Scholar] [CrossRef]
- Liu, N.; Ji, F.; Xu, L.; He, D. Effects of LED light quality on the growth of pepper seedling in plant factory. Int. J. Agric. Biol. Eng. 2019, 12, 44–50. [Google Scholar] [CrossRef]
- Hwang, H.; An, S.; Lee, B.; Chun, C. Improvement of growth and morphology of vegetable seedlings with supplemental far-red enriched led lights in a plant factory. Horticulturae 2020, 6, 109. [Google Scholar] [CrossRef]
- An, S.; Hwang, H.; Chun, C.; Jang, Y.; Lee, H.J.; Wi, S.H.; Yeo, K.H.; Yu, I.H.; Kwack, Y. Evaluation of air temperature, photoperiod and light intensity conditions to produce cucumber scions and rootstocks in a plant factory with artificial lighting. Horticulturae 2021, 7, 102. [Google Scholar] [CrossRef]
- Mickens, M.A.; Torralba, M.; Robinson, S.A.; Spencer, L.E.; Romeyn, M.W.; Massa, G.D.; Wheeler, R.M. Growth of red pak choi under red and blue, supplemented white, and artificial sunlight provided by LEDs. Sci. Hortic. 2019, 245, 200–209. [Google Scholar] [CrossRef]
- Islam, S.; Reza, M.N.; Chowdhury, M.; Islam, M.N.; Ali, M.; Kiraga, S.; Chung, S.O. Image processing algorithm to estimate ice-plant leaf area from RGB images under different light conditions. In IOP Conference Series: Earth and Environmental Science; IOP Publishing: Bristol, UK, 2021; Volume 924, p. 012013. [Google Scholar]
- Fattori, V.; Hohmann, M.S.; Rossaneis, A.C.; Pinho-Ribeiro, F.A.; Verri, W.A., Jr. Capsaicin: Current understanding of its mechanisms and therapy of pain and other pre-clinical and clinical uses. Molecules 2016, 21, 844. [Google Scholar] [CrossRef]
- Shaha, R.K.; Rahman, S.; Asrul, A. Bioactive compounds in chilli peppers (Capsicum annuum L.) at various ripening (green, yellow and red) stages. Ann. Biol. Res. 2013, 4, 27–34. [Google Scholar]
- Fang, H.; Baret, F.; Plummer, S.; Schaepman-Strub, G. An overview of global leaf area index (LAI): Methods, products, validation, and applications. Rev. Geophys. 2019, 57, 739–799. [Google Scholar] [CrossRef]
- Gu, S.; Zuo, W.; Guo, S.; Chen, Y.; Chen, C.; Zhang, L. Learning dynamic guidance for depth image enhancement. In Proceedings of the IEEE Conference on Computer Vision and Pattern Recognition, Honolulu, HI, USA, 21–26 July 2017; pp. 3769–3778. [Google Scholar]
- Li, J.; Tang, L. Developing a low-cost 3D plant morphological traits characterization system. Comput. Electron. Agric. 2017, 143, 1–13. [Google Scholar] [CrossRef]
- Piazzoli, G. Thermal Imaging to Monitor Soil and Canopy Temperature under Mulching and Natural Soil Cover Conditions. Doctoral Dissertation, Instituto Superior de Agronomia, Universidade de Lisboa, Lisbon, Portugal, 2022. [Google Scholar]
- Singh, V.; Sharma, N.; Singh, S. A review of imaging techniques for plant disease detection. Artif. Intell. Agric. 2020, 4, 229–242. [Google Scholar] [CrossRef]
- Zhang, H.; Zhao, Y.; Zhu, J.K. Thriving under stress: How plants balance growth and the stress response. Dev. Cell 2020, 55, 529–543. [Google Scholar] [CrossRef]
- Luo, Q.; Xie, H.; Chen, Z.; Ma, Y.; Yang, H.; Yang, B.; Ma, Y. Morphology, photosynthetic physiology and biochemistry of nine herbaceous plants under water stress. Front. Plant Sci. 2023, 14, 1147208. [Google Scholar] [CrossRef]
- Parkash, V.; Singh, S. Potential of biochar application to mitigate salinity stress in eggplant. HortScience 2020, 55, 1946–1955. [Google Scholar] [CrossRef]
- Zheng, G.; Moskal, L.M. Retrieving leaf area index (LAI) using remote sensing: Theories, methods and sensors. Sensors 2009, 9, 2719–2745. [Google Scholar] [CrossRef] [PubMed]
- Parkash, V.; Singh, S. A review on potential plant-based water stress indicators for vegetable crops. Sustainability 2020, 12, 3945. [Google Scholar] [CrossRef]
- Kausar, A.; Ashraf, M.Y.; Ali, I.; Niaz, M.; Abbass, Q. Evaluation of sorghum varieties/lines for salt tolerance using physiological indices as screening tool. Pak. J. Bot. 2012, 44, 47–52. [Google Scholar]
- Bita, C.E.; Gerats, T. Plant tolerance to high temperature in a changing environment: Scientific fundamentals and production of heat stress-tolerant crops. Front. Plant Sci. 2013, 4, 273. [Google Scholar] [CrossRef]
- Hasanuzzaman, M.; Nahar, K.; Alam, M.M.; Roychowdhury, R.; Fujita, M. Physiological, biochemical, and molecular mechanisms of heat stress tolerance in plants. Int. J. Mol. Sci. 2013, 14, 9643–9684. [Google Scholar] [CrossRef]
- Dikšaitytė, A.; Viršilė, A.; Žaltauskaitė, J.; Januškaitienė, I.; Juozapaitienė, G. Growth and photosynthetic responses in Brassica napus differ during stress and recovery periods when exposed to combined heat, drought and elevated CO2. Plant Physiol. Biochem. 2019, 142, 59–72. [Google Scholar] [CrossRef]
- Wang, C.; He, J.; Zhao, T.H.; Cao, Y.; Wang, G.; Sun, B.; Yan, X.; Guo, W.; Li, M.H. The smaller the leaf is, the faster the leaf water loses in a temperate forest. Front. Plant Sci. 2019, 10, 58. [Google Scholar] [CrossRef] [PubMed]
- Pepe, M.; Gratani, L.; Crescente, M.F.; Puglielli, G.; Varone, L. Daily Temperature Effect on Seedling Growth Dynamic of Three Invasive Alien Species. Front. Plant Sci. 2022, 13, 837449. [Google Scholar] [CrossRef] [PubMed]
- Ahmad, H.M.; Fiaz, S.; Hafeez, S.; Zahra, S.; Shah, A.N.; Gul, B.; Aziz, O.; Rahman, M.; Fakhar, A.; Rafique, M.; et al. Plant growth-promoting rhizobacteria eliminate the effect of drought stress in plants: A review. Front. Plant Sci. 2022, 13, 875774. [Google Scholar] [CrossRef] [PubMed]
- Osakabe, Y.; Osakabe, K.; Shinozaki, K.; Tran, L.S.P. Response of plants to water stress. Front. Plant Sci. 2014, 5, 86. [Google Scholar] [CrossRef] [PubMed]
- Seleiman, M.F.; Al-Suhaibani, N.; Ali, N.; Akmal, M.; Alotaibi, M.; Refay, Y.; Dindaroglu, T.; Abdul-Wajid, H.H.; Battaglia, M.L. Drought stress impacts on plants and different approaches to alleviate its adverse effects. Plants 2021, 10, 259. [Google Scholar] [CrossRef] [PubMed]
- Mesa, T.; Polo, J.; Arabia, A.; Caselles, V.; Munné-Bosch, S. Differential physiological response to heat and cold stress of tomato plants and its implication on fruit quality. J. Plant Physiol. 2022, 268, 153581. [Google Scholar] [CrossRef]
- Virk, G.; Snider, J.L.; Chee, P.; Jespersen, D.; Pilon, C.; Rains, G.; Roberts, P.; Kaur, N.; Ermanis, A.; Tishchenko, V. Extreme temperatures affect seedling growth and photosynthetic performance of advanced cotton genotypes. Ind. Crops Prod. 2021, 172, 114025. [Google Scholar] [CrossRef]
- Haj Sghaier, A.; Tarnawa, Á.; Khaeim, H.; Kovács, G.P.; Gyuricza, C.; Kende, Z. The Effects of Temperature and Water on the Seed Germination and Seedling Development of Rapeseed (Brassica napus L.). Plants 2022, 11, 2819. [Google Scholar] [CrossRef]
- Zhang, J.; Ge, J.; Dayananda, B.; Li, J. Effect of light intensities on the photosynthesis, growth and physiological performances of two maple species. Front. Plant Sci. 2022, 13, 999026. [Google Scholar] [CrossRef]
- Chen, H.; Wang, L.; Guo, S.; Li, M.; Tian, Z.; Han, B.; Tang, X.; Liu, B. Effects of Light Intensity on Seedling Emergence and Early Growth of Liquidambar formosana Hance. Forests 2023, 14, 867. [Google Scholar] [CrossRef]
- Franchetti, B.; Pirri, F. Detection and localization of tip-burn on large lettuce canopies. Front. Plant Sci. 2022, 13, 874035. [Google Scholar] [CrossRef] [PubMed]
- Kumari, V.V.; Banerjee, P.; Verma, V.C.; Sukumaran, S.; Chandran, M.A.S.; Gopinath, K.A.; Venkatesh, G.; Yadav, S.K.; Singh, V.K.; Awasthi, N.K. Plant Nutrition: An Effective Way to Alleviate Abiotic Stress in Agricultural Crops. Int. J. Mol. Sci. 2022, 23, 8519. [Google Scholar] [CrossRef] [PubMed]
- Jackson, R.D.; Idso, S.; Reginato, R.; Pinter, P. Canopy temperature as a crop water stress indicator. Water Resour. Res. 1981, 17, 1133–1138. [Google Scholar] [CrossRef]
- Zarco-Tejada, P.J.; González-Dugo, V.; Berni, J.A. Fluorescence, temperature and narrow-band indices acquired from a UAV platform for water stress detection using a micro-hyperspectral imager and a thermal camera. Remote Sens. Environ. 2012, 117, 322–337. [Google Scholar] [CrossRef]


| Ambient environment parameters for the experiments | ||||||||||
| Ambient conditions | Growth chamber | |||||||||
| Chamber 1 | Chamber 2 | Chamber 3 | Chamber 4 | Chamber 5 | ||||||
| Photoperiod | Day (10 h) | Night (14 h) | Day (10 h) | Night (14 h) | Day (10 h) | Night (14 h) | Day (10 h) | Night (14 h) | Day (10 h) | Night (14 h) |
| Temperature (°C) | 20 | 15 | 25 | 20 | 25 | 20 | 25 | 20 | 30 | 25 |
| Light intensity (µmol m−2s−1) | 250 | 0 | 50, 250, 450 | 0 | 250 | 0 | 250 | 0 | 250 | 0 |
| EC (dS·m−1) | 1.0 | 1.0 | 1.0, 3.0, 6.0 | 1.0 | 1.0 | |||||
| Water (L/tray/day) | 1.0 | 1.0 | 1.0, 0.75, 0.50 | 1.0 | 1.0 | |||||
| pH | 6.5 | |||||||||
| Humidity (%) | 60 ± 5 | |||||||||
| CO2 (ppm) | 600–800 | |||||||||
| Air flow | Static | |||||||||
| Light type | Fluorescent (daylight, 2900 lm) | |||||||||
| Control and stress conditions used in this study for six varieties of seedlings | ||||||||||
| Ambient conditions | Seedling conditions | |||||||||
| Healthy group | Stress group | |||||||||
| Day (10 h) | Night (14 h) | Day (10 h) | Night (14 h) | |||||||
| Temperature (°C) | 25 | 20 | 20, 30 | 15, 25 | ||||||
| Light intensity (µmol m−2s−1) | 250 | 0 | 50, 450 | 0 | ||||||
| EC (dS m−1) | 1.0 | 3.0, 6.0 | ||||||||
| Water supply (L/tray/day) | 1.0 | 0.75, 0.50 | ||||||||
| Solution A | KNO3 (Potassium Nitrate) |
| Ca(NO3)2·4H2O (Calcium Nitrate Tetra Hydrate) | |
| Fe-EDTA (Iron Chelate) | |
| Solution B | KNO3 (Potassium Nitrate) |
| MgSO4·7H2O (Magnesium Sulfate) | |
| NH4H2PO4 (Monosic Ammonium Phosphate) | |
| H3BO3 (Boric Acid) | |
| MnSO4·H2O (Manganese Sulfate) | |
| ZnSO4·7H2O (Zinc Sulfate) | |
| CuSO4·5H2O (Copper Sulfate) | |
| NaMoO4·2H2O (Sodium Molybdate) |
| Item | Specifications | ||
|---|---|---|---|
| RGB Camera | Depth Camera | Thermal Camera | |
| Model | Camera module V2 | RealSense D435i | Compact Pro |
| Company | Raspberry Pi | Intel | Seek |
| Sensor | Sony IMX 219 | Global shutter | Microbolometer |
| Resolution (MP) | 8.0 | 2.0 MP | – |
| Frame size (pixel) | 3280 × 2464 | 1920 × 1080 | 320 × 240 |
| Depth frame size (pixel) | – | 1280 × 720 | – |
| Depth method | – | Stereoscopic | – |
| Frame rate (fps) | 30, 60 | 30 | >15 |
| Field of view | 62.2° × 48.8° | 87° × 58° | 32° × 32° |
| Depth range (m) | – | 0.3–3.0 | – |
| Temperature sensing range (°C) | – | – | −40~330 |
| Control | Automatic | Automatic | Automatic |
| Connection | 15-pin FFC | USB-C 3.1 | USB-C |
Disclaimer/Publisher’s Note: The statements, opinions and data contained in all publications are solely those of the individual author(s) and contributor(s) and not of MDPI and/or the editor(s). MDPI and/or the editor(s) disclaim responsibility for any injury to people or property resulting from any ideas, methods, instructions or products referred to in the content. |
© 2024 by the authors. Licensee MDPI, Basel, Switzerland. This article is an open access article distributed under the terms and conditions of the Creative Commons Attribution (CC BY) license (https://creativecommons.org/licenses/by/4.0/).
Share and Cite
Islam, S.; Reza, M.N.; Ahmed, S.; Samsuzzaman; Cho, Y.J.; Noh, D.H.; Chung, S.-O. Seedling Growth Stress Quantification Based on Environmental Factors Using Sensor Fusion and Image Processing. Horticulturae 2024, 10, 186. https://doi.org/10.3390/horticulturae10020186
Islam S, Reza MN, Ahmed S, Samsuzzaman, Cho YJ, Noh DH, Chung S-O. Seedling Growth Stress Quantification Based on Environmental Factors Using Sensor Fusion and Image Processing. Horticulturae. 2024; 10(2):186. https://doi.org/10.3390/horticulturae10020186
Chicago/Turabian StyleIslam, Sumaiya, Md Nasim Reza, Shahriar Ahmed, Samsuzzaman, Yeon Jin Cho, Dong Hee Noh, and Sun-Ok Chung. 2024. "Seedling Growth Stress Quantification Based on Environmental Factors Using Sensor Fusion and Image Processing" Horticulturae 10, no. 2: 186. https://doi.org/10.3390/horticulturae10020186