Article

Localization of S-Locus-Related Self-Incompatibility in Lycium barbarum Based on BSA Analysis

1
School of Biological Science and Engineering, North Minzu University, Yinchuan 750021, China
2
State Key Laboratory of Efficient Production of Forest Resources, Yinchuan 750004, China
3
Institute of Goji, Ningxia Academy of Agriculture and Forestry Sciences, Yinchuan 750004, China
4
Ningxia Grape and Wine Innovation Center, North Minzu University, Yinchuan 750021, China
*
Authors to whom correspondence should be addressed.
Horticulturae 2024, 10(2), 190; https://doi.org/10.3390/horticulturae10020190
Submission received: 5 January 2024 / Revised: 6 February 2024 / Accepted: 15 February 2024 / Published: 18 February 2024
(This article belongs to the Section Genetics, Genomics, Breeding, and Biotechnology (G2B2))

Abstract

:
The recognition of pollen and pistil in the self-incompatibility process is generally determined by the interaction between the pollen S gene and pistil S gene located at the S locus. However, the regulatory mechanism of self-incompatibility in goji remains unknown. In this study, we used the self-compatible strain ‘13–19’ and self-incompatible strain ‘xin9’ from Ningxia as parents to create an F1 hybrid population. Reciprocal cross-pollination was performed within the same plant to evaluate the self-compatibility of the parents and F1 progeny. The parents and progeny were subjected to whole-genome resequencing, and mixed pools of DNA were constructed using 30 self-compatible and 30 self-incompatible individuals. Association analysis using the SNP-index method and Euclidean distance was employed to identify the key candidate region of the S locus. The candidate region was further annotated using the Swiss-Prot database to identify genes within the region. Additionally, transcriptome sequencing data from different organs/tissues, as well as from pistils of self-compatible and self-incompatible strains at control (0 h), short (0.5 h), medium (8 h), and long (48 h) time points after self-pollination and cross-pollination, were analyzed to assess differential gene expression and screen for self-compatibility-related loci. Specific primers were designed for PCR amplification to determine the S-RNase genotypes of the extreme parents. The results revealed that the S locus in goji is located within a 32.2 Mb region on chromosome 2 that contains a total of 108 annotated genes. Differential expression analysis showed that ten genes, including Lba02g01064, were specifically expressed in stamens, with four of them annotated as F-box genes, potentially serving as determinants of self-compatibility in stamens. Lba02g01102 was exclusively expressed in pistils and annotated as an S-RNase gene, likely involved in self-compatibility. The expression of Lba02g01102 in pistils decreased after self-pollination and cross-pollination. Six candidate genes exhibited significant changes after self-pollination and cross-pollination. Both parents and progeny carried two S-RNase alleles, and the S-RNase genotypes showed a significant correlation with self-compatibility, with the self-compatible progeny containing the S8-RNase allele. The identification of the S locus in goji provides molecular markers for future marker-assisted breeding and offers genetic resources for studying the mechanism of self-incompatibility in goji, thus contributing to the improvement of goji varieties.

1. Introduction

Goji (Lycium barbarum), a perennial deciduous shrub of the genus Lycium within the Solanaceae family, is extensively distributed across China, Europe, the Americas, and the Mediterranean region. The fruits of goji, known as goji berries, serve as a traditional dual-purpose crop in China, being utilized both medicinally and as a food source. They possess a sweet taste and a neutral nature and are reputed to confer health benefits such as nourishing the kidneys, moistening the lungs, enriching the liver, and enhancing the blood, as well as strengthening the kidneys and nurturing Yang [1]. Goji represents a significant economic crop in the arid and semi-arid regions of northwest China, making a substantial contribution to local economic development and ecological security. In recent years, the goji industry has witnessed rapid expansion, with the emergence of numerous high-yielding and superior varieties. Nonetheless, certain of these varieties, despite thriving in mixed plantings, may encounter issues such as severe flower and fruit drop, irregular fruit size, low fruit set, and even crop failure when planted extensively as a single variety. Researchers have explored the self-compatibility of various goji varieties in Ningxia. Their findings suggest that, with the exception of ‘Ningqi 1’ and ‘Ningqi 7’, which demonstrate higher self-compatibility, most other varieties are self-incompatible, exhibiting very low levels of self-compatibility [2]. Typically, a plant’s self-incompatibility is dictated by two S genes (pollen S gene and stylar S gene) at the S locus. In instances where the pollen and stigma share the same S haplotype, the growth of the pollen tube is impeded [3]. To date, no research has been conducted on the S genes that govern the self-compatibility of goji, and investigating the regulatory mechanism of self-compatibility in goji is of paramount importance for the breeding and improvement of the crop.
Self-incompatibility (SI) in plants is a fundamental recognition system that enables plants to distinguish between their own pollen and that of other individuals, thereby preventing the germination or growth of their own pollen or pollen from different plants of the same species on their stigma. SI is a prevalent phenomenon in flowering plants and serves to avoid inbreeding, promote outcrossing, and thereby enhance the survival and adaptability of offspring [4,5]. The investigation of SI originated in the 1870s when Darwin first observed and described the phenomenon [6]. Since the early 20th century, scientists have conducted field surveys and hybrid experiments to study SI, and interest in this research area has been continually growing. Currently, research into the molecular and biochemical mechanisms underlying SI recognition is largely focused on plants within five families: Solanaceae, Rosaceae, Scrophulariaceae, Papaveraceae, and Cruciferae [4,7,8].
Within the Solanaceae family, which includes tomatoes and potatoes, the specific recognition between pollen and stigma is mediated by S-RNase (S-secreted RNase) as a key determinant. S-RNase is a family of secreted glycoproteins that is exclusively expressed in the stigma and primarily localized within the cells or intercellular spaces of the stigma’s guiding tissue. These proteins can inhibit the growth of their own pollen tubes, thus preventing self-pollination [9]. The pollen S-determinant, which encodes a class of proteins with an F-box domain known as SLF (S-locus F-box) proteins, is a component of the E3 ubiquitin ligase complex SCF (Skp1-Cullin1-F-box). SLF proteins are essential for the recognition process between pollen and stigma [10]. In recent years, mounting evidence has suggested that self-incompatibility recognition is not solely governed by S factors but involves a complex response involving multiple other loci. Non-S factors implicated in the self-incompatibility response are primarily proteins that play critical roles at various stages of the reaction. Non-S factors identified as contributing to self-incompatibility include calcium-binding proteins (CaBP), ubiquitin-binding proteins, SKP1-like proteins, S-RNase-binding proteins (SBP1), S-locus F-box-interacting proteins, and actin depolymerizing factors (ADF) [11,12,13,14].
Quantitative trait locus (QTL) mapping, harnessing high-throughput sequencing technology, is a potent tool for genetic analysis and the pinpointing of functional loci and genes. It has been broadly applied across numerous plant species. QTL mapping has successfully pinpointed loci that govern self-incompatibility in plants such as tomatoes, sunflowers, and ryegrass [15,16,17,18]. Researchers in China have also employed QTL mapping to examine self-compatibility-related loci in crops like Brassica rapa [19]. In goji, QTL mapping analysis has primarily focused on traits associated with fruit yield and quality [20,21,22]. Bulked segregant analysis (BSA), which leverages extreme-phenotype individuals to establish bulk pools, can substantially decrease the workload and cost of sequencing and heighten the efficiency of screening for linked markers. It presents a more cost-effective and expedited alternative to QTL mapping [23]. To date, there have been no reports of BSA’s application in goji.
This study will utilize two goji strains from Ningxia, the self-compatible strain ‘13–19’ and the self-incompatible strain ‘xin9’, as parental lines to generate an F1 hybrid population. BSA will be employed to analyze the extreme-phenotype groups within the F1 population that display self-compatibility and self-incompatibility. The objective is to identify loci associated with self-compatibility in goji and to conduct a further analysis of candidate genes. This research will not only supply a theoretical basis for investigating the molecular mechanisms of self-incompatibility in goji but also furnish genetic and loci resources for molecular marker-assisted breeding. This will contribute to the advancement of goji variety improvement.

2. Materials and Methods
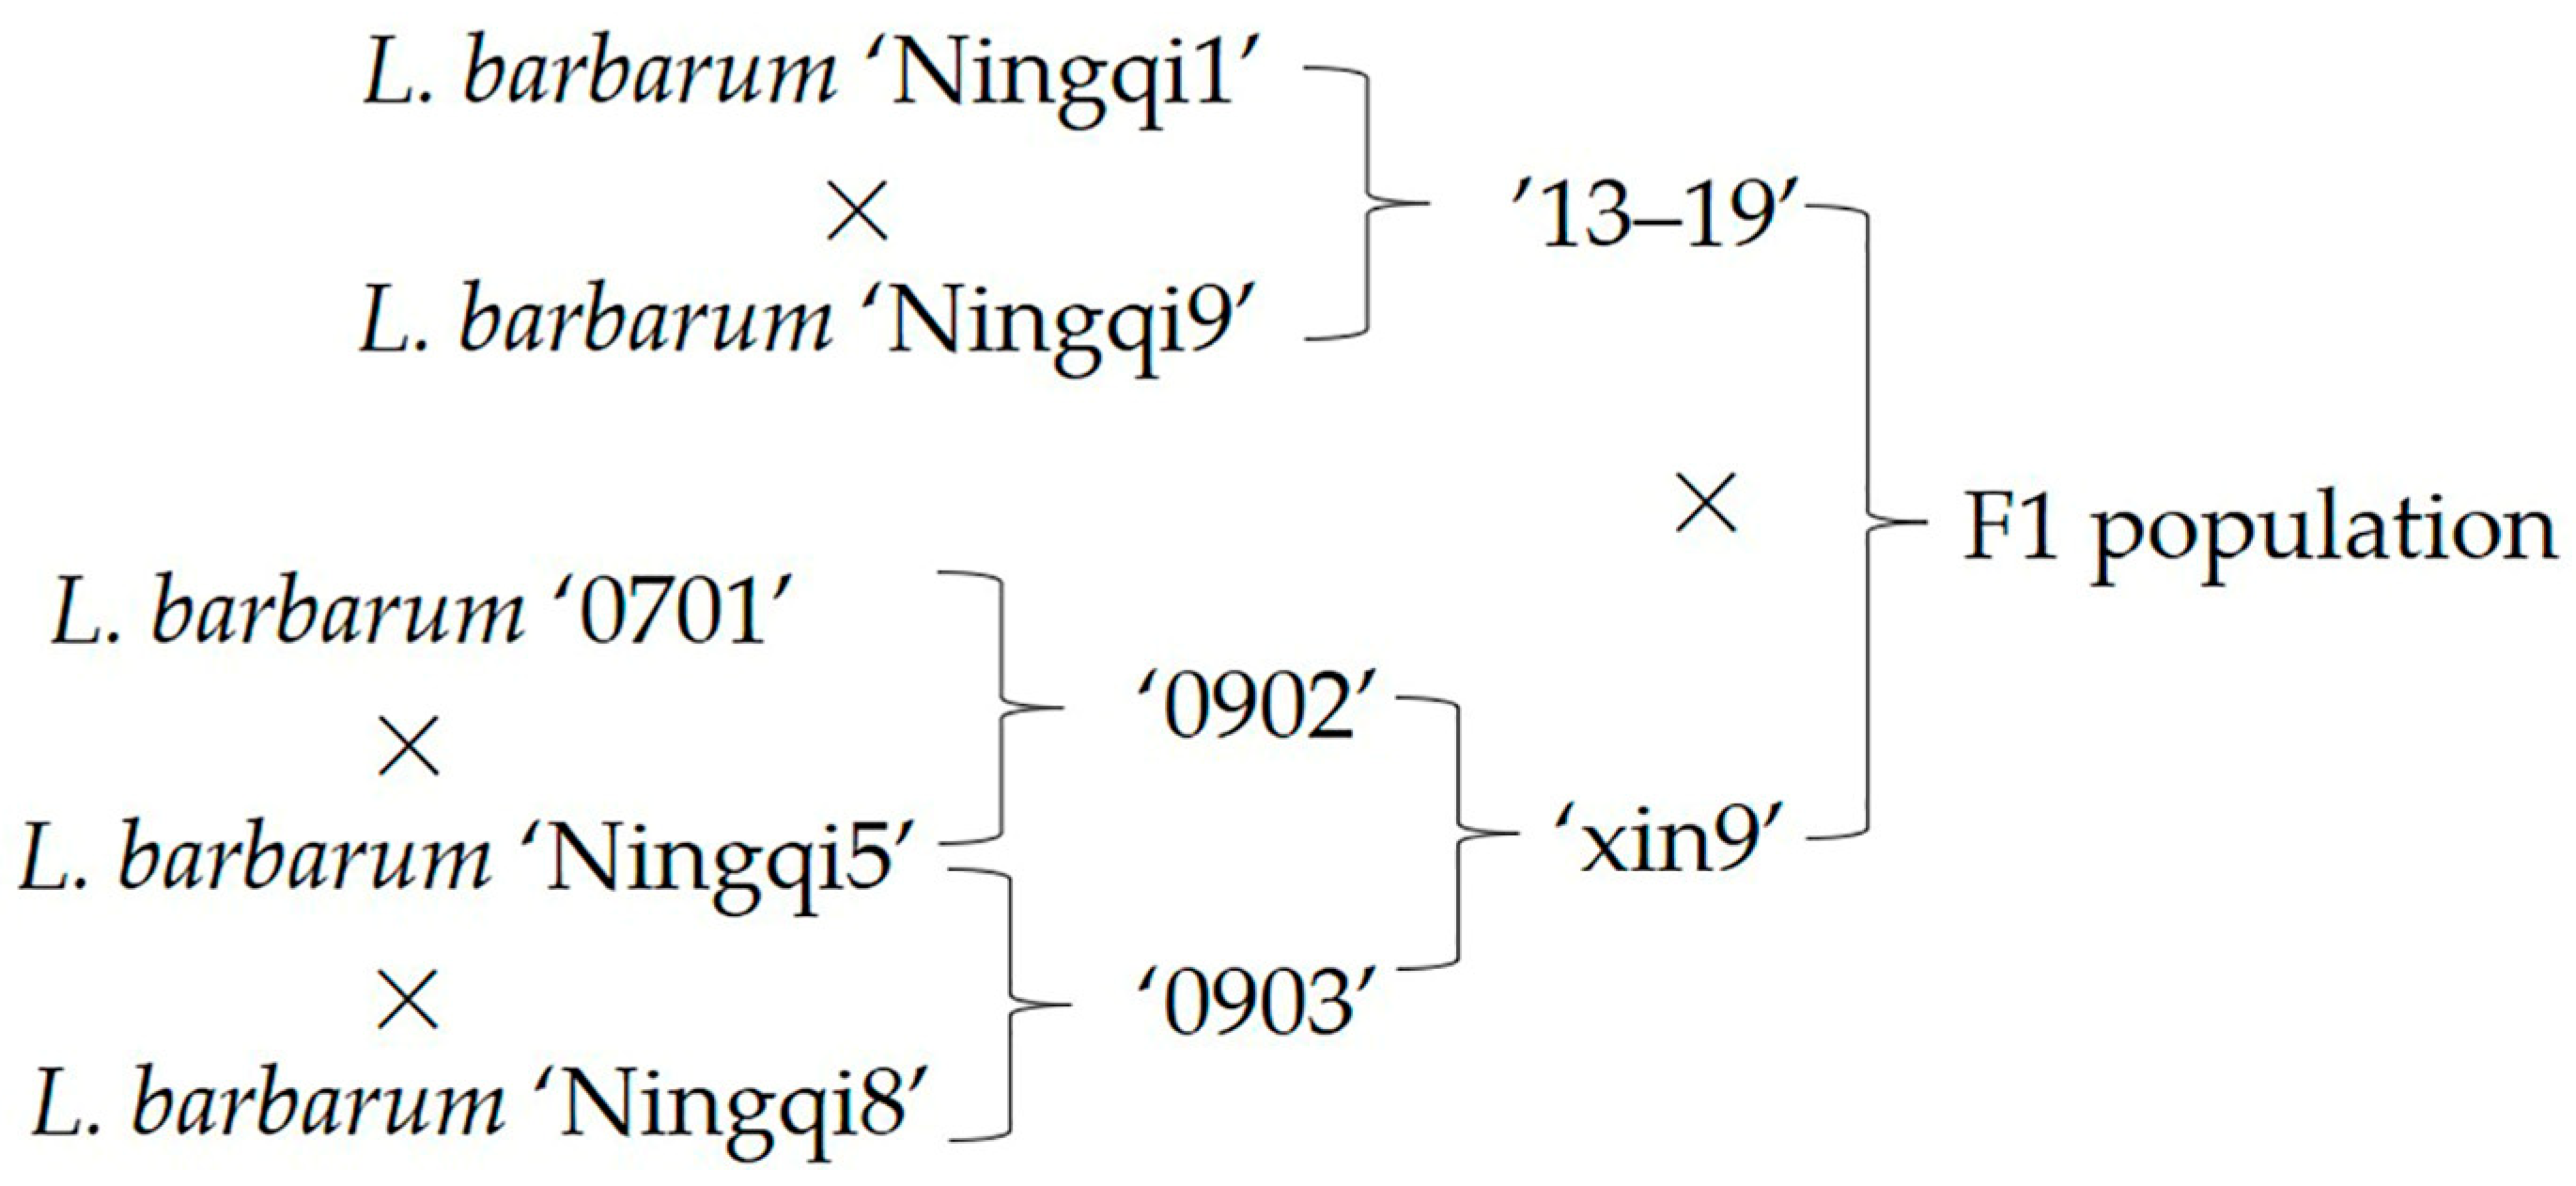
2.1. Materials

This study utilized two premium goji cultivars, ‘xin9’ (self-incompatible) and ‘13–19’ (self-compatible), as parental lines to generate an F1 hybrid population through reciprocal crosses. The cultivar ‘xin 9’ originated from the F1 progeny of (L. barbarum ‘0701 ’ × L. barbarum ‘Ningqi5’) × (L. barbarum ‘Ningqi5’ × L. barbarum ‘Ningqi8’), and ‘13–19’ originated from L. barbarum ‘Ningqi1’ × L. barbarum ‘Ningqi9’ (Figure 1). In 2016, reciprocal cross-pollination was conducted, and the greenhouse seedling raising was completed in the spring of 2017. In May of that year, the seedlings were established at the Luhuatai Goji Germplasm Resource Nursery of the Ningxia Academy of Agricultural and Forestry Sciences (situated at 38°38′ N, 106°9′ E) in Xixia District, Yinchuan City, where they were cultivated using standard agricultural practices.

2.2. Analysis of Phenotypes Related to Self-Compatibility

2.2.1. Pollination

Pollination experiments were conducted during the peak flowering period of the wolfberry in early June of 2021 and 2022. First, 5 to 10 flowers that were about to open but had not yet unfolded their corollas were collected from each plant of the parental lines and the F1 population. These flowers were placed in petri dishes and allowed to shed pollen at room temperature in a cool, shaded area for later use. Second, two days later, flowers that were about to open but had not yet unfolded their corollas were selected from each plant of the parental lines and the F1 population. The anthers were removed, and pollination was carried out using the pollen collected from their own flowers. After pollination, each flower was bagged with a 3 cm × 5 cm kraft paper bag, and 25 flowers were selected from each plant for bagging.

2.2.2. Determining the Number of Ovules

Flowers that were about to open but had not yet unfolded their corollas were collected from each plant of the parents and F1 population. Under a dissecting microscope, an autopsy was performed on the ovaries of the collected flowers using a dissecting needle. The number of ovules contained in each flower’s ovary was recorded, and an average was calculated to determine the number of ovules per plant.

2.2.3. Calculating the Self-Compatibility Index

In early July of the pollination year, fruit harvest and data collection were conducted. For each plant, fruits from self-pollinated flowers were collected within paper bags. The number of paper bags collected per plant (usually 25, with some exceptions due to factors like wind and rain) was recorded, and the number of fruits within each paper bag was counted. Additionally, the weight of the fruits within each paper bag was measured. Seeds from the fruits in the paper bags were collected, and the total number of seeds from the harvested fruits per plant was statistically analyzed.
The following indicators were calculated for each plant to assess self-compatibility:
Fruit Rate (FR) = Number of fruits/Number of harvested paper bags
Average Fruit Weight (AFW) = Total weight/Number of harvested paper bags
Compatibility Index (CI) = Total number of seeds/Number of harvested paper bags
Comparative Compatibility Index (CCI) = Total number of seeds/Number of harvested paper bags/Number of ovules × 100%
These indicators, including fruit rate, average fruit weight, compatibility index, and comparative compatibility index, serve as metrics to evaluate the self-compatibility of the plants.

2.3. Genomic DNA Extraction, Sequencing, and BSA Pooling Localization

DNA was extracted from the tender leaves of parental and F1 population plants using a DNA extraction kit (TianGen Biotech, Beijing, China). DNA quality and quantity were evaluated through agarose gel electrophoresis and Qubit 2.0. DNA samples that passed quality control were utilized to construct resequencing libraries with the GenoBaits DNA-seq Library Prep kit. Following library quality validation, sequencing was conducted on the BGI MGI-2000/MGI-T7 sequencing platform using the PE150 sequencing mode. The raw resequencing data from this study have been submitted to the NCBI database (PRJNA1043408).
In line with the relative selfing compatibility index, 30 plants exhibiting the highest selfing compatibility and 30 plants showing the lowest selfing compatibility were chosen from the F1 population to establish offspring pools. The genotypes of the offspring individuals corresponding to the two pools were isolated using bcftools. The genetic information from the two parents and two pools was combined and formatted into a variation file in vcf format for subsequent analysis.

2.3.1. Association Analysis with Euclidean Distance

The Euclidean distance (ED) algorithm is used to identify markers with significant differences between pools by analyzing sequencing data and to assess the regions linked to traits based on these variances. In theory, the two pools developed in a BSA study should exhibit similarity at all loci, except for those loci linked to the target trait. Consequently, ED values at non-target loci are expected to trend towards zero. The ED calculation is derived from the following formula, where higher ED values suggest a more substantial discrepancy between the two pools for that specific marker.
E D = ( A m u t A w t ) 2 + ( C m u t C w t ) 2 + ( G m u t G w t ) 2 + ( T m u t T w t ) 2
Amut represents the frequency of the A base in the mutant pool, Awt represents the frequency of the A base in the wild-type pool; Cmut represents the frequency of the C base in the mutant pool, Cwt represents the frequency of the C base in the wild-type pool; Gmut represents the frequency of the G base in the mutant pool, Gwt represents the frequency of the G base in the wild-type pool; Tmut represents the frequency of the T base in the mutant pool, Twt represents the frequency of the T base in the wild-type pool.

2.3.2. Index-SNP Association Analysis

Utilizing the SNP data from two parental lines, the SNP-index for each of the two pools is computed, and sites that may be linked to trait segregation are monitored through the ΔSNP-index. The calculation method for the SNP-index is outlined below:
SNP-index (Mut) = ρx/(ρX + ρx)
SNP-index (WT) = ρx/(ρX + ρx)
ΔSNP-index = SNP-index (Mut) − SNP-index (WT)
The ΔSNP-index is employed to examine the discrepancies between the mutation and wild-type pools at each site. To mitigate the risk of false positives, the positions of markers along the genome are utilized to perform a regression analysis on the ΔSNP_index values of markers located on the same chromosome. Regions exceeding the predefined association threshold are then identified as trait-associated regions. This association threshold is determined through a computational simulation that assesses the likelihood of each marker being associated with the target trait.

2.4. Differential Gene Expression Analysis

Utilizing transcriptome sequencing data from various organs of the wolfberry, we obtained the expression levels (FPKM values) of genes within the targeted intervals in the pistil, stamen, stem tip, leaf, green fruit, and red fruit. Genes with consistently zero expression across all stages were excluded. The remaining genes were subjected to gene expression heatmap generation using Tbtools (v2.042) software based on their FPKM values. Furthermore, transcriptome data from the stigma of both self-compatible and self-incompatible wolfberry cultivars were collected at 0 h and at short-term (0.5 h), medium-term (8 h), and long-term (24 h) intervals following self-pollination and cross-pollination. These raw transcriptome sequencing data were submitted to NCBI with the data ID PRJNA1044266. Tbtools was employed to create differential expression heatmaps for genes within the targeted intervals that were expressed in the stigma.

2.5. S-RNase Gene Analysis

Fresh leaves from both parent plants and the mixed pool of offspring were sampled for DNA extraction using a DNA extraction kit (TianGen Biotech, Beijing, China). The quantity and quality of the extracted DNA were evaluated by gel electrophoresis. Specific primers for the S-RNase gene (Table 1) were utilized for PCR amplification to determine the genotypes of the S-RNase gene in the parents and offspring exhibiting extreme phenotypes. The PCR reaction mixture comprised 10 ng DNA template, 1× PCR buffer, 0.25 mmol/L dNTPs, 0.25 μmol/L forward and reverse primers, and 0.5 U Taq DNA polymerase (Qiagen, Valencia, CA, USA), with ddH2O added to a final volume of 20 μL. The PCR amplification protocol involved an initial denaturation at 94 °C for 4 min, followed by 30 cycles of denaturation at 94 °C for 30 s, annealing at 55 °C for 30 s, and extension at 72 °C for 60 s, concluded by a final extension at 72 °C for 10 min. Following PCR, the amplification products were analyzed by gel electrophoresis on a 1.0% agarose gel. The presence of a band indicated the presence of the corresponding genotype, whereas the absence of a band suggested the absence of the genotype. The PCR results were compiled and transformed into a heatmap, where a deep color signified the presence of a band for the primers corresponding to the gene, and a light yellow color indicated the absence of a band for the primers.

3. Results

3.1. Self-Compatibility-Related Phenotype Analysis

Self-compatibility traits were assessed in F1 populations during 2021 and 2022, encompassing metrics such as the fruit set rate (FR) following cross-pollination within the same plant, the average fruit weight (AFW), the self-compatibility index (CI), and the relative self-compatibility index (CCI). Frequency distribution plots indicate that the distributions of these traits do not conform to a normal distribution but may represent a blend of normal and exponential distributions (Figure 2). This observation suggests that self-compatibility-related traits are likely influenced by both a critical single locus and a collection of additional loci.
Correlation analysis among the various test indicators shows a notable association between fruit setting rate (FR), mean single fruit weight (SFW), self-compatibility index (CI), and relative self-compatibility index (CCI) (Table 2). This indicates that these indices related to self-compatibility are likely controlled by one or more genes in goji berries.

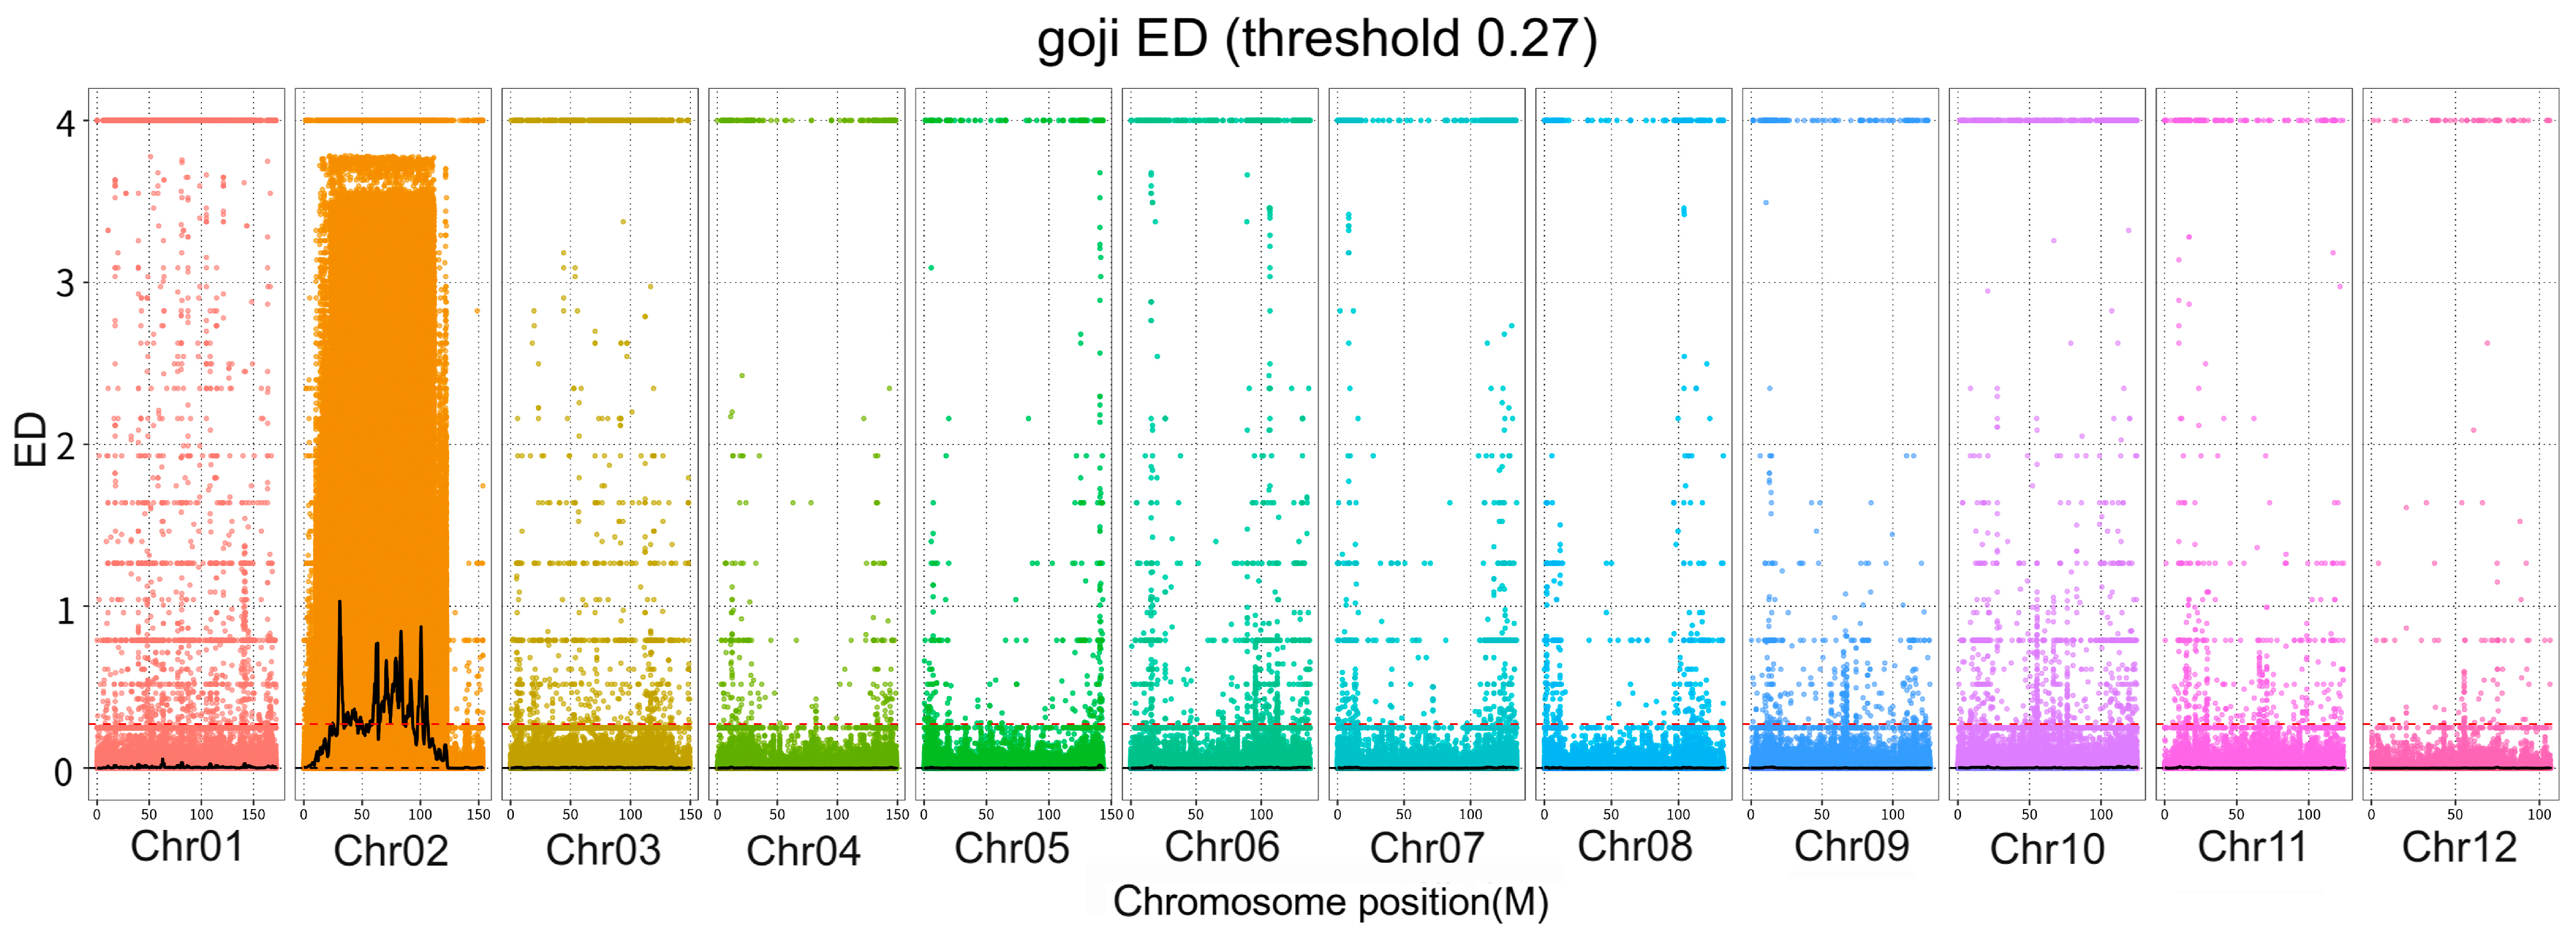
3.2. ED Correlation Analysis

Based on the analysis results of the self-compatibility phenotypic traits, 30 plants with the most extreme self-compatible phenotypes and 30 plants with the most extreme self-incompatible phenotypes were selected from the F1 population. These plants were used to create separate self-compatible and self-incompatible mixed pools for their offspring. Utilizing the genotypes from these two mixed pools, a total of 25,138,462 high-quality SNPs were obtained. The allele frequencies of each base in the different mixed pools were calculated, and the original ED values for each locus were computed. To mitigate the impact of background random fluctuations on localization, the ED values were transformed by raising them to the fourth power. Subsequently, a sliding window method based on chromosome position was employed to fit the ED values. The median of the association values of all SNPs within the window was used as the association value for that window, with a window size of 1 Mb and a step size of 200 kb. The final distribution of the association values is depicted in Figure 3. The fitted values were sorted from largest to smallest, and the median plus three standard deviations (3SD) was established as the association threshold for the analysis (0.27). Using this threshold, 17 regions were mapped, all of which are located on chromosome 2 (Table 3).

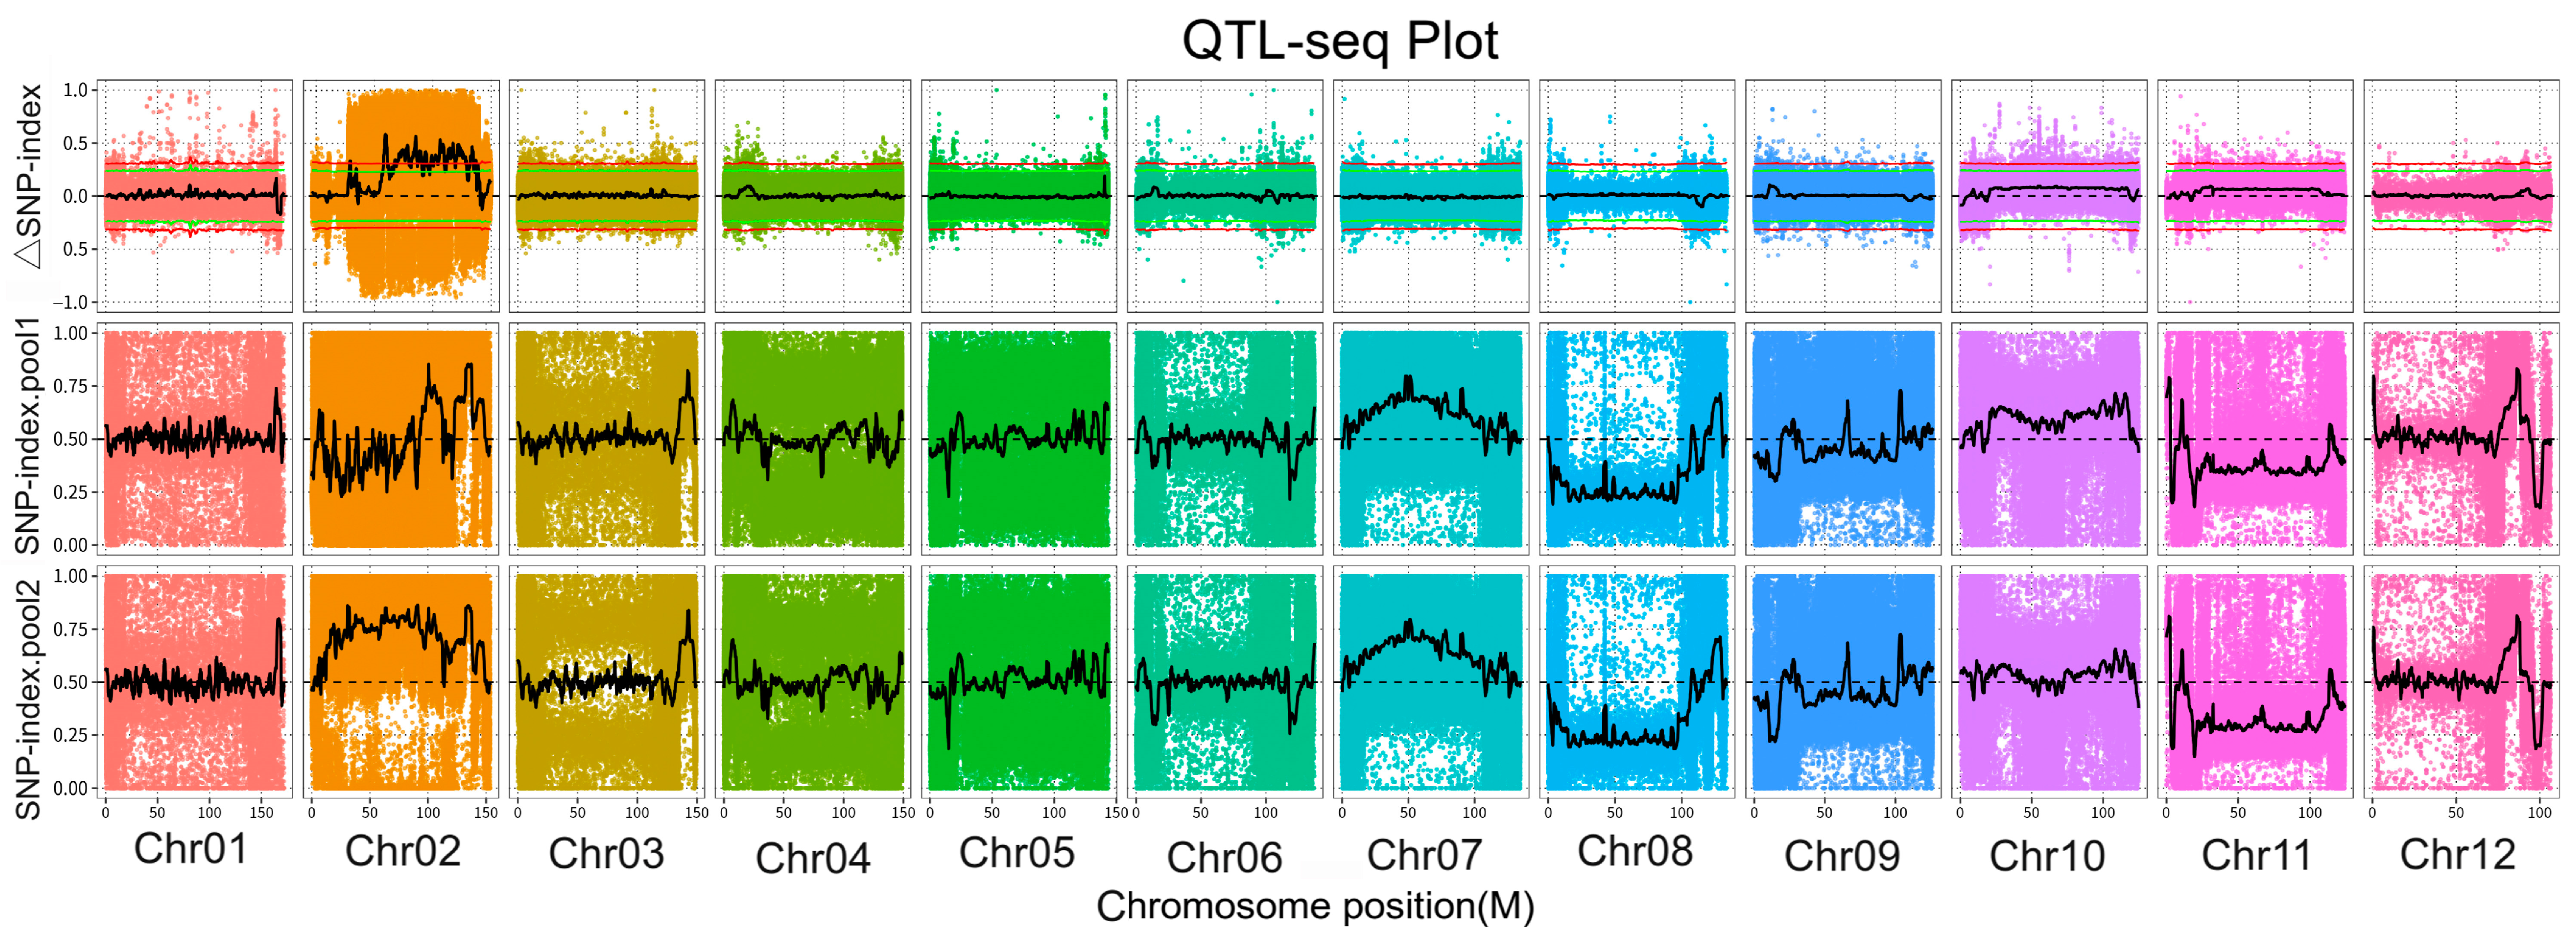
3.3. SNP-Index Association Analysis

Utilizing the genotypes of the parents and the two offspring mixed pools, sites that lacked polymorphism between the parents and the mixed pools were eliminated, yielding a total of 1,874,441 high-quality SNPs for SNP-index association analysis. The ΔSNP-index was computed, and a sliding window approach was used to fit the ΔSNP-index, with a window size of 2 Mb and a step size of 100 kb. The median of the ΔSNP-index across all loci within the window was employed as the fitted association value for that window. The distribution of the fitted ΔSNP-index is depicted in Figure 4. Following the fitted ΔSNP-index, a simulation experiment was conducted, and the 99% confidence threshold (green line) was applied to identify ten associated regions, all of which are located on chromosome 2 (Table 4).

3.4. Variation Analysis and Gene Function Annotation within Candidate Regions

By intersecting the results from the ED association analysis and the SNP-index association analysis, a total of 11 regions were identified, all located on chromosome 2 (Table 5). The significant association intervals are as follows: Chr02: 24.7–24.9 Mb, Chr02: 30.8–34 Mb, Chr02: 30.8–34 Mb, Chr02: 34.7–35.4 Mb, Chr02: 35.8–36.9 Mb, Chr02: 37.1–38.3 Mb, Chr02: 40.2–45.3 Mb, Chr02: 47.6–49.2 Mb, Chr02: 56.7–57.2 Mb, Chr02: 59.6–63.1 Mb, Chr02: 70.5–81.1 Mb, and Chr02: 88.8–92.3 Mb. These significant association regions encompass a chromosome length of 0.2–10.6 Mb, with a total length of 32.2 Mb, and include 108 genes. Gene annotation for the variable loci within the candidate regions was conducted (Table S1), followed by Swiss-prot functional annotation [24].

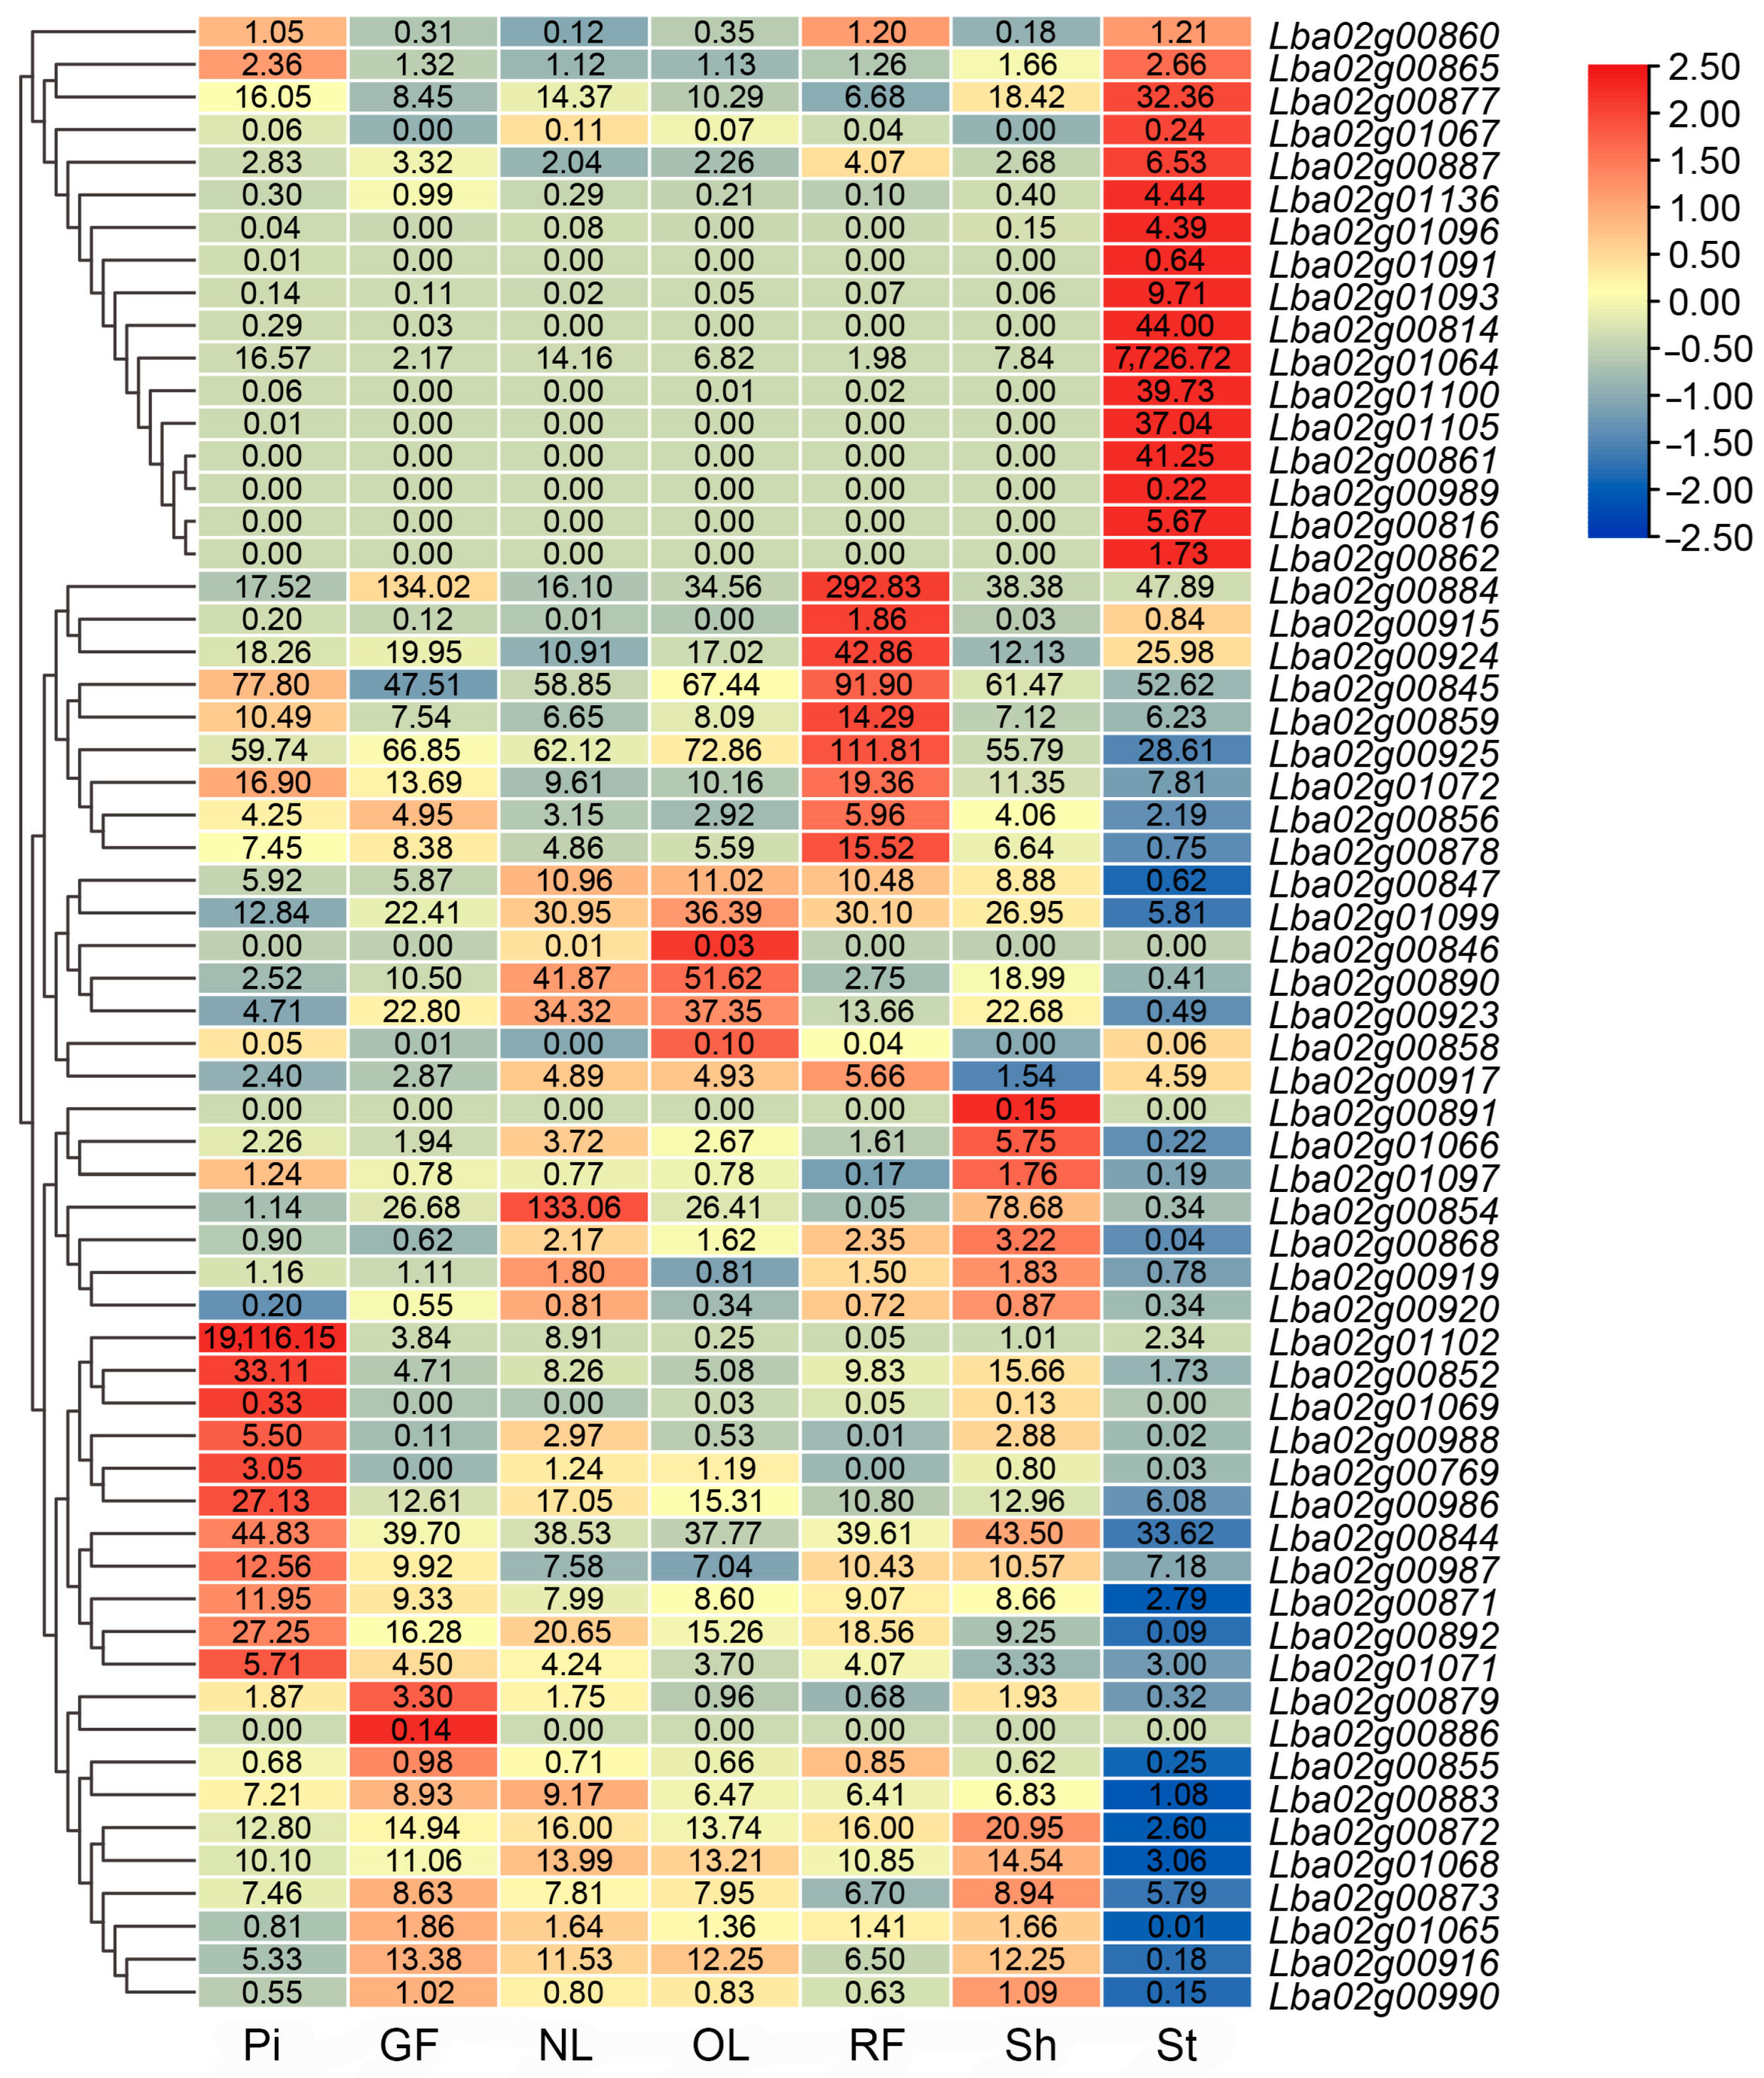
3.5. Differential Expression of Genes within the Localization Interval in Different Organs Based on Transcriptome Analysis

Utilizing transcriptomic RNA-seq data from various tissues of Ningxia wolfberry, including the pistil, stamen, stem, young leaves, old leaves, green fruits, and mature red fruits, a search was conducted to identify the differential expression of 108 genes within the mapped intervals (Figure 5). The findings revealed that of the 108 genes, 47, including Lba02g00770, Lba02g00815, and Lba02g00817, exhibited FPKM values of 0 or close to 0 across all stages, while the remaining 61 genes demonstrated varying patterns of differential expression. Ten genes, such as Lba02g01064, Lba02g00814, Lba02g00861, Lba02g00862, Lba02g01091, Lba02g01093, Lba02g01096, Lba02g01105, Lba02g01110, and Lba02g01136, were exclusively expressed in the stamen or showed significantly higher expression levels there than in other tissues. Six genes, including Lba02g01102, Lba02g00852, and Lba02g00877, were uniquely expressed in the pistil or had expression levels there that were substantially higher than in other parts. Eleven genes, such as Lba02g00892, Lba02g00847, and Lba02g00868, had notably lower expression levels in the stamen compared to other tissues. Lba02g00923 was underexpressed in both the pistil and stamen relative to other tissues. Lba02g00884 showed reduced expression in the fruit compared to other parts. Eleven genes, including Lba02g00844, Lba02g00845, and Lba02g00855, exhibited balanced expression across all organs, with no significant differences observed.
In the quest to uncover the S-determinant factors in the pistil and stamen of wolfberry, we focused on genes that are specifically expressed in these reproductive organs. The gene Lba02g01102, which is exclusively expressed in the pistil and has an exceptionally high expression level (FPKM value of 19116 in the pistil), was annotated as an S-RNase gene, aligning with the pistil determinant factors found in other Solanaceae plants and potentially serving as the S-determinant factor for the pistil of wolfberry. Among the genes solely expressed in the stamen, four genes—Lba02g00861, Lba02g01105, Lba02g01091, and Lba02g01100—were annotated as F-box genes and may collectively act as the S-determinant factor SLF gene to regulate self-incompatibility in wolfberry. It is noteworthy that Lba02g01064 is highly expressed in the stamen, with an FPKM value reaching 7726.7, and is annotated as an L-ascorbate oxidase gene. This gene is widely distributed in plants and plays critical roles in cell wall synthesis, plant cell death, antioxidant defense, and signaling [25,26,27,28].

3.6. The Differential Expression of Genes Expressed in the Styles within the Mapped Interval after Self- and Cross-Pollination

To investigate the differential expression of genes in self-compatible and self-incompatible lines of wolfberry following self-pollination and cross-pollination, 52 genes within the candidate intervals were identified as expressed in the pistil. The differential expression of these genes was analyzed in self-compatible and self-incompatible lines at various time points (0 h, 0.5 h, 8 h, 48 h) post self-pollination and cross-pollination (Figure 6). The majority of genes demonstrated stable expression patterns, whereas a few genes exhibited significant fluctuations. For instance, the genes Lba02g00854 and Lba02g00884 experienced a notable upsurge in expression in both self-compatible and self-incompatible lines after self-pollination and cross-pollination. Lba02g00854 is annotated as a transmembrane epididymal protein 1-like gene, encoding a transmembrane protein that belongs to the EFCAB family, which is known for its role in calcium ion binding and signaling [29]. Lba02g00884 is annotated as a zinc finger A20 and AN1 domain-containing stress-associated protein 8-like gene, encoding a protein that belongs to the A20/AN1 family, which is involved in a variety of biological processes such as stress response, hormone signaling, and cell cycle regulation [29]. Post self-pollination and cross-pollination, the expression levels of Lba02g00892 and Lba02g01102 were substantially decreased. Lba02g00892 is annotated as an MLP-like protein 34-like gene, encoding a protein that belongs to the MLP family, which is typically involved in various biological processes including cell signaling, cytoskeletal remodeling, apoptosis, and gene transcription regulation [30,31]. Lba02g01102 is an S-RNase gene. Lba02g00868 showed a trend of initial increase followed by decrease within 48 h after self-pollination and cross-pollination in self-compatible lines, whereas it exhibited a continuous increasing trend in self-incompatible lines. This gene is annotated as a G-type lectin S-receptor-like serine/threonine-protein kinase RLK1 gene, encoding a receptor protein that belongs to the RLK (receptor kinase) family in plants. The protein encoded by this gene may be involved in pollen tube growth, pollen and pistil recognition, and plant adaptation to external environments [32,33]. Lba02g01069 showed an increasing trend after cross-pollination in self-compatible lines, but exhibited a trend of initial increase followed by decrease in self-compatible lines after self-pollination and in self-incompatible lines. However, this gene was not successfully annotated.

3.7. Analysis of S-RNase Genotypes in Parents and Offspring

In other Solanaceae plants, S-RNase functions as the pistil S-determinant to facilitate the recognition process between pistil and stamen during the self-incompatibility response. In this study, the S-RNase gene of goji was also found within the region localized by BSA analysis, and the S-RNase gene exhibited stigma-specific expression and differential expression at different times after pollination. Based on the S-RNase gene sequences of the parents, gene-specific primers were designed and amplified in the offspring to identify their S-RNase genotypes. The results showed that both parents and the tested offspring contained two different S-RNase genes, and the self-compatible offspring pooling contained the S8-RNase gene (Figure 7 and Supplementary Materials S2). A significant correlation was observed between the self-compatible trait and the S genotype, which may imply, to some extent, the function of the S8-RNase gene. Further verification work is needed.

4. Discussion

Self-incompatibility is a widespread self/non-self recognition system in flowering plants, serving as an effective means of reproductive isolation to prevent autogamy and to promote cross-pollination evolution, thereby enhancing the ability of populations to respond to natural selection and their evolutionary potential [31,34]. However, the presence of self-incompatibility in fruit tree production can lead to a series of issues, such as severe flower and fruit drop, uneven fruit size, and low fruit setting rate in large-scale cultivation of a single variety. Therefore, studying the regulatory mechanisms of self-compatibility is very important for fruit tree breeding.
In this study, goji from Ningxia was used as the research material; with self-compatible ‘13–19’ and self-incompatible ‘xin9’ as parents, an F1 hybrid population containing 227 offspring was constructed. By performing BSA analysis on the extreme self-compatible and self-incompatible traits in the F1 population, the S-locus-related interval of goji self-compatibility was obtained. By analyzing the differentially expressed genes within the interval, several candidate genes were identified, and the S-RNase genotypes of the extreme trait offspring were characterized. The correlation between S-RNase genotype and self-compatibility was confirmed, providing a theoretical foundation for investigating the molecular mechanism of self-incompatibility in goji.
BSA analysis involves selecting two parents with extreme traits and then constructing subpools of offspring displaying these extreme phenotypes by isolating individuals with the most extreme phenotypes from the hybridized progeny. By comparing the differences between these subpools, molecular markers closely linked to the target traits can be identified [35]. Unlike traditional QTL mapping, which considers the entire population, BSA focuses only on a few extreme individuals within the population. This approach streamlines the sequencing process and significantly reduces the costs associated with sequencing and analysis. Recently, BSA has been widely employed for the genetic mapping of key traits in crops such as Arabidopsis [36], rice [37], and maize [38]. In wolfberry, QTL localization analysis of key quantitative traits is often used for the positioning of fruit yield- and quality-related traits.
Among them, Gong et al. (2019) employed ddRAD seq to construct the first high-density genetic map from an intraspecific F1 population, identifying eight significant QTL loci associated with photosynthetic traits [20]. Zhao et al. (2021) mapped QTL loci related to fruit and leaf traits based on the genetic map of SLAF seq in goji berries [22]. Rehman et al. (2020) developed a high-resolution map of goji berries using SLAF seq, detecting a total of 117 QTL loci corresponding to multiple fruit-related traits [21]. Ren et al. (2022) also established interspecific hybrid populations for QTL mapping of leaf traits and sugar content in goji berries [39]. Yin et al. (2022) constructed a genetic map comprising 165 markers (74 AFLPs and 91 SSRs) [40]. To date, there has been no utilization of bulked segregant analysis (BSA) to locate key traits in goji berries, nor has there been any research on the localization of the S locus in goji berries. This study employed a method of sequencing individual plants and constructing a mixed pool of extreme-phenotype offspring for BSA analysis and identified the S site interval located on chromosome 2 of goji berries, which spans a total of 32.2 Mb. A total of 108 genes were annotated within this interval, providing a foundation for further gene cloning and functional validation.
Accurate assessment of research traits is vital for gene mapping. Self-compatibility is a complex trait that may encompass multiple stages, including pollen recognition, pollen tube growth, fertilization, and embryo development. Typically, the evaluation of self-compatibility is based on the elongation of pollen tubes following self-pollination, and various assessment methods exist. In a study of Lolium perenne L., several QTLs and candidate genes associated with self-compatibility were identified using data from in vitro pollination experiments [18]. In sunflowers, the assessment of self-incompatibility traits is conducted by calculating the number of seeds produced per inflorescence after self-pollination, which serves as the self-compatibility trait evaluation index [16]. In a study of Silphium integrifolium, it was reported that over 20% of fertilized eggs are self-compatible [41]. In this study, four evaluation indicators were employed to assess the self-compatibility of goji berries after cross-pollination: fruit set rate (FR), average fruit weight (AFW), self-compatibility index (CI), and relative self-compatibility index (CCI). These four indicators exhibited significant correlations. While these indicators are not the most direct measures of pollen tube elongation, they may serve as comprehensive indicators influenced by various factors. To comprehensively evaluate the self-compatibility of goji berries, we also employed two different pollination methods: self-bagging and same-plant cross-pollination. The results revealed that most plants in the F1 population consistently performed in the four evaluation indicators, although a small number of plants displayed inconsistency between the two pollination methods. This study utilized the same-plant cross-pollination method. It has also been observed that there is a difference in pollen germination rates between self-pollination and same-plant cross-pollination in alfalfa. Additionally, in alfalfa, the time required for pollen tubes to enter the embryo sac is longer in self-pollination compared to inbreeding [42].
In this study, a total of 108 genes were identified within the 32.2 Mb S interval, and their expression patterns differed across various organs of goji berries and at various times post self-pollination and hybridization. The differential expression analysis of genes in different organs revealed that the gene Lba02g01102 was abnormally expressed at high levels in the style. This gene was annotated as an S-RNase gene, which exhibited a significant decline in expression in the style after pollination, although there was minimal difference between self-pollination and hybrid pollination. The S-RNase gene is a female determinant of self-incompatibility in other Solanaceae plants. S-RNase can degrade homologous pollen tube RNA, thereby inhibiting pollen tube growth and resulting in self-incompatibility [43]. This study also determined the S-RNase genotypes of the parents and extreme-phenotype offspring, and the results indicated that there were two distinct S-RNase alleles in each parent and F1 population offspring. The self-compatibility phenotype was significantly correlated with the type of S-RNase gene, and both the compatible offspring and the compatible parent possessed a specific S8-RNase gene. This suggests that, as in other Solanaceae crops, the S-RNase gene is also closely associated with self-compatibility in goji berries. S-RNase may also serve as a key pistil determinant factor in self-compatibility in goji berries, and further genetic functional verification is required for transgenic studies. Another gene specifically expressed in the pistil, Lba02g00868, belongs to the RLK (receptor kinase) family in plants. Previous studies have suggested that the protein encoded by this gene may be involved in the recognition between pollen and pistil [32]. In subsequent research, we will clone and functionally characterize these genes to further elucidate their roles in self-incompatibility recognition.
Within the specific interval, certain genes are exclusively expressed in the stamens. Among these, Lba02g00861, Lba02g01105, Lba02g01091, Lba02g01100, and four other genes are annotated as F-box genes. F-box proteins are crucial components of the plant ubiquitin proteasome system, typically forming SCF complexes with Skp proteins, CUL proteins, and Rbx1 proteins. These complexes can recognize and degrade target proteins via the ubiquitin-protein degradation pathway, thereby regulating various metabolic processes and influencing plant growth and development [44]. In the context of self-incompatibility recognition, the pollen S-determining factor F-box (SLF) can specifically recognize non-self S-RNase proteins and degrade them through the ubiquitination pathway, thus alleviating the toxicity of S-RNase [45]. The S locus in Solanaceae and Rosaceae (apple, pear) plants can contain up to 16–20 SLF genes, all of which are pollen S-determining factors. Through their synergistic action, these genes can identify different non-self S-RNases, thereby relieving the toxicity of heterologous S-RNases [46,47,48,49]. The F-box genes annotated in goji berries may collectively act as the SLF gene and the stamen S-determining factor and exert a synergistic regulatory role. Additionally, Lba02g01064 is highly expressed in the stamens, with an FPKM value of 7726.7. This gene is annotated as L-ascorbic acid oxidase, which is involved in cell wall synthesis, plant cell death, antioxidant defense, and signal transduction [25,26,27,28] Whether this gene plays a significant role in self-incompatibility requires further verification.

5. Conclusions

This study was grounded in the BSA pool analysis of the hybrid F1 population from self-compatible and non-compatible goji berry strains, yielding a candidate S locus interval of 32.2 Mb, which harbors a total of 108 genes. The analysis revealed that within this interval, Lba02g01102 (annotated as an S-RNase gene) is specifically expressed in the pistil and may serve as the S-determinant for the pistil. Conversely, Lba02g00861, Lba02g01105, Lba02g01091, and Lba02g01100 (all annotated as F-box genes) are specifically expressed in the stamen and may function as the S-determinant for the stamen. Furthermore, the female-specific expression of Lba02g00868 (annotated as belonging to the RLK, or receptor kinase, family) and the male-specific expression of Lba02g01064 (annotated as L-ascorbic acid oxidase) may also play roles in the regulation of self-compatibility in goji berries, necessitating additional screening and validation. The S-RNase genotype analysis of the offspring indicated that all self-compatible offspring possess the S8-RNase gene, suggesting a significant association between the S-RNase genotype and self-compatibility. This research lays the groundwork for further exploration into the intricacies of self-incompatibility in goji berries.

Supplementary Materials

The following supporting information can be downloaded at: https://www.mdpi.com/article/10.3390/horticulturae10020190/s1, Table S1: Gene annotation for the variable loci within the candidate regions. Supplementary Materials S2: The PCR gel image of the four S genotypes for the plant material detected.

Author Contributions

Conceptualization, C.W. and K.Q.; methodology, C.W. and G.D.; software, C.W. and G.D.; investigation, J.W., Y.G., X.S., W.X. and X.Z.; resources, K.Q.; data curation, H.M.; writing—original draft preparation, C.W.; writing—review and editing, C.W.; supervision, K.Q.; project administration, K.Q.; funding acquisition, C.W. and G.D. All authors have read and agreed to the published version of the manuscript.

Funding

This research was funded by the Youth Talent Cultivation Project of North Minzu University, grant number 2023QNPY11; West Light Talent Program of the Chinese Academy of Sciences, grant number XAB2022YW08; National Natural Science Foundation of China, grant number 31701878; Innovation Team for Genetic Improvement of Economic Forests, grant number 2022QCXTD04.

Data Availability Statement

The datasets supporting the results presented in this manuscript are included within the article (and its Supplementary Materials). The raw reads for the genome resequencing can be found in the NCBI SRA database under the accession number PRJNA1043408. Raw data for transcriptome sequenced libraries are also available in the NCBI SRA database under the accession number PRJNA1044266.

Conflicts of Interest

The authors declare no conflicts of interest.

References

  1. Li, S.; Yang, D.; Yeung, C.; Yu, W.; Chang, R.C.; So, K.; Wong, D.; Lo, A.C.Y. Lycium barbarum polysaccharides reduce neuronal damage, blood-retinal barrier disruption and oxidative stress in retinal ischemia/reperfusion injury. PLoS ONE 2011, 6, e16380. [Google Scholar] [CrossRef]
  2. Jiao, E.; Li, Y.; Wang, B.; Tang, H.; Qin, K. Analysis on self-compatibility of Lycium barbarum L. in Ningxia. Acta Agric. Boreali-Occident. Sin. 2010, 19, 115–119. [Google Scholar]
  3. Xue, Y.; Carpenter, R.; Dickinson, H.G.; Coen, E.S. Origin of allelic diversity in antirrhinum s locus RNases. Plant Cell 1996, 8, 805–814. [Google Scholar]
  4. Tovar-mendez, A.; McClure, B. Plant reproduction: Self-incompatibility to go. Curr. Biol. 2016, 26, R115–R117. [Google Scholar] [CrossRef]
  5. Zhang, D.; Li, Y.; Zhao, X.; Zhang, C.; Liu, D.; Lan, S.; Yin, W.; Liu, Z. Molecular insights into self-incompatibility systems: From evolution to breeding. Plant Commun. 2023, 5, 100719. [Google Scholar] [CrossRef]
  6. Darwin, C.R. The Effects of Cross and Self-Fertilisation in the Vegetable Kingdom, 2nd ed.; John Murry: London, UK, 1878. [Google Scholar]
  7. Zhao, H.; Zhang, Y.; Zhang, H.; Song, Y.; Zhao, F.; Zhang, Y.; Zhu, S.; Zhang, H.; Zhou, Z.; Guo, H.; et al. Origin, loss and regain of self-incompatibility in angiosperms. Plant Cell 2022, 34, 579–596. [Google Scholar] [CrossRef]
  8. Goring, D.R.; Bosch, M.; Franklin-Tong, V.E. Contrasting self-recognition rejection systems for self-incompatibility in Brassica and Papaver. Curr. Biol. 2023, 33, R530–R542. [Google Scholar] [CrossRef]
  9. McClure, B.A.; Haring, V.; Ebert, P.R.; Anderson, M.A.; Simpson, R.J.; Sakiyama, F.; Clarke, A.E. Style self-incompatibility gene products of Nicotlana alata are ribonucleases. Nature 1989, 342, 955–957. [Google Scholar] [CrossRef]
  10. Qiao, H.; Wang, F.; Zhao, L.; Zhou, J.; Lai, Z.; Zhang, Y.; Robbins, T.P.; Xue, Y. The F-box protein AhSLF-S2 controls the pollen function of S-RNase-based self-incompatibility. Plant Cell 2004, 16, 2307–2322. [Google Scholar] [CrossRef]
  11. Snowman, B.N.; Kovar, D.R.; Shevchenko, G.; Franklin-Tong, V.; Staiger, C.J. Signal-mediated depolymerization of actin in pollen during the self-Incompatibility response. Plant Cell 2002, 14, 2613–2626. [Google Scholar] [CrossRef]
  12. Matsumoto, D.; Yamane, H.; Abe, K.; Tao, R. Identification of a Skp1-like protein interacting with SFB, the pollen S determinant of the gametophytic self-Incompatibility in Prunus. Plant Physiol. 2012, 159, 1252–1262. [Google Scholar] [CrossRef]
  13. Zeng, B.; Wang, J.; Hao, Q.; Yu, Z.; Abudukayoumu, A.; Tang, Y.L.; Zhang, X.F.; Ma, X. Identification of a novel SBP1-containing SCF SFB complex in wild dwarf almond (Prunus tenella). Front. Genet. 2019, 10, 1019. [Google Scholar] [CrossRef]
  14. Wang, Y.; Liu, P.; Cai, Y.; Li, Y.; Tang, C.; Zhu, N.; Wang, P.; Zhang, S.; Wu, J. PbrBZR1 interacts with PbrARI2.3 to mediate brassinosteroid-regulated pollen tube growth during self-incompatibility signaling in pear. Plant Physiol. 2023, 92, 2356–2373. [Google Scholar] [CrossRef]
  15. Bernacchi, D.; Tanksley, S.D. An interspecific backcross of Lycopersicon esculentum x L. hirsutum: Linkage analysis and a QTL study of sexual compatibility factors and floral traits. Genetics 1997, 147, 861–877. [Google Scholar] [CrossRef]
  16. Gandhi, S.D.; Heesacker, A.F.; Freeman, C.A.; Argyris, J.; Bradford, K.; Knapp, S.J. The self-incompatibility locus (S) and quantitative trait loci for self-pollination and seed dormancy in sunflower. Theor. Appl. Genet. 2005, 111, 619–629. [Google Scholar] [CrossRef]
  17. Do, C.J.; Studer, B.; Frei, U.; Lübberstedt, T. Fine mapping a self-fertility locus in perennial ryegrass. Theor. Appl. Genet. 2018, 131, 817–827. [Google Scholar]
  18. Cropano, C.; Manzanares, C.; Yates, S.; Copetti, D.; Canto, J.D.; Lübberstedt, T.; Koch, M.; Studer, B. Identification of candidate genes for self-compatibility in perennial ryegrass (Lolium perenne L.). Front. Plant Sci. 2021, 12, 707901. [Google Scholar] [CrossRef]
  19. Sun, Q.; Wu, J.; Cheng, F.; Wang, X.; Liang, J.; Shen, S. QTL Mapping of self-compatibility, silique and seeds-associated traits in Brassica rapa. Sci. Agric. Sin. 2016, 49, 2449–2458. [Google Scholar]
  20. Gong, H.; Rehman, F.; Yang, T.; Li, Z.; Zeng, S.; Pan, L.; Li, Y.; Wang, L. Construction of the first high-density genetic map and QTL mapping for photosynthetic traits in Lycium barbarum L. Mol. Breed. 2019, 39, 106. [Google Scholar] [CrossRef]
  21. Rehman, F.; Gong, H.; Li, Z.; Zeng, S.; Yang, T.; Ai, P.; Pan, L.; Huang, H.; Wang, Y. Identification of fruit size associated quantitative trait loci featuring SLAF based high-density linkage map of goji berry (Lycium spp.). BMC Plant Biol. 2020, 20, 474. [Google Scholar] [CrossRef]
  22. Zhao, J.; Li, H.; Xu, Y.; Yin, Y.; Huang, T.; Zhang, B.; Wang, Y.; Li, Y.; Cao, Y.; An, W. A consensus and saturated genetic map provides insight into genome anchoring, synteny of Solanaceae and leaf- and fruit-related QTLs. in wolfberry (Lycium Linn.). BMC Plant Biol. 2021, 21, 350. [Google Scholar] [CrossRef]
  23. Li, Z.; Xu, Y. Bulk segregation analysis in the NGS era: A review of its teenage years. Plant J. 2022, 109, 1355–1374. [Google Scholar] [CrossRef]
  24. Boutet, E.; Lieberherr, D.; Tognolli, M.; Schneider, M.; Bansal, P.; Bridge, A.; Poux, S.; Bougueleret, L.; Xenarios, I. UniProtKB/Swiss-prot, the manually annotated section of the UniProt knowledgebase: How to use the entry view. Plant Bioinform. 2015, 1374, 23–54. [Google Scholar]
  25. Kato, N.; Esaka, M. Expansion of transgenic tobacco protoplasts expressing pumpkin ascorbate oxidase is more rapid than that of wild-type protoplasts. Planta 2000, 210, 1018–1022. [Google Scholar] [CrossRef]
  26. Pignocchi, C.; Foyer, C.H. Apoplastic ascorbate metabolism and its role in the regulation of cell signaling. Curr. Opin. Plant Biol. 2003, 6, 379–389. [Google Scholar] [CrossRef]
  27. Pignocchi, C.; Kiddle, G.; Hernández, I.; Foster, S.J.; Asensi, A.; Taybi, T.; Barnes, J.D.; Foyer, C.H. Ascorbate oxidase-dependent changes in the redox state of the apoplast modulate gene transcription leading to modified hormone signaling and orchestration of defense processes in tobacco. Plant Physiol. 2006, 141, 423–435. [Google Scholar] [CrossRef]
  28. Sanmartin, M.; Pateraki, I.; Chatzopoulou, F.; Kanellis, A.K. Differential expression of the ascorbate oxidase multigene family during fruit development and in response to stress. Planta 2007, 225, 873–885. [Google Scholar] [CrossRef]
  29. Hwang, J.Y.; Mannowetz, N.; Zhang, Y.D.; Everley, R.A.; Gygi, S.P.; Bewersdorf, J.; Lishko, P.V.; Chung, J.J. Dual sensing of physiologic pH and Calcium by EFCAB9 regulates sperm motility. Cell 2019, 177, 1480–1494. [Google Scholar] [CrossRef]
  30. Gao, W.; Long, L.; Tian, X.; Jin, J.; Liu, H.; Zhang, H.; Xu, F.; Song, C. Genome-wide identification and expression analysis of stress-associated proteins (SAPs) containing A20/AN1 zinc finger in cotton. Mol. Genet. Genom. 2016, 2919, 2199–2213. [Google Scholar] [CrossRef]
  31. Zhang, N.; Li, R.; Shen, W.; Jiao, S.; Zhang, J.; Xu, W. Genome-wide evolutionary characterization and expression analyses of major latex protein (MLP) family genes in Vitis vinifera. Mol. Genet. Genom. 2018, 293, 1061–1075. [Google Scholar] [CrossRef]
  32. Fujii, S.; Kubo, K.; Takayama, S. Non-self and self-recognition models in plant self-incompatibility. Nat. Plants 2016, 2, 16130. [Google Scholar] [CrossRef]
  33. Lee, H.K.; Goring, D.R. Two subgroups of receptor-like kinases promote early compatible pollen responses in the Arabidopsis thaliana pistil. J. Exp. Bot. 2020, 72, 1198–1211. [Google Scholar] [CrossRef]
  34. Yan, J.; Su, P.; Meng, X.; Liu, P. Phylogeny of the plant receptor-like kinase(RLK) gene family and expression analysis of wheat RLK genes in response to biotic and abiotic stresses. BMC Genom. 2023, 24, 224. [Google Scholar] [CrossRef]
  35. Harkness, A.; Brandvain, Y. Non-self recognition-based self-incompatibility can alternatively promote or prevent introgression. New Phytol. 2021, 231, 1630–1643. [Google Scholar] [CrossRef]
  36. Zou, C.; Wang, P.; Xu, Y. Bulked sample analysis in genetics, genomics and crop improvement. Plant Biotechnol. J. 2016, 14, 1941–1955. [Google Scholar] [CrossRef]
  37. Gillmor, C.S.; Roedera, H.K.; Sieber, P.; Somerville, C.; Lukowitz, W.A. Genetic screen for mutations affecting cell division in the Arabidopsis thaliana embryo identifies seven loci required for cytokinesis. PLoS ONE 2016, 11, e0146492. [Google Scholar] [CrossRef]
  38. Abe, A.; Kosugi, S.; Yoshida, K.; Natsume, S.; Takagi, H.; Kanzaki, H.; Matsumura, H.; Yoshida, K.; Mitsuoka, C.; Tamiru, M.; et al. Genome sequencing reveals agronomically important loci in rice using MutMap. Nat. Biotechnol. 2012, 30, 174–178. [Google Scholar] [CrossRef]
  39. Li, C.; Xiang, X.; Huang, Y.; Zhou, Y.; An, D.; Dong, J.; Zhao, C.; Liu, H.; Li, Y.; Wang, Q.; et al. Long-read sequencing reveals genomic structural variations that underlie creation of quality protein maize. Nat. Commun. 2020, 11, 17. [Google Scholar] [CrossRef]
  40. Ren, X.; Li, H.; Yin, Y.; Duan, L.; Wang, Y.; Liang, X.; Wan, R.; Huang, T.; Zhang, B.; Xi, W.; et al. Genetic analysis of fruit traits in wolfberry (Lycium L.) by the major gene plus polygene model. Agronomy 2022, 12, 1403. [Google Scholar] [CrossRef]
  41. Yin, Y.; An, W.; Zhao, J.; Li, Y.; Fan, F.; Chen, J.; Cao, Y.; Zhan, X. Constructing the wolfberry (Lycium spp.) genetic linkage map using AFLP and SSR markers. J. Integr. Agric. 2022, 21, 131–138. [Google Scholar] [CrossRef]
  42. Price, J.H.; Raduski, A.R.; Brandvain, Y.; Tassel, D.L.V.; Smith, K.P. Development of first linkage map for Silphium integrifolium (Asteraceae) enables identification of sporophytic self-incompatibility locus. Heredity 2022, 128, 304–312. [Google Scholar] [CrossRef]
  43. Sangduen, N.; Sorensen, E.L.; Liang, G.H. Pollen germination and pollen tube growth following self-pollination and intra- and interspecific pollination of Medicago species. Euphytica 1983, 32, 527–534. [Google Scholar] [CrossRef]
  44. Sijacic, P.; Wang, X.; Skirpan, A.L.; Wang, Y.; Dowd, P.E.; Mccubbin, A.G.; Huang, S.; Kao, T. Identification of the pollen determinant of S-RNase-mediated self-incompatibility. Nature 2004, 429, 302–305. [Google Scholar] [CrossRef]
  45. Xu, K.; Wu, N.; Yao, W.; Li, X.; Zhou, Y.; Li, H. The biological function and roles in phytohormone signaling of the F-box protein in plants. Agronomy 2021, 11, 2360. [Google Scholar] [CrossRef]
  46. Sun, P.L.; Li, S.; Lu, D.; Williams, J.S.; Kao, T. Pollen S-locus F-box proteins of Petunia involved in S-RNase-based self-incompatibility are themselves subject to ubiquitin-mediated degradation. Plant J. 2015, 83, 213–223. [Google Scholar] [CrossRef]
  47. Kubo, K.; Entani, T.; Takara, A.; Wang, N.; Fields, A.M.; Hua, Z.; Toyoda, M.; Kawashima, S.; Ando, T.; Isogai, A.; et al. Collaborative non-self recognition system in S-RNase-based self-incompatibility. Science 2010, 330, 796–799. [Google Scholar] [CrossRef]
  48. Li, S.; Williams, J.S.; Sun, P.L.; Kao, T.H. All 17 S-locus F-box proteins of the S2- and S3-haplotypes of Petunia inflata are assembled into similar SCF complexes with a specific function in self-incompatibility. Plant J. 2016, 87, 606–616. [Google Scholar] [CrossRef]
  49. Wu, L.; Williams, J.S.; Sun, L.H.; Kao, T.H. Sequence analysis of the Petunia inflata S-locus region containing 17 S-Locus F-Box genes and the S-RNase gene involved in self-incompatibility. Plant J. 2020, 104, 1348–1368. [Google Scholar] [CrossRef]
Figure 1. Breeding flowchart for the plant materials used in this study.
Horticulturae 10 00190 g001
Figure 2. Frequency of self-compatibility-related phenotypes. FR: fruit set rate; AFW: average fruit weight; CI: compatibility index; CCI: compared compatibility index.
Horticulturae 10 00190 g002
Figure 3. Distribution of ED correlation values on chromosomes. The vertical coordinate is the association value (ED4) and the horizontal coordinate is the chromosome position. The colored scatter is the raw association value (ED4) for each SNP, the black curve is the association value after sliding window fitting, and the red dashed line is the threshold line (0.27).
Horticulturae 10 00190 g003
Figure 4. Distribution of SNP-index association values on chromosomes. Each point corresponds to a SNP site, with the x-axis indicating the chromosomal location of the SNP and the y-axis representing the SNP-Index value. The red and green lines serve as threshold indicators, with red signifying a significance level of 0.01 and green indicating a significance level of 0.05. The black line represents the fitted curve for the ΔSNP-index.
Horticulturae 10 00190 g004
Figure 5. Gene differential expression map in the candidate interval. Pi: pistil; St: stamen; Sh: shoot; OL: old leaf; NL: new leaf; GF: green fruit; RF: red fruit.
Horticulturae 10 00190 g005
Figure 6. Differential expression analysis of the genes in the positioning interval in the style of self-compatible lines and self-incompatible lines at different times after selfing and cross hybridization. A: unpollinated styles of self-compatible line; B: unpollinated styles of self-incompatible line; AcE: 0.5 h styles of cross hybridization of self-compatible line; AcM: 8 h styles of cross hybridization of self-compatible line; AcL: 48 h styles of cross hybridization of self-compatible line; AsE: 0.5 h styles of selfing of self-compatible line; AsM: 8 h styles of selfing of self-compatible line; AsL: 48 h styles of selfing of self-compatible line; BcE: 0.5 h styles of cross hybridization of self-incompatible line; BcM: 8 h styles of cross hybridization of self-incompatible line; BcL: 48 h styles of cross hybridization of self-incompatible line; BsE: 0.5 h styles of selfing of self-incompatible line; BsM: 8 h styles of selfing of self-incompatible line; BsL: 48 h styles of selfing of self-incompatible line.
Horticulturae 10 00190 g006
Figure 7. Identification of S-RNase genotypes of parents and offspring. The x-axis represents the four different genotypes of S-RNase detected (S1: S1-RNase; S2: S2-RNase; S8: S8-RNase; S11: S11-RNase), and the y-axis represents the different strains tested. Light yellow indicates the absence of that genotype, while other colors indicate the presence of that genotype.
Horticulturae 10 00190 g007
Table 1. Primer sequences and product length information for S-RNase genotype identification in this study.
S-GenotypeForward PrimerReverse PrimerProduct Length/bp
S1ATGTTTAAATCACGACTCATGACTGTCACCCTGGAAAATAAATTAAAGTG810
S2GCTACCCAAAAGTGGGTTATAAGAGTTTGCCATTAATTATGCTTAGC666
S8GTGGGCAACCAAAAAGTGGGTTATGGCCTTTTCGATATCATGAAGCA400
S11GCTACCCAGAAGTGAGTTATGACAGCTCACTTATTTTTCTGGCATCC169
Table 2. Correlation analysis of phenotypic traits related to self-compatibility of same-plant cross-pollination in F1 population.
TraitsCompatibility Index (CI)Compared Compatibility Index (CCI)Fruit Rate (FR)Average Fruit Weight (AFW)
Compatibility index (CI)1
Compared compatibility index (CCI)0.974 **1
Fruit rate (FR)0.818 **0.816 **1
Average fruit weight (AFW)0.817 **0.794 **0.889 **1
** p < 0.01.
Table 3. ED associated area information statistics table.
Chromosome
ID
Start SiteEnd SiteSize/Mb
Chr0224,700,00024,900,0000.2
Chr0229,100,00034,000,0004.9
Chr0234,700,00035,400,0000.7
Chr0235,800,00036,900,0001.1
Chr0237,100,00039,800,0002.7
Chr0240,200,00045,300,0005.1
Chr0246,000,00046,200,0000.2
Chr0247,600,00049,500,0001.9
Chr0256,700,00057,500,0000.8
Chr0257,800,00058,000,0000.2
Chr0258,300,00058,600,0000.3
Chr0258,900,00063,700,0004.8
Chr0264,700,00085,800,00021.1
Chr0286,100,00087,200,0001.1
Chr0287,500,00093,400,0005.9
Chr0297,700,000102,000,0004.3
Chr02103,900,000106,300,0002.4
Table 4. Statistical table of SNP-index associated region information.
Chromosome
ID
Start SiteEnd SiteSize/Mb
Chr0211,100,00011,300,0000.2
Chr0212,700,00013,400,0000.7
Chr0213,800,00019,100,0005.3
Chr0221,000,00052,300,00031.3
Chr0252,800,00057,400,0004.6
Chr0259,000,00083,900,00024.9
Chr0284,300,00085,300,0001
Chr0287,600,00092,900,0005.3
Chr02115,500,000115,800,0000.3
Chr02120,700,000121,700,0001
Table 5. The intersection area of ED and SNP-index algorithms.
Chromosome
ID
Start SiteEnd SiteSize/Mb
Chr0224,700,00024,900,0000.2
Chr0230,800,00034,000,0003.2
Chr0234,700,00035,400,0000.7
Chr0235,800,00036,900,0001.1
Chr0237,100,00038,300,0001.2
Chr0240,200,00045,300,0005.1
Chr0247,600,00049,200,0002.6
Chr0256,700,00057,200,0000.5
Chr0259,600,00063,100,0003.5
Chr0270,500,00081,100,00010.6
Chr0288,800,00092,300,0003.5
Disclaimer/Publisher’s Note: The statements, opinions and data contained in all publications are solely those of the individual author(s) and contributor(s) and not of MDPI and/or the editor(s). MDPI and/or the editor(s) disclaim responsibility for any injury to people or property resulting from any ideas, methods, instructions or products referred to in the content.

