Article

Genome-Wide Prediction and Expression Characterization of the GATA Gene Family under Nitrogen and Phosphate Deficiency in Panax ginseng

1
Institute of Special Economic Animal and Plant Sciences, Chinese Academy of Agricultural Sciences, Changchun 130112, China
2
Jilin Provincial Key Laboratory of Traditional Chinese Medicinal Materials Cultivation and Propagation, Changchun 130112, China
3
College of Pharmacy and Biological Engineer, Chengdu University, Chengdu 610106, China
*
Author to whom correspondence should be addressed.
Horticulturae 2024, 10(3), 282; https://doi.org/10.3390/horticulturae10030282
Submission received: 7 February 2024 / Revised: 10 March 2024 / Accepted: 14 March 2024 / Published: 15 March 2024
(This article belongs to the Section Genetics, Genomics, Breeding, and Biotechnology (G2B2))

Abstract

:
GATA transcription factors are widespread in plants, exerting crucial functions in multiple processes such as flower development, photoperiod regulation, and light signal transduction. The GATA gene family has a key role in the regulation of medicinal plant adaptation to environmental stress. However, since the publication of the Ginseng (Panax ginseng C.A. Meyer) genome-wide data, there has never been an analysis of the whole GATA gene family. To understand the function of the GATA gene family more broadly, the GATA gene family members in P. ginseng were predicted using an in silico bioinformatics approach. A comprehensive and systematic analysis encompassing chromosome scaffold, expression pattern, gene structure, and phylogeny was conducted. The results showed that a total of 52 GATA gene family members were recognized in P. ginseng, distributed across 51 scaffolds. Each member encoded a diverse number of amino acid residues, extending from 138 to 1064. Moreover, the expression levels of PgGATA genes were significantly altered by nitrogen (N) and phosphorus (P) stresses. The expression levels of PgGATA6, PgGATA11, PgGATA27, PgGATA32, PgGATA37, PgGATA39, PgGATA40, and PgGATA50 exhibited significant elevation under N deficiency, whereas PgGATA15, PgGATA18, PgGATA34, PgGATA38, PgGATA41, and PgGATA44 genes showed substantial upregulation under P deficiency. In addition, PgGATA3, PgGATA4, PgGATA14, PgGATA19, and PgGATA28 were substantially upregulated under both N and P deficiency. This research establishes a theoretical foundation for the thorough examination of the functions of the PgGATA gene family and its regulation by N and P fertilization during P. ginseng cultivation.

1. Introduction

Medicinal plants have adapted to their habitats during evolution; however, they face environmental stress conditions, such as drought, intense light, high temperature, nutrient deficiency, diseases, and insect pests that can hinder their optimal growth and development. Medicinal plants respond to environmental stresses through the essential involvement of transcription factors (TFs). These TFs selectively bind to the promoter regions of downstream genes, regulating gene expression levels and thereby influencing various key biological processes. These processes include cell morphogenesis, environmental stress response, and signal transduction [1,2]. Recently, a wide range of TFs governing the regulation of adaptation to drought, cold, hormone signaling, diseases, and growth and development have been predicted from medicinal plants, for instance, bHLH [3], YABBY [4], MYB [5], bZIP [6], and MADS-box [7].
GATA TFs, transcriptional regulatory proteins, are comprised of a downstream conserved region and a typical type IV zinc finger DNA binding domain (CX2CX17~20CX2C). Specific members of this zinc finger TF class bind to the DNA sequence (A/T) GATA(A/G) within the promoter regulatory region of genes, thereby regulating their transcription levels [8]. Most plant GATA TFs typically feature only one zinc finger domain with 18 or 20 residues (C-X2-C-X18-C-X2-C or C-X2-C-X20-C-X2-C). However, several GATA TF members with two zinc finger domains have also been predicted [9]. GATA TFs are recognized as crucial regulatory proteins involved in a diverse range of biological processes. The prediction of the first GATA TF in plants, NTL1, was achieved through the cloning of tobacco [10]. This discovery underscores the presence of GATA TFs in higher plants and its involvement in nitrogen (N) metabolic pathways [11]. The plant GATA TFs regulate plant growth and development by binding to WGATAR sequences on promoters, thereby initiating or inhibiting transcription processes [8]. They affect different biological processes, encompassing the regulation of flower development [12], seed germination [13], nitrogen metabolism, glucose signaling [14], chlorophyll biosynthesis [15], cell elongation [16], plant hormone synthesis [17,18], and stress resistance [19]. Currently, Arabidopsis thaliana and Oryza sativa have 30 and 29 members, respectively, in the GATA gene family [8]. In A. thaliana, AtGATA2 is involved in photomorphogenesis regulation, regulated by light and Brassinosteroid (BR) [20]. The Cytokinin-Responsive GATA Factor1 (CGA1) and GATA, Nitrate-inducible, Carbon-metabolism-involved (GNC) affect chlorophyll content [15]. Overexpression of the Inflorescence Meristem (ZIM) gene, which encodes a zinc finger protein, results in the elongation of hypocotyl and leaf stalk [16]. In O. sativa, CGA1 is involved in regulating chloroplast development and plant morphotype [21], while Neck Leaf 1 (NL1) regulates organ development during reproductive growth [22].
Ginseng (Panax ginseng C.A. Meyer) is known to be tetraploid (2n = 4× = 48), with an estimated genome size of approximately 3.6 Gbp [23]. Its primary active ingredients, ginsenosides, exhibit notable properties in controlling inflammation during immune responses, regulating metabolism, and influencing tumor control. In addition, P. ginseng serves as a medicinal substance utilized for both medicine and culinary purposes. It is also utilized as an ingredient in processed Chinese medicinal products or pharmaceutical raw materials. It is extensively utilized in health-promoting food products, serving as a beverage, flavoring agent, spice, cosmetics, and various other processed products [24]. Thus, the key to the development of the ginseng industry in production practices lies in ensuring high-quality ginseng resources through scientific cultivation control. The GATA gene family has a crucial role in the regulation of plant development and growth and adaptation to environmental stress [15,25,26]. Hence, the GATA gene family emerges as a potential target for regulating the “quality” of P. ginseng. However, the properties and functions of the GATA TFs in P. ginseng remain unexplored.
In this study, 52 candidate PgGATA genes were predicted through the bioinformatic analysis of the P. ginseng transcriptome obtained through RNA sequencing. A comprehensive genome-wide analysis was conducted on P. ginseng GATA genes, encompassing their chromosomal distribution, gene structures, phylogeny, and the presence of conserved motifs. Finally, this study acquired expression profiles of GATA genes in P. ginseng after nitrogen (N) and phosphorus (P) treatments, assessing their regulation under different fertilization schemes.

2. Methodology

2.1. Plant Materials, Cultivation and Stress Treatments

P. ginseng seeds (P. ginseng seeds were collected and preserved in the P. ginseng planting base of Baishan City, Jilin Province, China) were germinated on wet Whatman filter paper in a rectangular culture tray (34 × 25 cm) in the darkness for 3 days at 25 °C. Germinated seeds were transferred to a hydroponic tank supplemented with pure water for 3 days at 70% relative humidity and 22–25 °C ambient temperature. The seedlings were then cultured for 5 days in Hoagland’s solution [27]. Subsequently, 40 uniform seedlings were selected and transplanted into each hydroponic tank, and the nutrient solution in the hydroponic tank was composed of 5 mmol L−1 Ca(NO3)2·4H2O, 5 mmol L−1 KNO3, 1 mmol L−1 NH4NO3, 2.5 mmol L−1 MgSO4 ·7H2O, 2 mmol L−1 KH2PO4, 0.4 mmol L−1 Fe-Na-EDTA, and 5 mL trace elements [27]. The pH of the solution was adjusted to 5.8. For the N and P treatments, the N content was set to 0 mmol L−1 for the N deficiency stress treatment, and the P content was set to 0 mmol L−1 for the P stress treatment. The corresponding concentrations of KH2PO4, Ca(NO3)2, KNO3, and NH4NO3 were adjusted to 0%, respectively. CaCl2 and KCl were separately supplied to complement Ca2+ and K+ concentrations under N and P deficient conditions. At the same time, the remaining components of Hoagland’s solution remained unchanged [28]. The nutrient solution was replaced every 2 days. After 72 h, 20 seedlings were randomly selected from each hydroponic tank, and their root organs were collected, rapidly frozen in liquid nitrogen, and preserved at −80 °C for subsequent analyses. Each treatment had three biological replicates.

2.2. Identifying PgGATA genes in P. ginseng

The reference GATA gene and protein sequences from A. thaliana and O. sativa were retrieved from the Ensemble Plants database (http://plants.ensembl.org. accessed on 22 July 2023) [29], and P. ginseng GATA gene and protein sequences were based on transcriptome sequencing data (NCBI accession number PRJNA1014183). A total of 59 reference GATA gene and protein sequences were used for the analysis, with 30 from A. thaliana and 29 from O. sativa. Then, the HMMER 3.0 software was utilized for the construction of a Hidden Markov Model (HMM) based on the obtained sequences of the known GATA protein family [30]. This model was used to search for all encoded protein sequences of P. ginseng and identify all potential GATA family sequences in P. ginseng. Using blastp (version: ncbi-blast-v2.10.1+) [31], the potential P. ginseng GATA family sequences were obtained after comparison with a reference GATA sequence, employing an e-value threshold of 1 × 10⁻⁵. For the acquired candidate sequences, domain annotation for the target sequences was conducted utilizing the Pfam A database (version: v33.1) [32]. The sequences containing the PF00320 domain were then determined as the final GATA sequences, resulting in the prediction of 52 sequences. Moreover, the ExPASy tool (http://www.expasy.ch/tools/pi_tool.html. accessed on 22 July 2023) was utilized to calculate the amino acid number, isoelectric point (pI), and molecular weight (MW) of each GATA protein [33].

2.3. Phylogenetic Analysis of PgGATAs

The neighbor-joining (NJ) tree was developed using the sequences of the GATA protein families from P. ginseng, A. thaliana, and O. sativa. The MEGA10 software was used to construct the NJ tree [34]. The following parameters were set for tree construction: a Poisson model was employed, a cutoff of 50% was established, and the bootstrap repetitions were set to 1000. The bootstrap value is a self-expanding indicator used to validate the calculated branch confidence of the evolutionary tree. The evolution tree was annotated utilizing the software iTOL v6 (https://itol.embl.de/. accessed on 22 July 2023) [35].

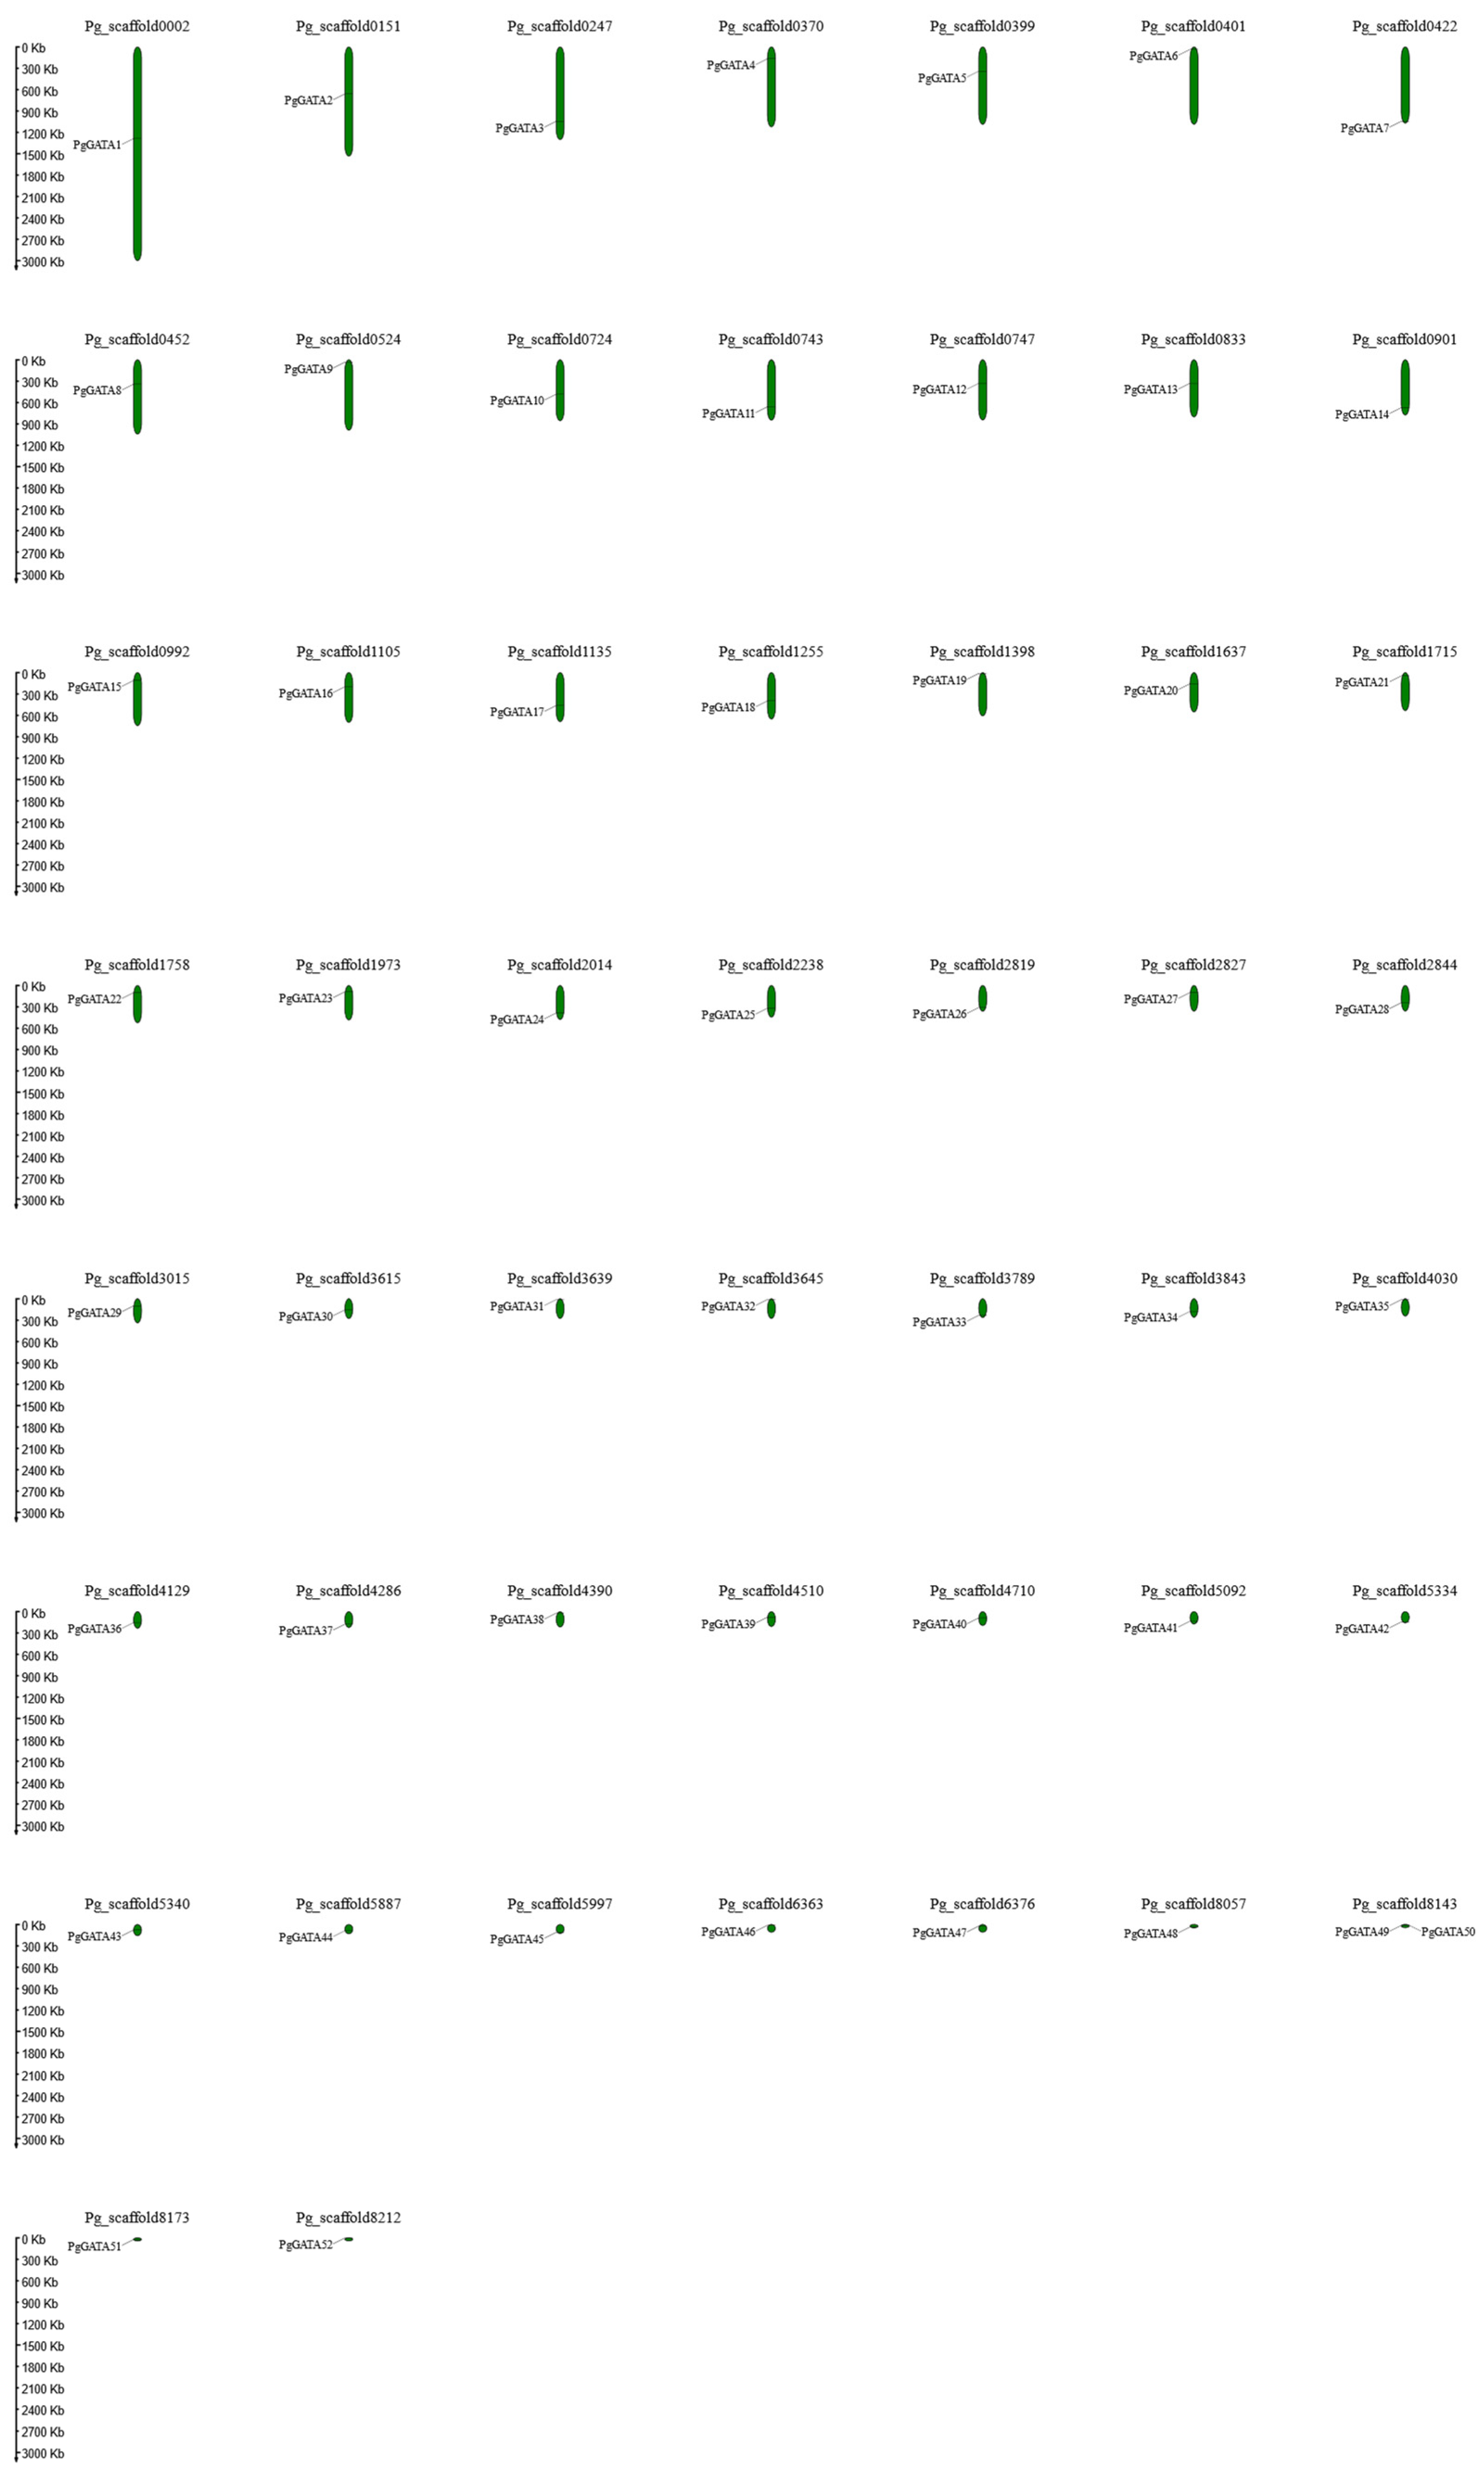
2.4. Chromosomal Scaffold and Gene Duplications

The MG2C tool (http://mg2c.iask.in/mg2c_v2.1/. accessed on 22 July 2023) was employed to generate the physical map illustrating the localization of the GATA gene family members on P. ginseng chromosomes, utilizing their obtained genomic position. The MCScanX software was utilized to analyze the syntenic relationships of the orthologous GATA genes between P. ginseng and other species, such as A. thaliana, O. sativa, and P. ginseng [36]. Subsequently, the KaKs_Calculator 2.0 was employed to assess the synonymous (Ks) and non-synonymous (Ka) substitution rates for every duplicated PgGATA gene. The formula T = Ks/2R was applied to assess divergence time, with R representing 1.5 × W10–8 Ks per site per year [37].

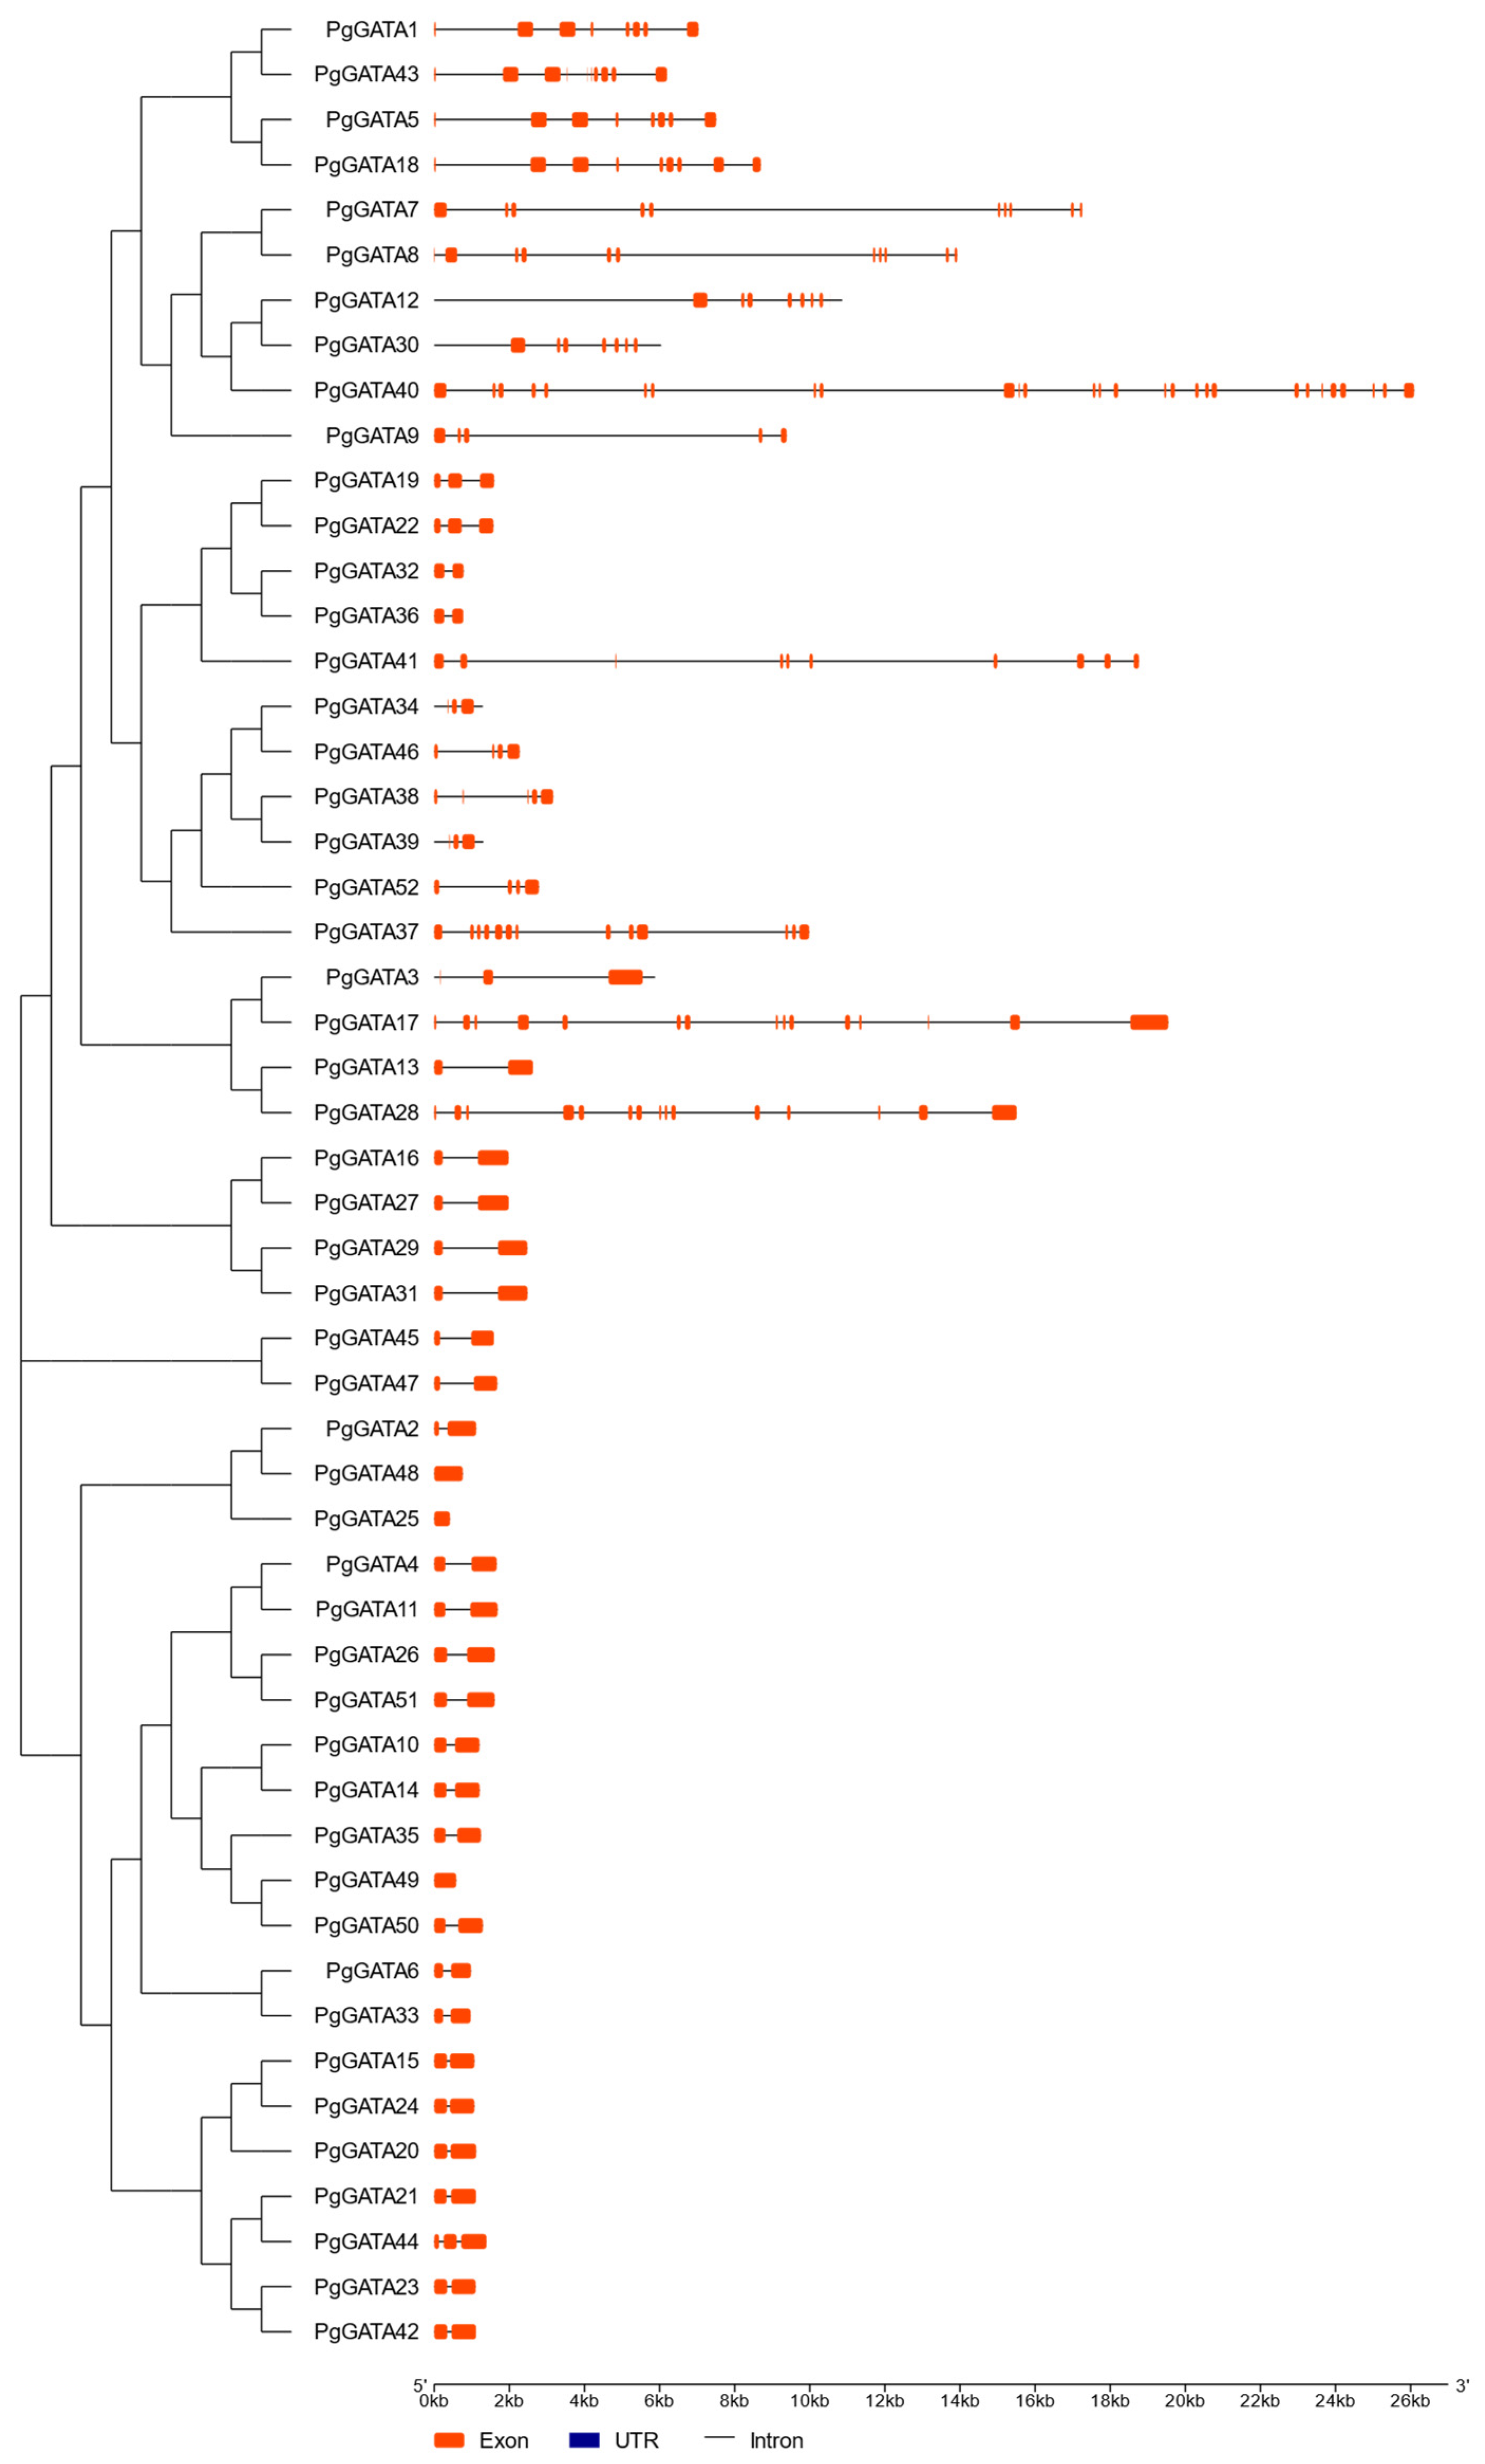
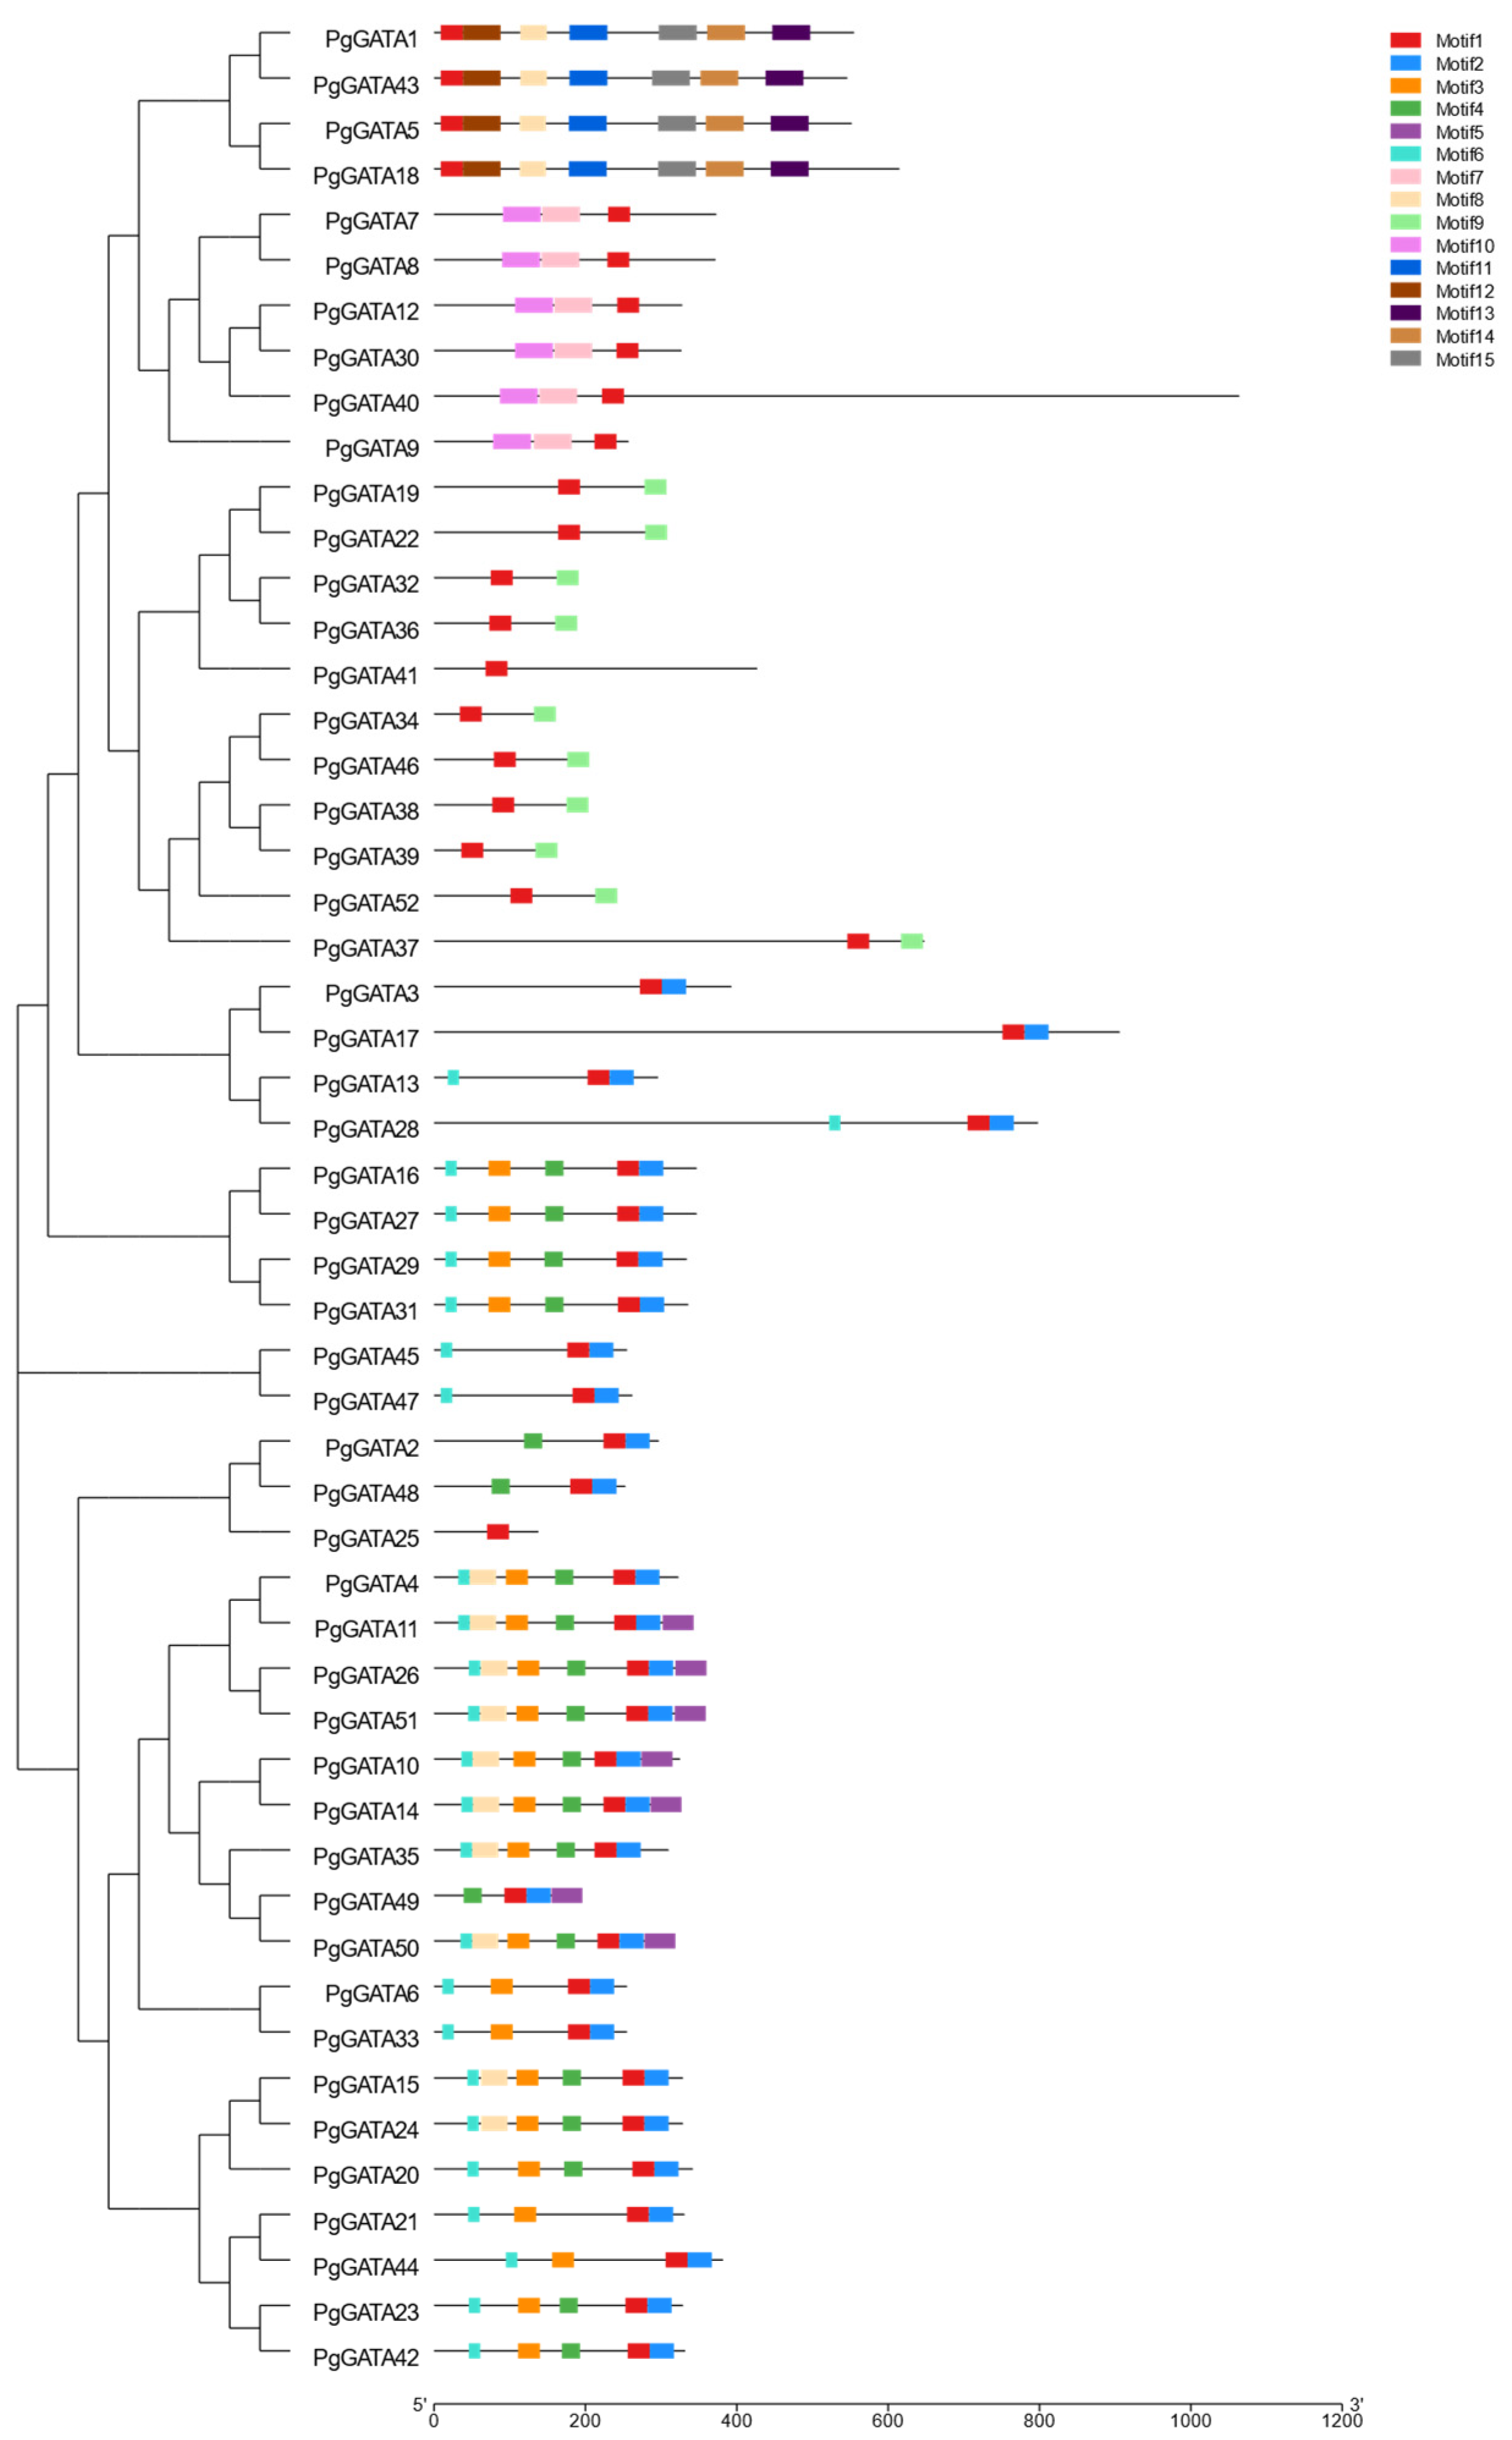
2.5. Gene Structures and Protein Motif Analyses

The Gene Structure Display Server (GSDS) tool (http://gsds.cbi.pku.edu.cn/. accessed on 23 July 2023) was utilized to determine the exon-intron organization of P. ginseng GATA genes [38]. The conserved motifs within the P. ginseng GATA family proteins were analyzed with the MEME software (version v5.0.5, http://meme-suite.org/. accessed on 23 July 2023) [39]. The search parameter for motif numbers was set to 15. The exon-intron structure and conserved motifs of PgGATA, derived from the transcriptome sequencing data, were analyzed using TBtools and the GFF3 database [40].

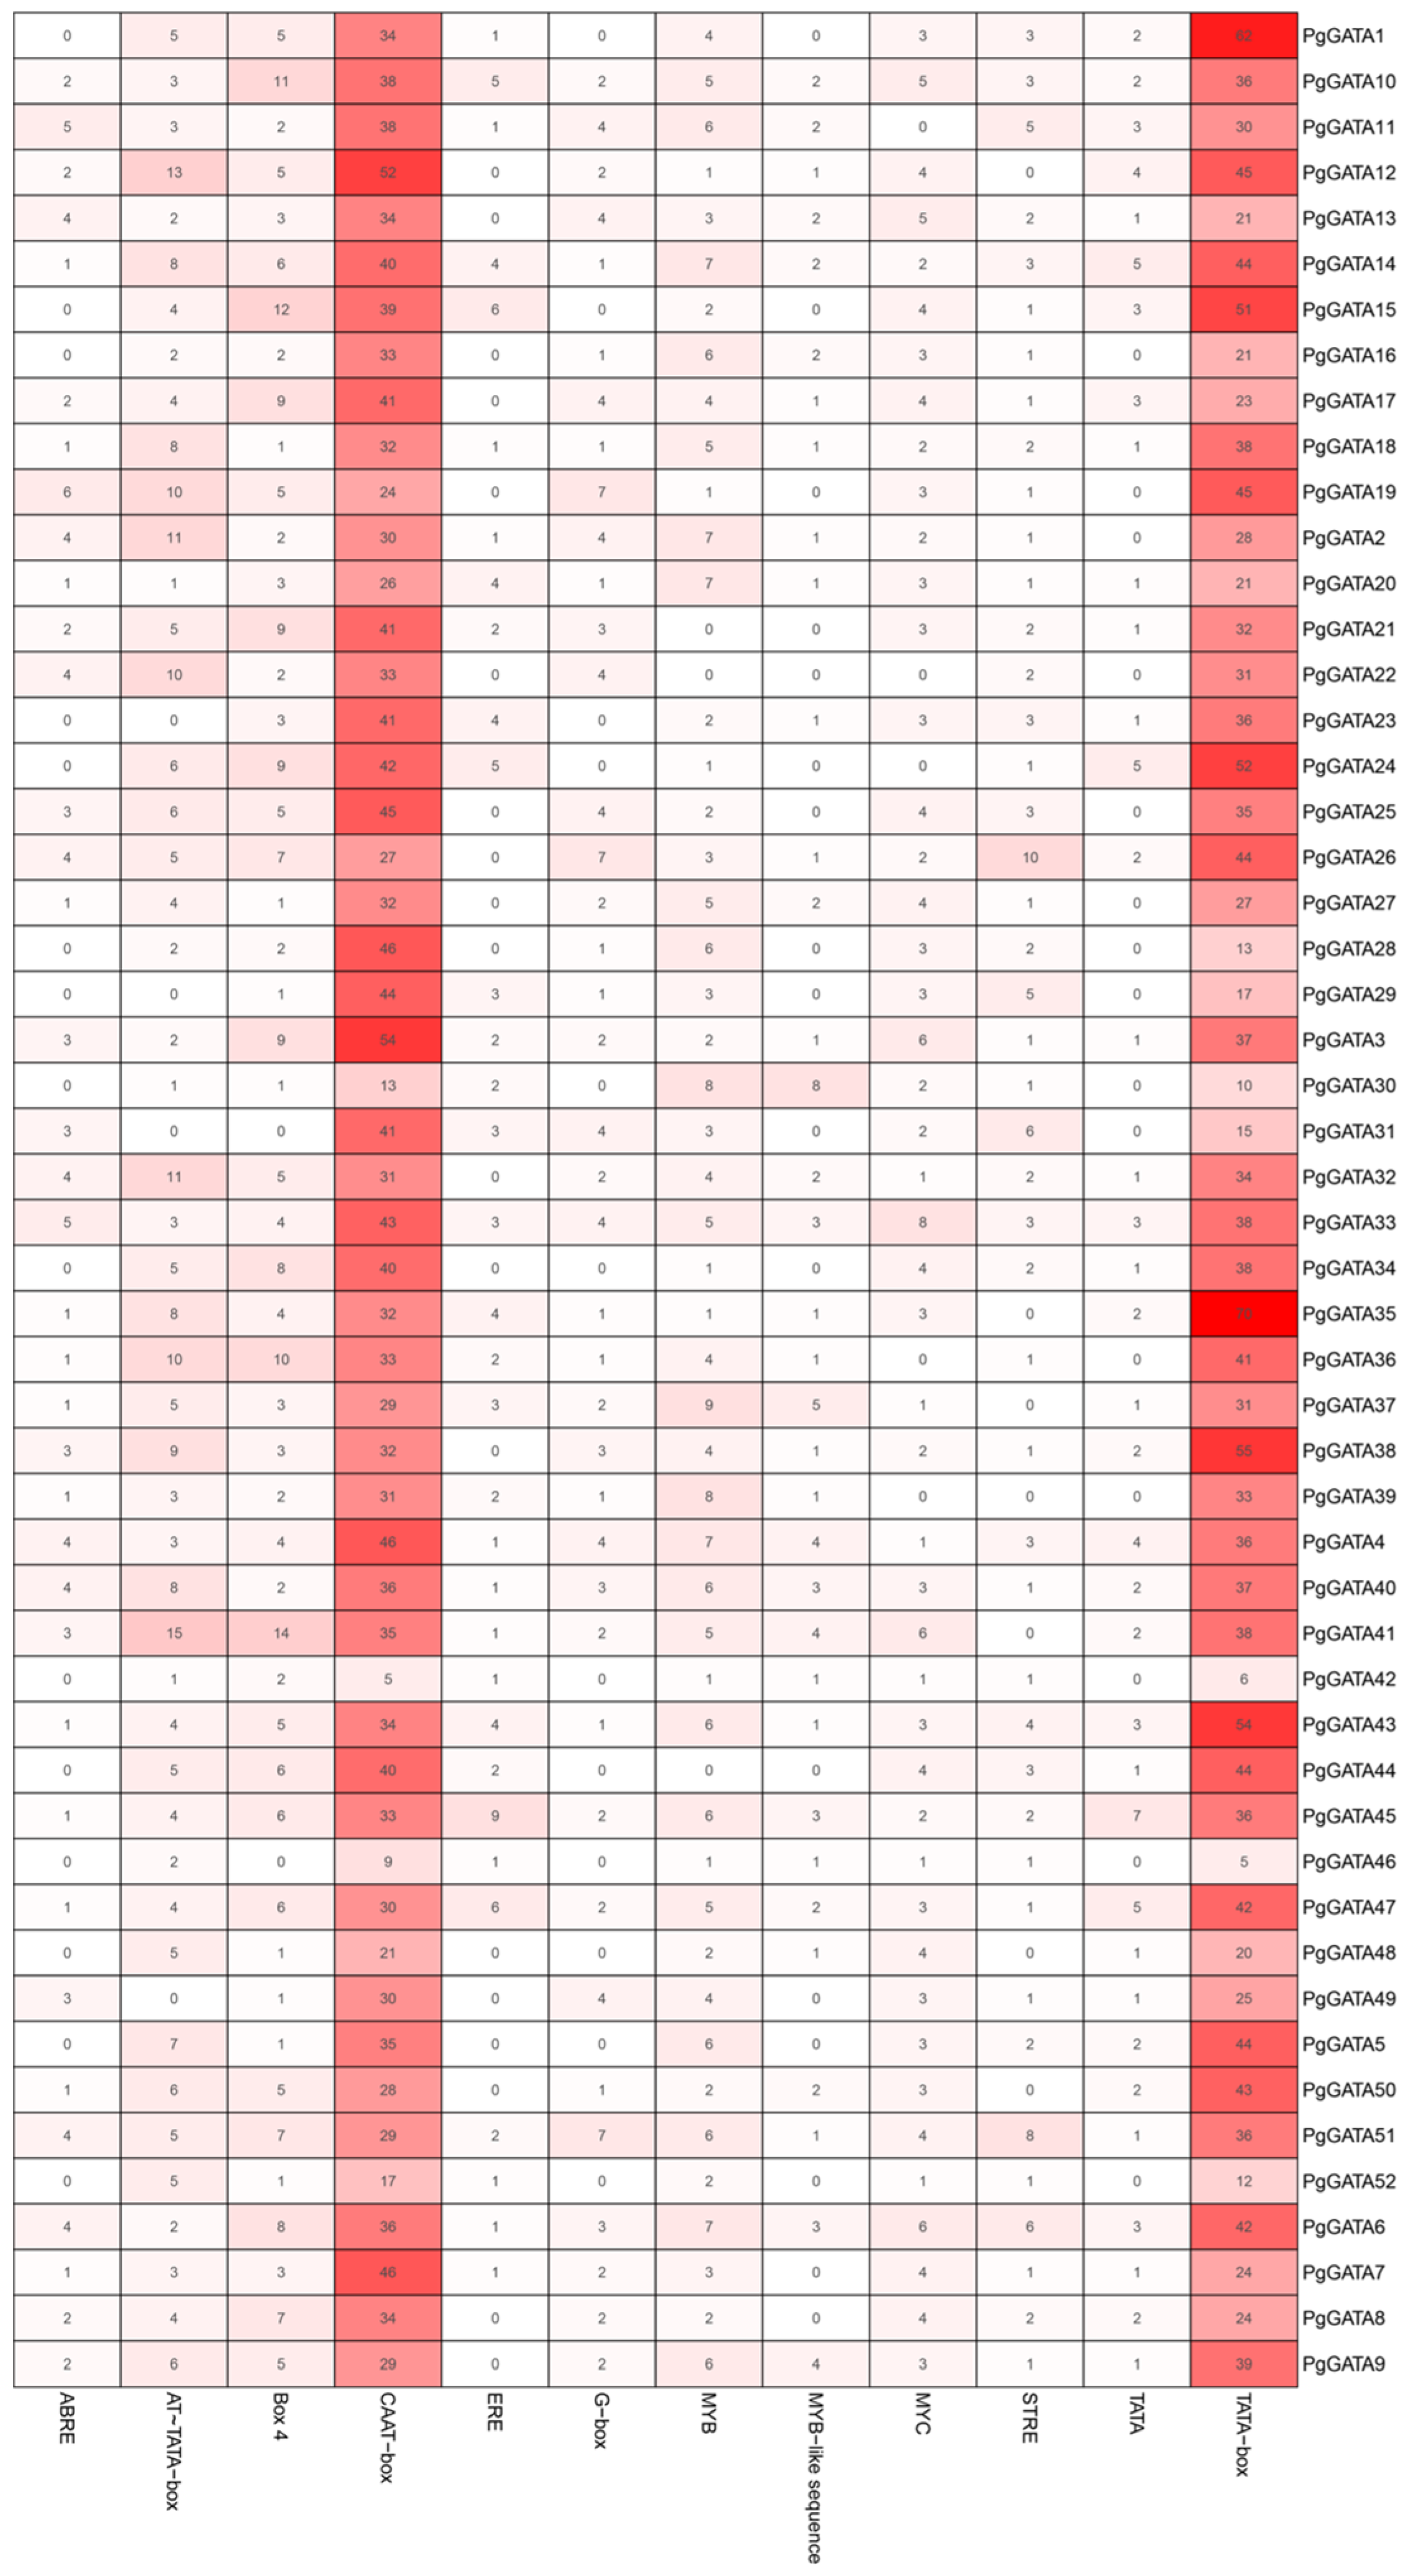
2.6. Cis-Elements in the Promoter Regions of PgGATA Genes

The promoter regulatory sequence was defined as the upstream 2000 bp region of every single gene. The PlantCARE software (version 2000, http://bioinformatics.psb.ugent.be/webtools/plantcare/html/. accessed on 23 July 2023) was utilized to analyze cis-elements within the promoter region [41]. Visual analysis was performed utilizing the TBtools software (version 2.037) [40,42].

2.7. Gene Expression Analysis

The subcellular localization of PgGATA proteins was analyzed by the WolfPsort tool (https://wolfpsort.hgc.jp/. accessed on 23 July 2023). Hierarchical clustering analysis was executed based on gene expression patterns to identify similarities and clustering in gene expression profiles. The gene expression values were quantified using the transcript per kilobase of exon per million reads mapped (TPM) values. To identify the GATA gene expression patterns in each tissue, the average expression level of three biological replicates was calculated. The data underwent normalization based on the expression level in roots. The genes with log2 ratio ≤ −0.5 and log2 ratio ≥ 0.5 were classified as differentially expressed genes (DEGs). A heatmap, depicting the expression pattern profiles on a log2 (TPM+1) and log2fold change scale, was generated using TBtools [40].

3. Results

3.1. Identifying PgGATAs in P. ginseng

A total of 52 GATA gene family members, sequentially named PgGATA1 to PgGATA52, were recognized in P. ginseng. Detailed information regarding the proteins and genes is provided in Supplemental Table S1. Table 1 presents the gene identifier in the genome database, chromosomal scaffold, and some basic genetic properties. For example, the amino acid (aa) length of the 52 PgGATA proteins ranged from 138 to 1064. PgGATA25 was recognized as the smallest protein, comprising 138 aa, while the largest was PgGATA40, containing 1064 aa. The isoelectric points (pI) ranged between 4.96 and 9.98, and the molecular weight (MW) varied from 15.77091 to 117.47788 kDa, with PgGATA42 having the lowest and PgGATA49 having the highest pIs, respectively. All PgGATA proteins were predicted to contain a GATA domain, and each had a single transcript. Additional analyses revealed that the PgGATA proteins lack transmembrane regions (TMRs), except for PgGATA17 and PgGATA28, which were predicted to possess 1 TMR each (Table 1 and Figure S1).
Additionally, the subcellular localization of the majority of PgGATA proteins was predicted to be in the nucleus. However, PgGATA2 and PgGATA30 were predicted to be localized in the chloroplasts, PgGATA28 and PgGATA37 in the plasma membrane, and PgGATA17 in the vacuole membrane. The physical mapping of PgGATA genes to the chromosomes was conducted as per the genome data (Figure 1). These 52 PgGATAs were randomly distributed across 51 scaffolds. Only PgGATA49/50 was located on Pg_scaffold8143, and its proximity to Pg_scaffold8143 suggests that these two genes form a pair of tandemly duplicated genes.

3.2. Gene Classification and Structural Analysis of PgGATAs

The exon-intron organization of all predicted PgGATA genes was analyzed to enhance understanding of the gene structure and evolution of the PgGATA family in P. ginseng. The findings demonstrated that various PgGATA genes exhibited significant differences in their exon-intron structures, ranging from 1 to 28 exons (Figure 2). Among these, the PgGATA25, PgGATA48, and PgGATA49 genes contained only one exon.
Multiple alignments of the amino acid sequences of PgGATA proteins were conducted to identify conserved protein motifs (Figure 3). In general, 15 conserved motifs were predicted in PgGATA proteins. Comprehensive information regarding the conserved motifs is available in Table S2. In total, all PgGATAs contain motif 1, while 30 out of 52 PgGATAs contain motif 2. Moreover, 21 PgGATAs contain motif 3, 20 contain motif 4, 7 contain motif 5, 24 contain motif 6, 6 contain motif 7, and 14 contain motif 8. Additionally, 10 PgGATAs contain motif 9, 6 contain motif 10, 4 contain motif 11, 4 contain motif 12, 4 contain motif 13, 4 contain motif 14, and 4 contain motif 15. Notably, motifs 7 and 10 were grouped together, and motifs 11 to 15 were grouped together. Furthermore, the GATA domain analysis depicted that its typical amino acid sites displayed high conservation (LCNACG residues) (Figure S2).
In order to investigate the potential functions of the PgGATA genes, Plant-CARE was utilized to recognize the cis-elements in the gene promoters. Various cis-elements were predicted, such as ABRE, Box 4, ERE, CAAT-box, G-box, MYB, MYC, STRE, and TATA-box. These elements were involved in ABA responses [43], anaerobic induction [44], auxin responses [45], circadian control [46], defense and stress responses [47], drought responses [48], flavonoid biosynthetic genes regulation [49], light responses [50], low-temperature responses [51], jasmonic acid (JA) responses [52], meristem expression [53], root-specific expression [54], salicylic acid (SA) responses [55], seed-specific regulation [56], transcription initiation [57], and zein metabolism regulation [58] (Figure 4 and Figure S3). In general, TATA-box and CAAT-box were the predominant cis-elements in the 52 PgGATA genes. Overall, the analysis of cis-elements suggested that a large portion of PgGATA genes are likely to be regulated at the transcriptional level.

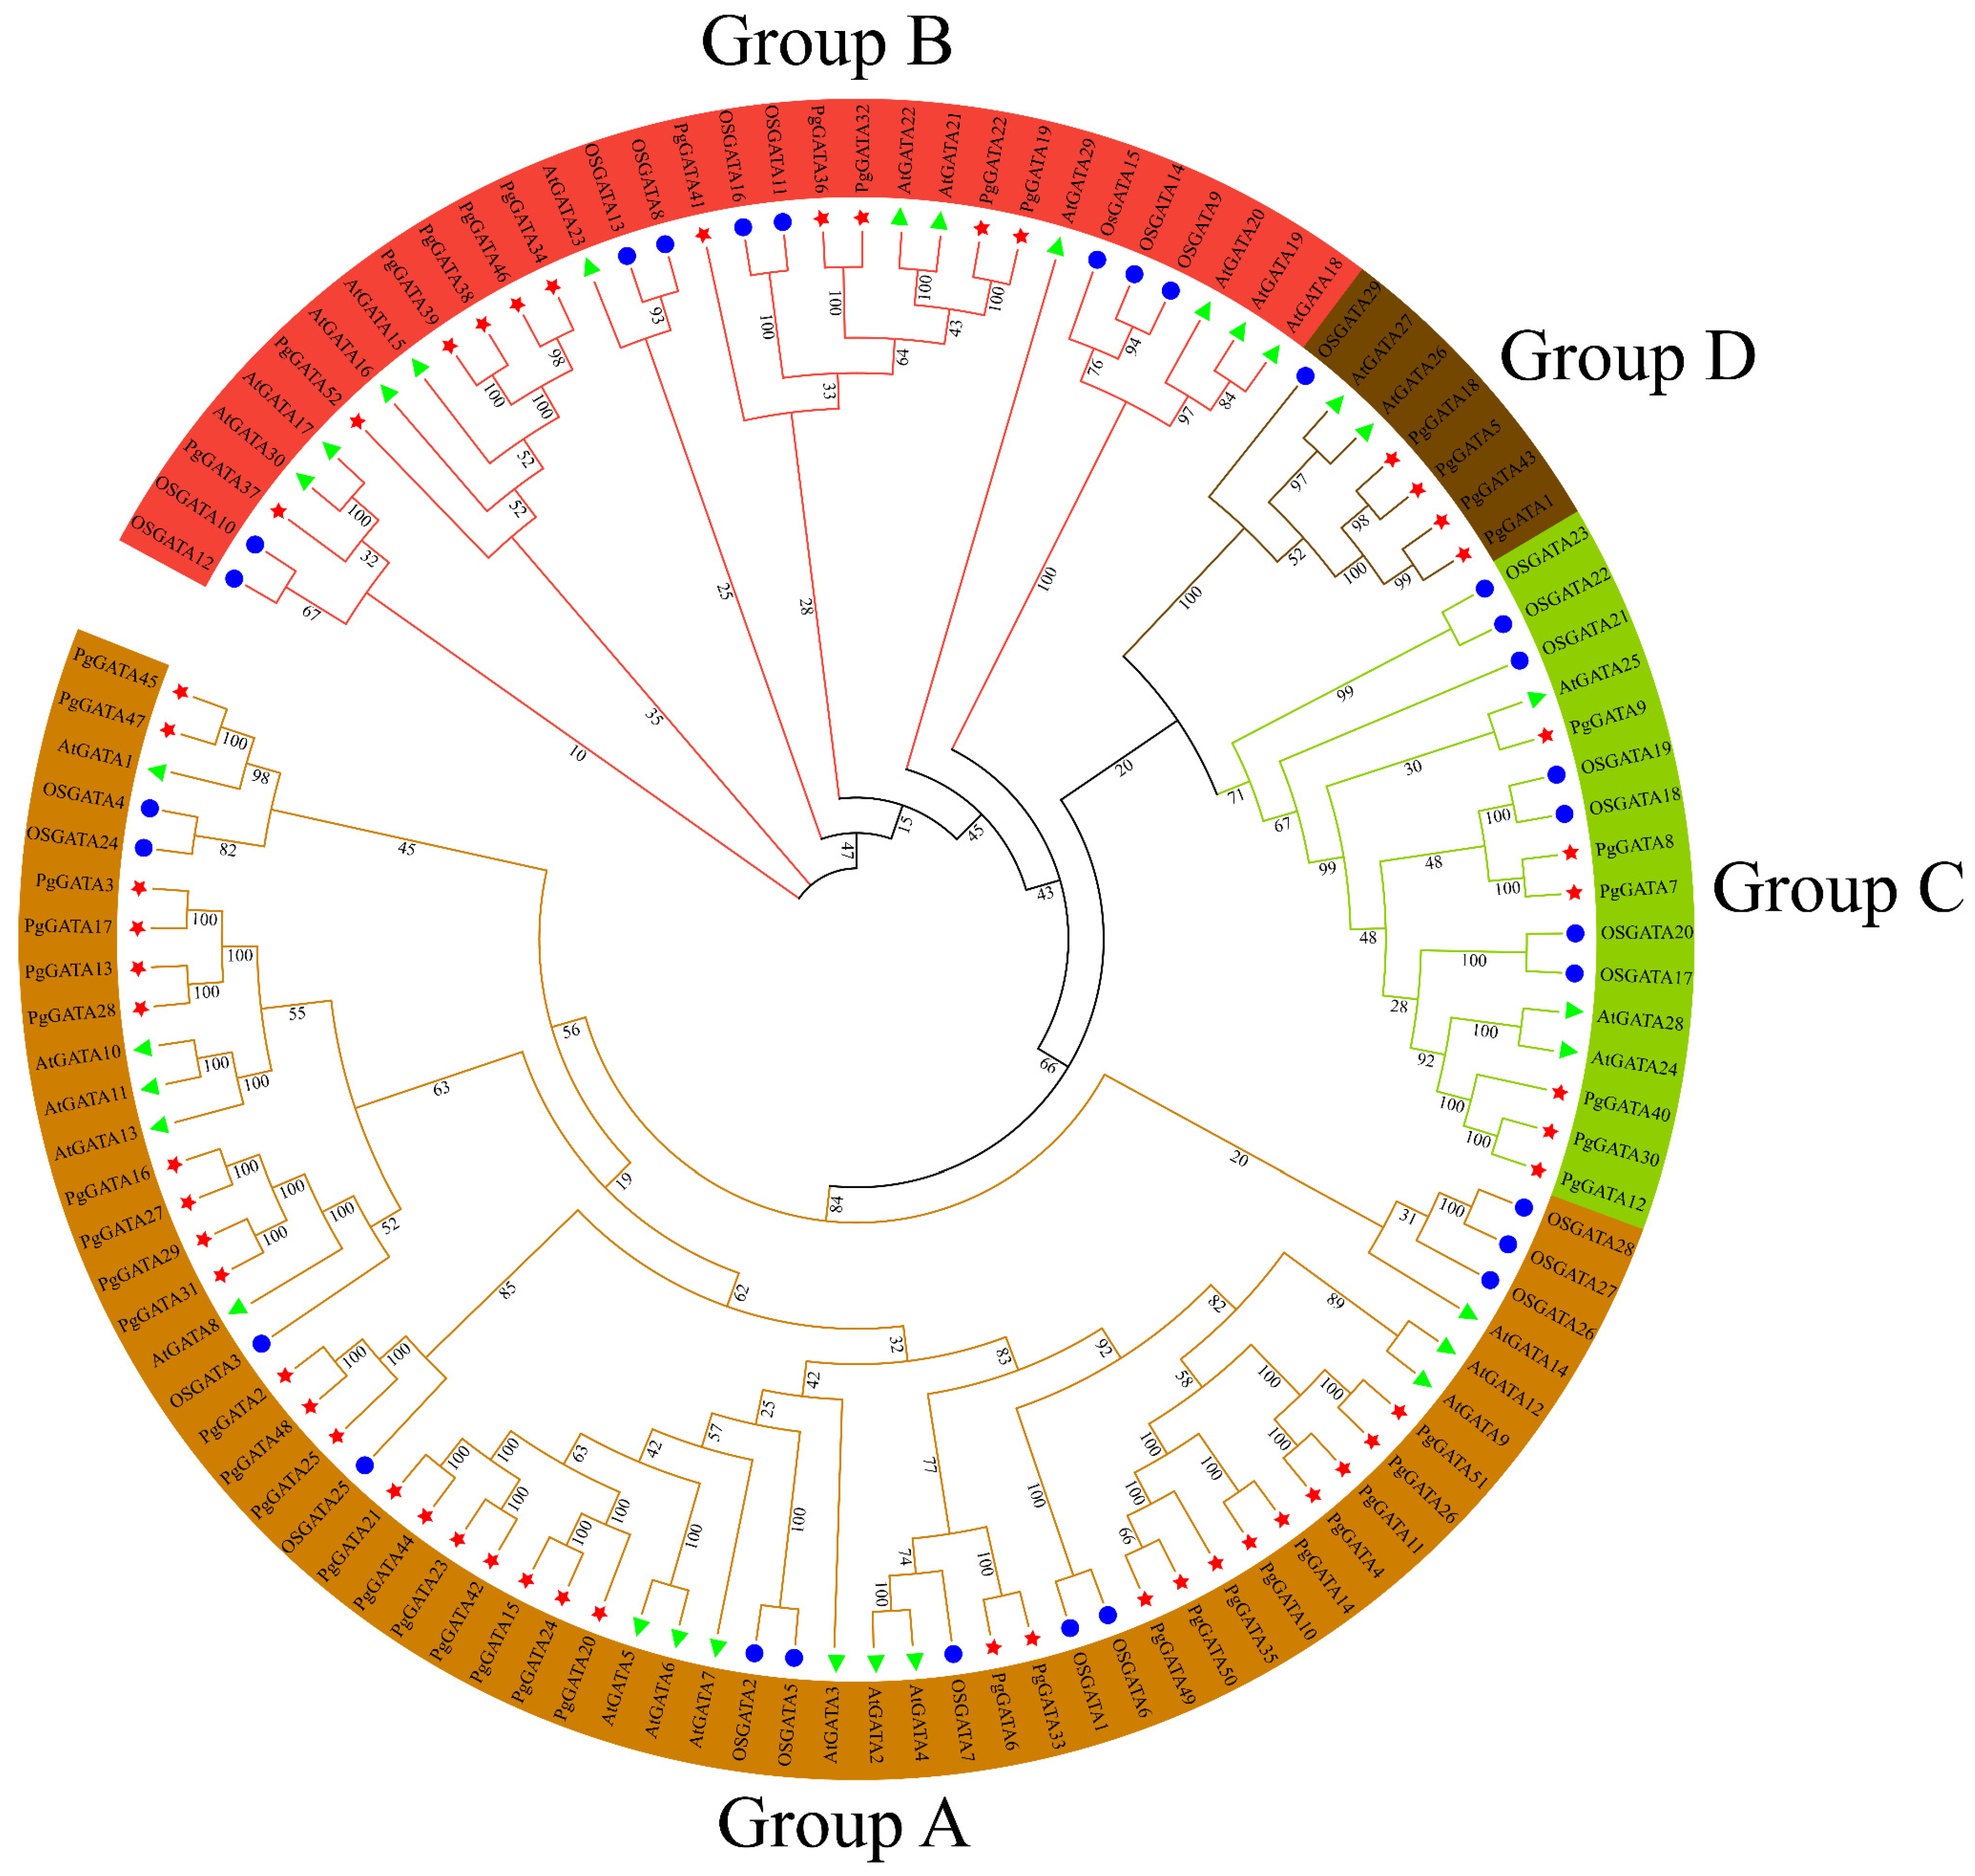
3.3. Phylogenetic Analysis of the PgGATA Proteins

To identify the phylogenetic relationships between the GATA proteins, an evolutionary tree was constructed using the alignment of 52 P. ginseng PgGATAs, 30 A. thaliana AtGATAs, and 29 O. sativa OsGATAs (Figure 5). Based on previous analyses, the 30 AtGATA proteins and 29 OsGATA proteins could be categorized into four clusters and six clusters, respectively [8]. Similarly, the P. ginseng GATA proteins were classified into four groups. Groups A, B, C, and D consisted of 31, 11, 6, and 4 PgGATA proteins, respectively. Among them, Group A contained the largest number of AtGATA, OsGATA, and PgGATA proteins, with 14, 12, and 31 of these proteins, respectively. Group D contained the lowest number of AtGATA, OsGATA, and PgGATA proteins, with two, one, and four of these proteins, respectively.

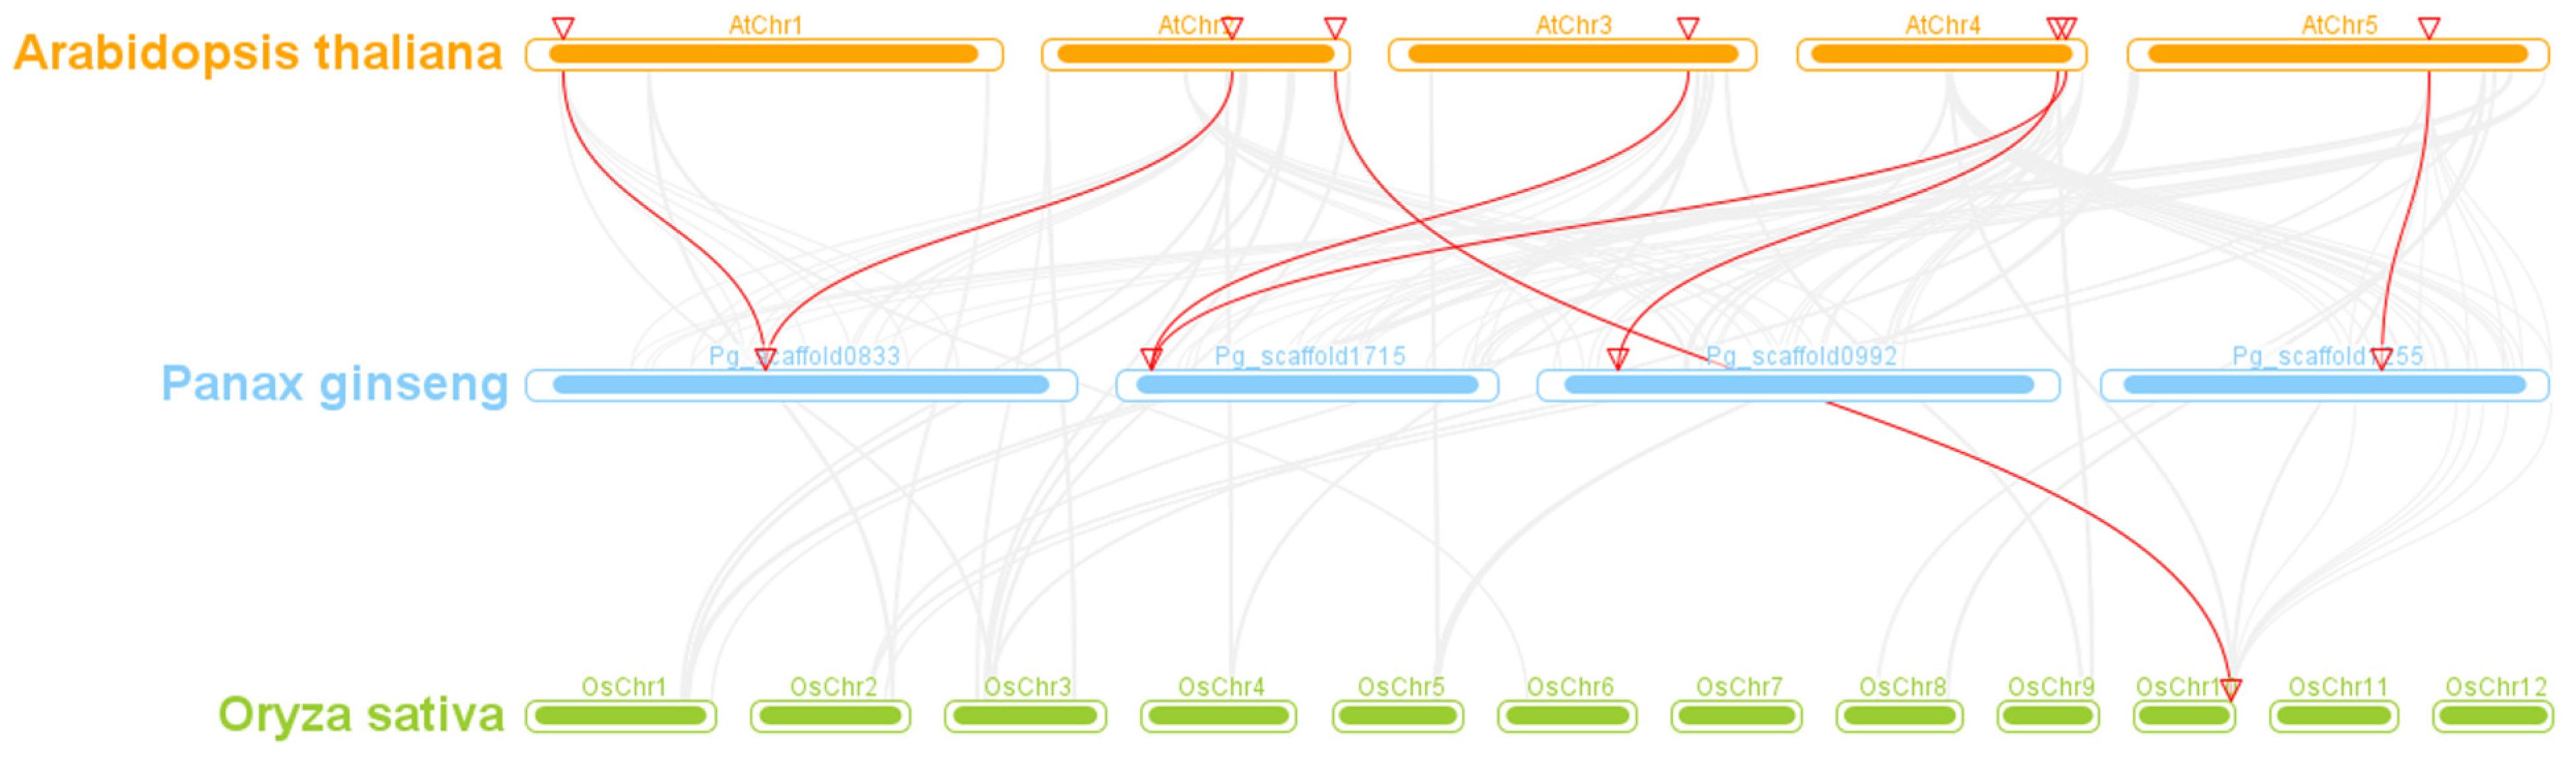
3.4. Collinearity and Ka/Ks Analyses of the PgGATA Family Members

Gene duplication is a fundamental process in the evolution of gene families, playing a pivotal function in species diversity and differentiation. A collinearity analysis was conducted among the 52 predicted PgGATAs, revealing collinearity relationships between certain PgGATA genes, including PgGATA4 and PgGATA11, PgGATA12 and PgGATA30, PgGATA13 and PgGATA3, and PgGATA1 and PgGATA18 (Figure 6). This indicates that gene duplication facilitated the generation of specific PgGATA genes, with partial duplication events emerging as a primary driver in the evolution of the PgGATA gene family. Further, the collinearity between PgGATA gene pairs in A. thaliana, P. ginseng, and O. sativa was assessed. The findings showed that one in six PgGATA genes depicted a syntenic relationship with OsGATA and AtGATA genes, respectively (Figure 7).
Ka/Ks represents the ratio of Ka to Ks between two protein-coding genes. If the Ka/Ks value is equal to one, the gene has mainly undergone neutral selection after duplication. If the Ka/Ks value is greater than one, the gene has mainly undergone positive selection after duplication. If the Ka/Ks value is less than one, it indicates that the gene has mainly undergone purifying selection after duplication. The majority of the duplicated PgGATA gene pairs exhibited Ka/Ks ratios less than 1, while PgGATA11-14 showed ratios exceeding one. The findings revealed that the PgGATA family likely underwent strong purifying selection during evolution (Table 2 and Table S3).

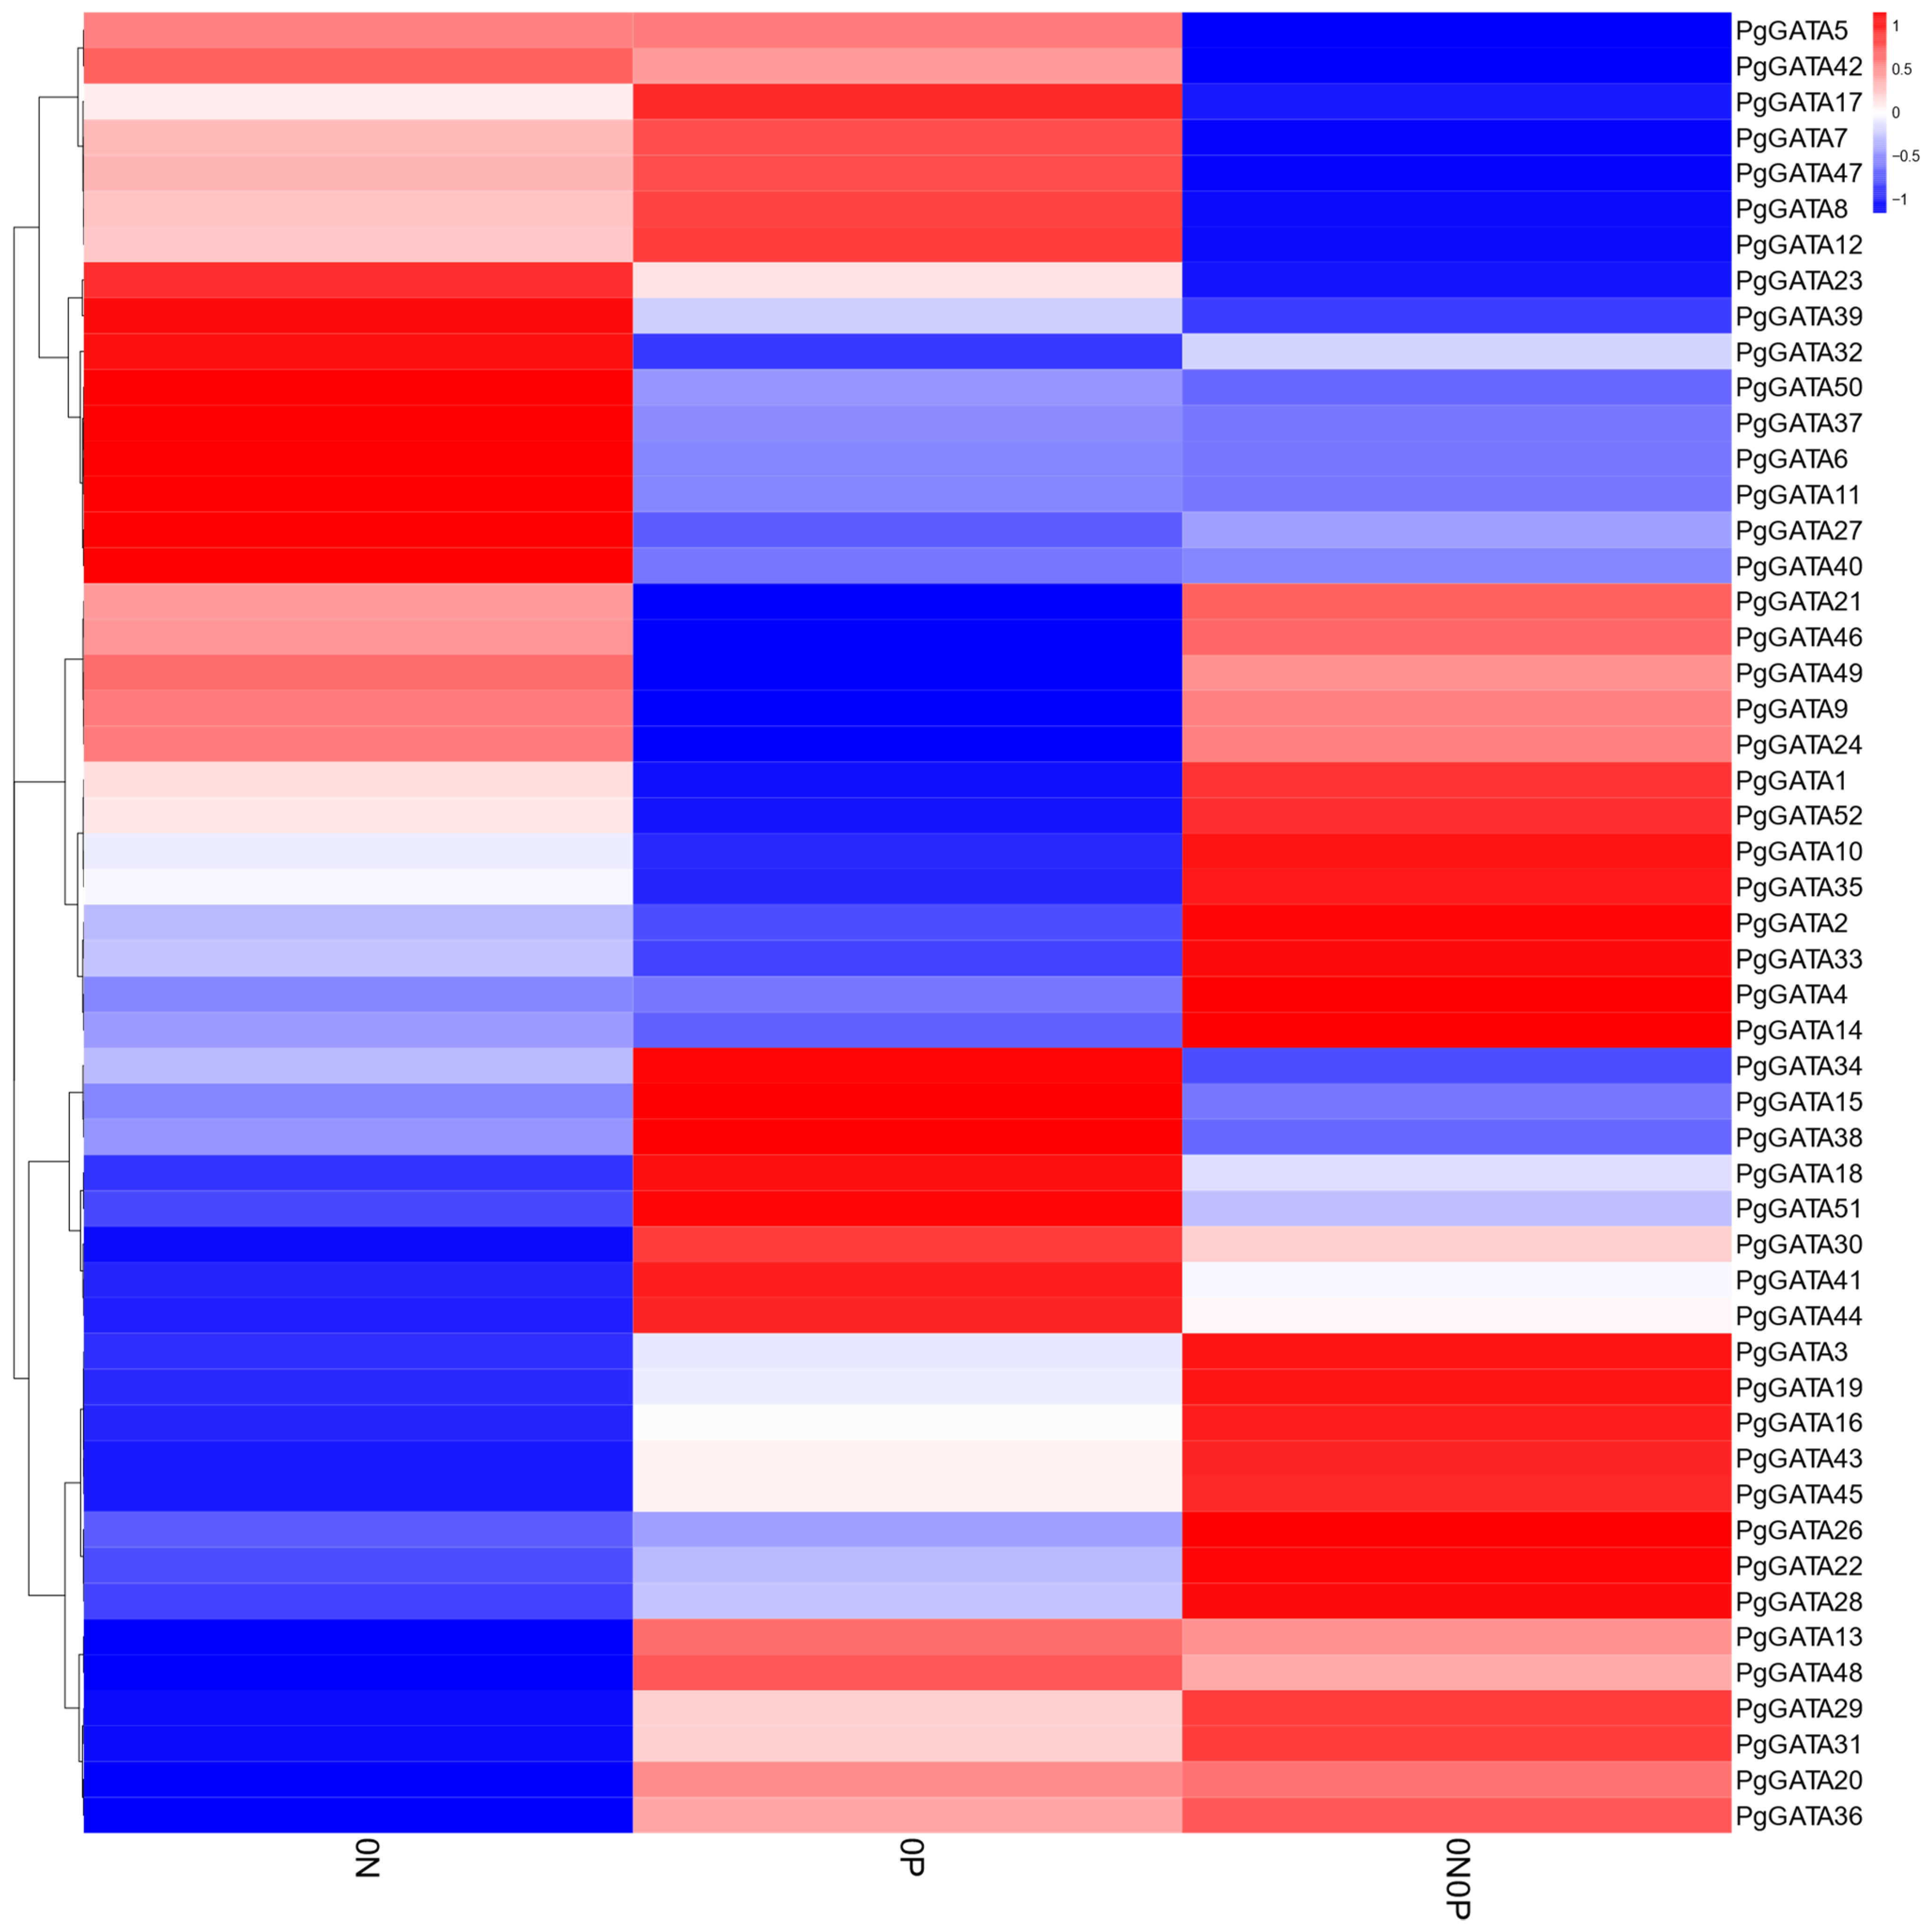
3.5. Gene Expression Analysis under N and P Deficiency

Using the P. ginseng transcriptome data, the expression levels of PgGATA genes were assessed under N and P deficiency. Overall, the expression levels of the PgGATA genes exhibited substantial changes under N and P stresses (Figure 8). Multiple PgGATA genes, specifically PgGATA6, PgGATA11, PgGATA27, PgGATA32, PgGATA37, PgGATA39, PgGATA40, and PgGATA50, exhibited upregulation under N deficiency. Meanwhile, some PgGATA genes, including PgGATA15, PgGATA18, PgGATA34, PgGATA38, PgGATA41, and PgGATA44, exhibited a significant increase in expression under P deficiency. In addition, several genes, such as PgGATA3, PgGATA4, PgGATA14, PgGATA19, and PgGATA28, were upregulated significantly under both N and P deficiency conditions.

4. Discussion

Among the TF families, MYB, ERF, bHLH, and WRKY are the most commonly studied. By increasing or decreasing the expression of related enzyme genes, these TFs participate in multiple biological processes, including environmental stress responses, plant development and growth, and saponin synthesis [59,60,61,62]. The GATA family has been extensively characterized in several plant species, encompassing A. thaliana [8], O. sativa [8], Zea mays L. [63], Setaria italica [64], Triticum aestivum L. [65], and Arachis hypogaea L. [66]. However, a genome-wide analysis of the GATA family genes in P. ginseng has not yet been conducted previously. This research predicted 52 PgGATA gene family members in the P. ginseng genome, annotated as PgGATA1 to PgGATA52 based on their chromosome scaffold. PgGATAs are categorized into four subfamilies, showing distinct variations in expression patterns and genetic structures. This study offers crucial insights for the forthcoming GATA gene functional characterization. It contributes to improving the quality properties and stress tolerance of P. ginseng through gene expression regulation.
PgGATA proteins were predicted to localize in the chloroplasts, nucleus, plasma membrane, and vacuole membrane. These observations align with previous research on GATA in potatoes [67], suggesting that PgGATA proteins may have widespread localization and potentially diverse functions. However, the subcellular localization of most of the PgGATA proteins was predicted in the nucleus. Therefore, PgGATAs probably act primarily as TFs to regulate transcription. The P. ginseng PgGATA gene family encodes proteins of 138–1064 amino acids. Their protein relative MW ranged between 15.77091 and 117.47788 kDa, and the theoretical pI fell within the range of 4.96–9.98. The gene coding sequence length, the number of introns and exons, the number and the type of conserved motifs, the transmembrane domains, and the signal peptides were significantly conserved, which may be the reason why the GATAs of P. ginseng exhibited a high degree of conservation. In this study, the observation through physical mapping revealed that the 52 PgGATA gene family members were evenly distributed on 51 scaffolds, with multiple pairs exhibiting gene collinearity, possibly resulting from gene duplications. Gene duplication events can result in the formation of numerous duplicate genes in the plant genome. The existence of duplicate genes can facilitate the evolution of new gene functions and increase the adaptive ability of plants toward environmental changes [68].
Phylogenetic analysis indicated that the GATA proteins from P. ginseng, A. thaliana, and O. sativa were classified into A, B, C, and D groups. This classification is consistent with the grouping of GATA proteins in Setaria italica [64], A. hypogaea L. [66], Populus alba [69], Sorghum bicolor [70], Zea mays L. [71], and Fagopyrum tataricum [72]. Specifically, subgroup A had the highest number of GATAs, and members within the same subgroups exhibited higher sequence similarity. The conserved domain analysis depicted that the motif 11–15 domains were exclusively present in PgGATA1, PgGATA3, PgGATA5, and PgGATA18. The gene structure analysis revealed that introns ranged from 1 to 27, while the exons ranged from 1 to 28. These obtained exons and introns were significantly higher than those observed in GATA proteins in other plants, such as S. italica [64], A. hypogaea L. [66], Populus alba [69], and S. bicolor [70]. This suggests that GATA genes may undergo gain or loss of exons or introns throughout the process of chromosomal rearrangements in different species.
GATA TFs are commonly found in plants. They were critically involved in the regulation of various aspects of plant physiology. These functions include the control of flower development, light signal transduction, leaf extension and growth, plant flowering time, and photoperiod, all of which are tightly linked to plant growth and development [8,21,25,73,74]. The first GATA factor discovered possessed light and circadian clock-related cis-elements in its promoter [74]. Additionally, the involvement of A. thaliana GATA factors AtGATA1, AtGATA2, and AtGATA4 have been reported in light regulation of gene expression and photomorphogenesis [20,74]. Certainly, the existence of specific cis-elements in the promoter region of the GATA TFs can provide valuable insights into predicting their functions. The analysis of the promoters in the PgGATA family members revealed the presence of many important regulatory cis-elements involved in light responsiveness, circadian control, palisade mesophyll cell differentiation, phytohormone responsiveness, and root-specific expression. These elements are intricately linked to regulating plant growth. Thus, PgGATAs may regulate plant growth through these cis-elements, affecting their gene expression and thereby precisely regulating downstream gene expression. Recent research has demonstrated that the GATA transcription factor AreA plays a dual role in regulating ganoderic acid (GA) biosynthesis in Ganoderma lucidum. AreA acts as a transcription factor by directly binding to the promoter of the fps gene, which encodes farnesyl-diphosphate synthase involved in GA biosynthesis, leading to the activation of gene expression. Additionally, AreA promotes the transcription of the N metabolism gene (NR), enhancing the uptake and utilization of N sources, resulting in the generation of nitric oxide (NO) that negatively impacts GA biosynthesis [75]. The fps gene is crucial in the biosynthetic pathway of ginsenosides in ginseng. Consequently, variations in GATA expression levels in ginseng may influence the expression of triterpenoid biosynthetic genes like mevalonate-5-pyrophosphate decarboxylase (MVD), farnesyl pyrophosphate synthase (FPS), squalene synthase (SOS), and lanosterol synthase (LS) under N and P deficiency conditions. In this context, cis-elements play a pivotal role, particularly the unique microtubule-binding domain and conserved zinc finger DNA binding domain of the AreA coding gene, likely binding specifically to the sequence (ATC)GATA(AG) in its C-terminal region [75].
N and P are vital nutrients essential for plant growth and development. Inadequate levels of N and P in soil serve as primary limiting factors for plant growth, impacting both crop yield and quality. When cultivating medicinal plants, emphasis should be placed on optimizing both yield and quality [76,77]. Hence, effective management of N and P nutrients is critical in ginseng cultivation. Phosphorus plays a crucial role in enhancing the growth of ginseng fibrous roots and boosting root biomass [77]. Elevated levels of nitrogen may lead to direct effects from the nutrient itself or indirect alterations in soil and plant characteristics, potentially influencing soil fungal communities associated with ginseng and consequently affecting plant growth [78,79]. A recent study observed that the synergistic effects of moderate N and potassium (K) levels in low P soil significantly promoted ginseng root development, while the application of N and P fertilizers markedly increased both ginseng yield and ginsenoside contents [77]. The involvement of GATA TFs in the regulation of N metabolism in plants is evident. Prior research has demonstrated the involvement of certain GATA TFs in nitrate metabolism [14,15]. For instance, nitrate triggers the expression of AtCGA1 and AtGNC genes. These genes, in turn, have been predicted as regulators of N assimilation gene expression, including glutamate synthase (GLU1/Fd-GOGAT), a key factor in the regulation of N metabolism in green tissues of plants [15,79]. Under N deficiency stress, the chlorophyll content of A. thaliana overexpressing the Populus alba PdGATA19 was 26.12% higher than that of the wild type. PdGNC overexpression also increased the photosynthetic capacity and nitrate utilization efficiency in transgenic A. thaliana at low N levels [80]. The DNA binding domain of GATA TFs consists of an IV-type zinc finger motif (C-X2-C-X17-20-C-X2-C) succeeded by a basic region [81]. Research has demonstrated that this zinc finger motif can be significantly upregulated under P deficiency conditions [82]. However, there is a lack of direct evidence elucidating the specific regulatory function of GATA TFs in relation to phosphorus. Consequently, the regulatory capacity of GATA TFs in phosphorus signaling remains an area with substantial research prospects.
In this study, transcriptome analysis of P. ginseng under N and P deficiency stresses depicted significant alterations in the expression levels of PgGATA genes. However, among them, some genes did not exhibit upregulation under N induction. It is important to emphasize that the absence of upregulation does not preclude their involvement in the regulation of N metabolism, given the intricate interconnection of nutrient elements within plants. Research indicates a synergistic regulatory interplay between N and P, aimed at achieving a harmonized balance of diverse nutrients in plants [83]. For instance, in O. sativa, the nitrogen sensor NRT1.1B has been observed to interact with the phosphorus sensor SPX4, facilitating the degradation of the SPX4 protein. This degradation releases the nitrate signal core transcription factor NLP3 into the nucleus, thereby activating downstream gene expression and initiating the nitrate response. SPX4, serving as a phosphorus sensor, modulates the nucleocytoplasmic translocation of the phosphorus signal core transcription factor PHR2 based on cytoplasmic phosphorus concentrations. The nitrate-triggered degradation of SPX4 protein mediated by NRT1.1B leads to the nuclear translocation of PHR2, subsequently inducing the expression of genes associated with phosphorus deficiency responses. Consequently, nitrate, functioning as a signaling molecule, orchestrates the synergistic activation of genes responsive to nitrate and phosphorus deficiency via the NRT1.1B-SPX4-NBIP1 pathway, thereby ensuring the equilibrium of nitrogen and phosphorus, two pivotal plant nutrients [83,84]. In this study, we found that some genes, namely PgGATA2, PgGATA4, PgGATA14, and PgGATA33 from group A, exhibited heightened expression levels exclusively under concurrent N and P deficiency conditions. Analogous to the transcription factors NLP3 and PHR2, these PgGATA genes may be jointly activated in response to simultaneous N and P deficiency scenarios to regulate the nutritional equilibrium between N and P. Although further experimental validation is warranted, these findings suggest a substantial role for these genes in modulating the cross-talk between N and P signaling and assimilation under conditions of N and P deficiency.
In brief, this research conducted a comprehensive characterization of the P. ginseng GATA family members concerning their annotation, chromosome location, expression profiles, gene structure, and phylogeny. The members mainly responsive to N and P stresses were screened out. These findings establish a theoretical foundation for subsequent studies of the function of the PgGATA gene family.

5. Conclusions

This research explored the biological functions of the P. ginseng GATA gene family in development, growth, and stress. Moreover, bioinformatics was utilized to identify 52 PgGATA gene family members in the P. ginseng genome. A thorough and systematic examination was conducted from the aspects of chromosome scaffold, expression analysis, gene structure, and phylogeny. The findings demonstrated that the 52 PgGATA gene family members were distributed on 51 scaffolds, with the number of amino acid residues encoded by each member varying from 138 to 1064. The protein MW ranged between 15.77091 and 117.47788 kDa, with the majority of proteins located in the nucleus, followed by the chloroplast, plasma membrane, and vacuole membrane. The exon-intron structures of various PgGATA genes exhibited noticeable variations, encompassing a range of 1 to 28 exons. Under N and P deficiency conditions, the expression levels of PgGATA genes exhibited significant alterations. The expressions of PgGATA6, PgGATA11, PgGATA27, PgGATA32, PgGATA37, PgGATA39, PgGATA40, and PgGATA50 were upregulated under N deficiency, while PgGATA15, PgGATA18, PgGATA34, PgGATA38, PgGATA41, and PgGATA44 genes exhibited upregulation under P deficiency. Notably, PgGATA3, PgGATA4, PgGATA14, PgGATA19, and PgGATA28 were upregulated under both N and P deficiency. These findings establish a theoretical foundation for a thorough analysis of the contributions of the PgGATA gene family.

Supplementary Materials

The following supporting information can be downloaded at: https://www.mdpi.com/article/10.3390/horticulturae10030282/s1, Figure S1: Number of predicted TMRs of PgGATA17 and PgGATA28 proteins in P. ginseng; Figure S2. Multiple sequence alignment of PgGATA gene family in P. ginseng; Figure S3. Promoter element prediction analysis of PgGATA genes. Table S1: The list of PgGATA genes predicted in P. ginseng; Table S2: The list of PgGATA conserved motifs in P. ginseng; Table S3: Characteristics of PgGATA genes in P. ginseng.

Author Contributions

Conceptualization, H.L. and Y.Z.; Data curation, H.S.; Formal analysis, C.S.; Investigation, B.L.; Methodology, H.L., H.S. and J.Q.; Software, J.Q. and C.S.; Validation, J.Z.; Visualization, J.Z. and B.L.; Writing—original draft, H.L. and Y.Z.; Writing—review and editing, Y.Z. All authors have read and agreed to the published version of the manuscript.

Funding

This study was supported by the China Agriculture Research System of MOF [MARA(CARS-21)], the CAAS Agricultural Science and Technology Innovation Program (CAAS-XTCX20190025-6), the National Key R&D Program of China (2021YFD1600902), the Non-Woodland Old Ginseng Land Remediation Technology and Cultivation Demonstration (LNFYZBDL-JL18-246C), and the Science and Technology Development Program of Jilin Province (20200708024YY, 20210401106YY).

Data Availability Statement

Data are contained within the article and supplementary files.

Acknowledgments

We thank Guiyang Watch Biotechnology for their advice on gene family data analyses.

Conflicts of Interest

The authors declare no conflicts of interest.

References

  1. Jin, J.; He, K.; Tang, X.; Li, Z.; Lv, L. An Arabidopsis transcriptional regulatory map reveals distinct functional and evolutionary features of novel transcription factors. Mol. Biol. Evol. 2015, 32, 1767–1773. [Google Scholar] [CrossRef] [PubMed]
  2. Franco-Zorrilla, J.M.; López-Vidriero, I.; Carrasco, J.L.; Godoy, M.; Vera, P.; Solano, R. DNA-binding specifcities of plant transcription factors and their potential to defne target genes. Proc. Natl. Acad. Sci. USA 2014, 111, 2367–2372. [Google Scholar] [CrossRef] [PubMed]
  3. Ribeiro, B.; Erffelinck, M.-L.; Lacchini, E.; Ceulemans, E.; Colinas, M.; Williams, C.; Van Hamme, E.; De Clercq, R.; Perassolo, M.; Goossens, A. Interference between ER stress-related bZIP-type and jasmonate-inducible bHLH-type transcription factors in the regulation of triterpene saponin biosynthesis in Medicago truncatula. Front. Plant Sci. 2022, 13, 903793. [Google Scholar] [CrossRef] [PubMed]
  4. Kong, L.; Sun, J.; Jiang, Z.; Ren, W.; Wang, Z.; Zhang, M.; Liu, X.; Wang, L.; Ma, W.; Xu, J. Identification and expression analysis of YABBY family genes in Platycodon grandiflorus. Plant Signal. Behav. 2023, 18, 1. [Google Scholar] [CrossRef]
  5. Long, G.; Zhao, C.; Zhao, P.; Zhou, C.; Zhou, Y. Transcriptomic response to cold of thermophilous medicinal plant Marsdenia tenacissima. Gene 2020, 742, 144602. [Google Scholar] [CrossRef]
  6. Yang, S.; Zhang, X.; Zhang, X.; Bi, Y.; Gao, W. A bZIP transcription factor, PqbZIP1, is involved in the plant defense response of American ginseng. PeerJ 2022, 10, e12939. [Google Scholar] [CrossRef] [PubMed]
  7. Honghong, J.; Zhongyi, H.; Junhui, Z.; Jin, H.; Yuyang, Z.; Yingping, W.; Yuan, Y.; Luqi, H. Genome-wide analysis of Panax MADS-box genes reveals role of PgMADS41 and PgMADS44 in modulation of root development and ginsenoside synthesis. Int. J. Biol. Macromol. 2023, 233, 123648. [Google Scholar] [CrossRef]
  8. Reyes, J.C.; Muro-Pastor, M.I.; Florencio, F.J. The GATA family of transcription factors in Arabidopsis and rice. Plant Physiol. 2004, 134, 1718–1732. [Google Scholar] [CrossRef]
  9. Zhang, Z.; Ren, C.; Zou, L.; Wang, Y.; Li, S. Characterization of the GATA gene family in Vitis vinifera: Genome-wide analysis, expression profiles, and involvement in light and phytohormone response. Genome 2018, 61, 713–723. [Google Scholar] [CrossRef]
  10. Daniel-Vedele, F.; Caboche, M. A tobacco cDNA clone encoding a GATA-1 zinc finger protein homologous to regulators of nitrogen metabolism in fungi. Mol. Gen. Genet. 1993, 240, 365–373. Available online: https://hal.inrae.fr/hal-02703632 (accessed on 10 July 2023). [CrossRef]
  11. Tudzynski, B. Nitrogen regulation of fungal secondary metabolism in fungi. Front. Microbiol. 2014, 5, 656. [Google Scholar] [CrossRef]
  12. Zhao, Y.; Medrano, L.; Ohashi, K.; Fletcher, J.C.; Yu, H.; Sakai, H.; Meyerowitz, E.M. HANABA TARANU is a GATA transcription factor that regulates shoot apical meristem and flower development in Arabidopsis. Plant Cell 2004, 16, 2586–2600. [Google Scholar] [CrossRef] [PubMed]
  13. Liu, P.P.; Koizuka, N.; Martin, R.C.; Nonogaki, H. The BME3 (Blue Micropylar End 3) GATA zinc finger transcription factor is a positive regulator of Arabidopsis seed germination. Plant J. 2005, 44, 960–971. [Google Scholar] [CrossRef] [PubMed]
  14. Bi, Y.M.; Zhang, Y.; Signorelli, T.; Zhao, R.; Zhu, T.; Rothstein, S. Genetic analysis of Arabidopsis GATA transcription factor gene family reveals a nitrate-inducible member important for chlorophyll synthesis and glucose sensitivity. Plant J. 2005, 44, 680–692. [Google Scholar] [CrossRef]
  15. Hudson, D.; Guevara, D.; Yaish, M.W.; Hannam, C.; Long, N.; Clarke, J.D.; Bi, Y.M.; Rothstein, S.J. GNC and CGA1 modulate chlorophyll biosynthesis and glutamate synthase (GLU1/Fd-GOGAT) expression in Arabidopsis. PLoS ONE 2011, 6, e26765. [Google Scholar] [CrossRef] [PubMed]
  16. Shikata, M.; Matsuda, Y.; Ando, K.; Nishii, A.; Takemura, M.; Yokota, A.; Kohchi, T. Characterization of Arabidopsis ZIM, a member of a novel plant-specific GATA factor gene family. J. Exp. Bot. 2004, 55, 631–639. [Google Scholar] [CrossRef] [PubMed]
  17. Kiba, T.; Naitou, T.; Koizumi, N.; Yamashino, T.; Sakakibara, H.; Mizuno, T. Combinatorial microarray analysis revealing Arabidopsis genes implicated in cytokinin responses through the His->Asp Phosphorelay circuitry. Plant Cell Physiol. 2005, 46, 339–355. [Google Scholar] [CrossRef]
  18. Richter, R.; Behringer, C.; Zourelidou, M.; Schwechheimer, C. Convergence of auxin and gibberellin signaling on the regulation of the GATA transcription factors GNC and GNL in Arabidopsis thaliana. Proc. Natl. Acad. Sci. USA 2013, 110, 13192–13197. [Google Scholar] [CrossRef]
  19. Huang, X.Y.; Chao, D.Y.; Gao, J.P.; Zhu, M.Z.; Shi, M.; Lin, H.X. A previously unknown zinc finger protein, DST, regulates drought and salt tolerance in rice via stomatal aperture control. Genes Dev. 2009, 23, 1805–1817. [Google Scholar] [CrossRef] [PubMed]
  20. Luo, X.M.; Lin, W.H.; Zhu, S.; Zhu, J.Y.; Sun, Y.; Fan, X.Y.; Cheng, M.; Hao, Y.; Oh, E.; Tian, M.; et al. Integration of light- and brassinosteroid-signaling pathways by a GATA transcription factor in Arabidopsis. Dev. Cell 2010, 19, 872–883. [Google Scholar] [CrossRef]
  21. Hudson, D.; Guevara, D.R.; Hand, A.J.; Xu, Z.; Hao, L.; Chen, X.; Zhu, T.; Bi, Y.M.; Rothstein, S.J. Rice cytokinin GATA transcription Factor1 regulates chloroplast development and plant architecture. Plant Physiol. 2013, 162, 132–144. [Google Scholar] [CrossRef]
  22. Wang, L.; Yin, H.; Qian, Q.; Yang, J.; Huang, C.; Hu, X.; Luo, D. NECK LEAF 1, a GATA type transcription factor, modulates organogenesis by regulating the expression of multiple regulatory genes during reproductive development in rice. Cell Res. 2009, 19, 598–611. [Google Scholar] [CrossRef] [PubMed]
  23. Jayakodi, M.; Choi, B.S.; Lee, S.C.; Kim, N.H.; Park, J.Y.; Jang, W.; Lakshmanan, M.; Mohan, S.V.G.; Lee, D.Y.; Yang, T.J. Ginseng Genome Database: An open-access platform for genomics of Panax ginseng. BMC Plant Biol. 2018, 18, 62. [Google Scholar] [CrossRef] [PubMed]
  24. Paek, K.Y.; Chakrabarty, D.; Hahn, E.J. Application of bioreactor systems for large scale production of horticultural and medicinal plants. Plant Cell Tiss. Organ. Cult. 2005, 81, 287–300. [Google Scholar] [CrossRef]
  25. Hayama, R.; Coupland, G. Shedding light on the circadian clock and the photoperiodic control of flowering. Curr.Opin. Plant Biol. 2003, 6, 13–19. [Google Scholar] [CrossRef] [PubMed]
  26. Chiang, Y.H.; Zubo, Y.O.; Tapken, W.; Kim, H.J.; Lavanway, A.M.; Howard, L.; Pilon, M.; Kieber, J.J.; Schaller, G.E. Functional characterization of the GATA transcription factors GNC and CGA1 reveals their key role in chloroplast development, growth, and division in Arabidopsis. Plant Physiol. 2012, 160, 332–348. [Google Scholar] [CrossRef]
  27. Hoagland, D.R.; Arnon, D.I. The water culture method for growing plants without soil. Calif. Agric. Exp. Stn. Circ. 1950, 347, 1–32. [Google Scholar] [CrossRef]
  28. Qin, Y.; Li, X.; Wu, Y.; Wang, H.; Han, G.; Yan, Z. The Effect of Soil Enzymes and Polysaccharides Secreted by the Roots of Salvia miltiorrhiza Bunge under Drought, High Temperature, and Nitrogen and Phosphorus Deficits. Phyton-Int. J. Exp. Bot. 2024, 93, 119–135. [Google Scholar] [CrossRef]
  29. Kersey, P.J.; Allen, J.E.; Allot, A. Ensembl Genomes 2018: An integrated omics infrastructure for non-vertebrate species. Nucleic Acids Res. 2018, 46, D802–D808. [Google Scholar] [CrossRef]
  30. Finn, R.D.; Clements, J.; Eddy, S.R. HMMER web server: Interactive sequence similarity searching. Nucleic Acids Res. 2011, 39, W29–W37. [Google Scholar] [CrossRef]
  31. Altschul, S.F.; Gish, W.; Miller, W.; Myers, E.W.; Lipman, D.J. Basic local alignment search tool. J. Mol. Biol. 1990, 215, 403–410. [Google Scholar] [CrossRef]
  32. Finn, R.D.; Bateman, A.; Clements, J.; Coggill, P.; Eberhardt, R.Y.; Eddy, S.R.; Heger, A.; Hetherington, K.; Holm, L.; Mistry, J.; et al. Pfam: The protein families database. Nucleic Acids Res. 2014, 42, D222–D230. [Google Scholar] [CrossRef] [PubMed]
  33. Artimo, P.; Jonnalagedda, M.; Arnold, K.; Baratin, D.; Csardi, G.; Castro, E.; Duvaud, S.; Flegel, V.; Fortier, A.; Gasteiger, E.; et al. ExPASy: SIB bioinformatics resource portal. Nucleic Acids Res. 2012, 40, W597–W603. [Google Scholar] [CrossRef] [PubMed]
  34. Kumar, S.; Nei, M.; Dudley, J.; Tamura, K. MEGA: A biologist-centric software for evolutionary analysis of DNA and protein sequences. Brief. Bioinform. 2008, 9, 299–306. [Google Scholar] [CrossRef] [PubMed]
  35. Letunic, I.; Bork, P. Interactive Tree Of Life (iTOL) v4: Recent updates and new developments. Nucleic Acids Res. 2019, 47, W256–W259. [Google Scholar] [CrossRef] [PubMed]
  36. Wang, Y.; Tang, H.; Debarry, J.D.; Tan, X.; Li, J.; Wang, X.; Lee, T.H.; Jin, H.; Marler, B.; Guo, H.; et al. MCScanX: A toolkit for detection and evolutionary analysis of gene synteny and collinearity. Nucleic Acids Res. 2012, 40, e49. [Google Scholar] [CrossRef] [PubMed]
  37. Wang, D.; Zhang, Y.; Zhang, Z.; Zhu, J.; Yu, J. KaKs_Calculator 2.0: A toolkit incorporating gamma-series methods and sliding window strategies. Genom. Proteom. Bioinform. 2010, 8, 77–80. [Google Scholar] [CrossRef] [PubMed]
  38. Hu, B.; Jin, J.; Guo, A.Y.; Zhang, H.; Luo, J.; Gao, G. GSDS 2.0: An upgraded gene feature visualization server. Bioinformatics 2015, 31, 1296–1307. [Google Scholar] [CrossRef] [PubMed]
  39. Bailey, T.L.; Boden, M.; Buske, F.A.; Frith, M.; Grant, C.E.; Clementi, L.; Ren, J.; Li, W.W.; Noble, W.S. MEME SUITE: Tools for motif discovery and searching. Nucleic Acids Res. 2009, 37, W202–W208. [Google Scholar] [CrossRef]
  40. Chen, C.; Chen, H.; Zhang, Y.; Thomas, H.R.; Frank, M.H.; He, Y.; Xia, R. TBtools: An Integrative Toolkit Developed for Interactive Analyses of Big Biological Data. Mol. Plant. 2020, 13, 1194–1202. [Google Scholar] [CrossRef]
  41. Lescot, M.; Déhais, P.; Thijs, G.; Marchal, K.; Moreau, Y.; Peer, Y.V.; Rouzé, P.; Rombauts, S. PlantCARE, a database of plant cis-acting regulatory elements and a portal to tools for in silico analysis of promoter sequences. Nucleic Acids Res. 2002, 30, 325–327. [Google Scholar] [CrossRef]
  42. Waterhouse, A.M.; Procter, J.B.; Martin, D.M.; Clamp, M.; Barton, G.J. Jalview Version 2—A multiple sequence alignment editor and analysis workbench. Bioinformatics 2009, 25, 1189–1191. [Google Scholar] [CrossRef]
  43. Mundy, J.; Yamaguchi-Shinozaki, K.; Chua, N.H. Nuclear proteins bind conserved elements in the abscisic acid-responsive promoter of a rice rab gene. Proc. Natl. Acad. Sci. USA 1990, 87, 1406–1410. [Google Scholar] [CrossRef] [PubMed]
  44. Dolferus, R.; Klok, E.J.; Ismond, K.; Delessert, C.; Wilson, S.; Good, A.; Peacock, J.; Dennis, L. Molecular basis of the anaerobic response in plants. IUBMB Life 2001, 51, 79–82. [Google Scholar] [CrossRef]
  45. Shin, R.; Burch, A.Y.; Huppert, K.A.; Tiwari, S.B.; Murphy, A.S.; Guilfoyle, T.J.; Schachtman, D.P. The Arabidopsis transcription factor MYB77 modulates auxin signal transduction. Plant Cell 2007, 19, 2440–2453. [Google Scholar] [CrossRef]
  46. Mizoguchi, T.; Wheatley, K.; Hanzawa, Y.; Wright, L.; Mizoguchi, M.; Song, H.R.; Carre, I.A.; Coupland, G. LHY and CCA1 are partially redundant genes required to maintain circadian rhythms in Arabidopsis. Dev. Cell. 2002, 2, 629–641. [Google Scholar] [CrossRef]
  47. Lopez-Maury, L.; Marguerat, S.; Bahler, J. Tuning gene expression to changing environments: From rapid responses to evolutionary adaptation. Nat. Rev. Genet. 2008, 9, 583–593. [Google Scholar] [CrossRef] [PubMed]
  48. Abe, H.; Urao, T.; Ito, T.; Seki, M.; Shinozaki, K.; Yamaguchi-Shinozaki, K. Arabidopsis AtMYC2 (bHLH) and AtMYB2 (MYB) function as transcriptional activators in abscisic acid signaling. Plant Cell 2003, 15, 63–78. [Google Scholar] [CrossRef]
  49. Stracke, R.; Ishihara, H.; Hirofumi, H.; Gunnar, B.; Barsch, A.; Aiko, M.; Mehrtens, F.; Niehaus, K.; Weisshaar, B. Differential regulation of closely related R2R3-MYB transcription factors controls flavonol accumulation in different parts of the Arabidopsis thaliana seedling. Plant J. 2007, 50, 660–677. [Google Scholar] [CrossRef]
  50. Gilmartin, P.M.; Sarokin, L.; Memelink, J.; Chua, N.H. Molecular light switches for plant genes. Plant Cell 1990, 2, 369. [Google Scholar] [CrossRef] [PubMed]
  51. Zhang, Y.; Wu, L.; Liu, L.; Jia, B.; Ye, Z.; Tang, X.; Heng, W.; Liu, L. Functional Analysis of PbbZIP11 Transcription Factor in Response to Cold Stress in Arabidopsis and Pear. Plants 2023, 13, 24. [Google Scholar] [CrossRef] [PubMed]
  52. Yang, Y.; Zhang, K.; Yang, L.; Lv, X.; Wu, Y.; Liu, H.; Lu, Q.; Chen, D.; Qiu, D. Identification and characterization of MYC transcription factors in Taxus sp. Gene 2018, 675, 1–8. [Google Scholar] [CrossRef] [PubMed]
  53. Lee, D.K.; Geisler, M.; Springer, P.S. LATERAL ORGAN FUSION1 and LATERAL ORGAN FUSION2 function in lateral organ separation and axillary meristem formation in Arabidopsis. Development 2009, 136, 2423–2432. [Google Scholar] [CrossRef]
  54. Banerjee, J.; Sahoo, D.K.; Raha, S.; Sarkar, S.; Dey, N.; Maiti, I.B. A region containing an as-1 element of Dahlia Mosaic Virus (DaMV) subgenomic transcript promoter plays a key role in green tissue-and root-specific expression in plants. Plant Mol. Biol. Rep. 2015, 33, 532–556. [Google Scholar] [CrossRef]
  55. Ali, Q.; Mushtaq, N.; Amir, R.; Gul, A.; Tahir, M.; Munir, F. Genome-wide promoter analysis, homology modeling and protein interaction network of Dehydration Responsive Element Binding (DREB) gene family in Solanum tuberosum. PLoS ONE 2021, 16, e0261215. [Google Scholar] [CrossRef]
  56. Zhang, Y.; Cao, G.; Qu, L.J.; Gu, H. Characterization of Arabidopsis MYB transcription factor gene AtMYB17 and its possible regulation by LEAFY and AGL15. J. Genet. Genom. 2009, 36, 99–107. [Google Scholar] [CrossRef]
  57. Dikstein, R. The unexpected traits associated with core promoter elements. Transcription 2011, 2, 201–206. [Google Scholar] [CrossRef]
  58. Paz-Ares, J.; Ghosal, D.; Wienand, U.; Peterson, P.A.; Saedler, H. The regulatory c1 locus of Zea mays encodes a protein with homology to myb proto-oncogene products and with structural similarities to transcriptional activators. EMBO J. 1987, 6, 3553–3558. [Google Scholar] [CrossRef]
  59. Liu, T.; Luo, T.; Guo, X.; Zou, X.; Zhou, D.; Afrin, S.; Li, G.; Zhang, Y.; Zhang, R.; Luo, Z. PgMYB2, a MeJA-Responsive Transcription Factor, Positively Regulates the Dammarenediol Synthase Gene Expression in Panax Ginseng. Int. J. Mol. Sci. 2019, 20, 2219. [Google Scholar] [CrossRef]
  60. Jie, Z.; Juan, L.; Chao, J.; Tie-Gui, N.; Li-Ping, K.; Li, Z.; Yuan, Y.; Lu-Qi, H. Expression analysis of transcription factor ERF gene family of Panax ginseng. China J. Chin. Mater. Medica 2020, 45, 2515–2522. [Google Scholar] [CrossRef]
  61. Di, P.; Wang, P.; Yan, M.; Han, P.; Huang, X.; Yin, L.; Yan, Y.; Xu, Y.; Wang, Y. Genome-wide characterization and analysis of WRKY transcription factors in Panax ginseng. BMC Genom. 2021, 22, 834. [Google Scholar] [CrossRef]
  62. Chu, Y.; Xiao, S.; Su, H.; Liao, B.; Zhang, J.; Xu, J.; Chen, S. Genome-wide characterization and analysis of bHLH transcription factors in Panax ginseng. Acta Pharm. Sin. B 2018, 8, 666–677. [Google Scholar] [CrossRef] [PubMed]
  63. Long, J.; Xiaoming, Y.; Dianyuan, C.; Hu, F.; Jianming, L. Identification, Phylogenetic Evolution and Expression Analysis of GATA Transcription Factor Family in Maize (Zea mays). Int. J. Agric. Biol. 2020, 23, 637–643. [Google Scholar]
  64. Lai, D.; Yao, X.; Yan, J.; Gao, A.; Yang, H.; Xiang, D.; Ruan, J.; Fan, Y.; Cheng, J. Genome-wide identification, phylogenetic and expression pattern analysis of GATA family genes in foxtail millet (Setaria italica). BMC Genom. 2022, 23, 549. [Google Scholar] [CrossRef]
  65. Feng, X.; Yu, Q.; Zeng, J.; He, X.; Liu, W. Genome-wide identification and characterization of GATA family genes in wheat. BMC Plant Biol. 2022, 22, 372. [Google Scholar] [CrossRef]
  66. Li, X.; Deng, X.; Han, S.; Zhang, X.; Dai, T. Genome-Wide Identification and Expression Analysis of GATA Gene Family under Different Nitrogen Levels in Arachis hypogaea L. Agronomy 2023, 13, 215. [Google Scholar] [CrossRef]
  67. Yu, R.; Chang, Y.; Chen, H.; Feng, J.; Wang, H.; Tian, T.; Gao, G. Genome-wide identification of the GATA gene family in potato (Solanum tuberosum L.) and expression analysis. J. Plant Biochem. Biotechnol. 2022, 31, 37–48. [Google Scholar] [CrossRef]
  68. Panchy, N.; Lehti-Shiu, M.; Shiu, S.H. Evolution of Gene Duplication in Plants. Plant Physiol. 2016, 171, 2294–2316. [Google Scholar] [CrossRef] [PubMed]
  69. Zhao, K.; Nan, S.; Li, Y.; Yu, C.; Zhou, L.; Hu, J.; Jin, X.; Han, Y.; Wang, S. Comprehensive Analysis and Characterization of the GATA Gene Family, with Emphasis on the GATA6 Transcription Factor in Poplar. Int. J. Mol. Sci. 2023, 24, 14118. [Google Scholar] [CrossRef] [PubMed]
  70. Yao, X.; Lai, D.; Zhou, M.; Ruan, J.; Ma, C.; Wu, W.; Weng, W.; Fan, Y.; Cheng, J. Genome-wide identification, evolution and expression pattern analysis of the GATA gene family in Sorghum bicolor. Front. Plant Sci. 2023, 14, 1163357. [Google Scholar] [CrossRef]
  71. Hu, Y.; Huang, J.; Yu, L.; Wang, C.; Zhang, X.; Cheng, X.; Yu, H.; Zhang, K. Identification, Characterization, and Expression Profiling of Maize GATA Gene Family in Response to Abiotic and Biotic Stresses. Agronomy 2023, 13, 1921. [Google Scholar] [CrossRef]
  72. Yao, X.; Zhou, M.; Ruan, J.; He, A.; Ma, C.; Wu, W.; Lai, D.; Fan, Y.; Gao, A.; Weng, W.; et al. Genome-Wide Identification, Evolution, and Expression Pattern Analysis of the GATA Gene Family in Tartary Buckwheat (Fagopyrum tataricum). Int. J. Mol. Sci. 2022, 23, 12434. [Google Scholar] [CrossRef] [PubMed]
  73. Terzaghi, W.B.; Cashmore, A.R. Light-regulated transcription. Annu. Rev. Plant Physiol. Plant Mol. Biol. 1995, 46, 445–474. [Google Scholar] [CrossRef]
  74. Jeong, M.J.; Shih, M.C. Interaction of a GATA factor with cis-acting elements involved in light regulation of nuclear genes encoding chloroplast glyceraldehyde-3-phosphate dehydrogenase in Arabidopsis. Biochem. Biophys. Res. Commun. 2003, 300, 555–562. [Google Scholar] [CrossRef] [PubMed]
  75. Jing, Z.; Zehua, S.; Dengke, S.; Shuqi, S.; Lingdan, L.; Liang, S.; Ang, R.; Hanshou, Y.; Mingwen, Z. Dual functions of AreA, a GATA transcription factor, on influencing ganoderic acid biosynthesis in Ganoderma lucidum. Environ. Microbiol. 2019, 21, 4166–4179. [Google Scholar] [CrossRef]
  76. Ostadi, A.; Javanmard, A.; Machiani, M.A.; Morshedloo, M.R.; Nouraein, M.; Rasouli, F.; Maggi, F. Effect of different fertilizer sources and harvesting time on the growth characteristics, nutrient uptakes, essential oil productivity and composition of Mentha x piperita L. Ind. Crops Prod. 2020, 148, 112290. [Google Scholar] [CrossRef]
  77. Sun, J.; Luo, H.; Yu, Q.; Kou, B.; Jiang, Y.; Weng, L.; Xiao, C. Optimal NPK Fertilizer Combination Increases Panax ginseng Yield and Quality and Affects Diversity and Structure of Rhizosphere Fungal Communities. Front. Microbiol. 2022, 13, 919434. [Google Scholar] [CrossRef]
  78. Guo, Q.; Yan, L.; Korpelainen, H.; Niinemets, Ü.; Li, C. Plant-plant interactions and n fertilization shape soil bacterial and fungal communities. Soil. Biol. Biochem. 2018, 128, 127–138. [Google Scholar] [CrossRef]
  79. Du, Y.; Wang, T.; Wang, C.; Anane, P.S.; Liu, S.; Paz-Ferreiro, J. Nitrogen fertilizer is a key factor affecting the soil chemical and microbial communities in a Mollisol. Can. J. Microbiol. 2019, 65, 510–521. [Google Scholar] [CrossRef] [PubMed]
  80. An, Y.; Han, X.; Tang, S.; Xia, X.; Yin, W. Erratum to: Poplar GATA transcription factor PdGNC is capable of regulating chloroplast ultrastructure, photosynthesis, and vegetative growth in Arabidopsis under varying nitrogen levels. Plant Cell 2014, 119, 329. [Google Scholar] [CrossRef]
  81. Lowry, J.A.; Atchley, W.R. Molecular evolution of the GATA family of transcription factors: Conservation within the DNA-binding domain. J. Mol. Evol. 2000, 50, 103–115. [Google Scholar] [CrossRef] [PubMed]
  82. Devaiah, B.N.; Nagarajan, V.K.; Raghothama, K.G. Phosphate homeostasis and root development in Arabidopsis are synchronized by the zinc finger transcription factor ZAT6. Plant Physiol. 2007, 145, 147–159. [Google Scholar] [CrossRef] [PubMed]
  83. Chu, C.C.; Wang, Y.; Wang, E.T. Improving the utilization efficiency of nitrogen, phosphorus and potassium: Current situation and future perspectives. Sci. Sin. Vitae 2021, 51, 1415–1423. [Google Scholar] [CrossRef]
  84. Hu, B.; Jiang, Z.; Wang, W.; Qiu, Y.; Zhang, Z.; Liu, Y.; Li, A.; Gao, X.; Liu, L.; Qian, Y.; et al. Nitrate-NRT1.1B-SPX4 cascade integrates nitrogen and phosphorus signalling networks in plants. Nat. Plants 2019, 5, 401–413. [Google Scholar] [CrossRef]
Figure 1. Chromosome scaffolds of PgGATA genes in P. ginseng. The physical location map was drawn based on the scaffold of the PgGATA genes on the chromosomes by MG2G.
Horticulturae 10 00282 g001
Figure 2. Structure of PgGATA genes. Introns, exons, and untranslated regions (UTRs) are represented by black lines, deep orange boxes, and blue boxes, respectively.
Horticulturae 10 00282 g002
Figure 3. PgGATA gene family motifs in P. ginseng. The various conserved motifs are labeled with colored boxes.
Horticulturae 10 00282 g003
Figure 4. Promoter element prediction analysis of PgGATA genes. Transcription factor binding sites within a region 2000 bp upstream of the start site of PgGATAs were predicted. Each colored block with numbers represents the number of cis-elements in the P. ginseng GATA promoter. The redder the color represents the higher the number of cis-elements.
Horticulturae 10 00282 g004
Figure 5. Phylogenetic tree of full-length PgGATA, AtGATA, and OsGATA proteins. The different-colored arcs indicate subfamilies of the GATA proteins. The tree was constructed using identified 52 PgGATAs (asterisks) in P. ginseng, 30 AtGATAs (triangle), and 29 OsGATAs (circle) from A. thaliana and O. sativa, respectively. The unrooted neighbor-joining phylogenetic tree was constructed using MEGA10 with full-length amino acid sequences, and the bootstrap test replicate was set to 1000 times. The green triangle represents A. thaliana, the blue circle represents O. sativa, and the red star represents P. ginseng.
Horticulturae 10 00282 g005
Figure 6. The synteny analysis of the PgGATA family in P. ginseng. The outermost text is the gene name/family name. Colored rings represent different chromosomes. Gray lines represent collinearity within genome-wide species, and color lines represent collinearity within species within this family.
Horticulturae 10 00282 g006
Figure 7. Synteny analysis of GATA genes between P. ginseng, A. thaliana, and O. sativa. Different colors represent different species, with gray lines representing genome-wide interspecies collinearity and red lines representing this family collinearity between species.
Horticulturae 10 00282 g007
Figure 8. Heatmap analysis of the FPKM of PgGATA genes under N and P deficiency stresses. 0N-N deficiency; 0P-P deficiency; 0N0P-N and P deficiency. Expression values were normalized and presented on the right side, blue represents a low level, and red indicates a high level of transcript abundance.
Horticulturae 10 00282 g008
Table 1. Detailed information on the GATA genes in P. ginseng.
Gene NameGene IDPfam IDChromosomesProteinPosition of GATA Domain
Amino AcidsMW
(kDa)
pIFromTo
PgGATA1Pg_S0002.19PF00320.28Pg_scaffold0002:1288028-129506355560.859297.86135
PgGATA2Pg_S0151.6PF00320.28Pg_scaffold0151:654526-65564429732.888098.61135
PgGATA3Pg_S0247.64PF00320.28Pg_scaffold0247:1040767-104664839344.428838.93135
PgGATA4Pg_S0370.2PF00320.28Pg_scaffold0370:163245-16490932335.798445.95134
PgGATA5Pg_S0399.28PF00320.28Pg_scaffold0399:340107-34761155261.400937.91135
PgGATA6Pg_S0401.2PF00320.28Pg_scaffold0401:29144-3012225528.862666.45134
PgGATA7Pg_S0422.4PF00320.28Pg_scaffold0422:1034667-105192237340.825085.67135
PgGATA8Pg_S0452.1PF00320.28Pg_scaffold0452:329642-34356637240.664985.52135
PgGATA9Pg_S0524.1PF00320.28Pg_scaffold0524:33560-4294525728.116856.17133
PgGATA10Pg_S0724.42PF00320.28Pg_scaffold0724:481073-48227932536.247116.01134
PgGATA11Pg_S0743.16PF00320.28Pg_scaffold0743:662369-66405934238.099215.9134
PgGATA12Pg_S0747.56PF00320.28Pg_scaffold0747:329359-34022232835.289155.46135
PgGATA13Pg_S0833.16PF00320.28Pg_scaffold0833:332798-33542929633.448018.9135
PgGATA14Pg_S0901.25PF00320.28Pg_scaffold0901:668023-66923332636.114715.35134
PgGATA15Pg_S0992.10PF00320.28Pg_scaffold0992:111377-11244532936.290375.58134
PgGATA16Pg_S1105.5PF00320.28Pg_scaffold1105:191951-19393034738.215276.46134
PgGATA17Pg_S1135.23PF00320.28Pg_scaffold1135:457378-47692290610.2742748.83135
PgGATA18Pg_S1255.7PF00320.28Pg_scaffold1255:388046-39674061568.222118.62135
PgGATA19Pg_S1398.1PF00320.28Pg_scaffold1398:8780-1037630634.092199.35134
PgGATA20Pg_S1637.11PF00320.28Pg_scaffold1637:158676-15979434238.156775.42134
PgGATA21Pg_S1715.1PF00320.28Pg_scaffold1715:48429-4954233136.33346.72135
PgGATA22Pg_S1758.8PF00320.28Pg_scaffold1758:102416-10399230734.263379.45134
PgGATA23Pg_S1973.5PF00320.28Pg_scaffold1973:85000-8610332936.081945.13135
PgGATA24Pg_S2014.30PF00320.28Pg_scaffold2014:381887-38295532936.302445.74134
PgGATA25Pg_S2238.19PF00320.28Pg_scaffold2238:317522-31793813815.770919.25135
PgGATA26Pg_S2819.19PF00320.28Pg_scaffold2819:309794-31140535939.952446.08134
PgGATA27Pg_S2827.1PF00320.28Pg_scaffold2827:98960-10094134738.119166.71134
PgGATA28Pg_S2844.7PF00320.28Pg_scaffold2844:230542-24605379890.198068.66135
PgGATA29Pg_S3015.2PF00320.28Pg_scaffold3015:102177-10465433436.695196.56134
PgGATA30Pg_S3615.15PF00320.28Pg_scaffold3615:147233-15327332735.22725.38135
PgGATA31Pg_S3639.1PF00320.28Pg_scaffold3639:5840-832033636.803386.71134
PgGATA32Pg_S3645.1PF00320.28Pg_scaffold3645:5740-652219021.184059.27134
PgGATA33Pg_S3789.4PF00320.28Pg_scaffold3789:234760-23572625528.874586.5134
PgGATA34Pg_S3843.20PF00320.28Pg_scaffold3843:179679-18097216017.323699.86135
PgGATA35Pg_S4030.1PF00320.28Pg_scaffold4030:8653-989731034.270785.33134
PgGATA36Pg_S4129.5PF00320.28Pg_scaffold4129:153794-15456818821.093019.45134
PgGATA37Pg_S4286.18PF00320.28Pg_scaffold4286:165564-17554664871.98436135
PgGATA38Pg_S4390.1PF00320.28Pg_scaffold4390:25504-2867320321.982189.41135
PgGATA39Pg_S4510.13PF00320.28Pg_scaffold4510:75064-7637116217.518859.71135
PgGATA40Pg_S4710.5PF00320.28Pg_scaffold4710:72488-985791064117.477886.42135
PgGATA41Pg_S5092.5PF00320.28Pg_scaffold5092:121295-14005642747.296927.51134
PgGATA42Pg_S5334.7PF00320.28Pg_scaffold5334:138662-13977533236.514374.96135
PgGATA43Pg_S5340.2PF00320.28Pg_scaffold5340:76449-8264954660.082136.94135
PgGATA44Pg_S5887.5PF00320.28Pg_scaffold5887:88824-9021438241.963946.6135
PgGATA45Pg_S5997.3PF00320.28Pg_scaffold5997:103747-10533625528.665126.95134
PgGATA46Pg_S6363.2PF00320.28Pg_scaffold6363:10458-1273220422.311689.93135
PgGATA47Pg_S6376.1PF00320.28Pg_scaffold6376:16784-1846526229.369776.95134
PgGATA48Pg_S8057.2PF00320.28Pg_scaffold8057:31367-3212825328.251079.19135
PgGATA49Pg_S8143.1PF00320.28Pg_scaffold8143:10176-1076319521.861619.98134
PgGATA50Pg_S8143.2PF00320.28Pg_scaffold8143:14520-1581531835.281895.34134
PgGATA51Pg_S8173.3PF00320.28Pg_scaffold8173:21446-2305535839.676116.08134
PgGATA52Pg_S8212.2PF00320.28Pg_scaffold8212:3522-630924126.388699.91135
Table 2. Characteristics of PgGATA11-14 genes in P. ginseng.
SequenceMethodKaKsKa/Ksp-Value (Fisher)Length
PgGATA1-PgGATA11MA0.9214891.2751.183481.49 × 10−121026
PgGATA1-PgGATA12MA0.890251.402541.070027.05 × 10−24984
PgGATA1-PgGATA13MA0.8891251.482311.053624.50 × 10−27888
PgGATA1-PgGATA14MA0.9038511.346561.029932.90 × 10−16978
Disclaimer/Publisher’s Note: The statements, opinions and data contained in all publications are solely those of the individual author(s) and contributor(s) and not of MDPI and/or the editor(s). MDPI and/or the editor(s) disclaim responsibility for any injury to people or property resulting from any ideas, methods, instructions or products referred to in the content.

