

Management Information Systems for Tree Fruit–2: Design of a Mango Harvest Forecast Engine
by
 , , ,
, , ,
Hari Krishna Dhonju
1,* ,
,
Thakur Bhattarai
1,2 ,
,
Marcelo H. Amaral
1,
Martina Matzner
1 and
Kerry B. Walsh
1 1
Institute of Future Farming Systems, Central Queensland University, Rockhampton, QLD 4701, Australia
2
Thomas Elder Sustainable Agriculture, Elders P/L, Adelaide, SA 5000, Australia
*
Author to whom correspondence should be addressed.
Horticulturae 2024, 10(3), 301; https://doi.org/10.3390/horticulturae10030301
Submission received: 19 February 2024
/
Revised: 9 March 2024
/
Accepted: 19 March 2024
/
Published: 20 March 2024
(This article belongs to the Special Issue Application of Remote Sensing Technology in Orchard Precision Management)
Abstract
:Spatially enabled yield forecasting is a key component of farm Management Information Systems (MISs) for broadacre grain production, enabling management decisions such as variable rate fertilization. However, such a capability has been lacking for soft (fleshy)-tree-fruit harvest load, with relevant tools for automated assessment having been developed only recently. Such tools include improved estimates of the heat units required for fruit maturation and in-field machine vision for flower and fruit count and fruit sizing. Feedback on the need for and issues in forecasting were documented. A mango ‘harvest forecast engine’ was designed for the forecasting of harvest timing and fruit load, to aid harvest management. Inputs include 15 min interval temperature data per orchard block, weekly manual or machine-vision-derived estimates of flowering, and preharvest manual or machine-vision-derived estimates of fruit load on an orchard block level across the farm. Outputs include predicted optimal harvest time and fruit load, on a per block and per week basis, to inform harvest scheduling. Use cases are provided, including forecast of the order of harvest of blocks within the orchard, management of harvest windows to match harvesting resources such as staff availability, and within block spatial allocation of resources, such as adequate placement of harvest field bin and frost fans. Design requirements for an effective harvest MIS software artefact incorporating the forecast engine are documented, including an integrated database supporting spatial query, data analysis, processing and mapping, an integrated geospatial database for managing of large spatial–temporal datasets, and use of dynamic web map services to enable rapid visualization of large datasets.
1. Introduction
1.1. Need for Harvest Forecast
Commercial orchards require management of irrigation, plant nutrition, disease and pests, and tree canopy architecture to meet agronomic needs, and documentation of labor and chemical usage to meet administrative requirements. As reviewed in a companion paper [1], the development of electronic Management Information Systems (MISs) for tree-fruit management lags behind that for broadacre cropping. The existing orchard management systems have focused on issues with regulatory requirements, e.g., chemical and labor usage, with capacities more recently developing around management decision support, e.g., when to spray chemicals based on weather and pest pressures inputs.
Of the various management tasks involved in the production of soft tree fruit, the annual organization of harvesting is a major event. Harvesting and grading costs represent approximately 50% of total production costs for soft tree fruit [2], given the current need to hand pick most commodities. Summarizing the review of [3], harvest forecast is essential to the planning of on-farm resourcing (of labor and materials), transport and marketing, with all of these areas having lead times of week if not months. Harvest forecasts are integral in some production systems, e.g., those involving processing, given the need to co-ordinate input to a central processing plant. Examples include wine grape [4] and juice citrus production [5]. The US hazelnut industry provides a (dry) tree-fruit example, with a national crop forecast made by the United States Department of Agriculture (USDA) based on manual counts of two randomly selected trees in each of 180 randomly selected orchards [6]. New tools are also emerging for tree-fruit load estimation, ranging from in-orchard machine vision to relationships based on canopy size or vegetation indices obtained from satellite imagery [7,8]. The growing requirement for point of origin traceability also creates a need for electronic databases for harvest data accessed through an information system [9].
Large mango farms in Australia each employ hundreds of workers for the short harvest season and must organize appropriate labor resources, materials such as packaging, and services such as transport. The harvest window is a few weeks in length, with fruit harvested either earlier or later than the optimum window, presenting different quality issues which lower the marketability of the fruit. As mango fruit are climacteric, with a low storability, timeliness of harvest and transport is critical. The downstream supply chain must organize ripening and marketing for domestic markets, and biosecurity treatments, transport, and marketing for export markets. For example, retailer advertising is typically booked six weeks in advance, requiring a forecast of product availability. To support this decision making, forward knowledge of harvest timing and load is required. Indeed, the earlier and more accurate the forecast, the better the harvest can be organized, delivering better quality and more marketable fruit, and thus higher profitability.
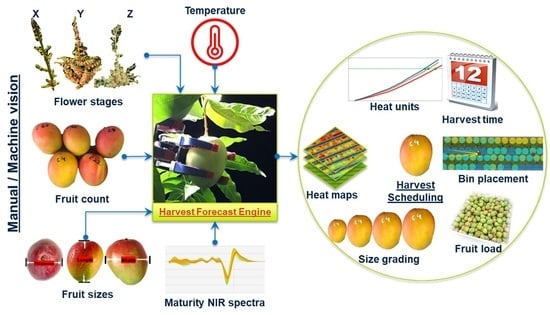
The forecast of tree-fruit harvest timing and load is a complex task, requiring evaluation of multiple inputs. Inputs include flowering observations, temperature measurements for the calculation of heat units, measurements of fruit maturity attributes to support estimation of the timing of fruit maturation, and fruit count and size measurements to support estimation of load [3]. These data types require collection at a range of frequencies, from 15 min interval temperatures records to fruit counts made once or twice in a season.
The current forecast systems used on Australian mango farms and by their marketing groups are relatively ‘informal’ systems, relying on nonsystematic manual estimates by growers, which are kept on paper or electronic spreadsheets. Manual estimation of flowering level and fruit load can be time-consuming, resource intensive, and inaccurate. In consequence, orchard MISs for the forecast of harvest timing and load are relatively immature [1].
1.2. Inputs Required for Hearvest Forecast
Management of any farm requires the delineation of management units. In a tree-fruit orchard, these land units are blocks of trees of similar management history, viz. planting date, cultivar, pruning, soil type, etc., and thus, ideally the trees will have a similar physiological status. Homogeneity in time and extent of flowering and fruit load allows for decreased sampling effort. In practice, however, priority is often given to factors such as accessibility or irrigation system design, rather than issues such as soil type and drainage, resulting in increased variation [10].
As covered in a recent review [3], harvest forecasting of a tree-fruit crop requires forward estimation of optimum harvest time and the expected fruit load. The importance of temperature-to-rate-of-fruit-development is understood and utilized in forecast models, e.g., for banana [11]. Various approaches have been used in the forecast of fruit load, e.g., flower counts in strawberry [12] and vegetation spectral indices [13]. These inputs have been used in models for the optimization of harvest planning [14]. As a generalization [3], the harvest load of a tree-fruit crop can be forecasted early in the season based on correlation to a UAV or satellite-assessed vegetation index (but this may be inaccurate if floral induction is poor), via correlation to canopy ‘surface’ area (but this does not consider height and may perform poorly with fruit-wall production systems), or with input of ambient temperatures (e.g., if floral induction requires a low temperature period). A slightly later forecast can be made via correlation to the extent of flowering (but this will be an overestimate if pollination conditions, or fruit retention rates, vary from the ‘norm’). Finally, a late-season forecast can be made via direct count of the fruit on trees, after the early fruit development period in which fruit drop occurs.
For mango specifically, harvest timing and load forecast for a given orchard can be achieved given knowledge of the criteria established in Anderson et al. [3]:
- (a)
- The cultivar specific heat unit (also known as the thermal time or Growing Degree Days, GDD) maturation requirement from flowering to harvest maturity;
- (b)
- The time at which a harvest-maturity fruit dry matter content (DMC) specification will be achieved, the time and intensity of flowering events, and orchard temperature data.
While a forecast of harvest load for a given tree block can be achieved given knowledge of the following:
- (a)
- Fruit count;
- (b)
- Fruit size;
- (c)
- Fruit marketability (proportion of fruit that are marketable).
Several sensor technologies and statistical methodologies have been developed that aid in the estimation of harvest timing and load (Table 1) [3]. In-field temperature can be remotely logged in real time using wireless sensors, fruit dry matter content can be assessed nondestructively for fruits on trees using handheld near-infrared spectroscopy (NIRS), statistically valid sampling strategies provide a foundation to the manual estimation of flowering and fruit count, machine vision can be used for flower and fruit count, and statistically valid sampling strategies and machine vision for fruit count and fruit sizing are relevant to the estimation of harvest load. Other approaches for harvest-load estimation use satellite-imagery-derived vegetation indices [15,16] and UAV-derived canopy structure attributes [8]. Our research group has reviewed each of these aspects, i.e., the forecast of harvest timing based on GDD [17] and/or DMC [18], the forecast of fruit number [3,19], and the forecast of fruit size at harvest [20].
1.3. Aim and Structure
The current study extends our earlier work on the forecast of the optimum harvest time based on the noninvasive measurement of fruit dry matter content. Given the availability of such data sources, it is timely that harvest information management systems be developed to translate this ‘data into information’. The aim of the current paper is to codify how such data can be brought together to create a ‘harvest forecast engine’ and how such an engine could be used in an electronic MIS, managing data into information on both harvest load and timing.
Industry practitioner input on the need for and issues in mango harvest-load forecast was sought (Section 3). A review was undertaken of the approaches and tools available for the forecasting of harvest timing, i.e., tools for the provision of data on temperature, flowering time, and dry matter content (Section 4) and for the forecasting of fruit load, i.e., for data on fruit numbers and fruit size (Section 5). This section includes farm data to illustrate the points raised. Consideration of the use of this data in harvest scheduling and other management tasks is presented in Section 6.
The novelty of the current manuscript lies in the description of the structure of the ‘harvest forecast engine’. Practical use of such a ‘harvest forecast engine’ requires integration into a Management Information System with functions for data management, archival, analysis, visualization, and interpretation [1]. The design requirements for an effective harvest MIS software artefact are presented in Section 7. While we do not attempt to detail or evaluate the constructed artifact in the current manuscript, we have used outputs from a prototype system in illustrating the operation of the forecast engine.
2. Methodology
2.1. Data Sources
As noted, our research group has been active in the development of sensor systems relevant to the forecasting of harvest timing and load (Table 1). This work has involved on-farm testing, e.g., on 37 orchards across the major mango producing regions of Australia for assessment of machine vision technologies [21]. In the current paper, the logic of a harvest forecast engine is developed, with data to illustrate these discussions, which were obtained from equipment and protocols referenced in Table 1.
2.2. External Feedback
‘Industry’ input was sought on the need for, and proposed utility and operation of, the ‘harvest forecast engine’. Informal feedback over this period guided the development of the system. Feedback from growers, agronomists, and supply chain partners involved in these trials was acquired through semi-structured interviews based on the questions outlined in Appendix A, occurring over the period 2022–2024 (CQUniversity low risk ethics approval number: 21660). The interviews occurred primarily as electronic one-on-one meetings with eight farm managers of medium (>20,000, <50,000 trees) and large (>50,000 trees) farms, three agronomic advisors or researchers in tropical Australia, and three mango marketers. Further, our work on the development of sensor systems (Table 1) involved on-farm data collection, with the sharing of data through a developmental electronic MIS platform to the host farms, generally within a day of collection. Informal feedback over this period guided development of the system.
3. External Feedback
The expressed needs for a documented harvest forecast (Table 2) were common across all interviewees, but the need increased with scale of production and the length of the supply chain. The issues raised in the context of making harvest forecasts (Table 2) were used to guide the proposed ‘forecast engine’.
4. Harvest Timing
4.1. GDD
Reproductive development from flowering to ‘harvest maturity’ is a cultivar specific function of time and temperature. This index is referred to as ‘thermal time’, ‘heat units’ or ‘Growing Degree Days’ (GDD), with units accumulated daily. Simple calendar time could be used if seasonal temperatures did not vary between years, but in practice, the time from a given flowering to fruit harvest maturity can vary by weeks between locations with different temperature profiles.
GDD units for mango reproductive growth are typically calculated using the average of the daily minimum (Tm) and maximum (TM) temperatures, minus a minimum base temperature value (Tb). Amaral et al. [17] implemented a set of equations (1 to 5) for the calculation of daily GDD, as proposed by Ometto [22], which involve a maximum base temperature value (TB). Working with Australian mango cultivars, the optimum Tb and TB was established to be 12 and 32 °C, respectively, and cumulative GDD targets were set for the fruit maturation of a suite of cultivars (Table 3).
In practice, this estimate provides a recommended earliest harvest date. Fruit can be harvested later, with decreasing shelf life and increasing postharvest quality issues. Further work is required to document acceptable harvest windows, referred to as ‘hanging time’ by growers, by cultivar and growing condition, for use in harvest management systems.
4.2. Temperature Measurement
To achieve a GDD estimate, a record is required of current season temperatures to the current date and a forecast of temperatures through to fruit maturity. This forecast can be as simple as an average of daily temperatures over past years or as complex as the output of a current season climate model. The heat unit calculation can be updated daily using actual (orchard) season temperatures.
For temperature measurements, farms lacking a weather station can access a local public monitoring resource, e.g., the Bureau of Metrology (BoM); however, these recording locations can be >100 km from farms. Farms with a recording station often rely on a single station for temperature records. While it is obvious that temperatures and thus GDD accumulation will vary regionally, temperatures can also vary across a given farm (Figure 1) as a function of farm geography. The development of low-cost remote monitoring technologies such as LoRa (Long Range radio) allows for multiple temperature recording stations to be maintained on a given farm [17].
For the proposed harvest MIS, it is recommended that wireless temperature sensors be established according to Bureau of Meteorology specification (viz., enclosed in a white, slatted screen, mounted 1.5 m above grassed or mulched ground, and positioned at least 10 m from tall objects) in each geographic zone of the farm, with orchard blocks within those zones linked to the output of respective sensors in the MIS database. Data from these sensors should be collected at 15 min intervals [17] to support the measurement of Tm and TM. These records can be accumulated over the years to produce a historical record for each location. This historical record can be augmented with data from the nearest farm sensor or from the nearest public resource, e.g., BoM (Equation (1)). The historical record can be used in the forecast from a given date and to fill in data gaps due to technical failures associated with sensors of associated data transfers (Equation (6)).
where the variables represent the following:
- S is the matrix of Tm and TM values for use in the calculation of GDD;
- O is a matrix of observed current season daily Tm and TM values;
- N is the matrix of observed current season and historical daily Tm and TM values of the nearest farm sensor;
- B is the matrix of current season daily Tm and TM values from the nearest BoM site;
- H is the matrix of historical (e.g., 10-year average) daily Tm and TM values;
- t1to4 are mutually exclusive periods within the season.
4.3. Peak Flowering Dates
A flowering date is required for GDD estimation in the forecast of harvest time. Mango reproductive development involves the conversion of a vegetative branch terminal apex, with the production of a panicle with hundreds of flowers. This process progresses through the stages of (i) swollen bud; (ii) ‘asparagus’ stage; (iii) panicle elongation phase; (iv) ‘Christmas tree’ stage with 50% of flowers on the panicle open; and (v) fruit set stage. A panicle will typically hold one to four fruits, with this number being cultivar dependent.
In current international best practice, as seen in mango production systems dealing with large volumes of fruit and long supply chains, the percentage of canopy terminals in reproductive growth per tree is estimated manually in a slow (approx. 10 km/h) drive through of several rows of a given orchard at up to weekly intervals. Dates of peak flowering, also known as ‘maturity zones’ or ‘flowering events’ in the Australian mango industry, can be estimated from this time series assessment, for each orchard (Table 4, Figure 2). The designation of a flowering event is tied to a user-defined minimum change in flowering level, e.g., of at least 20% of terminals in reproductive growth (Figure 2), as, in general, the selective harvest of fruit from a lesser change would not be economically viable.
While assessment of the percentage of terminals in reproductive growth via human visual assessment is a current industry practice, this attribute has not yet been assessed with machine vision. Panicle count, but not vegetative terminal count, has been reported using machine vision. Machine vision has been used in the detection and count of mango panicles at three developmental stages (elongation, Christmas tree, and fruit set) using imagery collected from a camera and a GNSS-equipped ground vehicle [23]. In this approach, panicle counts from images sourced at intervals equivalent to the tree spacing along the tree row have been used in the spatial visualization of flowering across orchard blocks, and the average counts for the number of panicle counts per frame for the three developmental stages have been used in time-series presentation [3] (Figure 2). Such a time series allows for the elicitation of the timing of flowering events.
4.4. Accumulation of Storage Reserves
The GDD forecast of harvest time has the following weaknesses: (i) potential variation between the sensor measured temperature and fruit temperature, both across orchard and within canopy and (ii) variation in the time of flowering within each panicle (which consists of hundreds of flowers which progressively open over at least a week). To ‘fine tune’ the GDD-based estimate of harvest date, fruit attributes such as skin color, flesh color, or storage reserve level can be used as indicators of fruit maturity. However, skin color is not a reliable index for the mango cultivars of commercial relevance in Australia, which can have a well-developed ‘blush’ (skin color) by the time of harvest. Flesh color is a definitive index of fruit maturity, but assessment is destructive of the fruit, effectively limiting the number of fruit that can be sampled [24].
Flesh dry matter content (DMC) has been recommended as a maturity index for mango fruit [25]. It can be estimated destructively via weight loss on drying, or noninvasively for fruits on trees using a portable near-infrared spectrometer (e.g., F750, Felix Instruments, Camas, WA, USA). Such instruments are Wi-Fi- and GNSS-enabled, enabling the upload of geo-tagged data. In brief, DMC reflects the accumulation of storage reserves, being soluble sugars and starch content, in a mango fruit. DMC of fruit at harvest is strongly correlated to juice soluble solid content in the ripened fruit and thus, eating quality. The DMC level associated with harvest maturity will vary with growing condition but can be established via association with flesh color [17] (Figure 3).
Once mango fruit are past the stone-hardening stage of development, fruit ‘drop’ (abscission) decreases greatly, and the rate of increase in DMC (% w/w) is generally linear (with exceptions, particularly around marked changes in water status, e.g., following rain) [26]. Thus, the rate of increase in the DMC estimated from at least two weekly observations allows for the forward prediction of a harvest maturity date given a DMC target associated with harvest maturity (Equation (7), with example data shown in Figure 4).
where the variables have the following representations:
- ∆x is the number of days to harvest maturity date;
- TDMC is the target dry matter content, associated with harvest maturity;
- DMC is the value of dry matter content exceeded in x% of observations of the last measurement date, where x is user defined (typically 90%);
- ∆DMC is the rate of DMC increase (%/day) estimated from average dry matter content at two measurement dates.
An example
Figure 4.
Example of spatial visualization of harvest timing data, in this case dry matter content (DMC) data. Dots represent measurements of individual fruit, with values incremented from date of measurement to date of visualization based on a measured rate of DMC increase. Dots are colored with reference to a user specified DM target (in this case 16%). Blue, yellow, and red dots represent values on and above target, within one unit less than target and >1 unit less than target. Blocks are colored in context of meeting a user specification, in this case 90% of measurements above the set target of 16%, with red and green indicating specification not achieved and achieved, respectively.

4.5. Proposed Workflow on Harvest Timing
A recommendation on harvest timing can thus be achieved on the consensus of estimated dates from: (a) flowering time and accumulated GDD, given dates of peak flowering events and measurement of daily (minimum and maximum) temperatures, and (b) fruit DMC, given measurements on at least two dates prior to harvest.
A proposed workflow is described in Figure 5. The date and extent of peak flowering events (maturity zones), as observed manually or through machine vision, are recorded. A recommended harvest date associated with these flowering events is estimated from temperature records and required GDD for a given cultivar and the associated Tb and TB values. Another harvest date recommendation associated with these flowering events is estimated from a minimum fruit dry matter (DM) harvest specification established for each mango cultivar and a rate of dry matter increase established in the weeks before harvest used to estimate optimal harvest date. A consensus between GDD and dry matter harvest time forecasts (examples presented in Table 5) requires the input of an orchard manager to consider harvest timing in context of farm harvesting capacity (as illustrated in Table 4 and detailed in the next section). This can involve a decision to shift harvest from the week of forecasted fruit maturity to a week with lower harvest load, to balance harvest resourcing. This decision may also be used to influence marketing, i.e., intended market and pricing.
5. Harvest Load
5.1. Fruit Number
A first forecast of potential fruit load can be based on the extent of flowering proportional to the maximum load associated with flowering of 100% of the canopy terminals for a given orchard condition (cultivar, canopy size, architecture, management history, etc.). Such an estimate represents a potential, based on the extent of flowering, which may not be realized if conditions cause fruit drop. This approach has also been reported in other soft-fruit tree crops, including apples [27] and almonds [28].
Fruit number data for a given orchard block can also be estimated with direct, manual count, based on a sound sampling strategy. This count should be undertaken after the ‘fruit drop’ period, generally at or after the ‘stone (endocarp) hardening’ stage of fruit development, i.e., from about six weeks before harvest. The estimate will involve manual count of the number of fruit per tree on a sample of trees in the orchard block, with the number of trees to be counted related to the square of the SD of this attribute [29]. Ideally, a preliminary sample of trees would be counted to evaluate SD; however, this imposes a workload cost. In compromise, an SD value based on prior knowledge (from blocks of similar appearance or from previous years) can be adopted and then iteratively adjusted based on actual counts. A systematic sampling procedure offers the practical advantage of ease of location of the sample trees, compared to, e.g., a random sampling protocol [3]. Such a system can be implemented in a mobile device, with a download of orchard block boundaries and tree number per orchard block to enable calculations of tree spacing in systematic sampling. An example of a system in commercial operation employing this principle is Pronofruit [30].
Alternatively, the number of fruit per block can be assessed using machine vision. In an early demonstration (2013), machine vision using deep learning techniques (convolutional networks) was used in an apple-fruit-load estimation method [31], with the technique shortly thereafter applied to mango-fruit-load estimation [19,32]. In these systems, images of the canopy sides are collected using a camera system mounted to a vehicle moving through the inter-rows, with fruit tracked between frames and counted once no longer present in subsequent frames. Cumulative count for set lengths of the rows (generally set at the distance of tree spacing along the row, e.g., 3.5 m) can be displayed as a ‘heat map’ of fruit load, or a cumulative count for the orchard block can be displayed and tabulated, e.g., [19,21].
5.2. Fruit Size
There is an allometric relationship between mango fruit lineal dimensions and fruit mass [20]. Fruit lineal dimensions can be collected manually, using calipers, and a statistically robust sampling regime, with data capture aided with a mobile device. Alternatively, lineal dimensions of fruits on trees can be estimated using machine vision for the subset of imaged fruit that are not partly occluded and are in the center of the field of view, to avoid perspective distortion [33]. These data can be presented as a size class frequency histogram. Hectre [34] provides an example of commercial software for monitoring fruit size distribution of fruit in field harvest bins using a mobile device and machine vision.
Mango fruit mass increases linearly in the month leading up to harvest, except if growth is disturbed via a major change in tree physiology, e.g., in water stress or source–sink balance [35,36]. For nondisturbed conditions, size measurements (S) taken on two occasions (t1 and t2) can therefore be used to estimate rate of growth, m (e.g., in g/day), as follows:
where and are the average size of fruit at t1 and t2, respectively. This rate can be used to forecast weight distribution at the forecast time of harvest (th), from data of the last measurement event, as follows:
where St2 is the size distributions at t2, and Sh is the forecast size distribution at harvest.
An example of a size profile forecast (made three weeks before harvest) is compared to the size distribution assessed of fruit at harvest in Figure 6.
5.3. Fruit Quality
A distinction can be made between ‘biological’ and ‘marketable’ yield. Biological yield is the total number of fruits on trees, characterized by fruit number and size. ‘Marketable yield’ is that proportion of biological yield that is saleable. Factors determining marketability include size, blemish level, and level of maturity. For example, less than six spots or a total area of 1 cm2 or more of pink spots on the mango skin, a symptom caused by a scale insect, is recognized as a defect in marketing chains, reducing fruit value [37].
As for total fruit number and fruit size, surveys can be conducted for fruits on trees to estimate the proportion of the crop impacted by a given attribute. Current industry best practice involves manual visual assessment of a sample of fruit in each orchard block, with paper or basic electronic recording. There is potential to implement machine vision solutions. For example, Scalisi et al. [38] report estimation of blush levels of stone fruit using a vehicle-mounted camera system.
6. Data to Information
6.1. Harvest Schedule
As an early-in-season approximation of fruit yield, the % of terminals that enter reproductive growth can be used in context of the maximum yield for this cultivar/canopy/growing condition, as associated with a 100% flowering event (Equation (10)). For example, if 40% flowering is recorded for a block with a prior maximum yield of 40 t/ha associated with 100% flowering, then the potential yield forecast is 16 t/ha.
where, for a given block, the variables have the following representations:
- Yf is the forecast yield (kg) associated with a given flowering event;
- F is the flowering extent (% of terminals) associated with a flowering event;
- Ymax is the maximum fruit yield per hectare (kg/ha), at 100% flowering;
- A is area (ha).
However, as noted above, flowering can occur in waves (flowering events, FEs) of different magnitudes within a given orchard block. The forecast harvest date of each of the events can be forecast based on GDD and on fruit DMC measurements. The % of canopy terminals involved in a flowering event can be normalized to the maximum achieved and used to partition the estimated total fruit load based on FEs, and thus harvest date (Equation (11)). The forecast of harvest load can be based on a machine vision or manual count of fruit per orchard block undertaken from fruit stone-hardening stage, i.e., after the fruit drop period, up to 6 weeks before harvest.
where the variables have the following representations:
- Yi is the yield, as fruit number, per FEi;
- FEi is the extent of a given flowering event (% of terminals);
- i is the number of the FE;
- FEmax is the maximum flowering in the given season (% of terminals);
- FC is the block fruit count.
For example, if FE1 was associated with flowering of 30% of all terminals, while by the end of the flowering period 90% of terminals had reproductive growth, and the block fruit count was 120,000 pieces of fruit, then the fruit count associated with FE1 can be approximated as 30/90 × 120,000 = 40,000 pieces of fruit (Equation (11)). This value is an approximation which ignores differential fruit drop between different FEs, but it represents the first level of the forecast. The forecast can be adjusted based on subsequent observations of fruit drop and corroborated with other observations, e.g., fruit size distribution.
A workflow is presented in Figure 7.
The estimated Yi per block can be summed across blocks to achieve an estimate of expected total harvest for a given harvest week (Ycu). This value can be compared to the farms harvest capacity per week (HCw), as designated by the grower and defined by the number of harvest workers and harvest aid equipment available. If the forecasted harvest load exceeds the harvest capacity, the farm manager can adjust the FE timing, e.g., harvesting a week late or early relative to forecast dates, to distribute workload.
The output of such a workflow for a farm harvest is illustrated in Table 6. The difference between forecast and actual harvest can be ascribed to the following: (i) error in the estimation of the temporal flowering distribution; (ii) errors in the estimation of fruit count; (iii) errors in the estimation of average fruit weight; and (iv) fruit not harvested or discarded at harvest, i.e., fruit not reaching packhouse from orchard.
6.2. Selective Management
The tabulated expected fruit load per week of the harvest period is useful in harvest resource planning, for issues from labor hire planning to transport logistics. In addition to this ‘quantitative’ estimate, ‘qualitive’ spatial information inherent in machine-vision-derived estimates of the level of flowering and fruit load can also be useful in orchard management. Several examples are provided in this section, including the following:
- (i)
- Delineation of areas of early flowering and fruit set as areas for early selective harvest, to match market demands;
- (ii)
- Identification of under and over performing areas within a given block, for investigation of causes;
- (iii)
- Agronomic management (pest, disease, nutrition, and irrigation management).
In Figure 8, spatial variation in flowering is evident in panel A, which was reflected in spatial variation in fruit count made four months later (panel B). Of interest to farm management, the following season saw a reversed trend in spatial distribution of flowering (panel C) and fruit load (panel D).
Figure 9 illustrates a loss of fruit production due to a frost event, with crop saved in areas around five frost fans (left panel). In the second season (middle panel), areas of no production in year 1 became high yielding areas, suggesting a biannual yielding pattern had been introduced, and allowing for management intervention on the basis of this information. In the third season (middle panel), spatially uniform production was re-established.
Figure 10 illustrates a fruit count made before and after a first harvest event, showing spatial variation in the intensity of harvest. Figure 11 presents frequency distributions for fruit load per ‘tree’ (per 3.5 m of tree row) and for fruit size, before and immediately after a harvest event. The distribution of fruit load per tree is shifted to lower values following harvest, as expected, but fruit size distribution is not visibly impacted, indicating that a selective harvest on the basis of fruit size did not occur.
6.3. Field Bin Allocation
Information on the spatial distribution of fruit load within an orchard block can also be used to inform bin placement, as described in our previous work [39]. In the Australian mango industry, fruit are harvested into polycarbonate harvest bins of 400 kg capacity. One harvest related task is the distribution of empty bins into the orchard, ahead of the harvest crews. In present practice, these bins are allocated based on a human ‘eyeball’ of fruit load. Information on the spatial distribution of fruit load can be used to calculate the required number of bins per row, or the required placement of bins within the row. Such an estimate requires a cumulative estimate of fruit load from the two sides of tree canopies facing an inter-row. When the cumulative count (Yi) is equal or greater than the bin capacity (b), a field bin is allocated to that spatial location, and the cumulative count restarted (Equation (12), Figure 12).
where variables have the following representations:
- i is a counter of the data series;
- j is a counter from the ith position of the data series to achieve b;
- n is the size of series;
- Lj is the fruit count series from the left MV camera;
- Rj is the fruit count series from the right MV camera.
Figure 12.
Bin distribution based on fruit load measurement. In this example, bins allocated to the two blocks, HG1 and HG2, were 106 and 112%, respectively, of requirement, as judged from farm packhouse records. Scale bar represents 50 m.
Figure 12.
Bin distribution based on fruit load measurement. In this example, bins allocated to the two blocks, HG1 and HG2, were 106 and 112%, respectively, of requirement, as judged from farm packhouse records. Scale bar represents 50 m.

7. Criteria for an Electronic Harvest MIS
7.1. Data Acquisition System
Ease of data collection and entry was a major consideration for all potential users of a harvest forecast MIS. New tools, e.g., LoRa-enabled temperature recording, Wi-Fi-enabled handheld NIRS devices, and machine vision estimates of panicle and fruit number, have been expressly developed to ease data collection. However, these technologies impose hardware costs. Manual data collection remains an alternative approach.
A GNSS-enabled mobile device app can be developed to aid manual data collection for the extent of flowering, fruit number, and fruit size and quality, with the workflow illustrated in Figure 13.
7.2. Harvest Forecast Engine as a Component of an Orchard MIS
7.3. MIS System Requirements
To operationalize a harvest forecast MIS (Figure 9), consideration is required of how data (spatial and nonspatial) are to be stored, managed, and transferred between the different components of the MIS [23,24], and how data are best visualized, e.g., as tables, graphs, or maps, to inform decision making. As reviewed in [1], the evolution of farm MISs has seen a progression from ‘stand-alone’ desktop applications to cloud-based applications with mobile-device accessibility. A web-based system is therefore recommended, with raster- rather than vector-based map rendering and implementation at the client rather than server side, for rapid visualization of large data sets.
8. Conclusions
Harvest time and load forecast is critical to orchard management. The need for accurate forecast increases as farm size increases and supply chains lengthen, given difficulties in organizing harvest resources (labor, transport, etc.) and the marketing of large volumes of fruit. This manuscript has described and codified the logic of a mango harvest forecast engine and provided design features for the development of a harvest MIS software artefact. Further, in addition to the quantitative data on harvest load, management value is also identified in the data on the spatial distribution and frequency distributions of fruit load per tree and fruit size.
Implementation of such a forecast engine is enabled with sensor systems that have become available in recent years, reducing the manual effort required for data acquisition. Required inputs are the following:
- Date of flowering;
- Extent of flowering;
- GDD- and DMC-based forecast of harvest timing for each flowering event;
- Fruit count;
- Fruit quality estimation;
- Fruit size distribution.
This study has utilized in-field machine-vision-based estimation of flowering level and fruit count, but there is an opportunity to integrate other inputs, e.g., UAV- or satellite-based imagery for an earlier-in-season, although potentially imprecise, forecast (based on parameters such as vegetation indices, tree crown area, and floral-induction chill units).
An important requirement in a forecast engine is flexibility, allowing managers to adjust for such factors as a failed flowering event, e.g., due to poor pollination or to rainfall causing fungal disease of the flowers or a failed fruit set, e.g., due to a severe water stress event.
The foundation is thus set for the development of a harvest forecast MIS. However, farm adoption of such a tool will depend on ease of farm implementation, which implies a need to integrate into a broader MIS dealing with other aspects of orchard management.
Author Contributions
Conceptualization, H.K.D., K.B.W., M.H.A. and M.M.; methodology, M.M., M.H.A., H.K.D. and K.B.W.; formal analysis, K.B.W.; data curation, K.B.W.; writing—original draft preparation, H.K.D.; writing—review and editing, K.B.W. and T.B.; visualization, H.K.D.; supervision, K.B.W. and T.B; project administration, K.B.W.; funding acquisition, K.B.W. All authors have read and agreed to the published version of the manuscript.
Funding
H.K.D. acknowledges receipt of a CQUniversity Research Stipend Scholarship and a CQU International Excellence Award.
Data Availability Statement
Data has been accessed from referenced articles.
Acknowledgments
We acknowledge the support of numerous Australian mango growers, through access to their orchards.
Conflicts of Interest
The authors declare no conflicts of interest. The funders had no role in the design of this study; in the collection, analyses, or interpretation of data; in the writing of the manuscript; or in the decision to publish the results.
Appendix A
- Semistructured Interview Questions:
- How do you currently forecast time of harvest time, and number, size and quality of fruit at harvest?
- Which of these harvest-forecast functions is most and least important to you? (harvest time forecast, fruit number, size or quality forecast)
- Speaking of the software system used to display harvest forecast information:
- What aspects of this system do you find useful?
- What features do you find irrelevant/difficult to use?
- What features would you like to see added?
- What aspects of the GUI are good and bad?
- What are the barriers to the use of harvest forecast MIS?
References
- Dhonju, H.K.; Walsh, K.B.; Bhattarai, T. Management information systems for tree fruit—1: A review. Horticulturae 2024, 10, 108. [Google Scholar] [CrossRef]
- Queensland Government. Mango Information Kit; Queensland Government: Brisbane, QLD, Australia, 1999. [Google Scholar]
- Anderson, N.T.; Walsh, K.B.; Wulfsohn, D. Technologies for forecasting tree fruit load and harvest timing—From ground, sky and time. Agronomy 2021, 11, 1409. [Google Scholar] [CrossRef]
- Martin, R.D.S.; Dunn, G. How to Forecast Wine Grape Deliveries; Technique Report; Department of Primary Industries: Tatura, VIC, Australia, 2003. [Google Scholar]
- Walsh, B.; Lacey, K. Estimating Your Citrus Crop Load. 2024. Available online: https://www.agric.wa.gov.au/citrus/estimating-your-citrus-crop-load (accessed on 7 February 2024).
- Olsen, J.; Goodwin, J. The methods and results of the Oregon Agricultural Statistics Service: Annual objective yield survey of Oregon hazelnut production. In Proceedings of the VI International Congress on Hazelnut, Tarragona-Reus, Spain, 14 June 2004; Acta Horticulturae. [Google Scholar]
- Islam, M.S.; Scalisi, A.; O’Connell, M.G.; Morton, P.; Scheding, S.; Underwood, J.; Goodwin, I. A ground-based platform for reliable estimates of fruit number, size, and color in stone fruit orchards. HortTechnology 2022, 32, 510–522. [Google Scholar] [CrossRef]
- Sarron, J.; Malézieux, É.; Sané, C.; Faye, É. Mango yield mapping at the orchard scale based on tree structure and land cover assessed by UAV. Remote Sens. 2018, 10, 1900. [Google Scholar] [CrossRef]
- Williams, S.R.; Agrahari Baniya, A.; Islam, M.S.; Murphy, K. A Data Ecosystem for Orchard Research and Early Fruit Traceability. Horticulturae 2023, 9, 1013. [Google Scholar] [CrossRef]
- Anderson, N.T.; Underwood, J.; Rahman, M.; Robson, A.; Walsh, K. Estimation of fruit load in mango orchards: Tree sampling considerations and use of machine vision and satellite imagery. Precis. Agric. 2019, 20, 823–839. [Google Scholar] [CrossRef]
- Ganry, J.; Chillet, M. Methodology to forecast the harvest date of banana bunches. Fruits 2008, 63, 371–373. [Google Scholar] [CrossRef]
- MacKenzie, S.J.; Chandler, C.K. A method to predict weekly strawberry fruit yields from extended season production systems. Agron. J. 2009, 101, 278–287. [Google Scholar] [CrossRef]
- Gómez-Lagos, J.E.; González-Araya, M.C.; Ortega Blu, R.; Acosta Espejo, L.G. A new method based on machine learning to forecast fruit yield using spectrometric data: Analysis in a fruit supply chain context. Precis. Agric. 2023, 24, 326–352. [Google Scholar] [CrossRef]
- Gómez-Lagos, J.E.; González-Araya, M.C.; Soto-Silva, W.E.; Rivera-Moraga, M.M. Optimizing tactical harvest planning for multiple fruit orchards using a metaheuristic modeling approach. Eur. J. Oper. Res. 2021, 290, 297–312. [Google Scholar] [CrossRef]
- Torgbor, B.A.; Rahman, M.M.; Brinkhoff, J.; Sinha, P.; Robson, A. Integrating remote sensing and weather variables for mango yield prediction using a machine learning approach. Remote Sens. 2023, 15, 3075. [Google Scholar] [CrossRef]
- Rahman, M.M.; Robson, A.; Bristow, M. Exploring the potential of high resolution worldview-3 Imagery for estimating yield of mango. Remote Sens. 2018, 10, 1866. [Google Scholar] [CrossRef]
- Amaral, M.H.; McConchie, C.; Dickinson, G.; Walsh, K.B. Growing degree day targets for fruit development of Australian mango cultivars. Horticulturae 2023, 9, 489. [Google Scholar] [CrossRef]
- Walsh, K.; Wang, Z. Monitoring fruit quality and quantity in mangoes. In Achieving Sustainable Cultivation of Mangoes; Burleigh Dodds Science Publishing: Cambridge, UK, 2018; pp. 313–338. [Google Scholar]
- Koirala, A.; Walsh, K.; Wang, Z.; McCarthy, C. Deep learning for real-time fruit detection and orchard fruit load estimation: Benchmarking of ‘MangoYOLO’. Precis. Agric. 2019, 20, 1107–1135. [Google Scholar] [CrossRef]
- Neupane, C.; Pereira, M.; Koirala, A.; Walsh, K.B. Fruit sizing in orchard: A review from caliper to machine vision with deep learning. Sensors 2023, 23, 3868. [Google Scholar] [CrossRef]
- Anderson, N.T.; Walsh, K.B.; Koirala, A.; Wang, Z.; Amaral, M.H.; Dickinson, G.R.; Sinha, P.; Robson, A.J. Estimation of fruit load in Australian mango orchards using machine vision. Agronomy 2021, 11, 1711. [Google Scholar] [CrossRef]
- Ometto, J.C. Bioclimatologia Vegetal; Agronômica Ceres: São Paulo, Brazil, 1981; 425p. [Google Scholar]
- Wang, Z.; Underwood, J.; Walsh, K.B. Machine vision assessment of mango orchard flowering. Comput. Electron. Agric. 2018, 151, 501–511. [Google Scholar] [CrossRef]
- Bermejo, J.; Crisosto, C.; Crisosto, G. Applying non-destructive sensors to improve fresh fruit consumer satisfaction and increase consumption. In Proceedings of the XXIX International Horticultural Congress on Horticulture: Sustaining Lives, Livelihoods and Landscapes (IHC2014), Brisbane, OLD, Australia, 17–22 August 2014; pp. 219–226. [Google Scholar]
- AMIA. Factors That Influence Dry Matter. 2024. Available online: https://www.industry.mangoes.net.au/resources/resources-library/factors-that-influence-dry-matter/ (accessed on 25 January 2024).
- Walsh, K.; McGlone, V.; Han, D. The uses of near infra-red spectroscopy in postharvest decision support: A review. Postharvest Biol. Technol. 2020, 163, 111139. [Google Scholar] [CrossRef]
- Aggelopoulou, A.; Bochtis, D.; Fountas, S.; Swain, K.C.; Gemtos, T.; Nanos, G. Yield prediction in apple orchards based on image processing. Precis. Agric. 2011, 12, 448–456. [Google Scholar] [CrossRef]
- Tombesi, S.; Lampinen, B.D.; Metcalf, S.; DeJong, T.M. Yield in almond is related more to the abundance of flowers than the relative number of flowers that set fruit. Calif. Agric. 2017, 71, 68–74. [Google Scholar] [CrossRef]
- Walsh, K.; McGlone, V.; Wohlers, M. Sampling and Statistics in Assessment of Fresh Produce; Burleigh Dodds Science Publishing: Cambridge, UK, 2022. [Google Scholar]
- Wulfsohn, D.; Gardi, J.E.; Cohen, O.; Garcia-Fiñana, M.; Zamora, I. Pronofrut: Computer-assisted stereology for estimating orchard yields. In Proceedings of the Workshop on Image Analysis and Stereology with applications on Biological and Social Sciences, Santander, Spain, 11–14 September 2018. [Google Scholar]
- Wang, Q.; Nuske, S.; Bergerman, M.; Singh, S. Automated crop yield estimation for apple orchards. Exp. Robot. 2013, 88, 745–758. [Google Scholar] [CrossRef]
- Bargoti, S.; Underwood, J. Deep fruit detection in orchards. In Proceedings of the 2017 IEEE International Conference on Robotics and Automation (ICRA), Singapore, 29 May–3 June 2017; pp. 3626–3633. [Google Scholar]
- Wang, Z.; Walsh, K.B.; Verma, B. On-tree mango fruit size estimation using RGB-D images. Sensors 2017, 17, 2738. [Google Scholar] [CrossRef]
- Hectre. Award Winning Orchard Technologies Growers and Packers Love to Use. 2023. Available online: https://hectre.com/ (accessed on 27 January 2023).
- Anderson, N.T.; Subedi, P.P.; Walsh, K.B. Manipulation of mango fruit dry matter content to improve eating quality. Sci. Hortic. 2017, 226, 316–321. [Google Scholar] [CrossRef]
- Amaral, M.H.; Walsh, K.B. In-orchard sizing of mango fruit: 2. Forward estimation of size at harvest. Horticulturae 2023, 9, 54. [Google Scholar] [CrossRef]
- AMIA. Mango Quality Assessment Manual. 2024. Available online: https://www.industry.mangoes.net.au/resources/resources-library/mango-quality-assessment-manual/ (accessed on 7 February 2024).
- Scalisi, A.; McClymont, L.; Peavey, M.; Morton, P.; Scheding, S.; Underwood, J.; Goodwin, I. Detecting, mapping and digitising canopy geometry, fruit number and peel colour in pear trees with different architecture. Sci. Hortic. 2024, 326, 112737. [Google Scholar] [CrossRef]
- Dhonju, H.; Walsh, K.; Bhattarai, T. Harvest bin placement based on machine vision data in mango orchards. In Proceedings of the II International Symposium on Precision Management of Orchards & Vineyards, Tatura, VIC, Australia, 3–8 December 2023. [Google Scholar]
- Dhonju, H.K.; Walsh, K.B.; Bhattarai, T. Web mapping for farm management information systems: A review and Australian orchard case study. Agronomy 2023, 13, 2563. [Google Scholar] [CrossRef]
Figure 1.
Cumulative GDD from calendar day 212 at two locations 2.1 km apart on one farm (blue and orange lines), and at the nearest BoM station, 25 km away (red line). A GDD target of 1500 units from a flowering event at day 212 (horizontal green dotted line) is reached on days 335 (1 December), 341 (7 December), and 354 (20 December), respectively.

Figure 2.
Time series of flowering assessments for an orchard: (a) machine vision count of panicles at the ‘50% flower opened’ developmental stage (blue line) and manual estimation of percentage of canopy terminals in reproductive growth (green line) for an orchard block (data of block E in Table 4, where week 1 is 21 July); (b) machine-vision-based panicle count for the same block in the next production season (orange line). The period in the outline denotes a significant flowering period. X axis date format is mm/dd.


Figure 3.
Top row: A set of color cards and associated maturity score values (from 3 to 17) with associated CIE Lab values associated to flesh color at maturity for four mango cultivars. Bottom row: Images of cut cheeks of Keitt cultivar fruit. The flesh color associated with harvest maturity (card 13) of these fruit was associated with a dry matter content of 17% w/w.

Figure 5.
Workflow for recommendation of time of mango harvest. The oval boxes denote inputs, rectangular boxes denote an action, and diamond boxes denote conditional statements.
Figure 5.
Workflow for recommendation of time of mango harvest. The oval boxes denote inputs, rectangular boxes denote an action, and diamond boxes denote conditional statements.

Figure 6.
Frequency (% of total fruit number) for fruit mass ranges equivalent to tray sizes for mango cultivar ‘Calypso’ population for the forecast and actual fruit size at harvest. Forecast size was based on a growth rate of 23.2 g/week (as estimated from the mass change between weeks 4 and 3) for this population. Fruit mass was calculated using fruit lineal dimensions. Data from Amaral et al. [36].

Figure 7.
Workflow for estimating fruit load per week.

Figure 8.
Example of machine vision data on panicle count (A,C) and fruit count (B,D) in two subsequent seasons. Colors use a ‘heat’ scale (light blue, dark blue, yellow, and red for increasing levels). Scale bar represents 50 m.
Figure 8.
Example of machine vision data on panicle count (A,C) and fruit count (B,D) in two subsequent seasons. Colors use a ‘heat’ scale (light blue, dark blue, yellow, and red for increasing levels). Scale bar represents 50 m.

Figure 9.
Fruit density maps of a farm over three sequential production years. The location of frost fans are shown as stars. Dots represent machine-vision-based fruit count over 3.5 m of row, with every third row assessed. A color scale for counts shown in legend. Scale bar represents 500 m.
Figure 9.
Fruit density maps of a farm over three sequential production years. The location of frost fans are shown as stars. Dots represent machine-vision-based fruit count over 3.5 m of row, with every third row assessed. A color scale for counts shown in legend. Scale bar represents 500 m.

Figure 10.
Fruit density maps of an orchard before and after a harvest event. Dots represent fruit count over 3.5 m of row, with color scale for counts shown in legend. Scale bar represents 100 m.
Figure 10.
Fruit density maps of an orchard before and after a harvest event. Dots represent fruit count over 3.5 m of row, with color scale for counts shown in legend. Scale bar represents 100 m.

Figure 11.
Frequency distribution of fruit count per 3.5 m of row before (A) and after (B) a harvest event.
Figure 11.
Frequency distribution of fruit count per 3.5 m of row before (A) and after (B) a harvest event.

Figure 13.
Proposed workflow for a mobile-device app (‘ManGO’) for manual collection of flowering data (% of terminals in reproductive growth), fruit number, and fruit size. The app must allow data collection in-orchard, i.e., off-line, with data upload when connectivity allows.
Figure 13.
Proposed workflow for a mobile-device app (‘ManGO’) for manual collection of flowering data (% of terminals in reproductive growth), fruit number, and fruit size. The app must allow data collection in-orchard, i.e., off-line, with data upload when connectivity allows.

Figure 14.
Proposed integration of data acquisition systems (DAS), harvest forecast engine (HFE), and orchard management information system (MIS). Inputs include fruit dry matter content measurements, machine vision based estimates of flowering and fruit number, manually collected flowering and fruit load data and orchard temperature data.


Table 1.
Inputs for a mango harvest timing and load forecast system, with methodology references.
| Information | Input | Data Source |
|---|---|---|
| Harvest timing | flowering | machine vision or manual estimates of the extent of flowering, per week [3] |
| GDD | temperature (daily min and max) [17] | |
| fruit DMC | NIRS measurement [19] | |
| flesh color | destructive visual assessment [18] | |
| Harvest load | fruit count | machine vision or manual estimates [3] |
| fruit size | machine vision or manual estimates [21] | |
| fruit marketability | manual estimates | |
| fruit load | satellite-derived vegetation index imagery and historical time series data [15] |
Table 2.
Examples of user feedback on the need for, and issues in the operation of, harvest forecasts.
Table 2.
Examples of user feedback on the need for, and issues in the operation of, harvest forecasts.
| Topic | Comments |
|---|---|
| Need—on farm | Resourcing: Boxes and tray liners are ordered months before harvest, so we need to anticipate fruit numbers and size. I need months of lead time to arrange harvest labour. I plan on 120 days from flowering to harvest but that can be out a couple of weeks either way. Operation: If I get an order early in the season, I need to know where to find mature fruit. If we know fruit sizes expected from a block, we can set the packline line drops up before sorting starts. The grade of the fruit depends on defect level. Ideally, we would know the proportion (of grade 1/grade 2/reject) fruit before harvest. It’s not just about total weight, it’s when (week) and what (fruit number, size, quality). I have 22 harvest crews working in parallel through a block, each line needing 10 to 17 bins, but my bin runners only hold 6 bins each. I need them to place the bins right the first time. If you know your weekly fruit load you can set a daily volume target depending on the number of days (in the week) you operate. You adjust daily depending on volume picked on previous day. This lets you give the crew notice (whether there will be a weekend break or not). We need to decide whether there’s enough fruit left after a first harvest to justify a second harvest. The amount of fruit discarded in field during harvest or left on tree can vary considerably. Harvest never goes to plan–staff absent, rain or machine issues or other delays, like no transport available. But without a forecast you don’t have a plan. |
| Need—post farm | We spent (AUD)$0.9 M on marketing last year but it’s wasted if fruit isn’t available to deliver to market, or if we supply more than the market is ready to handle. It’s not just about tonnage or number of fruit, fruit size is important. The (fruit) price drops if we supply more than we anticipated to market, and its hard to recover price. We pick with the aim of having the product in the hands of the consumer in 14 days, but with a storage life of 28 days. We need to get the harvest date right. We need forecasts on a weekly basis from all our supplier farms. |
| Forecast issues | Nothing is ‘set and forget’, you need to be able to adjust values as the seasons progresses. For example, nothing may come of a flowering event, it may not set fruit, or the fruit may drop. Things change between years. If the foliage is denser (hiding fruit), I underestimate on fruit count. Hanging time (the time fruit can be left on tree before ripening begins) gives you some flexibility in harvest timing. It varies with cultivar, ranging from 7 to 21 days. You need to factor in our capacity to harvest. Things get busy, any system has to be easy to use, easy to put data in, and easy to see. |
Table 3.
Mango cultivar GDD (Tb of 12, TB of 32 °C) requirement for fruit development from the reproductive development stage of 50% flower opening on panicle to harvest maturity, with maturity defined by flesh color [17].
Table 3.
Mango cultivar GDD (Tb of 12, TB of 32 °C) requirement for fruit development from the reproductive development stage of 50% flower opening on panicle to harvest maturity, with maturity defined by flesh color [17].
| SN | Cultivar | Flesh Color | GDD |
|---|---|---|---|
| 1 | Honey Gold | 9 | 1560 |
| 2 | Calypso | 7 | 1540 |
| 3 | Keitt | 13 | 1936 |
| 4 | R2E2 | 1600 | |
| 5 | KP | 7 | 1420 |
Table 4.
Example of manual data collection on flowering for five orchard blocks (A to E) across 7 weeks. (i) Raw data of weekly assessment of % of canopy terminals in reproductive growth based on a manual visual assessment from driving through several rows in each block. (ii) The cumulative values are normalized to the maximum flowering level achieved in each block. (iii) Manager input is required in denoting flowering ‘events’ (generally an event involving an increase of at least 20% in flowering), the percentage of total flowering within a given block associated to each event, with user manipulation required to spread harvest activity over the available time window.
| Block | Week | ||||||
|---|---|---|---|---|---|---|---|
| 1 | 2 | 3 | 4 | 5 | 6 | 7 | |
| |||||||
| A | 0 | 0 | 5 | 5 | 55 | 60 | 60 |
| B | 10 | 50 | 65 | 65 | 85 | 90 | 90 |
| C | 30 | 85 | 90 | 90 | 90 | 90 | 90 |
| D | 10 | 50 | 65 | 65 | 65 | 65 | 65 |
| E | 0 | 20 | 20 | 20 | 60 | 90 | 90 |
| |||||||
| A | 0 | 0 | 8 | 8 | 100 | 100 | 100 |
| B | 20 | 56 | 72 | 72 | 94 | 100 | 100 |
| C | 33 | 94 | 100 | 100 | 100 | 100 | 100 |
| D | 15 | 77 | 100 | 100 | 100 | 100 | 100 |
| E | 0 | 22 | 22 | 22 | 67 | 100 | 100 |
| |||||||
| A | 100 | ||||||
| B | 20 | 52 | 28 | ||||
| C | 33 | 67 | |||||
| D | 77 | 23 | |||||
| E | 22 | 45 | 33 | ||||
Table 5.
Example forecasts of optimum harvest date for fruit of two flowering events in each of five mango blocks (A to E), using the methods of (i) Growing Degree Days (GDD) from time of flowering and (ii) achievement of a dry matter content (DMC) specification (in units of %FW), based on a linear rate of DMC increment, established per block. Dates are in dd/mm format.
| Block | FE1 | FE2 | ||
|---|---|---|---|---|
| GDD | DMC | GDD | DMC | |
| A | 4/10 | 1/10 | 16/10 | 21/10 |
| B | 6/10 | 8/10 | 22/10 | 20/10 |
| C | 6/10 | 9/10 | 24/10 | 27/10 |
| D | 30/9 | 7/10 | 22/10 | 25/10 |
| E | 24/9 | 2/10 | 8/10 | 6/10 |
Table 6.
Example forecast data for five orchard blocks. Top panel (A): increment in flowering (% of terminal in reproductive growth) for a given week has been normalized against the maximum flowering achieved in that block, i.e., a total of 100% for each block. Total fruit count, average fruit weight, and the calculated weight of fruits on trees is recorded for each block. Bottom panel (B): harvest dates are forecast using heat units and the weeks of flowering events. The % flowering value was used to partition estimated fruit load (kg) to a given harvest week and summed to calculate the expected harvest volume per week. Forecasted harvest load is also expressed as a percentage of total expected harvest. Actual packhouse out-turn (shipments) data are also presented.
| (A) | % Flowering | Fruit Count | Avg Weight (kg) | Fruit Weight (kg) | |||||
|---|---|---|---|---|---|---|---|---|---|
| Calendar week | 20 | 21 | 22 | 23 | 24 | 25 | |||
| Orchard A | 60 | 40 | 451,870 | 0.47 | 212,379 | ||||
| Orchard B | 57 | 43 | 457,799 | 0.45 | 206,010 | ||||
| Orchard C | 52 | 48 | 385,563 | 0.46 | 177,359 | ||||
| Orchard D | 22 | 22 | 56 | 350,141 | 0.48 | 168,068 | |||
| Orchard E | 41 | 59 | 363,475 | 0.49 | 178,103 | ||||
| Orchard F | 53 | 47 | 122,750 | 0.47 | 57,693 | ||||
| (B) | Harvest forecast (fruit weight, kg) | ||||||||
| Calendar week | 40 | 41 | 42 | 43 | 44 | 45 | |||
| Orchard A | 127,427 | 84,952 | |||||||
| Orchard B | 117,425 | 88,584 | |||||||
| Orchard C | 92,227 | 85,132 | |||||||
| Orchard D | 36,975 | 36,975 | 94,118 | ||||||
| Orchard E | 73,022 | 105,081 | |||||||
| Orchard F | 30,577 | 27,115 | |||||||
| FORECAST | 36,975 | 92,227 | 257,999 | 127,427 | 258,668 | 226,314 | |||
| % of total | 4 | 9 | 26 | 13 | 26 | 23 | |||
| ACTUAL | 45,975 | 126,123 | 199,798 | 101,752 | 241,765 | 191,459 | |||
Table 7.
MIS requirements.
| # | Requirement/Component | Description |
|---|---|---|
| 1 | Orchard structure | Farm location, block name, and boundaries |
| 2 | Temperature sensor association | Association of temperature sensors to blocks |
| 3 | Authentication, data access, and security | Access to and securing data at user and farm level |
| 4 | User management | Hierarchy of users required, e.g., owner, manager, and consultants, and permission across farms |
| 5 | Crop management | To handle multiple cultivars of mango with varying production windows Future expandability to other tree-fruit crops |
| 6 | Data standards | Standard data format for compatibility and interoperability with the subsystems (machine vision imaging, manual data collection, dry matter data collection, and temperature), e.g., geolocation data format and date format |
| 7 | Database management | Management of time-series data within a season with access to past season data Management of historical seasonal data |
| 8 | Data transmission | Capability to handle big spatial data including images in terms of rapid upload/ingestion, fetching data from server to client side, and download. |
| 9 | Data visualization with query able web mapping | Time-aware heat map visualization, e.g., of >50 K data values for a given farm, of machine vision data over online basemaps (e.g., Google/ESRI/Bing/hostable drone imagery) and presentation of data. |
| 10 | Visualization of machine vision images | Display of machine vision images of flower and fruit at tree level |
| 11 | User friendliness | User experience in terms of interface interactiveness and responsiveness in farm locations to be confirmed in terms of interactive and responsive map, table, and charts. |
| 12 | RESTful APIs | To enable query ability, interoperability, and automatability between the systems, and progressive development of the system and subsystems |
| 13 | Communication module | Email service to inform users regarding data updates |
| 14 | Operationability | Maintainability and scalability |
Disclaimer/Publisher’s Note: The statements, opinions and data contained in all publications are solely those of the individual author(s) and contributor(s) and not of MDPI and/or the editor(s). MDPI and/or the editor(s) disclaim responsibility for any injury to people or property resulting from any ideas, methods, instructions or products referred to in the content. |
© 2024 by the authors. Licensee MDPI, Basel, Switzerland. This article is an open access article distributed under the terms and conditions of the Creative Commons Attribution (CC BY) license (https://creativecommons.org/licenses/by/4.0/).
Share and Cite
MDPI and ACS Style
Dhonju, H.K.; Bhattarai, T.; Amaral, M.H.; Matzner, M.; Walsh, K.B. Management Information Systems for Tree Fruit–2: Design of a Mango Harvest Forecast Engine. Horticulturae 2024, 10, 301. https://doi.org/10.3390/horticulturae10030301
AMA Style
Dhonju HK, Bhattarai T, Amaral MH, Matzner M, Walsh KB. Management Information Systems for Tree Fruit–2: Design of a Mango Harvest Forecast Engine. Horticulturae. 2024; 10(3):301. https://doi.org/10.3390/horticulturae10030301
Chicago/Turabian StyleDhonju, Hari Krishna, Thakur Bhattarai, Marcelo H. Amaral, Martina Matzner, and Kerry B. Walsh. 2024. "Management Information Systems for Tree Fruit–2: Design of a Mango Harvest Forecast Engine" Horticulturae 10, no. 3: 301. https://doi.org/10.3390/horticulturae10030301
Note that from the first issue of 2016, this journal uses article numbers instead of page numbers. See further details here.