Article

Effect of the Intensity and Spectral Quality of LED Light on Growth and Quality of Spinach Indoors

by
Alejandro Martínez-Moreno
*,
Antonio Frutos-Tortosa
,
Huertas Diaz-Mula
,
Teresa Carmen Mestre
and
Vicente Martínez
Centre for Applied Soil Science and Biology of the Segura (CEBAS) of the Spanish National Research Council (CSIC), 30100 Murcia, Spain
*
Author to whom correspondence should be addressed.
Horticulturae 2024, 10(4), 411; https://doi.org/10.3390/horticulturae10040411
Submission received: 15 February 2024 / Revised: 5 April 2024 / Accepted: 16 April 2024 / Published: 19 April 2024
(This article belongs to the Section Vegetable Production Systems)

Abstract

:
In recent years, much effort has been devoted to understanding the response of plants to different light properties, largely due to advances in the light-emitting diode (LED) industry. This work studied the effect of different light intensities and qualities on yield or quality of indoor hydroponic spinach (Spinacia oleracea L.). Two trials were carried out at two different times. The intensity assay was carried out with the same type of light (AP673L, Valoya Ltd., Helsinki, Finland) at different luminous intensities (150, 290, and 430 µmol m−2 s−1). In the second trial, four different luminance spectra (Valoya Ltd., Helsinki, Finland) were used (NS12, AP67, AP673L, G2). Then, the fresh and dry weight, nutritional status, and concentration of primary metabolites were determined. Both lights parameters induced changes in vegetative performance and other physiological traits, as well as their quality and nutritional composition (minerals, organic acids, sugars, and amino acids). The increase in light intensity increased Fv’/Fv’, fresh weight, leaf area, chlorophyll fluorescence parameters, and potassium concentration. The light intensity effectively controlled nitrate accumulation in an inverse relationship. The effect of the light spectrum on spinach characteristics was not clearly observed when multivariate statistics were applied to the data. No linear relationship was found between the different R/B ratios. This is perhaps due to commercial lights having a complex combination of wavelengths, in addition to the main R/B proportion. Within the overall results, 6 R/B presented the best results for the indoor cultivation of spinach. More studies are needed, since breeding for controlled environments shifts the focus of the desired crop attributes towards rapid growth and harvest quality instead of stress adaptability.

1. Introduction

Spinach (Spinacia oleracea L.) is a common green leafy vegetable usually found in the fresh produce market. According to FAO data, worldwide spinach production reached 31,007,938 tons in 2020 [1]. Vegetables are generally considered important contributors to a healthy diet, and an increased intake of vegetables is related to a decreased risk of cancers, cardiovascular disease, and other diseases [2]. Spinach is an excellent source of vitamins and minerals, such as iron, sodium, potassium, and calcium [3,4]. In recent years, numerous studies have demonstrated the bioavailability of certain spinach compounds, their antioxidant capacity, and derivate products after consumption by humans [5]. In addition, as health-conscious consumers are becoming increasingly numerous worldwide, spinach has attracted increased attention as a healthy vegetable, whereby production has increased by 35% over the past ten years [1].
The use of hydroponic cultivation in vertical farms has several advantages as compared to the traditional system of producing crops using soil (geoponics). Some of them are as follows: optimization of space [6], water savings [7], control of environmental conditions [8], higher crop yields [9], reduction in chemicals and pesticides [10], and high energy efficiency [9]. Therefore, an indoor vertical hydroponic system is a promising technological solution to the problems faced by current global warming. Nevertheless, some challenges regarding energy efficiency, economic profitability, automation, and consumer acceptance still exist. If these challenges can be overcome, indoor vertical farming has great potential as a guaranteed source of high-quality food, providing a practical and resilient solution to present-day food system challenges [11].
Light is one of the most important environmental factors that affect plant development and growth. In recent years, light-emitting diode (LED) technology has been developed to be more efficient and effective, having a remarkable potential as a supplemental source of light for promoting plant growth [12]. Light intensity and light quality or spectrum, through photosynthesis and the operation of photoreceptors, have broad regulatory effects on morphogenesis and many physiological and metabolic processes, which finally determine the main characteristics of plants [11].
Light intensity is essential for optimal plant growth, and affects plant development, metabolism, and the activity of the antioxidant system. However, it has been shown that high light intensities can be detrimental, as they can reduce plant production [13]. Ref. [14] observed that when photosynthetic photon flux density (PPFD) increased to 550 μmol m−2 s−1, the specific leaf area (SLA) decreased in tomato plants. In another hydroponic spinach study, with the same light spectrum (R:B = 4:1) and different light intensities (90, 140, 190, and 240 µmol m−2 s−1), the authors observed that the highest values of growth parameters occurred in the variety of spinach PD512 when grown at 190 µmol m−2 s−1, therefore producing a reduction in growth at the maximum light intensity (240 µmol m−2 s−1) [15]. On the contrary, low intensities can also cause changes in the morphology and physiology of the leaf. In this sense, in an experiment on hydroponic spinach using four light intensities, the authors observed a decrease in the specific leaf area and plant height of plants when grown with the lower intensities [15]. In addition, the same authors showed a significant increase in nitrate content, at a low light intensity (90 µmol m−2 s−1). However, despite being a popular vegetable, the optimal LED light parameters for spinach have not been fully investigated. Only LED lamps with different spectrums and some low light intensity levels have been studied for this species [16]. Therefore, it is crucial to find the best light intensity to optimize plant growth under indoor conditions [17,18,19].
On the other hand, about 90% of the light absorbed by leaves is in the blue or red light spectrum [20]. The use of the blue or red LED spectrum has resulted in a significant enhancement in the quality and yield of vegetables as compared to white fluorescent light or sunlight [21,22,23]). Specifically, red light (between 600 and 700 nm) and blue light (400 and 500 nm) can affect plant morphology, physiology and development, photosynthesis, and primary metabolism [24]. Red light accelerates growth speed, increasing leaf area and biomass accumulation [25]. Previous studies have shown that the intensity and combination of spectral light-emitting diodes in the visible light spectrum are effective for photosynthesis and the normal growth of different crops [13,16,24,25]. However, the intensity and spectral light appropriate for the optimal growth and nutrient quality of spinach crops is an issue that needs to be clarified.
Finally, it has been proven that plants have different lighting requirements under artificial light than under sunlight [13,26], yet the effects of spectral quality on plant development and primary metabolite synthesis are not completely understood. Therefore, it is very important to find the best light spectrum and intensity to optimize spinach plant growth under indoor conditions. The objective of this study was to determine the effect of four commercial LED light spectra and three light intensities on yield, plant quality parameters, and the concentration of primary metabolites in spinach (Spinacia oleracea L.) grown in a vertical indoor farming set-up.

2. Materials and Methods

2.1. Plant Material, Growing Conditions, and Light Treatments

Two trials were carried out at two different times (Table 1). The first trial was carried out with the same type of light (AP673L, Valoya Ltd., Helsinki, Finland) at different light intensities (150, 290, and 430 µmol m−2 s−1). In the second trial, four different light spectra (Valoya Ltd., Helsinki, Finland) were used (NS12, AP67, AP673L, G2).
In both trials, Spinach (Spinacia oleracea L. cv. Acadia) was used as plant material. Seeds were germinated in total darkness, in growing trays filled with a mixture of rockwool, and irrigated with tap water. After 39 days (light intensity trial) and 45 days (light quality trial), seedlings were transplanted to a 20 L plastic container with Hoagland nutrient solution (KNO3 (3 mM), Ca(NO3)2 (2 mM), MgSO4 (0.5 mM), KH2PO4 (0.5 mM), Fe-EDTA (10 μM), H3BO3 (10 μM), MnSO4·H2O (1 μM), ZnSO4·7H2O (2 μM), CuSO4·5H2O (0.5 μM) and (NH4)6Mo7O24·4H2O). The spinach was grown hydroponically in an environmentally controlled room with a 12 h light period under light/dark temperatures of 20 ± 1 °C and 18 ± 1 °C. The pH and electrical conductivity (EC) of the Hoagland solution were kept within a range of 5.4–5.6 and 1.8–2.1 mS cm−1, respectively. Table 1 shows a summary of the characteristics of the quality and intensity of the LED light.

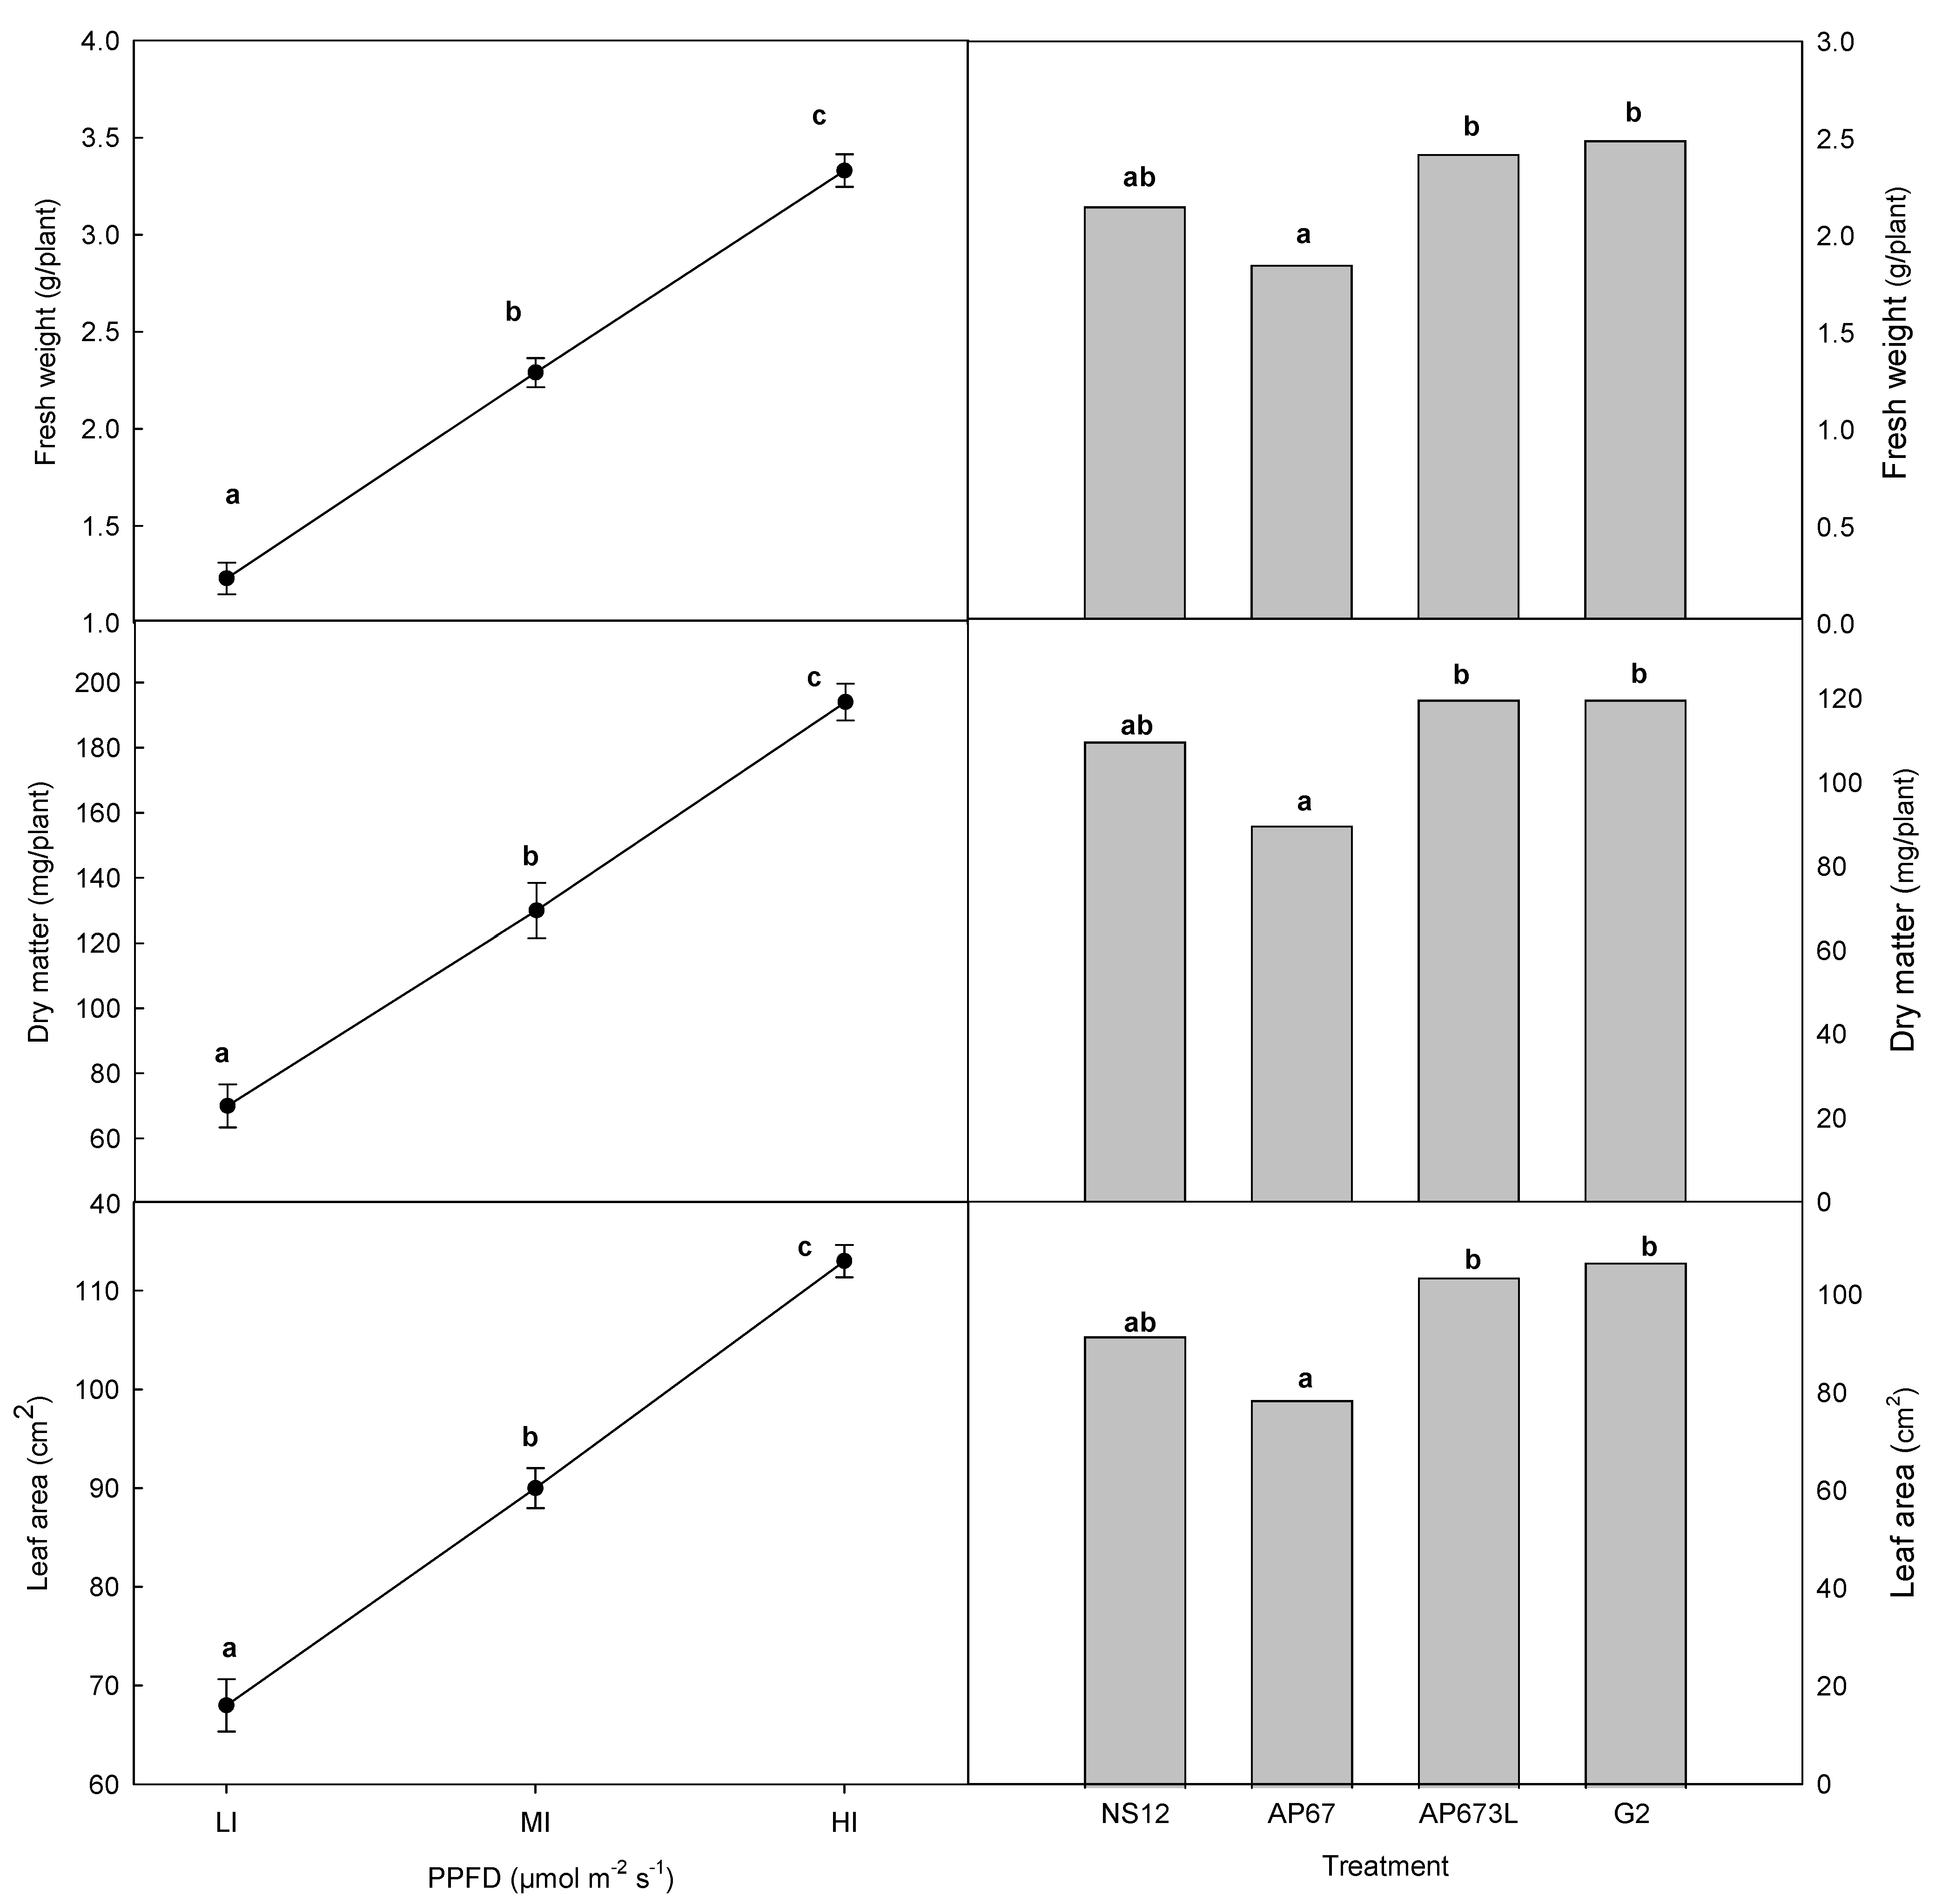
2.2. Plant Growth Parameters

Seventy plants from each container per treatment were sampled randomly at the end of the light period. Leaf area and fresh weight were measured, and leaf blades, petioles, and roots were separately weighed and oven-dried at 60 °C for 72 h. A sampling of leaf blades from ten plants from another container was frozen in liquid nitrogen and maintained at −80 °C for further biochemical determinations.

2.3. Chlorophyll Fluorescence Parameters and SPAD

The chlorophyll fluorescence parameters were measured with a pulse-modulated fluorometer model FMS-2 (Hansatech, King’s Lynn, Norfolk, England) on the leaves of the plants that were then harvested. The chlorophyll fluorescence parameters measured were as follows: the antennae efficiency of PSII, Fv′/Fm′ = (Fm′ − F0′)/Fm′, where Fv′ is the variable fluorescence and Fm′ is the maximum fluorescence; the quantum efficiency of PSII, ФPSII = (Fm’ − Fs′)/Fm′; and the photochemical quenching co-efficient qP = (Fm′ − Fs)/(Fm′ − F0′), where Fs is the steady-state fluorescence yield, Fm’ is the maximal value when all reaction centers are closed after a pulse of saturating light (12,000 μmol m−2 s−1 for 0.8 s), and F0′ is the minimal fluorescence in the light-adapted state that is obtained by turning off the actinic light temporarily and applying a pulse of far-red light (735 nm) to drain the electrons from PSII. At the end of the growth period, the chlorophyll content was measured using a Minolta Chlorophyll Meter SPAD-502 (Konica Minolta, Osaka, Japan); the measurements were performed on six leaves per plant in the center of each leaf. This instrument measures the leaf transmittance at two wavelengths, 670 nm and 940 nm, representing, respectively, the peak of chlorophyll absorbance and its minimum: the difference between the two values recorded by the detectors represents an index of leaf chlorophyll concentration.

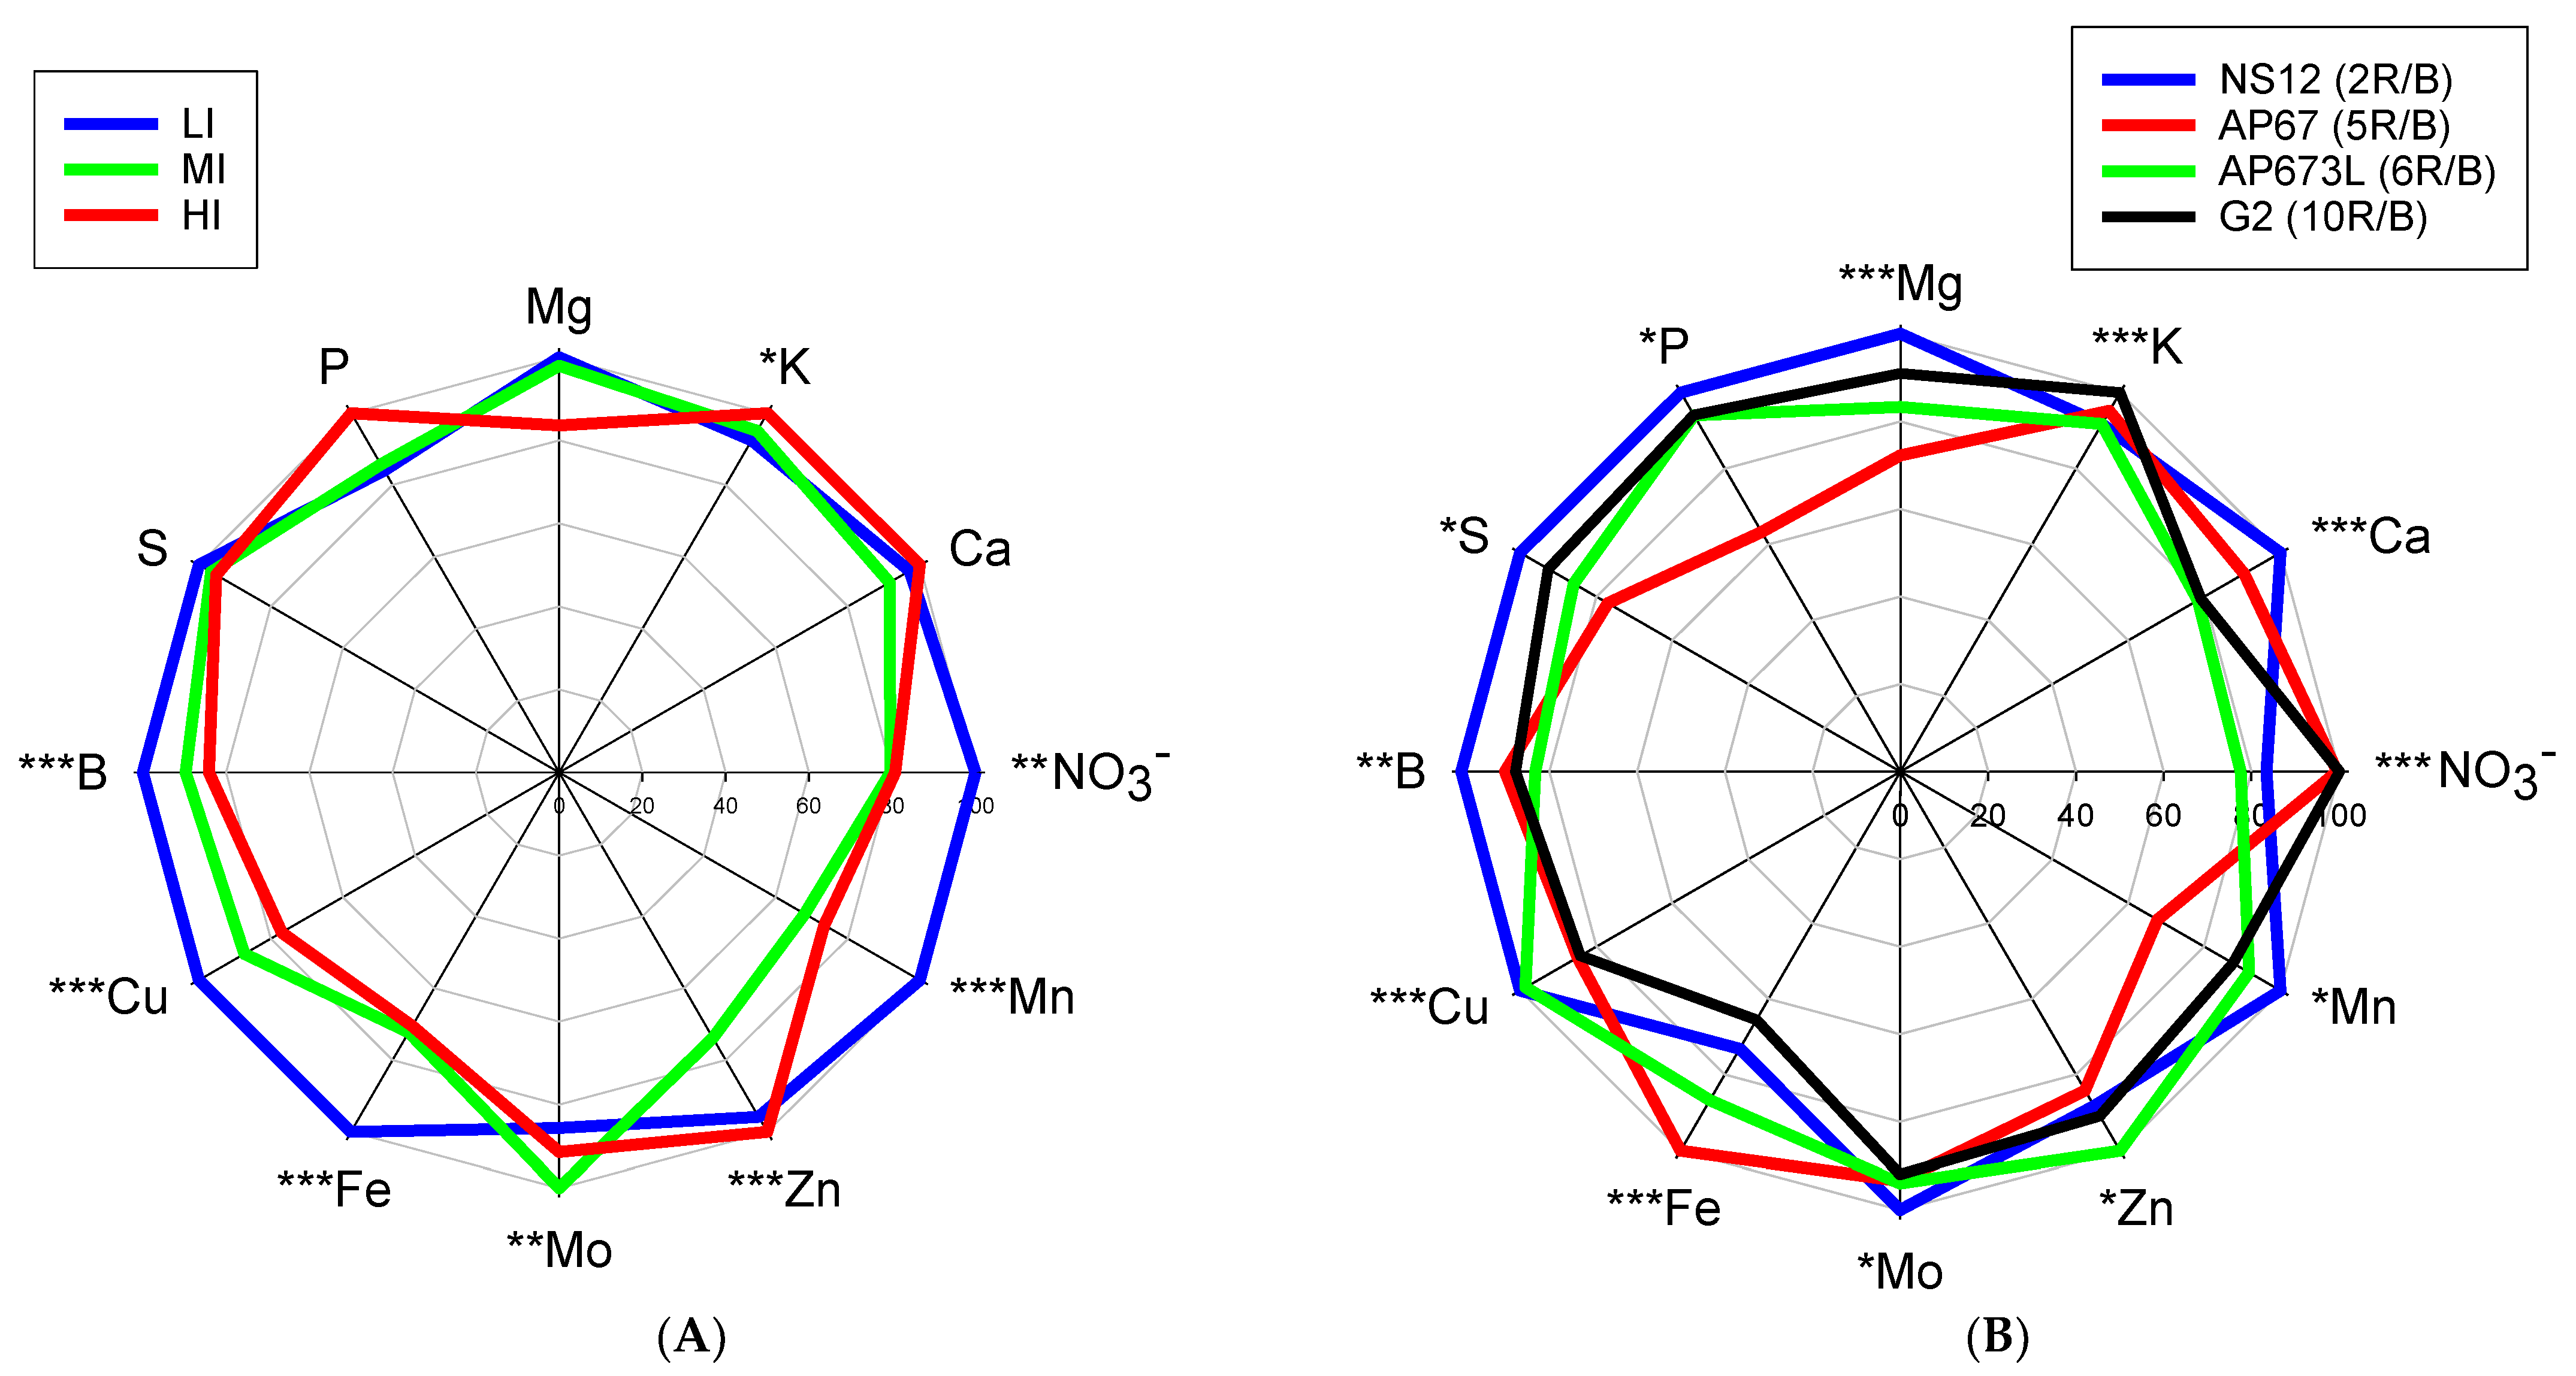
2.4. Mineral Analysis

The concentrations of Na, K, Mg, Ca, P, S, Fe, Cu, Mn, Zn, and B were determined from oven-dried leaf samples. These were ground to a fine powder and digested with HNO3:H2O2 (5:3 v/v) using a microwave (CERM Mars Xpress, Matthews, NC, USA) with a temperature ramp that reached a maximum of 200 °C. These were posteriorly analyzed using inductively coupled plasma mass spectrometry (ICP-MS, Iris Intrepid II, Thermo Electron Corporation, Franklin, TN, USA). Total C and N were analyzed with a Thermo Finnigan C/N elemental analyzer (Milan, Italy). The concentrations of Cl, SO42−, NO3, and PO4 were measured by ion chromatography (850 Professional, IC Metrohm AG, Herisau, Switzerland) after 30 min of mechanical agitation extraction with distilled water (50 mg in 10 mL of water). The sample was centrifuged at 2000 rpm for 5 min and filtered.

2.5. Antioxidant Capacity, and Chlorophyll and Carotenoid Concentration

The antioxidant capacity assay was carried out according to the protocol by [27], where the remaining amount of DPPH is inversely proportional to the antioxidant capacity of the substances present in the sample. The results are expressed as % Radical Scavenging Activity (% RSA). For the extraction and determination of the two chlorophyll fractions and total carotenoids, the protocol described by [28] was followed. Briefly, the frozen spinach leaves were homogenized and mixed with acetone (80%) extraction solvent in a 1:5 ratio (w:v; leaf: acetone), and centrifuged at 15,000× g at 4 °C for 5 min. The absorbance at 663 and 647 nm was measured in the ten-fold diluted extraction by using a UV/Vis spectrophotometer (PowerWave XS2, BioTek, Winooski, VT, USA) for the determination of the two chlorophyll fractions (Chl a and Chl b). Total carotenoid concentration was calculated by reading the absorbance at 470 nm (A470). The concentrations of chlorophyll a and b and carotenoids were obtained according to the equations from [29]. The results were expressed in µg g−1 FW.

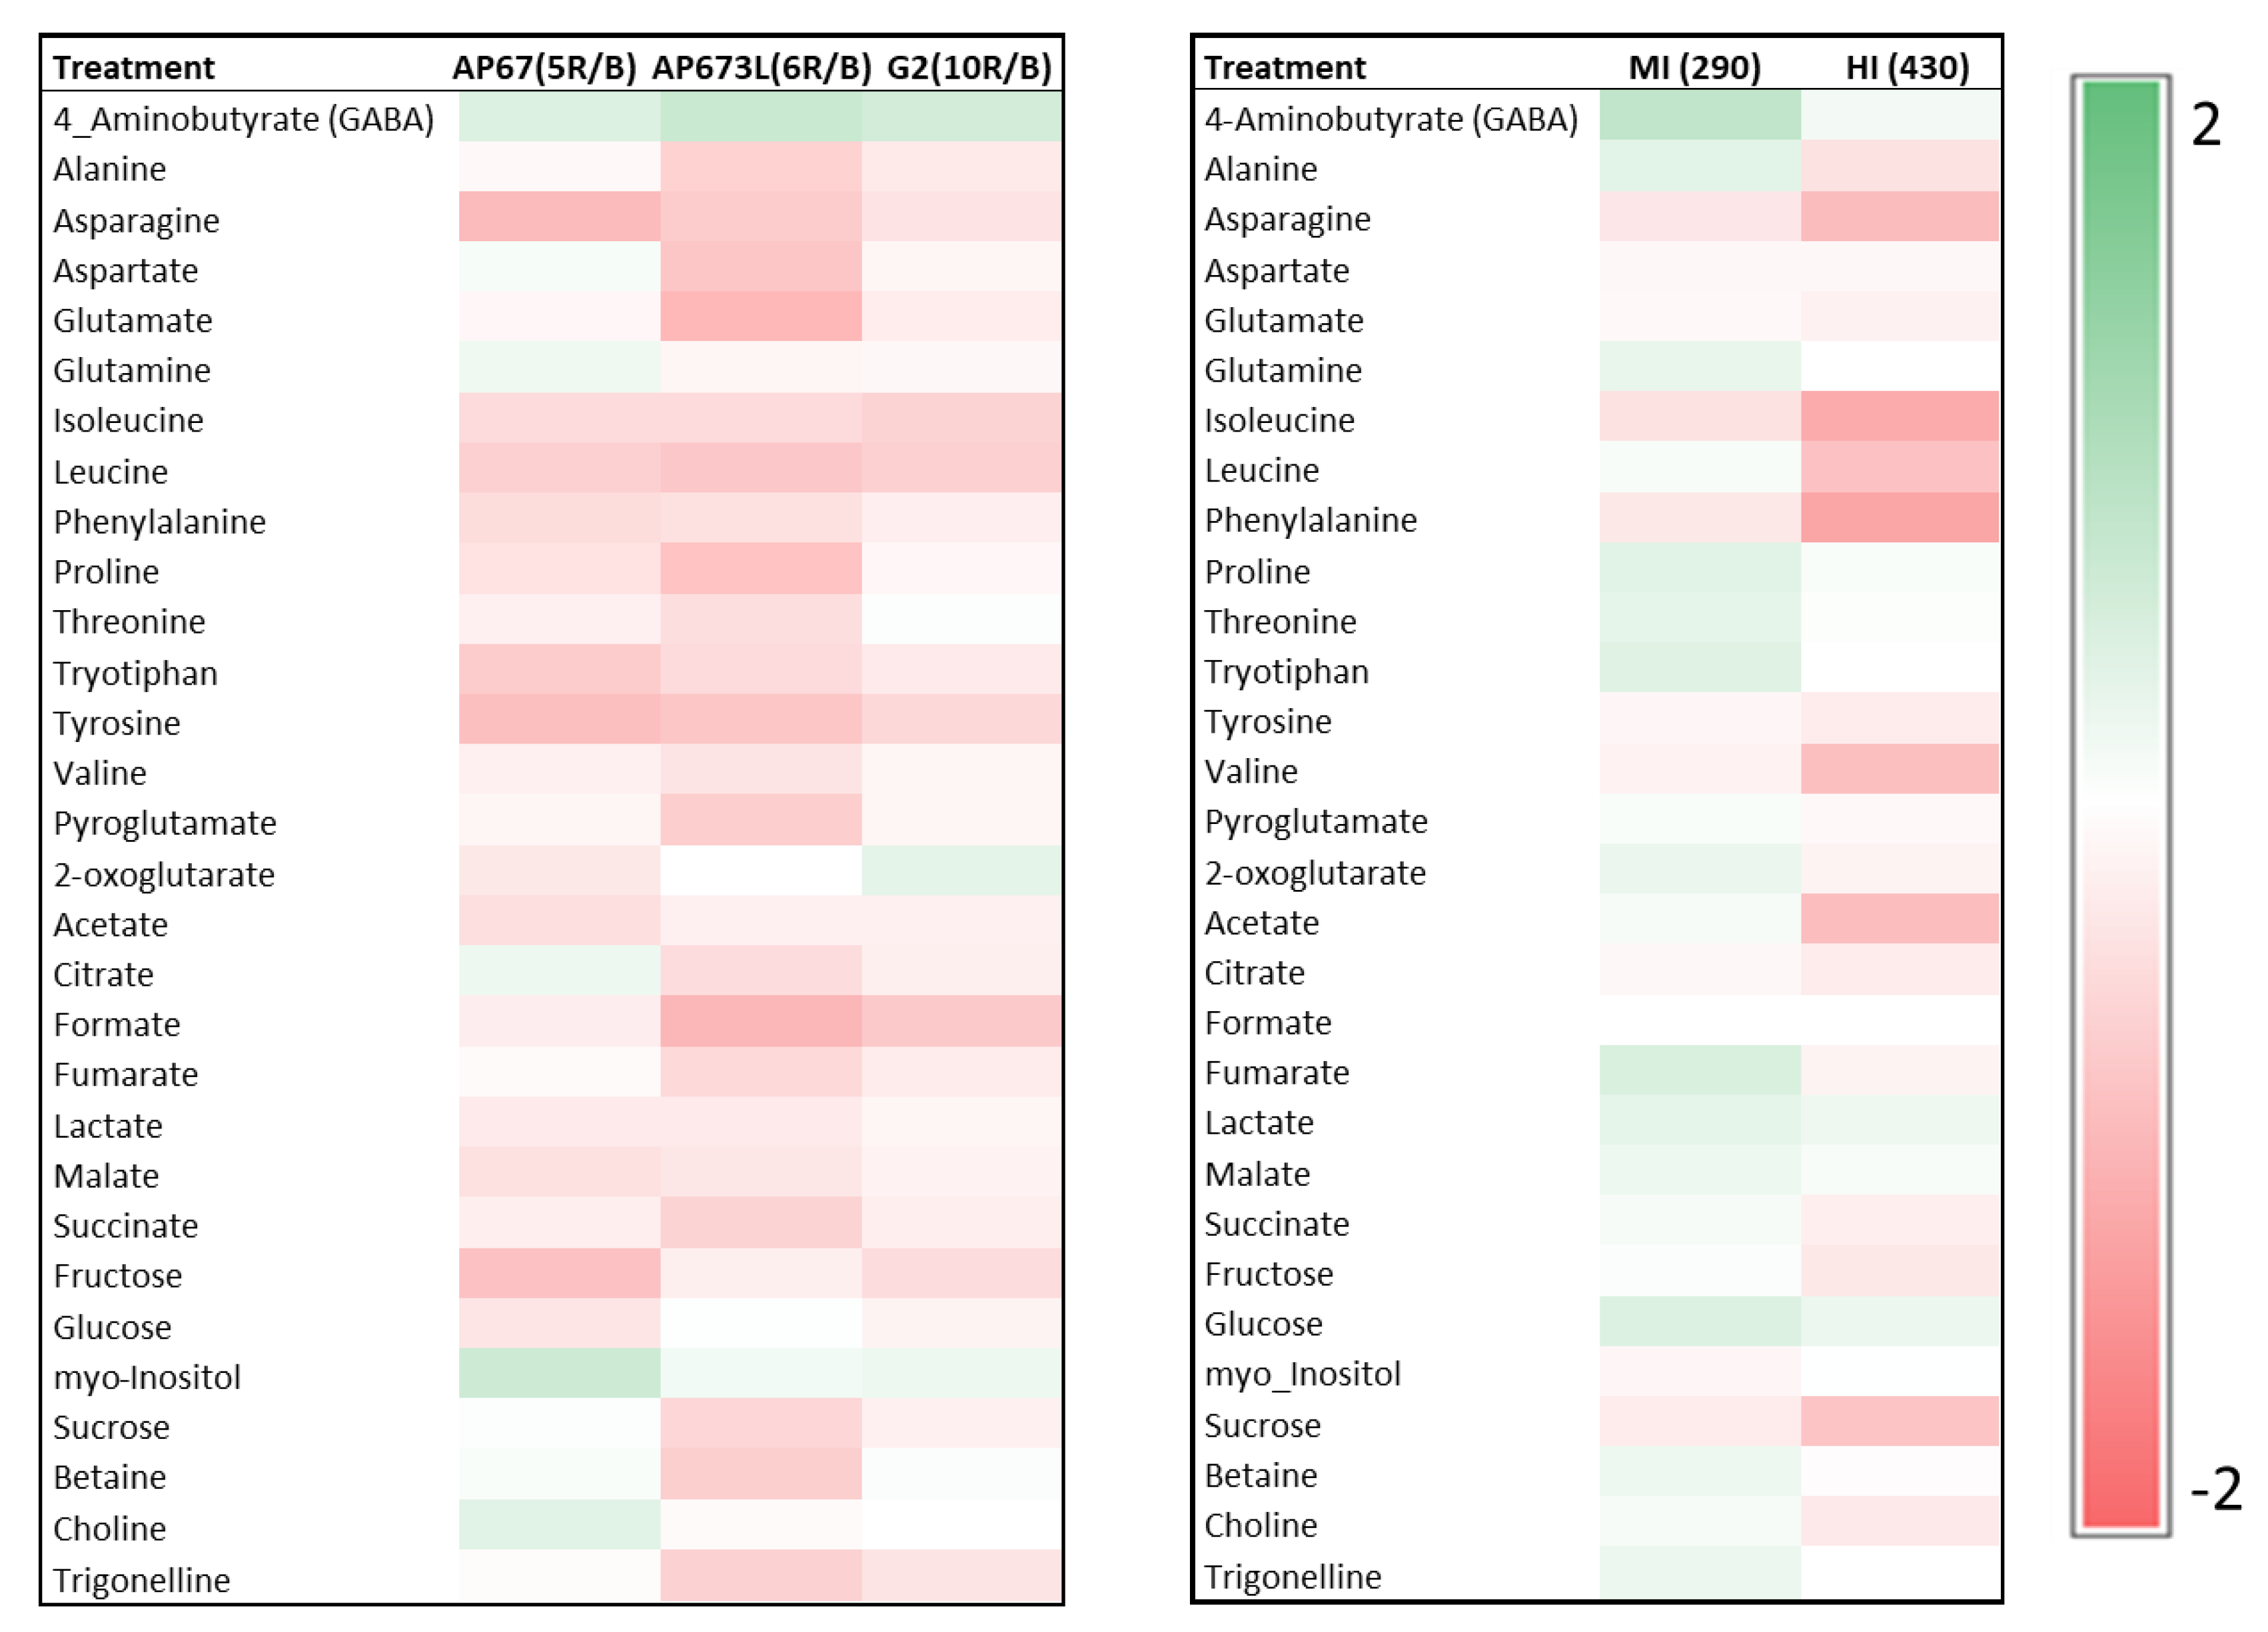
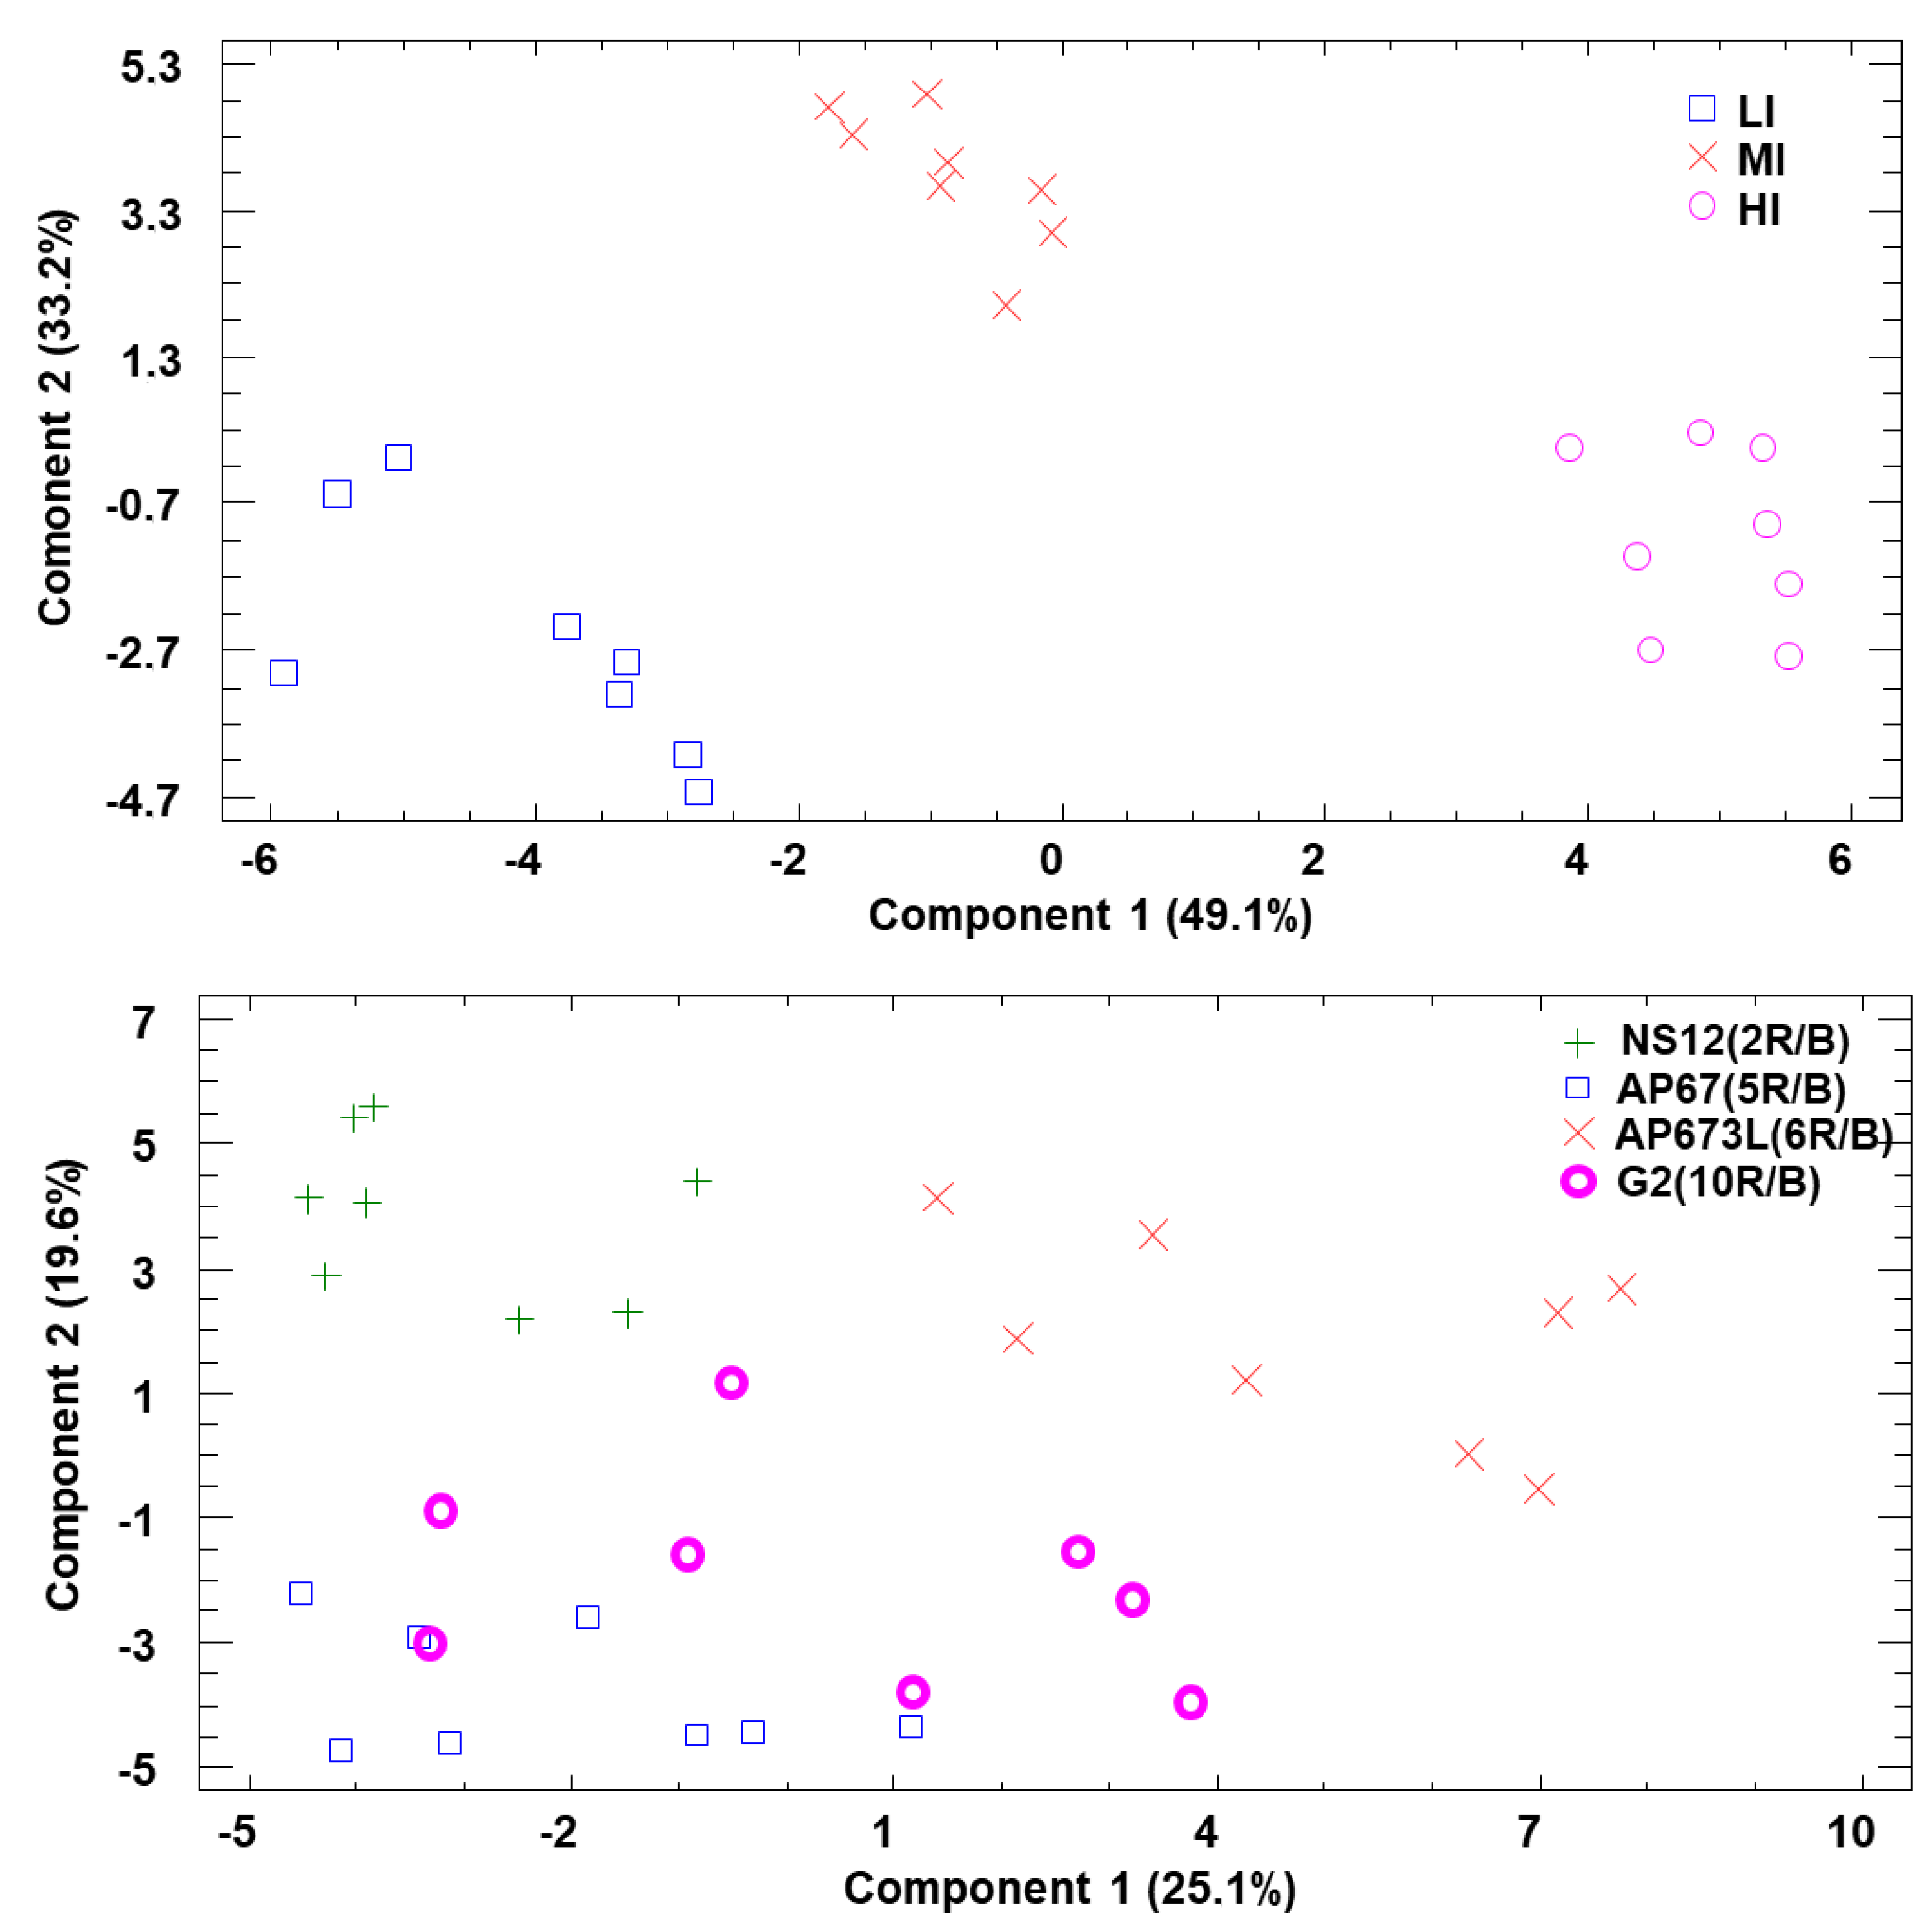
2.6. Primary Metabolites

To determine the concentration of primary metabolites, the methodology described by [30] was followed, with some modifications. Fifty milligrams of dry, homogenized foliar material was weighed, and 1 mL of a hydromethanolic mixture 1:1 was added. After sonication, the upper phase was centrifuged and collected. The samples were kept for 12 h in a thermostated vacuum centrifuge Univapo 150 ECH (Biogen Científica s.l., Madrid, Spain). The soluble solid obtained was resuspended in 600 μL of 100 mM potassium phosphate buffer (KH2PO4) at pH 6.0 (dissolved in 100% heavy water (D2O)), and with an internal standard of 5 mM thiamin phosphate (TPS). After centrifuging the samples to 16,100 g/5 min/4 °C, 600 μL of supernatant were quantified in the Ultra High-Resolution Mass Spectrometry and Nuclear Magnetic Resonance Platform integrated through Online Solid Phase Extraction (LC-MS-SPE-NMR) at the CEBAS-CSIC.

2.7. Statistical Analysis

The statistical analysis consisted of a one-way analysis of variance (ANOVA) (treatments) performed with the statistical package SPSS v. 24 (SPSS statistical package, Chicago, IL, USA). The values presented for each treatment came from a total of ten biological units (n = 10). When the ANOVA was significant (p < 0.05), Tukey’s multiple range test was utilized to separate the means. A principal component analysis was carried out using the statistical package Statgraphics Centurion XVI 16.0 (Statpoint Technologies, Inc, The Plains, VA, USA).

3. Results

Light intensity highly influenced growth parameters in spinach (Figure 1, left). The increase in fresh weight (FW), dry matter (DM), and leaf area (LA) was directly proportional to the light intensity used. The highest values of these parameters were obtained under high light intensity (430 µmol m−2 s−1). As a result of the different quality of light used, significant differences in FW, DW, and LA can be observed in spinach (Figure 1, right). A tendency to increase shoot fresh weight by increasing the R/B ratio when no UV light (2 R/B) was involved was observed. The highest growth parameters values were observed under 6 R/B and 10 R/B light quality treatments, although there were no significant differences between these treatments, while the lowest values were observed under the 5R/B light quality treatment.
The light intensity did not significantly affect the concentration of macronutrients (Ca2+, Mg2+, P, and S) in hydroponic spinach (Figure 2A). Only potassium showed a slight increase when the higher intensity was used. The highest nitrate concentration was found at 150 µmol m−2 s−1. The increase in intensity resulted in a significant decrease in nitrate concentration in the MI and HI treatments concerning the LI treatment. Furthermore, the results show that starting from a medium intensity (290 µmol m−2 s−1), there was no further reduction in the concentration of nitrate in spinach. The concentration of micronutrients (B, Cu, Fe, Mo, Zn, and Mn) presented significant differences between the different light intensities (Figure 2A). This should be noted in the case of iron, manganese, boron, and copper, where the low intensity increased their leaf concentration by 30% as compared to the medium and high intensities. Different light qualities caused differences in the foliar concentration of the spinach’s macro and micronutrients at harvest (Figure 2B). The lowest concentration of nitrate was obtained with the 6 R/B spectrum, followed by 2 R/B, and there were no statistically significant differences between 5 R/B and 10 R/B. The 2 R/B spectrum showed the highest concentration of all the macronutrients except for K+. The 5 R/B ratio decreased the concentrations of Mg2+, P+, and S up to 40% when compared with 2 R/B, although it provided the maximum concentration of Fe. Differences were found among all micronutrients, but no trends were observed.
Chlorophyll fluorescence parameters are shown in Table 2. The Fv^/Fm^ ratio did not change in spinach cultivated under different light intensities, but a significant increase was observed in the MI and HI treatments in ФPSII. The qP variation strongly increased from low to medium intensity and remained stable from medium to high intensity. The highest SPAD values were obtained at the 430 µmol m−2 s−1 light intensity. The Fv^/Fm^ ratio and ФPSII did show differences between light qualities, with the highest values found on spinach leaves grown under 2 R/B and 6 R/B ratios. No significant differences in qP and chlorophyll were found under the four different light spectra used (Table 2). Chlorophyll, carotenoid content, and antioxidant capacity did not show statistically significant differences under the light intensity and light quality treatments (Appendix A Table A1). However, the higher values of these parameters with the lowest light intensity (150 µmol m−2 s−1) and 5 R/B light quality were observed.
NMR metabolite analysis results were divided into different categories (free amino acids, organic acids, and sugars). The concentration of amino acids detected by Nuclear Magnetic Resonance (H-NMR) in spinach plants is shown in Table 3. Regarding light intensity experiments, glutamate, glutamine, and aspartate were the major amino acids, accounting for 60–70% of the total amino acids in the three light treatments. Moreover, the content of glutamate was relatively high as compared with the rest of the amino acids. Most of the amino acids reached the highest concentrations at the 290 µmol m−2 s−1 light intensity (glutamine, asparagine, alanine, GABA, tryptophan), with many of them being significantly higher than the other two treatments. It should be noted that none of the amino acids reached their highest concentration at the maximum light intensity (430 µmol m−2 s−1). The effects of light quality on amino acid concentration in spinach are not as clear, with the effect of light quality varying for each amino acid determined (Table 3). The amino acids with a higher concentration in all quality light treatments were glutamate, glutamine, and aspartate, accounting for around 65% of the total amino acids. Ultraviolet light treatment (2 R/B) increased most of the amino acid concentrations. On the contrary, this treatment significantly reduced the concentration of the GABA amino acid as compared to the rest of the treatments.
The concentration of the main organic acids in spinach is shown in Table 4. In the light intensity experiment, the main organic acids quantified were malate and citrate, followed by ascorbate in the three intensities used. No significant differences were observed in the concentration of the two main acids, although there was a tendency for the MI treatment (290 µmol m−2 s−1) to increase the concentration of these acids. In this sense, the MI treatment also increased the concentration of ascorbate, succinate, acetate, fumarate, and 2-oxoglutarate. The HI treatment significantly decreased the concentration of ascorbate and acetate acids as compared to the LI and MI treatments. The spinach plants that grew with the ultraviolet light treatment (2 R/B) increased the concentration of the two major acids (malate and citrate), although this increase was only significant in the case of citrate. This treatment also increased the concentration of succinate, formate, and fumarate as compared with the rest of the treatments. The highest red/blue ratio (10 R/B) treatment significantly increased the concentration of 2-oxoglutarate acid. When spinach leaves were richer in nitrate (LI, 5 R/B and 10 R/B), the concentration of total organic acids tended to increase, and glucose, fructose, sucrose, and tryptophan tended to be in lower concentrations, as described in [31]. Likewise, a decrease in sugars and citric acid cycle intermediates leads to a general decrease in amino acids, as observed in these results. The contents of the free amino acids under the different R/B ratio decreased to varying degrees, thereby causing the total amino acid content of spinach to decrease, mainly in spinach cultivated under the 6 R/B ratio. Glutamine foliar concentration did not show differences, but glutamate, and especially aspartate and asparagine concentrations, were found to be affected by the light quality. Soluble asparagine and GABA accumulate in plant organs during low rates of protein synthesis but also during stress-induced processes [32]. There was a tendency to increase these two amino acid concentrations with the increase in the R/B ratio as a response to the exposure to far-red and UV light. Ref. [33] also found a significant reduction in total amino acid concentration in tatsoi leaves after using far-red light. Ref. [34] explained the increase in aa concentration in pak choi by the enhancement of the activity of the nitrate-cycle enzymes (nitrate reductase, nitrite reductase, glutamine synthetase, and glutamate synthase) due to the exposure to blue light. Similarly, ref. [35] found a decrease in the activity of glutamate synthase in lettuce due to far-red light exposure. Light quality highly influences sugar concentrations (Table 4). Ultraviolet light treatment (2 R/B) increased the concentration of total carbohydrates, followed by the 5 R/B treatment. Contrarily, the lowest carbohydrate concentrations were obtained in spinach grown under the 6 R/B treatment. The 2 R/B and 5 R/B treatments increased the concentration of sucrose and betaine (the two major carbohydrates). In addition, the fructose concentration significantly improved when the light treatment had an ultraviolet percentage (2 R/B). Spinach plants grown under the light treatment with the lowest red/blue ratio, without ultraviolet light (5 R/B), obtained the highest concentration of myo-inositol.
For the creation of the heat map (Figure 3) with a comparison target, 150 µmol m−2 s−1 and 2 R/B were selected as the control light, since this intensity is frequently used in plant greenhouses and its spectrum is similar to solar light (Table 1). The light treatments (5 R/B, 6 R/B, and 10 R/B) reduced the concentration of most of the metabolites analyzed, as compared to the 2 R/B treatment, except for GABA and myo-inositol. Regarding the light intensity treatments, when a light intensity of 290 µmol m−2 s−1 was applied, most of the metabolites increased or maintained their concentration. However, when an intensity of 430 µmol m−2 s−1 was applied, the concentration of most metabolites was reduced.
The data set corresponding to all significant parameters measured in this work was treated with a principal component analysis (PCA) (Figure 4 to allow for a simple, fast, and visual understanding of our results. The first two principal components jointly explain 82% of the variability of the data. Figure 4 shows the PCA used for different light intensities with a clear separation between treatments along component 1. The spectra projections on the first axis (49%) present an obvious separation of the three light intensity treatments (LI left, MI center, and HI right side). The main contributors to the first component were fresh weight, leaf area, NO3, B, Cu, and Fe. Furthermore, component 2 separates the light intensities into two groups; the intensities of LI and HI are shown in the lower area. On the contrary, in the upper area, the intermediate intensity is located. Regarding the multivariate analysis of the treatments with different light spectra (Figure 4), the separation between treatments was not as clear as with light intensity. The PCA places the 2 R/B treatment (with ultraviolet light) on the upper left side, treatment 6 R/B on the upper right side, and 5 R/B and 10 R/B (treatments with higher far-red spectrum) on the lower left side. Furthermore, the two principal components only explain 47% of the variability in the data.

4. Discussion

Plants need light not only for photosynthesis but also to regulate their development and their phytochemical concentrations [36]. In spinach, the results showed a proportional relationship between the intensity and growth parameters (Figure 1). The increase in light intensity from 150 to 430 μmol m−2 s−1 enhanced spinach growth by 66%. Similar results were found in other spinach studies [15] and for leafy vegetables such as lettuce [37] and basil [18], indicating that on leafy greens, a higher growth rate is typically associated with higher irradiance, because there are more photons available for photosynthesis, which enhances biomass accumulation. Among the parameters that affect growth, the photoperiod is the most influential factor for indoor cultivation, followed by light intensity and light quality [38].
Regarding light quality treatments, the maximum difference observed between treatments was around 27%. A linear relationship between the growth parameters and the R/B ratio was expected according to several previous studies [22,23,24,26,38]. The maximum growth was obtained in the treatments with the higher ratio (10 and 6 R/B) (Figure 1), although 2 R/B had higher fresh weight and leaf area values than 5 R/B. This can be explained because the 2 R/B light treatment has a UV light and a higher percentage of green light, while the 5 R/B treatment lacks a UV light and has half the percentage of green light. UV-A light can enhance biomass [39], and this small proportion of UV light might be enough to affect the plant’s metabolism. In addition, recent studies suggested that green light should not be disregarded in plant growth and development. Ref. [40] has shown that both additional green light and the partial replacement of the spectrum by green light resulted in increased fresh and dry weights of basil. The light used in this experiment had different green light percentages, with 2 R/B doubling the others. These factors may influence plant growth on 2 R/B spinach more than the higher red light increase from 2 R/B to 5 R/B. Generally, this non-linearity has been observed in the response to a higher R/B ratio. The light used in this experiment also had different percentages of red and far red light. 5 R/B and 10 R/B were the treatments with the highest percentage of far-red and the lowest R/FR ratio, and the opposite occurred with 2 R/B and 5 R/B. These factors may influence the different parameters analyzed in spinach plants, to a greater extent than the greater increase in red light from 2 R/B to 10 R/B.
Mineral composition was affected by the light intensity treatments. In Figure 2A, it can be observed that the K concentration was higher in the HI treatment; similar results were obtained by [41] in cucumber. When compared with the revised literature, light intensity has a direct relationship on the ion absorption capacity of plants [42], and optimizing light conditions can effectively promote nutrient uptake by plants [43]. Concerning the micronutrients, B, Cu, Fe, Mo, Zn, and Mn presented significant differences between the different light intensities, where the low intensity increases Fe, B, and Cu leaf concentration. Similar results were observed by [44], where the concentration of micronutrients increased as the light concentration decreased from 400 to 200 µmol m−2 s−1. Light quality also affected the mineral composition (Figure 2B). In our case, other parameter rather than R/B ratio influenced the mineral uptake or accumulation on spinach leaves. The R:FR ratio affects plant nutrition, assimilation, and allocation of nutrients in plants [44,45]. These authors observed that a reduced R:FR ratio can decrease leaf chlorophyll and increase the allocation of nutrients to the aerial parts. In our results, K concentration was higher at 10 R/B, with the most reduced R:FR ratio. And the Cu concentration had a positive correlation with the R/FR ratio, with the highest values obtained in the 2 R/B and 6 R/B treatments, and the lowest in the 5 R/B and 10 R/B ones. However, treatment 2 R/B showed the maximum S, P, Mg, Mn leaf content, while 5 R/B the lowest. These results were similar as those observed for the growth parameters, and this could be due to the green and UV light percentages in the 2 R/B treatments.
Nitrates are considered a limiting plant constituent for commercialization, since they are a source of carcinogenic nitrosamines. It should be noted that foliar nitrate contents in the spinach studied in the present experiment were within the limit of the European Community (Commission Regulation (EU) No. 1258/2011 amending Regulation (EC) No. 1881/2006 as regards to maximum levels for nitrates in foodstuffs). Especially for herbaceous species, nitrate may act as a vacuolar osmoticum, particularly at a low photon flux density, such as 150 μmol m–2 s–1, to maintain cell turgor when photosynthetic solutes are scarce [44,46]). The spinach leaf nitrate concentration decreased with the increase from Low to Medium intensity lights (Figure 2A), which matches the findings in the literature on nitrate-accumulating species [15,47]. However, but no further decreases were observed from Medium to High intensity. Light quality is a commonly used tool in indoor agriculture for nitrate control in plants. Red, far-red and the R/FR ratio, mediated by phytochromes, can affect both the activity and gene expression of the key enzymes of nitrogen metabolism [36,45]. When plants are supplemented with red light, the concentration of nitrate decreases, due to the stimulation of nitrate reductase activity, but when far-red wavelengths are used, the nitrate content drastically increases [34]. Thus, the R:FR ratio should also be considered, since a low R:FR ratio down-regulates nitrogen. The tendency found in our study (Figure 2B) has been reported by numerous authors in several commodities [46,47]. Several metabolic pathways are linked to nitrate content. In fact, groups of similar metabolites showed a coordinated response to light.
The results on chlorophyll fluorescence parameters indicated that the PSII in these spinach leaves had no detectable damage from 150 to 430 µmol m−2 s−1, nor photoinhibition (Table 2). The SPAD results revealed a higher chlorophyll content in high intensity-treated spinach, which can be correlated to an increase in production, as for Jatropha [48] and baby spinach [49]. Chlorophyll fluorescence parameters were slightly altered by the different light qualities used. The LED lights with a higher red/far red ratio were more efficient in the PSII functionalities. The results are in agreement with [50], and in studies with lettuce, red/far-red percentages in light is more photosynthetically active than commonly believed. In light quality parameters, SPAD parameters followed the decrease in the R:FR ratio, although no significant differences were found. A reduced R:FR ratio can decrease leaf duration by increasing the loss of chlorophyll and photosynthesis-related proteins [44].
The chemical composition of spinach depends on the age of the leaves, but the concentration of amino acids is controlled by the light provided [51]. The major amino acids were similar to those observed in the literature for spinach, with glutamate and glutamine being the dominant amino acids (Table 3), as observed by [51,52], followed by aspartate. The contents of the free amino acids under the different R/B ratios decreased to varying degrees, thereby causing the content of glutamate and aspartate of spinach to decrease. Glutamine foliar concentration did not show differences, but glutamate, and especially aspartate and asparagine concentration, were found to be affected by the light quality. Soluble asparagine and GABA not only accumulate in plant organs during low rates of protein synthesis, but also during stress-induced processes [32]. There was a tendency for the asparagine concentration to increase as the R/B ratio increased, as a response to the exposure to UV light. Several authors have described similar effects of the use of various blue light ratios on other leafy vegetable commodities. Blue light enhanced the activity of nitrate reductase (NR), nitrite reductase (NiR), glutamine synthetase (GS), and glutamate synthase (GOGAT) in pak choi [34]. On the contrary, adding FR significantly inhibited GOGAT activity in lettuce [35] and led to a significant reduction in total amino acid concentration in tatsoi leaves [33]. Interestingly, some acids such as ascorbate, acetate, and succinate (Table 4), and total concentrations of sugars (Table 4), showed a low concentration with HI light. Ref. [11] observed similar results for ascorbate and soluble sugars in spinach. Regarding light quality, 2 R/B-treated spinach, which presented a lower FR percentage and was the only one with UV, had a higher accumulation of citrate and succinate and total carbohydrates, with no differences with the 5 R/B treatment. The change in organic acid content was similar to the findings of [52] on spinach and [33] on lettuce. When spinach leaves were richer in nitrate (150 µmol·m−2·s−1, 5 R/B and 10 R/B), the concentration of glucose, fructose, and sucrose tended to be lower, as described in [31]. Likewise, a decrease in sugars and citric acid cycle intermediates leads to a general decrease in amino acids, as observed in these results [31]. No evidence of changes in antioxidant capacity was observed (Appendix A Table A1). The data are in accordance with [15], where hydroponically grown spinach did not increase the antioxidant concentration with a light intensity over 190 µmol m−2 s−1.
The multivariate analysis applied to spinach light intensity data indicates that the use of different intensities induces a modification in the spinach’s vegetative growth and composition, especially the chromatic characteristics (Figure 4, top). The results have shown that spinach growing under a higher light intensity have an increased fresh weight and reduced amino acid concentrations. On the other hand, this effect on spinach characteristics is not so clearly observed when multivariate statistics are applied to the data from the different light spectra treatments (Figure 4, bottom). This is probably due to the commercial lights with complex combinations of wavelengths that have been used in this work, whereas single wavelength lights or their combination are usually used for experiments [15,24].

5. Conclusions

Several physiological and biochemical aspects of spinach growth under artificial light can be modified by selecting specific light intensity and quality. Overall, spinach growth and quality were more influenced by light intensity (66%) rather than light quality (27%). The highest values of fresh weight, dry matter, and leaf area were obtained under the highest light intensity (430 µmol m−2 s−1) with the AP673L spectrum. Furthermore, this light intensity most efficiently reduced the concentration of nitrates in the leaf. However, it is important to consider that high light intensities entail higher energy costs. On the other hand, the light spectra with the higher R:B ratios (AP673L and G2) showed significantly superior values in all vegetative growth parameters. However, the effect of the R:B ratio is unclear, as the 2 R/B spectrum showed better vegetative growth values than the 5 R/B spectrum, perhaps due to its ultraviolet light component (1%). Additionally, the results obtained in this work indicate that light intensity significantly impacts the total concentration of primary metabolites in spinach. Specifically, an increase in metabolites was observed with an increase in light intensity to 290 µmol·m−2·s−1. Conversely, a notable reduction in metabolite concentration was observed when the intensity was further increased to 430 µmol·m−2·s−1 as compared to spinach grown under a 150 µmol·m−2·s−1 light intensity. The commercial spectra employed (AP67, AP673L, and G2) reduced the concentration of most metabolites analyzed, as compared to the commercial light spectrum NS12, the only one with a UV light component (1%). Furthermore, a direct relationship was detected in the accumulation of some nutrients and nitrate in spinach leaves with the R/FR ratio. Finally, while monochromatic lights at various ratios have been extensively studied, further research into the response of spinach under complex spectra is warranted to determine an optimal light spectrum for growth period, yield, nitrate concentration, and nutritional values. By understanding the response of spinach to light quality, a specific light spectrum could be described for indoor hydroponic spinach culture.

Author Contributions

Conceptualization, A.M.-M. and V.M.; methodology, A.M.-M.; software, A.M.-M.; validation, A.M.-M., A.F.-T. and V.M.; formal analysis, A.M.-M., H.D.-M. and A.F.-T.; investigation, A.M.-M., H.D.-M., and A.F.-T.; resources, A.M.-M.; data curation, A.M.-M. and A.F.-T.; writing—original draft preparation, A.M.-M. and H.D.-M.; writing—review and editing, A.M.-M. and H.D.-M.; visualization, H.D.-M. and A.M.-M.; supervision, H.D.-M., T.C.M. and V.M.; project administration, V.M. and T.C.M.; funding acquisition, V.M. and T.C.M. All authors have read and agreed to the published version of the manuscript.

Funding

This research was funded by Ministerio de ciencia e innovación, grant number CPP2021-009146.

Data Availability Statement

Data are contained within the article.

Conflicts of Interest

The authors declare no conflicts of interest. The funders had no role in the design of the study; in the collection, analyses, or interpretation of data; in the writing of the manuscript; or in the decision to publish the results.

Appendix A

Table A1. Antioxidant capacity and chlorophyll fluorescence parameter measurements in spinach plant under different light intensity and quality treatments.
Light TreatmentAntioxidant Capacity (%)Chlorophyll A Chlorophyll B Total ChlorophyllCarotenoids
Intensity
 LI 37.822.910.633.58.74
 MI 34.321.610.031.78.43
 HI 37.821.29.4430.68.61
  ANOVAnsnsnsnsns
Quality
 NS12 (2 R/B) 23.222.210.3 ab32.68.30
 AP67 (5 R/B)24.922.211.5 b33.88.43
 AP673L (6 R/B) 24.019.28.98 a28.17.32
 G2 (10 R/B)23.221.210.1 a31.38.09
  ANOVAnsns*nsns
Chlorophyll A, chlorophyll B, total chlorophyll, and carotenoids are measured in mg/100 g of fresh weight. In the ANOVA, ‘ns’ indicates non-significant differences with a confidence interval of 95%; * indicates significant differences at p < 0.05. Different lowercase letters indicate significant differences (p < 0.05) between the means, as established by Tukey’s test (n = 4).

References

  1. FAOSTAT. Food and Agriculture Organization of the United Nations Database. 2020. Available online: http://www.fao.org/faostat/en/#data/QC (accessed on 22 June 2022).
  2. Saini, R.K.; Nile, S.H.; Park, S.W. Carotenoids from fruits and vegetables: Chemistry, analysis, occurrence, bioavailability and biological activities. Food Res. Int. 2015, 76, 735–750. [Google Scholar] [CrossRef]
  3. Qin, J.; Shi, A.; Mou, B.; Grusak, M.A.; Weng, Y.; Ravelombola, W.; Yang, W. Genetic diversity and association mapping of mineral element concentrations in spinach leaves. BMC Genom. 2017, 18, 941. [Google Scholar] [CrossRef]
  4. Tai, C.; Sawada, Y.; Masuda, J.; Daimon, H.; Fukao, Y. Cultivation of spinach in hot seasons using a micro-mist-based temperature-control system. Sci. Hortic. 2020, 273, 109603. [Google Scholar] [CrossRef]
  5. Adeyeye, S.A.O.; Babu, A.S. Vegetables as a Functional Food for Health. In Functional Foods; CRC Press: Boca Raton, FL, USA, 2024; pp. 102–118. [Google Scholar]
  6. Qureshi, M.U.N.; Nadeem, M.U. Comparative study of Hydroponic and Geoponic Systems. Doctoral Dissertation, Department of Civil Engineering, Capital University of Science & Technology Islamabad, Islamabad, Pakistan, 2017. [Google Scholar]
  7. Ogli, A.Y.I.; Esirgapovich, J.A. Hydroponic Technology and its Advantages. Span. J. Innov. Integr. 2022, 6, 507–510. [Google Scholar]
  8. Khan, F.A.; Kurklu, A.; Ghafoor, A.; Ali, Q.; Umair, M.S. A review on hydroponic greenhouse cultivation for sustainable agriculture. Int. J. Agric. Environ. Food Sci. 2019, 2, 59–66. [Google Scholar] [CrossRef]
  9. Mir, M.S.; Naikoo, N.B.; Kanth, R.H.; Bahar, F.A.; Bhat, M.A.; Nazir, A.; Ahngar, T.A. Vertical farming: The future of agriculture: A review. Pharma Innov. J. 2022, 11, 1175–1195. [Google Scholar]
  10. Jan, S.; Rashid, Z.; Ahngar, T.A.; Iqbal, S.; Naikoo, M.A.; Majeed, S.; Nazir, I. Hydroponics—A review. Int. J. Curr. Microbiol. Appl. Sci. 2020, 9, 1779–1787. [Google Scholar] [CrossRef]
  11. Utasi, L.; Monostori, I.; Végh, B.; Pék, Z.; Éva, D. Effects of light intensity and spectral composition on the growth and metabolism of spinach (Spinacia oleracea L.). Acta Biol. Plantarum. Agriensis 2019, 7, 3–18. [Google Scholar]
  12. Rehman, M.; Ullah, S.; Bao, Y.; Wang, B.; Peng, D.; Liu, L. Light-emitting diodes: Whether an efficient source of light for indoor plants? Environ. Sci. Pollut. Res. 2017, 24, 24743–24752. [Google Scholar] [CrossRef]
  13. Flores, M.; Urrestarazu, M.; Amors, A.; Escalona, V. High intensity and red enriched LED lights increased growth of lettuce and endive. Ital. J. Agron. 2022, 25, 354–562. [Google Scholar] [CrossRef]
  14. Fan, X.; Zang, J.; Xu ZGuo, S.; Jiao, X.; Liu, Y.; Gao, Y. Effects of different light quality on growth, chlorophyll concentration and chlorophyll biosynthesis precursors of non-heading Chinese cabbage (Brassica campestris L.). Acta Physiol. Plant. 2013, 35, 2721–2726. [Google Scholar] [CrossRef]
  15. Nguyen, P.; Ngoc, T.; Huyen, T.; Quang, T.; Phi, B.; Il Seop, K.; Dong, J. Growth and Quality of Hydroponic Cultivated Spinach (Spinacia oleracea L.) Affected by the Light Intensity of Red and Blue LEDs. Sains Malays. 2022, 51, 473–483. [Google Scholar] [CrossRef]
  16. Najera, C.; Urrestarazu, M. Effect of the intensity and spectral quality of LED light on yield and nitrate accumulation in vegetables. HortScience 2019, 54, 1745–1750. [Google Scholar] [CrossRef]
  17. Harun, A.N.; Ahmad, R.; Mohamed, N. Plant growth optimization using variable intensity and Far Red LED treatment in indoor farming. In Proceedings of the International Conference on Smart Sensors and Application (ICSSA), Kuala Lumpur, Malaysia, 26–28 May 2015; pp. 92–97. [Google Scholar]
  18. Pennisi, G.; Pistillo, A.; Orsini, F.; Cellini, A.; Spinelli, F.; Nicola, S.; Marcelis, L.F. Optimal light intensity for sustainable water and energy use in indoor cultivation of lettuce and basil under red and blue LEDs. Sci. Hortic. 2020, 272, 109508. [Google Scholar] [CrossRef]
  19. Marcos, L.; Mai, K.V. Light spectra optimization in indoor plant growth for internet of things. In Proceedings of the IEEE International IOT, Electronics and Mechatronics Conference (IEMTRONICS), Vancouver, BC, Canada, 9–12 September 2020; pp. 1–6. [Google Scholar]
  20. Terashima, I.; Fujita, T.; Inoue, T.; Chow WSOguchi, R. Green light drives leaf photosynthesis more efficiently than red light in strong white light: Revisiting the enigmatic question of why leaves are green. Plant Cell Physiol. 2009, 50, 684–697. [Google Scholar] [CrossRef] [PubMed]
  21. Hao, X.; Zheng, J.M.; Little, C.; Khosla, S. LED inter-lighting in year-round greenhouse mini cucumber production. Acta Hortic. 2012, 956, 335–340. [Google Scholar] [CrossRef]
  22. Sabzalian, M.R.; Heydarizadeh, P.; Zahedi, M.; Boroomand, A.; Agharokh, M.; Sahba, M.R.; Schoefs, B. High performance of vegetables, flowers, and medicinal plants in a red-blue LED incubator for indoor plant production. Agron. Sustain. Dev. 2014, 34, 879–886. [Google Scholar] [CrossRef]
  23. Choi, H.G.; Moon, B.Y.; Kang, N.J. Effects of LED light on the production of strawberry during cultivation in a plastic greenhouse and in a growth chamber. Sci Hortic. 2015, 189, 22–31. [Google Scholar] [CrossRef]
  24. Bartucca, M.L.; Guiducci, M.; Falcinelli, B.; Del Buono, D.; Benincasa, P. Blue:Red LED light proportion affects vegetative parameters, pigment content, and oxidative status of einkorn (Triticum monococcum L. ssp. monococcum) wheatgrass. J. Agric. Food Chem. 2020, 68, 8757–8763. [Google Scholar] [CrossRef] [PubMed]
  25. Tosti, G.; Benincasa, P.; Cortona, R.; Falcinelli, B.; Farneselli, M.; Guiducci, M.; Onofri, A.; Pannacci, E.; Tei, F.; Giulietti, M. Growing lettuce under multispectral light-emitting diodes lamps with adjustable light intensity. Ital. J. Agron. 2018, 13, 57–62. [Google Scholar] [CrossRef]
  26. Yao, X.; Liu, X.; Xu, Z.; Jiao, X. Effects of light intensity on leaf microstructure and growth of rape seedlings cultivated under a combination of red and blue LEDs. J. Integr. Agric. 2017, 16, 97–105. [Google Scholar] [CrossRef]
  27. Koleva, I.I.; Van Beek, T.A.; Linssen, J.P.H.; De Groot, A.; Evstatieva, L.N. Screening of plant extracts for antioxidant activity: A comparative study on three testing methods. Phytochem. Anal. 2002, 13, 8–17. [Google Scholar] [CrossRef] [PubMed]
  28. Frutos-Totosa, A.; Hernández-Adasme, C.; Martínez, V.; Mestre, T.; Díaz-Mula, H.M.; Botella, M.A.; Flores, P.; Martínez-Moreno, A. Light spectrum effects on rocket and lamb’s lettuce cultivated in a vertical indoor farming system. Sci. Hortic. 2023, 321, 112221. [Google Scholar] [CrossRef]
  29. Lichtenthaler, H.K.; Buschmann, C.; Knapp, M. How to correctly determine the different chlorophyll fluorescence parameters and the chlorophyll fluorescence decrease ratio R Fd of leaves with the PAM fluorometer. Photosynthetica 2005, 43, 379–393. [Google Scholar] [CrossRef]
  30. Moing, A.; Maucourt, M.; Renaud, C.; Gaudillère, M.; Brouquisse, R.; Lebouteiller, B.; Gousset-Dupont, A.; Vidal, J.; Granot, D.; Denoyes-Rothan, B.; et al. Quantitative metabolic profiling by 1-dimensional 1H-NMR analyses: Application to plant genetics and functional genomics. Funct. Plant Biol. 2004, 31, 889–902. [Google Scholar] [CrossRef] [PubMed]
  31. Okazaki, K.; Oka, N.; Shinano, T.; Osaki, M.; Takebe, M. Differences in the Metabolite Profiles of Spinach (Spinacia oleracea L.) Leaf in Different Concentrations of Nitrate in the Culture Solution. Plant Cell Physiol. 2008, 49, 170–177. [Google Scholar] [CrossRef] [PubMed]
  32. Lea, P.J.; Sodek, L.; Parry, M.A.; Shewry, P.R.; Halford, N.G. Asparagine in Plants. Ann. Appl. Biol. 2007, 150, 1–26. [Google Scholar] [CrossRef]
  33. Viršilė, A.; Brazaitytė, A.; Vaštakaitė-Kairienė, V.; Jankauskienė, J.; Miliauskienė, J.; Samuolienė, G.; Duchovskis, P. Nitrate, nitrite, protein, amino acid contents, and photosynthetic and growth characteristics of tatsoi cultivated under various photon flux densities and spectral light compositions. Sci. Hortic. 2019, 258, 108781. [Google Scholar] [CrossRef]
  34. Fan, X.X.; Xue, F.; Song, B.; Chen, L.Z.; Xu, G.; Xu, H. Effects of Blue and Red Light on Growth and Nitrate Metabolism in Pakchoi. Open Chem. 2019, 17, 456–464. [Google Scholar] [CrossRef]
  35. Li, J.; Wu, T.; Huang, K.; Liu, Y.; Liu, M.; Wang, J. Effect of LED Spectrum on the Quality and Nitrogen Metabolism of Lettuce Under Recycled Hydroponics. Front. Plant Sci. 2021, 12, 678197. [Google Scholar] [CrossRef] [PubMed]
  36. Huché-Thélir, L.; Laurent, C.; José Le, G.; Philippe, M.; Soulaiman, S.; Nathalie, L. Light Signaling and Plant Responses to Blue and UV Radiations-Perspectives for Applications in Horticulture. Environ. Exp. Bot. 2016, 121, 22–38. [Google Scholar] [CrossRef]
  37. Voutsinos, O.; Maria, M.; Georgia, N.; Georgios, L.; Dimitrios, S. Comparative Assessment of Hydroponic Lettuce Production Either under Artificial Lighting, or in a Mediterranean Greenhouse during Wintertime. Agriculture 2021, 11, 503. [Google Scholar] [CrossRef]
  38. Zou, T.; Huang, C.; Wu, P.; Ge, L.; Xu, Y. Optimization of Artificial Light for Spinach Growth in Plant Factory Based on Orthogonal Test. Plants 2020, 9, 490. [Google Scholar] [CrossRef] [PubMed]
  39. Wong, C.E.; Teo, Z.W.N.; Shen, L.; Yu, H. Seeing the Lights for Leafy Greens in Indoor Vertical Farming. Trends Food Sci. Technol. 2020, 106, 48–63. [Google Scholar] [CrossRef]
  40. Schenkels, L.; Saeys, W.; Lauwers, A.; Maurice, P. Green light induces shade avoidance to alter plant morphology and increases biomass production in Ocimum basilicum L. Sci. Hortic. 2020, 261, 109002. [Google Scholar] [CrossRef]
  41. Grygoray, E.E.; Tabalenkova, G.N.; Dalke, I.V.; Golovko, T.K. Mineral nutrition and productivity of the greenhouse cucumber crop depending on lighting. Agrokhimiya 2015, 4, 74–79. [Google Scholar]
  42. Joniyas, A.; Surif, M.; Dehgahi, R. Effect of Nutrient and Light Intensity on Nutrient Uptakes of Gracilaria manilaensis. Int. J. Sci. Res. Environ. Sci. 2016, 4, 173–185. [Google Scholar] [CrossRef]
  43. Xu, J.; Guo, Z.; Jiang, X.; Ahammed, G.J.; Zhou, Y. Light regulation of horticultural crop nutrient uptake and utilization. Hortic. Plant J. 2021, 7, 367–379. [Google Scholar] [CrossRef]
  44. Demotes-Mainard, S.; Péron, T.; Corot, A.; Bertheloot, J.; Le Gourrierec, J.; Pelleschi-Travier, S.; Sakr, S. Plant responses to red and far-red lights, applications in horticulture. Environ. Exp. Bot. 2016, 121, 4–21. [Google Scholar] [CrossRef]
  45. Signore, A.; Bell, L.; Santamaria, P.; Wagstaff, C.; Van Labeke, M.C. Red Light Is Effective in Reducing Nitrate Concentration in Rocket by Increasing Nitrate Reductase Activity, and Contributes to Increased Total glucosinolate content. Front. Plant Sci. 2020, 11, 532456. [Google Scholar] [CrossRef]
  46. Bantis, F.; Fotelli, M.; Ilić, Z.S.; Koukounaras, A. Physiological and Phytochemical Responses of Spinach Baby Leaves Grown in a PFAL System with Leds and Saline Nutrient Solution. Agriculture 2020, 10, 574. [Google Scholar] [CrossRef]
  47. Dos Santos, C.M.; Verissimo, V.; de Lins Wanderley Filho, H.C.; Ferreira, V.M.; da Silva Cavalcante, P.G.; Rolim, E.V.; Endres, L. Seasonal variations of photosynthesis, gas exchange, quantum efficiency of photosystem II and biochemical responses of Jatropha curcas L. grown in semi-humid and semi-arid areas subject to water stress. Ind. Crops Prod. 2013, 41, 203–213. [Google Scholar] [CrossRef]
  48. Di Mola, I.; Cozzolino, E.; Ottaiano, L.; Nocerino, S.; Rouphael, Y.; Colla, G.; Mori, M. Nitrogen use and uptake efficiency and crop performance of baby spinach (Spinacia oleracea L.) and Lamb’s Lettuce (Valerianella locusta L.) grown under variable sub-optimal N regimes combined with plant-based biostimulant application. Agronomy 2020, 10, 278. [Google Scholar] [CrossRef]
  49. Zhen, S.; Haidekker, M.; van Iersel, M.W. Far-red light enhances photochemical efficiency in a wavelength-dependent manner. Physiol. Plant. 2019, 167, 21–33. [Google Scholar] [CrossRef] [PubMed]
  50. Lisiewska, Z.; Kmiecik, W.; Gębczyński, P.; Sobczyńska, L. Amino Acid Profile of Raw and As-Eaten Products of Spinach (Spinacia oleracea L.). Food Chem. 2011, 126, 460–465. [Google Scholar] [CrossRef]
  51. Carrillo, P.; Giuseppe, C.; Giovanna, M.F.; Emilia, D.; Christophe, E.N.; Maria, G.; Antonio, P.; Eugenio, C.; Mauro, M.; Hélène, R.; et al. Morphological and Physiological Responses Induced by Protein Hydrolysate-Based Biostimulant and Nitrogen Rates in Greenhouse Spinach. Agronomy 2019, 9, 450. [Google Scholar] [CrossRef]
  52. Nguyen, P.D.; Cheol, J.; Thi Thanh, H.; Quang Thach, N.; Il Seop, K.; Thi Lan Huong, H.; Ngoc, T. Influence of Green Light Added with Red and Blue Leds on the Growth, Leaf Microstructure and Quality of Spinach (Spinacia oleracea L.). Agronomy 2021, 11, 1724. [Google Scholar] [CrossRef]
Figure 1. Growth parameters of the spinach plants under different light intensity treatments (left) and under different light quality treatments (right). R/B: red/blue ratio. PPFD: photosynthetic photon flux density. Different letters indicate significant differences (p < 0.05) between the means, as established by Tukey test (n = 10).
Horticulturae 10 00411 g001
Figure 2. The relative concentration of macro and micronutrients quantified in leaves from spinach under different light intensity (A) and quality (B) treatments. The concentrations are expressed in percentages in relation to the treatment with the highest concentration of the element (100%). *, **, and *** indicate significant differences at p < 0.05, p < 0.01, and p < 0.001, respectively.
Horticulturae 10 00411 g002
Figure 3. Graphical representation of the fold change in the metabolites obtained in spinach leaves under different light treatments as compared to control treatments 2 R/B (left) and 150 µmol m−2 s−1 (right), which are considered as 0.
Horticulturae 10 00411 g003
Figure 4. Distribution of the different spinach samples under three light intensity (top) treatments in the plane defined by the two first principal components. (82.3%). Distribution of the different spinach samples under four light quality (2 R/B, 5 R/B, 6 R/B, 10 R/B) treatments (bottom) in the plane defined by the two first principal components. (39.7%).
Horticulturae 10 00411 g004
Table 1. Summary table of light quality and light intensity treatments applied on spinach.
TreatmentIntensity PPFD (µmol m−2 s−1)LED Grow LightsUV
<400
Blue
400–500
Green
500–600
Red
600–700
Far-Red
700–800
Light IntensityLI150AP673L (%)01019638
MI290AP673L (%)01019638
HI430AP673L (%)01019638
Light Quality2 R/B 150NS12 (%)12036385
5 R/B150AP67 (%)012165616
6 R/B 150AP673L (%)01019638
10 R/B150G2 (%)0727021
LI: low intensity; MI: medium intensity; HI: high intensity.
Table 2. Chlorophyll fluorescence parameters in spinach under different light intensity and quality treatments.
Light TreatmentФPSIIFv′/Fm′qPChlorophyll (SPAD)
Intensity
 LI 0.64 a0.770.83 a15.4 a
 MI 0.71 b0.790.90 b15.9 a
 HI 0.71 b0.770.91 b22.5 b
  ANOVA*ns******
Quality
 NS12 (2 R/B) 0.59 b0.73 b0.809.70
 AP67 (5 R/B)0.50 a0.69 a0.729.67
 AP673L (6 R/B) 0.60 b0.74 b0.8010.83
 G2 (10 R/B)0.48 a0.69 a0.699.81
  ANOVA**nsns
Chlorophyll fluorescence: quantum efficiency of PSII (ФPSII), antennae efficiency of PSII (Fv′/Fm′), photochemical quenching coefficient (qP). In the ANOVA, ‘ns’ indicates non-significant differences with a confidence interval of 95%; * and *** indicate significant differences at p < 0.05 and 0.001, respectively. Different lowercase letters indicate significant differences (p < 0.05) between the means, as established by Tukey’s test (n = 10).
Table 3. Concentration of amino acids (mg/g dw−1) detected and quantified by H-NMR in spinach plants growing under different light intensity and quality treatments.
TreatmentGlutamateGlutamineAspartateAsparagineAlanine4_Aminobutyrate (GABA)PhenylalanineTryptophan
Intensity
 LI 2.981.18 a1.370.35 c0.30 b0.47 a0.16 c0.06 a
 MI 2.811.45 b1.280.28 b0.39 c0.74 b0.13 b0.08 b
 HI 2.641.20 a1.280.19 a0.23 a0.42 a0.07 a0.05 a
  ANOVAns*ns*************
Quality
 NS12 (2 R/B) 5.36 b1.432.47 b0.98 c0.560.24 a0.29 b0.35 c
 AP67 (5 R/B)5.15 b1.652.27 b0.52 a0.540.33 bc0.21 a0.22 a
 AP673L (6 R/B) 3.66 a1.311.35 a0.61 ab0.440.41 c0.22 a0.25 ab
 G2 (10 R/B)4.87 ab1.342.07 ab0.76 b0.500.36 bc0.25 ab0.29 b
  ANOVA**ns******ns******
In the ANOVA, ‘ns’ indicates non-significant differences with a confidence interval of 95%; *, **, and *** indicate significant differences at p < 0.05, p < 0.01, and p < 0.001, respectively. Different lowercase letters indicate significant differences (p < 0.05) between the means, as established by Tukey’s test (n = 10).
Table 4. Concentration of organic acids and non-structural carbohydrates (mg/g dw−1) detected and quantified by H-NMR in spinach plants growing under different light intensity and quality treatments.
Organic AcidsNon-Structural Carbohydrates
TreatmentMalateCitrateAscorbateSuccinateAcetateFumarate2-OxoglutarateSucroseBetaineGlucoseFructoseMyo-InositolTotal
Carbohydrates
Intensity
 LI 4.542.941.30 b0.56 ab0.11 b0.10 a0.39 a9.69 c4.88 a3.16 a2.71 b1.0322.5 b
 MI 5.343.161.44 b0.61 b0.12 b0.14 b0.47 b8.08 b5.74 b4.28 b2.59 b0.9522.8 b
 HI 4.902.660.65 a0.48 a0.06 a0.09 a0.35 a5.63 a4.79 a3.77 ab2.10 a1.0418.2 a
   ANOVAnsns********************ns**
Quality
 NS12 (2 R/B) 4.373.29 c0.21 a0.57 b0.080.24 b0.37 a10.85 b8.17 b5.723.87 c0.83 a29.9 b
 AP67 (5 R/B)3.292.80 bc0.19 a0.49 ab0.060.23 b0.30 a10.56 b8.20 b4.532.19 a1.30 b28.6 b
 AP673L (6 R/B) 3.482.04 a0.58 b0.38 a0.070.17 a0.37 a7.29 a4.99 a5.833.36 bc0.94 a23.5a
 G2 (10 R/B)3.892.42 ab0.26 a0.49 ab0.070.20 ab0.47 b9.25 b7.77 b5.122.82 ab0.98 a27.6 b
   ANOVAns******ns***********ns*******
All parameters are expressed in mg/g dw−1. In the ANOVA, ‘ns’ indicates non-significant differences with a confidence interval of 95%; *, **, and *** indicate significant differences at p < 0.05, p < 0.01, and p < 0.001, respectively. Different lowercase letters indicate significant differences (p < 0.05) between the means, as established by Tukey’s test (n = 10).
Disclaimer/Publisher’s Note: The statements, opinions and data contained in all publications are solely those of the individual author(s) and contributor(s) and not of MDPI and/or the editor(s). MDPI and/or the editor(s) disclaim responsibility for any injury to people or property resulting from any ideas, methods, instructions or products referred to in the content.

