Article

Transcriptome and Pigment Analyses Provide Insights into Carotenoids and Flavonoids Biosynthesis in Camellia nitidissima Stamens

1
Key Laboratory of Tree Breeding of Zhejiang Province, Research Institute of Subtropical Forestry, Chinese Academy of Forestry, Hangzhou 311400, China
2
College of Forestry, Nanjing Forestry University, Nanjing 210037, China
3
College of Architecture, Anhui Science and Technology University, Bengbu 233000, China
*
Author to whom correspondence should be addressed.
These authors contributed equally to this work.
Horticulturae 2024, 10(4), 420; https://doi.org/10.3390/horticulturae10040420
Submission received: 28 February 2024 / Revised: 5 April 2024 / Accepted: 11 April 2024 / Published: 22 April 2024
(This article belongs to the Special Issue Cultivation and Breeding of Ornamental Plants)

Abstract

:
Camellia nitidissima is famous for its golden flowers. Its flowers are rich in secondary metabolites, and they have ornamental, medicinal, and edible value. Pigment composition and regulation has been studied in the golden petals, but there has been little research on pigment composition or the molecular mechanism underlying yellow stamens in C. nitidissima. To explore the molecular mechanism of yellow stamen formation, three developmental stages (S0, S1, and S2) were used for transcriptome and pigment analyses. Pigment analysis showed that the flavonoid content increased sharply from the S0 to S1 stage and decreased from the S1 to S2 stage, and the carotenoid content increased sharply during yellow stamen formation (from the S1 to S2 stage). RNA-seq analysis showed that a total of 20,483 differentially expressed genes (DEGs) were identified. KEGG and heatmap analyses showed that flavonoid and carotenoid biosynthesis pathways were enriched, and we identified 14 structural genes involved in flavonoid biosynthesis and 13 genes involved in carotenoid biosynthesis and degradation. In addition, the expression of carotenoid- and flavonoid-related genes was consistent with carotenoid and flavonoid content. In addition, correlation network analysis indicated that the WARYK, MYB, bHLH, and AP2/ERF transcription factor families were screened for involvement in the biosynthesis of flavonoids and carotenoids. In this study, we describe the pathway associated with color formation in the stamens of C. nitidissima.

1. Introduction

Flower color is a key ornamental trait of ornamental plants and an important evaluation indicator of the quality and value of flowers [1]. The number of Camellia species and varieties has exceeded 20,000, but its flower colors are mainly red, and yellow flower varieties are rare, accounting for less than 1% [2]. Camellia nitidissima is a rare and prized species of the genus Camellia, known for its unique golden flower color, honored as “giant panda in the plant world”, “the queen of camellias”, and “national treasure divine tea” [3,4], and listed as a national second-class protected plant in China because it possesses high ornamental worth and great economic value. In addition, the flowers of C. nitidissima are rich in natural active ingredients, such as flavonoids, saponins, and polysaccharides, which have a variety of physiological activities, including antioxidant, anti-aging, lipid-lowering, and blood pressure-lowering effects [5,6,7,8], and have huge economic value in medical care and food production. Therefore, C. nitidissima is a precious species integrating ornamental, medicinal, and edible functions, as well as acting as a valuable resource for molecular mechanism research of yellow flower formation and yellow camellia breeding [5,9].
The color of a plant flower is determined by the type and content of pigments and is also influenced by multiple factors, such as pH value, metal ions, etc. [10,11,12]. Plant flower pigments are mainly composed of flavonoids, carotenoids, and betalains [13]. Flavonoids are the largest pigment group widely present in plants and are the determining factor for the formation of most plant flower colors [14]. They can endow plants with different colors, such as red, purple, blue, and yellow [15,16]. Carotenoids are terpene compounds that contain α-carotenoids, β-carotenoids, and other substances. They are distributed in various parts of plants, such as flowers, fruits, and roots, making them appear yellow, orange, or red [13]. Betalains belong to the derivative compounds of tyrosine and are only present in a few families, such as Jasmonaceae, Amaranthaceae, and Cyperaceae [17].
Flavonoids are synthesized through the phenylpropanoid pathway, and more than 9000 flavonoids have been identified in plants [14]. The biosynthesis of flavonoids begins with phenylalanine, which is converted to coumaroyl-CoA through phenylalanine ammonia lyase (PAL), cinnamic acid 4-hydroxylase (C4H), and 4-coumarate: CoA ligase (4CL) [18]. Dihydroflavonols, which include dihydrokaempferol (DHK), dihydroquercetin (DHQ) and dihydromyricetin (DHM), are generated from coumaroyl-CoA under the catalysis of chalcone synthase (CHS), chalcone isomerase (CHI), flavanone 3-hydroxylase (F3H), flavanone 3′-hydroxylase (F3′H), and flavanone 3′5′-hydroxylase (F3′5′H) [19]. Dihydroflavonols are the key intermediate metabolites in flavonoid biosynthesis and can be converted to flavonols through the activity of flavonol synthase (FLS) [20]. In addition, anthocyanin and proanthocyanidin can be generated from dihydroflavonols by dihydroflavonol 4-reductase (DFR), leucoanthocyanidin reductase (LAR), anthocyanidin synthase (ANS), and anthocyanidin reductase (ANR) [21].
Geranylgeranylpyrophosphate (GGPP) is a direct precursor for carotenoid biosynthesis [13]. GGPP generates lycopene through the activity of phytoene synthase (PSY), phytoene desaturase (PDS), ζ-carotenoid isomerase (Z-ISO), ζ-carotene desaturase (ZDS), and carotenoid isomerase (CRTISO) [11]. Lycopene is an important intermediate product in the biosynthesis of carotenoids. Lycopene β-cyclase (LCYB) catalyzes the formation of β-carotene from lycopene through cyclization at the end. In addition, α-carotene also is produced from lycopene by the action of lycopene ε-cyclase (LCYE) and LCYB [22]. Furthermore, α-carotene and β-carotene can be converted to other carotenoid compounds through the activity of enzymes, such as β-hydroxylase (CHYB), ε-hydroxylase (CHYE), zeaxanthin epoxidase (ZEP), violaxanthin deepoxidase (VDE), neoxanthin synthase (NSY) [13,23].
In the flowers of C. nitidissima, both the petals and stamens are yellow. The chemical compositions and molecular mechanisms of the entire flower and/or petals have been reported [9,24,25], but our understanding of the pigments in the stamens and their associated molecular mechanisms is still unclear. Therefore, we selected three stages during which stamen color changes as study materials, and flavonoid and carotenoid content analysis and transcriptome sequencing were carried out to identify the potential pathways and the yellow color-related genes in the stamens of C. nitidissima.

2. Materials and Methods

2.1. Plant Materials and Determination of Pigment Contents

The C. nitidissima stamens were from the Camellia Germplasm Resources of Institute of the Subtropical Forest, Chinese Academy of Forestry (Hangzhou, Zhejiang province). Plants had been grown in the field and were approximately 15 years old. Petals were harvested at three different developmental stages (Figure 1a), including the early bud stage (S0), mid-bud stage (S1), and late bud stage (S2). Samples were immediately frozen in liquid nitrogen and stored at −80 °C for subsequent analysis. Carotenoid and flavonoid content were measured using a Plant Carotenoid Content Assay Kit and a Plant Flavonoid Content Assay Kit from Beijing Solarbio Science (Beijing, China). Each experiment was repeated three times.

2.2. RNA-Seq Analysis

Total RNA was extracted from the stamens of C. nitidissima using an RNA Prep Pure kit for plants (Majorbio, Shanghai, China) and used to construct the cDNA library. Sequencing was performed using an Illumina NovaSeq 6000. Reads containing adapters and N bases and low-quality reads were removed from the raw data, and the Q20, Q30, and GC content of the clean data were calculated. All downstream analyses were based on clean, high-quality data. Trinity software (v2.6.6) was used to assemble clean reads for a reference sequence, and BUSCO software (v5.7.0) was used to evaluate the splicing quality.
Gene function was annotated using the following databases: NCBI nonredundant protein sequences (Nr); NCBI nonredundant nucleotide sequences (Nt); protein family (Pfam); clusters of orthologous groups of proteins (KOG/COG); Swiss-Prot (a manually annotated and reviewed protein sequence database); KEGG ortholog database (KO); and GO. Differential expression analysis for two groups was performed using the DESeq2 R package (1.20.0), with padj < 0.05 and |log2(foldchange)| > 1 as the threshold for significant differential expression.

2.3. Interaction Network and Cluster Heatmap Analysis

An interaction network was established based on Pearson correlation coefficients, which were calculated in R (https://www.r-project.org/, accessed on 29 January 2024). Correlations with a coefficient 1 ≥ |cor.value:R| ≥ 0.9 and p ≤ 0.01 were retained. Connections between candidate genes and transcription factor (TF) genes were visualized using Cytoscape (v. 3.1.0) to select hub TF families as candidate genes for correlation heatmap analysis. Similarly, a cluster heatmap analysis was constructed based on Pearson’s correlation coefficients. A high correlation (|R| = 1, ***) was observed, indicating a strong correlation between the structural genes and TF genes.

2.4. Transcriptome Data Were Validated Using Quantitative Real-Time PCR (qRT-PCR)

To validate the reproducibility of the transcriptome data, eight differentially expressed genes (DEGs) were selected for qRT-PCR analysis. All gene-specific primers were designed using NCBI online (Supplementary Table S1), and CnGAPDH was used as the internal normalization gene. The relative gene expression levels were calculated using the 2−∆∆CT method. The qRT-PCR was carried out as described previously [26].

2.5. Statistical Analysis

Statistical analyses were carried out using SPSS (v25) software (SPSS Inc., Chicago, IL, USA). All experiments were repeated with at least three biological replicates and analyzed statistically using Student’s t-test (* p < 0.05, ** p < 0.01). Error bars represent the ±SE.

3. Results

3.1. Stamen Phenotype and Pigment Content Analysis

Color and size changed significantly in C. nitidissima stamens over the three stages (S0–S2), as shown in Figure 1a. Initially, the anthers appeared a nearly transparent, pale, yellow green during the early bud stage (S0). In stage S1, the flower bud anthers turned golden yellow. In stage S2, they became yellow orange. From stage S0 to stage S2, the anther tightness gradually decreased, and stamen filaments elongated.
To explore pigment differences in C. nitidissima stamens, the flavonoid and carotenoid contents were analyzed. Total flavonoid content increased significantly from the S0 to the S1 stage and decreased sharply from the S1 to the S2 stage (Figure 1b). The carotenoid content was not significantly different between the S0 stage and the S1 stage, but it increased significantly from the S1 to the S2 stage (Figure 1c).

3.2. Overview of Transcriptome Sequencing and Functional Annotation of Unigenes

To investigate the molecular mechanisms underlying formation of yellow color in C. nitidissima stamens, RNA-sequencing (RNA-seq) of stamens in the S0, S1, and S2 stages was performed. A correlation analysis showed that samples from the same period were highly correlated (Supplementary Figure S1). This demonstrates that our sample selection is reasonable and that the transcriptome data are reliable.
In addition, the results of RNA-seq showed that 21,563,33–23,129,446 clean reads were obtained, with a Q20 value of 96.26–96.54%, a Q30 value of 90.4–91.41%, and a GC content of 44.11–44.85% (Supplementary Table S2), which indicated that the overall sequencing was of high quality. Based on clean reads, 78,997 unigenes were assembled with an average length of 1124 bp and an N50 of 1752 bp (Supplementary Table S3). To annotate the functions of these unigenes, their sequences were submitted to seven functional databases (KEGG, NR, Swiss-Prot, GO, COG/KOG, Trembl, and Pfam) to search for annotations. The number of annotated unigenes in the seven databases ranged from 6600 to 40,252, corresponding to annotation percentages of 8.35% to 50.95% (Supplementary Table S4).

3.3. Identification and Analysis of DEGs

An analysis of differentially expressed genes (DEGs) was performed based on fragments per kilobase of transcript per million mapped reads (FPKM) values and required a threshold false discovery rate (FDR) < 0.05 |log2FoldChange| > 1. A total of 20,483 DEGs were identified between the S0 and S2 stages, with 11,003 DEGs upregulated and 9480 DEGs downregulated. Between the S0 and S1 stages, 6646 DEGs were identified, with 3870 DEGs upregulated and 2776 DEGs downregulated. Between the S1 and S2 stages, 17,370 DEGs were identified, with 9201 DEGs upregulated and 8106 DEGs downregulated (Figure 2a). Figure 2a–c demonstrates that the S1–S2 stages have a higher number of DEGs compared to the S0–S1 stages. A total of 27,304 DEGs were enriched into GO terms and statistically annotated into two aspects, biological process, and molecular function (Figure 2d–f), using the terms “oxidoreductase activity”, “transport”, and “small molecule metabolic process”. The KEGG main pathway terms were “metabolic pathways”, “phenylpropanoid biosynthesis”, and “biosynthesis of secondary metabolites” (Figure 2g–i). Among these, 1103 DEGs in the S1–S2 stages were annotated in “metabolic pathways”, and 585 DEGs were annotated in “biosynthesis of secondary metabolites”.

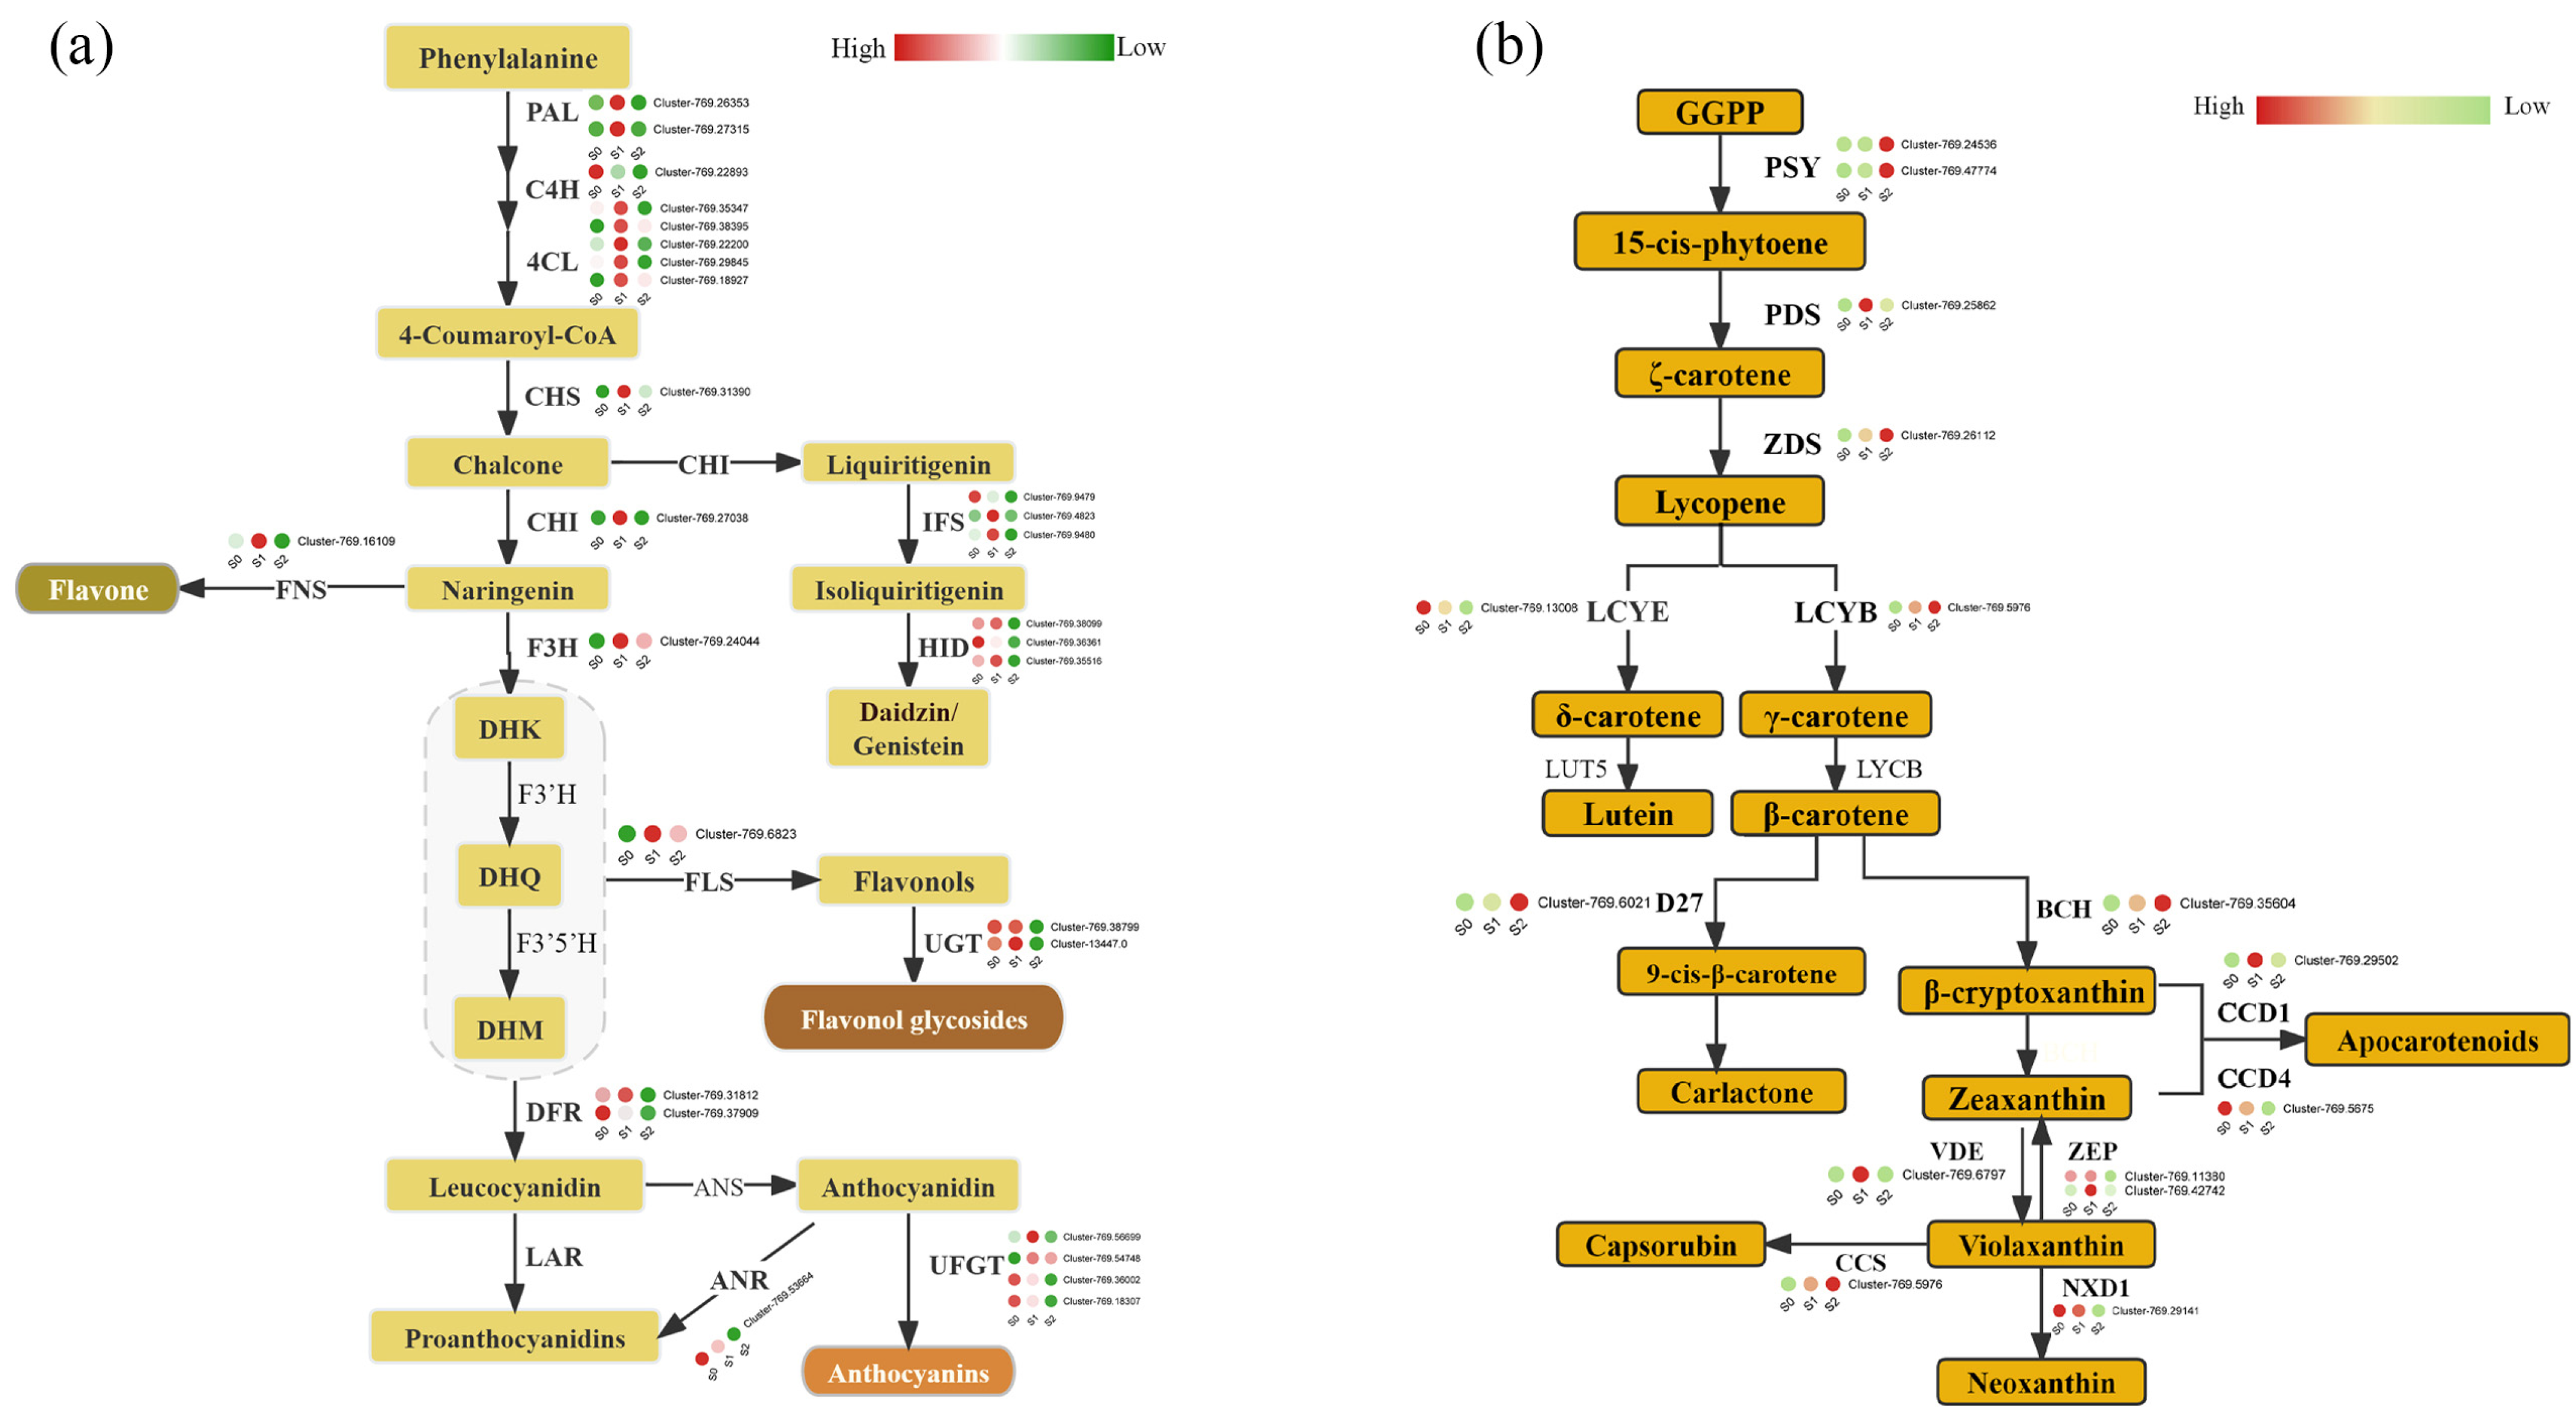
3.4. Flavonoid and Carotenoid Biosynthesis in C. nitidissima Stamens

A heatmap of the expression levels of genes enriched in “oxidoreductase activity” in the three stages showed that more DEGs involved in antioxidant function were upregulated in the S1–S2 stages relative to the S0–S1 stages (Supplementary Figure S2). This shows that the S1–S2 stages are the critical period when the stamens of C. nitidissima exert their antioxidant function. Further analysis showed that many of these DEGs were also enriched in the “Ko00906: carotenoid biosynthetic” pathway or the “Ko00941: flavonoid biosynthetic” pathway. Next, we identified the structural genes that participate in these two biosynthetic pathways (carotenoid biosynthesis and flavonoid biosynthesis) and mapped the pathways in C. nitidissima stamens.
We screened flavonoid structural genes that might play a key role and mapped the flavonoid biosynthetic pathway in C. nitidissima stamens (Figure 3a), which included three secondary metabolic flavonoid biosynthetic pathways (flavone biosynthesis, flavonol biosynthesis, and anthocyanin biosynthesis). Most of the early structural genes (CHS, CHI, FNS, F3H, FLS, and UGT) were significantly upregulated in the S1 stage and downregulated in the S2 stage. Late structural genes (DFR: Cluster-769.31812, ANR, and UFGT) showed the same expression pattern as early structural genes except for one transcript (Cluster-769.37909) of DFR. The results revealed that 16 genes were involved in the biosynthesis and metabolism of carotenoids, including PSY, PDS, ZDS, LCYB, LCYE, BCH, D27, CCD, ZEP, VDE, and NXD1 (Figure 3b). Key genes in carotenoid biosynthesis (PSY, ZDS, LCYB, D27, BCH, and CCS) continued to be upregulated in the S0–S2 stages, and the expression of LCYE, CCD4, and NXD1 was upregulated.

3.5. Identification of Transcription Factors

Based on GO and KEGG enrichment, flavonoid structural genes were used to find 266 transcription factors (TFs) (|cor.value:R| ≥ 0.9, p ≤ 0.01) and construct a correlation network (Figure 4a) to screen for critical TFs that regulate flavonoid synthesis. The MYB, WRKY, bHLH, and AP2/ERF family members showed stronger correlations than other gene families. Subsequently, we drew a correlation heatmap (0 ≤ |R| ≤ 0.9, p < 0.05) between four gene family members and flavonoid structural genes (Figure 4b). Our analysis showed that APETALA2-like with UGT (Cluster-769.38799), MYB105-like with HID (Cluster-769.35516), and bHLH80 with UFGT (Cluster-769.18307) had strong positive correlations (R = 1, ***).
Similarly, a correlation network analysis was performed for 12 structural genes involved in carotenoid synthesis and metabolism pathways with TFs (Figure 4c). Like the flavonoid structural genes, these 12 structural genes showed strong correlations with MYB, WRKY, bHLH, and AP2/ERF gene family members. In a correlation heatmap between four gene family members and carotenoid structural genes (Figure 4d); remarkably, AP2/EREBP was strongly associated (R = 1, ***) with all 16 structural genes, suggesting that AP2/EREBP plays a crucial role in regulating the synthesis and metabolism of carotenoids. In addition, there was a strong positive correlation between MYB44-like and ZEP (Cluster-769.11380) and a strong negative correlation between bHLH162-like and PSY (Cluster-769.47774).

3.6. qRT-PCR Analysis

To further validate the above results, eight DEGs were selected for quantitative real-time PCR (qRT-PCR) verification. The results showed that the relative expression was basically consistent with the FPKM values from the RNA-seq heatmap data (Figure 5), thus verifying the reliability of the transcriptome data.

4. Discussion

C. nitidissima is known for its unique yellow flower color in camellia, including yellow petals and stamens. The pigment content of yellow flowers and/or petals has been studied in C. nitidissima [24,25]. During the development of flowers, flavonoids (quercetin and kaempferol) showed a trend of first increasing and then decreasing, while carotenoids (neoxanthin, violaxanthin, xanthophyll and α–carotene) continued to increase [24]. The study showed that the flowers (included petals and stamens) of C. nitidissima contained flavonoids and carotenoids [24]. Previously, our research team found that the main pigment component in the yellow petals was flavanols, a class of flavonoids, while the content of carotenoids was extremely low [27]. However, the pigment changes in yellow stamens are still unknown. Therefore, in this study, we detected the pigment content of flavonoids and carotenoids in the stamens of C. nitidissima. The results suggested that flavonoids decreased sharply, and carotenoid increased significantly from the S1 to the S2 stage (Figure 1b,c). Flavonoids and carotenoids can both make plants appear yellow [13]. Thus, it can be concluded that carotenoids may be the key pigments responsible for yellow color in the stamens, while the main pigment in petals is flavonoids [9,25,27].
Carotenoids are an important pigment component in plants and play important roles in various regulatory processes, such as flower color formation and stress resistance [23]. The biosynthetic pathway of carotenoids has been elucidated in plants [22]. Lycopene, a key intermediate product in carotenoids biosynthesis, was synthesized under the action of ZDS [28]. One ZDS gene (Cluster-769.26112) was identified in this study, and it was upregulated gradually during the S0–S2 stages, which was consistent with carotene accumulation. The function of LCYB is to cyclase the lycopene [29]. There is a direct link between the synthesis and accumulation of β-cryptoxanthin and the expression of BCH [30]. D27 β-carotene isomerase is highly specific to the C9-C10 double bond and catalyzes the conversion of all-trans into 9-cis-β-carotene [31]. The expression of the LCYB, BCH, and D27 genes also increased gradually from the S0 to S2 stage (Figure 3b). These results suggest that β-carotene and β-cryptoxanthin might be the primary carotenoids in C. nitidissima stamens. We also identified transcription factor gene families involved in carotenoid biosynthesis (Figure 4c,d). In Arabidopsis, RAP2.2 (in the AP2/ERF transcription factor gene family) can bind specifically to the promoter of PSY to inhibit the expression of PSY, thereby reducing carotenoid accumulation [32]. AP2/EREBP had a strong negative correlation with PSY in this study (Cluster-769.24536, Cluster-769.47774). In addition to PSY, AP2/EREBP is closely associated with other key carotenoid enzyme genes. Therefore, AP2/EREBP may play a crucial role in regulating carotenoid biosynthesis and metabolism pathways in C. nitidissima stamens.
Research has shown that the flavonoid biosynthesis pathway in plants is conserved; phenylalanine, the precursor, is converted to p-coumaroyl-CoA by phenylalanine ammonia lyase [33], cinnamic acid 4-hydroxylase (C4H), and 4-coumarate via CoA ligase (4CL) [14]. Chalcone synthase (CHS) is the first rate-limiting enzyme in flavonoid biosynthesis [34]. In this study, a CHS transcript (Cluster-769.31390) was identified (Figure 3a), and its expression was consistent with flavonoid content (Figure 1b). Cluster heatmap analysis showed that CHS (Cluster-769.31390) had a strong positive correlation with bHLH035 (Figure 4b). Additionally, bHLH80 had a strong positive correlation with UFGT (Cluster-769.18307). The bHLH with MYB and WD40 forms the MYB–bHLH–WDR (MBW) complex, which is known to regulate flavonoid biosynthesis in Arabidopsis [35], Vitis vinifera [36], and Petunia [37]. We identified members of the MYB gene family that have strong correlations with flavonoid structural genes, including MYB114-like, MYB105-like, and MYB5d (Figure 4b). RrMYB5 interacts with the bHLH protein EGL3 and synergistically activates the promoters of DFR, ANR, and LAR, which upregulate anthocyanin synthetic genes in R. rugosa [38]. It remains to be seen whether bHLH in C. nitidissima stamens also forms a complex with MYB to regulate the transcription of flavonoid structural genes. In addition to the MYB and bHLH family members, we observed a strong correlation between some members of the AP2/ERF and WRKY gene families and flavonoid structural genes. For example, APETALA (AP2) had a strong positive correlation with UGT (Cluster-769.38799), but ERF098-like had a negative correlation with UGT (Cluster-769.38799). This suggests that APETALA and ERF098-like may have contrasting effects on flavonoid biosynthesis. PH3, a homolog of WRKY, is regulated by the PH4–AN1–AN11 MBW complex, ultimately resulting in the acidification of the vacuole as a means of flower color [39,40]. LhWRKY44 positively regulates anthocyanin accumulation by binding to the promoters of the LhF3H gene and intracellular anthocyanin-related glutathione S-transferase gene LhGST [41]. In this study, WRKY31 and WRKY41 were strongly positively correlated with UFGT (Cluster-769.54748) and UGT (Cluster-13447.0), respectively (Figure 3a), which implies that WRKY also plays an important role in the regulatory network of stamen flavonoid biosynthesis in C. nitidissima.
In conclusion, during the development of C. nitidissima stamens, the color changes from light yellow green (S0) to yellow (S1), and then to orange yellow in the S2 period. Pigments analysis showed that flavonoid decreased sharply, and carotenoid increased significantly during the formation of yellow stamens, suggesting that carotenoids may be the key pigments responsible for yellow color in the stamens. RNA-seq analysis showed that the expression of carotenoid- and flavonoid-related genes were consistent with pigment (carotenoids and flavonoids) content. At the same time, we also revealed potential transcription factors that regulate carotenoid and flavonoid biosynthesis. However, the regulatory mechanisms of these transcription factors require further research. This study provides insight into the molecular mechanism of yellow stamen formation in C. nitidissima, laying the foundation for genetic breeding of C. nitidissima.

Supplementary Materials

The following supporting information can be downloaded at: https://www.mdpi.com/article/10.3390/horticulturae10040420/s1, Supplementary Table S1. Primer sequences for RT-qPCR. Supplementary Table S2. Transcriptome analysis of C. nitidissima stamens in three stages. Supplementary Table S3. Summary for the transcriptome assembly of C. nitidissima stamens. Supplementary Table S4. Uinigene annotation. Supplementary Figure S1. Clustering heatmap of samples. Supplementary Figure S2. A heatmap showing DEGs enriched in “oxidoreductase activity” during the S0–S2 stages.

Author Contributions

Y.F. and K.Z.: Investigation, formal analysis, writing—original draft, J.L.: Funding acquisition. M.W.: Investigation. H.Y.: Writing—review and editing. Z.F.: Visualization. X.L.: Validation. W.L.: Conceptualization, formal analysis, writing—review and editing. All authors have read and agreed to the published version of the manuscript.

Funding

This work was funded by Zhejiang Provincial Natural Science Foundation of China (LQ23C150005), Fundamental Research Funds of CAF (CAFYBB2023MB005), Introduction of Talent Projects of Anhui Science and Technology University (JZYJ202201), Natural Science Foundation of Zhejiang Province (Q22C158467), and Science and Technology Key Program of Jinhua (Grant no. 2022-2-033).

Data Availability Statement

Data supporting reported results can be requested by contacting the corresponding author. The data are not publicly available due to compliance with data protection regulations.

Conflicts of Interest

The authors declare no conflicts of interest.

References

  1. Yoshida, K.; Oyama, K.I.; Kondo, T. Insight into chemical mechanisms of sepal color development and variation in hydrangea. Proc. Jpn. Acad. Ser. B Phys. Biol. Sci. 2021, 97, 51–68. [Google Scholar] [CrossRef] [PubMed]
  2. Guan, K.; Li, J.; Wang, Z. Camellias of China; Zhejiang Science and Technology Publishing House: Hangzhou, China, 2014; pp. 395–406. [Google Scholar]
  3. Wu, H.; Huang, Q.; Li, S.; Qin, X.; Zhong, S.; Chen, J. Component analysis and anti-inflammatory activity of active ingredients from Camellia nitidissima Chi flowers. Food Ferment. Ind. 2024, 1–9. [Google Scholar] [CrossRef]
  4. He, D.; Li, X.; Sai, X.; Wang, L.; Li, S.; Xu, Y. Camellia nitidissima C.W. Chi: A review of botany, chemistry, and pharmacology. Phytochem. Rev. 2017, 17, 327–349. [Google Scholar] [CrossRef]
  5. Zhang, H.L.; Wu, Q.X.; Qin, X.M. Camellia nitidissima Chi flower extract alleviates obesity and related complications and modulates gut microbiota composition in rats with high-fat-diet-induced obesity. J. Sci. Food Agric. 2020, 100, 4378–4389. [Google Scholar] [CrossRef] [PubMed]
  6. Peng, X.; Yu, D.Y.; Feng, B.M.; Wang, Y.Q.; Shi, L.Y. A new acylated flavonoid glycoside from the flowers of Camellia nitidissima and its effect on the induction of apoptosis in human lymphoma U937 cells. J. Asian Nat. Prod. Res. 2012, 14, 799–804. [Google Scholar] [CrossRef] [PubMed]
  7. Dai, L.; Li, J.-L.; Liang, X.-Q.; Li, L.; Feng, Y.; Liu, H.-Z.; Wei, W.-E.; Ning, S.-F.; Zhang, L.-T. Flowers of Camellia nitidissima cause growth inhibition, cell-cycle dysregulation and apoptosis in a human esophageal squamous cell carcinoma cell line. Mol. Med. Rep. 2016, 14, 1117–1122. [Google Scholar] [CrossRef] [PubMed]
  8. Yang, R.; Wang, W.-X.; Chen, H.-J.; He, Z.-C.; Jia, A.-Q. The inhibition of advanced glycation end-products by five fractions and three main flavonoids from Camellia nitidissima Chi flowers. J. Food Drug Anal. 2018, 26, 252–259. [Google Scholar] [CrossRef]
  9. Liu, W.; Yu, S.; Feng, Y.; Mo, R.; Wang, K.; Fan, M.; Fan, Z.; Yin, H.; Li, J.; Li, X. Comparative Transcriptome and Pigment Analyses Reveal Changes in Gene Expression Associated with Flavonol Metabolism in Yellow Camellia. Forests 2022, 13, 1094. [Google Scholar] [CrossRef]
  10. Yoshida, K.; Mori, M.; Kondo, T. Blue flower color development by anthocyanins: From chemical structure to cell physiology. Nat. Prod. Rep. 2009, 26, 884–915. [Google Scholar] [CrossRef]
  11. Grotewold, E. The genetics and biochemistry of floral pigments. Annu. Rev. Plant Biol. 2006, 57, 761–780. [Google Scholar] [CrossRef]
  12. Lepiniec, L.; Debeaujon, I.; Routaboul, J.M.; Baudry, A.; Pourcel, L.; Nesi, N.; Caboche, M. Genetics and biochemistry of seed flavonoids. Annu. Rev. Plant Biol. 2006, 57, 405–430. [Google Scholar] [CrossRef]
  13. Tanaka, Y.; Sasaki, N.; Ohmiya, A. Biosynthesis of plant pigments: Anthocyanins, betalains and carotenoids. Plant J. 2008, 54, 733–749. [Google Scholar] [CrossRef]
  14. Liu, W.; Feng, Y.; Yu, S.; Fan, Z.; Li, X.; Li, J.; Yin, H. The Flavonoid Biosynthesis Network in Plants. Int. J. Mol. Sci. 2021, 22, 12824. [Google Scholar] [CrossRef]
  15. Noda, N. Recent advances in the research and development of blue flowers. Breed. Sci. 2018, 68, 79–87. [Google Scholar] [CrossRef]
  16. Nabavi, S.M.; Šamec, D.; Tomczyk, M.; Milella, L.; Russo, D.; Habtemariam, S.; Suntar, I.; Rastrelli, L.; Daglia, M.; Xiao, J.; et al. Flavonoid biosynthetic pathways in plants: Versatile targets for metabolic engineering. Biotechnol. Adv. 2018, 38, 107316. [Google Scholar] [CrossRef] [PubMed]
  17. Gandía-Herrero, F.; García-Carmona, F. Biosynthesis of betalains: Yellow and violet plant pigments. Trends Plant Sci. 2013, 18, 334–343. [Google Scholar] [CrossRef] [PubMed]
  18. Wohl, J.; Petersen, M. Functional expression and characterization of cinnamic acid 4-hydroxylase from the hornwort Anthoceros agrestis in Physcomitrella patens. Plant Cell Rep. 2020, 39, 597–607. [Google Scholar] [CrossRef]
  19. Nakatsuka, T.; Sasaki, N.; Nishihara, M. Transcriptional regulators of flavonoid biosynthesis and their application to flower color modification in Japanese gentians. Plant Biotechnol. 2014, 31, 389–399. [Google Scholar] [CrossRef]
  20. Jiang, X.; Shi, Y.; Fu, Z.; Li, W.W.; Lai, S.; Wu, Y.; Wang, Y.; Liu, Y.; Gao, L.; Xia, T. Functional characterization of three flavonol synthase genes from Camellia sinensis: Roles in flavonol accumulation. Plant Sci. 2020, 300, 110632. [Google Scholar] [CrossRef]
  21. Giampieri, F.; Gasparrini, M.; Forbes-Hernandez, T.Y.; Mazzoni, L.; Capocasa, F.; Sabbadini, S.; Alvarez-Suarez, J.M.; Afrin, S.; Rosati, C.; Pandolfini, T.; et al. Overexpression of the Anthocyanidin Synthase (ANS) Gene in Strawberry Enhances Antioxidant Capacity and Cytotoxic Effects on Human Hepatic Cancer Cells. J. Agric. Food Chem. 2018, 66, 581–592. [Google Scholar] [CrossRef]
  22. Morelli, L.; Rodriguez-Concepcion, M. Open avenues for carotenoid biofortification of plant tissues. Plant Commun. 2023, 4, 100466. [Google Scholar] [CrossRef] [PubMed]
  23. Lu, C.; Li, Y.; Wang, J.; Qu, J.; Chen, Y.; Chen, X.; Huang, H.; Dai, S. Flower color classification and correlation between color space values with pigments in potted multiflora chrysanthemum. Sci. Hortic. 2021, 283, 110082. [Google Scholar] [CrossRef]
  24. Zhou, X.; Li, J.; Zhu, Y.; Ni, S.; Chen, J.; Feng, X.; Zhang, Y.; Li, S.; Zhu, H.; Wen, Y. De novo Assembly of the Camellia nitidissima Transcriptome Reveals Key Genes of Flower Pigment Biosynthesis. Front. Plant Sci. 2017, 8, 1545. [Google Scholar] [CrossRef] [PubMed]
  25. Liu, H.; Liu, Q.; Chen, Y.; Zhu, Y.; Zhou, X.; Li, B. Full-length transcriptome sequencing provides insights into flavonoid biosynthesis in Camellia nitidissima Petals. Gene 2023, 850, 146924. [Google Scholar] [CrossRef]
  26. Yu, S.; Li, J.; Peng, T.; Ni, S.; Feng, Y.; Wang, Q.; Wang, M.; Chu, X.; Fan, Z.; Li, X.; et al. Identification of Chalcone Isomerase Family Genes and Roles of CnCHI4 in Flavonoid Metabolism in Camellia nitidissima. Biomolecules 2023, 13, 41. [Google Scholar] [CrossRef] [PubMed]
  27. Jiang, L. Study on Flower Color Formation Metabolism Mechanism and Key Genes Function of Camellia nitidissima. Ph.D. Thesis, Chinese Academy of Forestry, Beijing, China, 2020. [Google Scholar]
  28. McQuinn, R.P.; Gapper, N.E.; Gray, A.G.; Zhong, S.; Tohge, T.; Fei, Z.; Fernie, A.R.; Giovannoni, J.J. Manipulation of ZDS in tomato exposes carotenoid- and ABA-specific effects on fruit development and ripening. Plant Biotechnol. J. 2020, 18, 2210–2224. [Google Scholar] [CrossRef] [PubMed]
  29. Lu, S.; Zhang, Y.; Zheng, X.; Zhu, K.; Xu, Q.; Deng, X. Molecular characterization, critical amino acid identification, and promoter analysis of a lycopene β-cyclase gene from citrus. Tree Genet. Genomes 2016, 12, 106. [Google Scholar] [CrossRef]
  30. Hadjipieri, M.; Georgiadou, E.C.; Marin, A.; Diaz-Mula, H.M.; Goulas, V.; Fotopoulos, V.; Tomás-Barberán, F.A.; Manganaris, G.A. Metabolic and transcriptional elucidation of the carotenoid biosynthesis pathway in peel and flesh tissue of loquat fruit during on-tree development. BMC Plant Biol. 2017, 17, 102. [Google Scholar] [CrossRef] [PubMed]
  31. Abuauf, H.; Haider, I.; Jia, K.-P.; Ablazov, A.; Mi, J.; Blilou, I.; Al-Babili, S. The Arabidopsis DWARF27 gene encodes an all-trans-/9-cis-β-carotene isomerase and is induced by auxin, abscisic acid and phosphate deficiency. Plant Sci. 2018, 277, 33–42. [Google Scholar] [CrossRef]
  32. Hinz, M.; Wilson, I.W.; Yang, J.; Buerstenbinder, K.; Llewellyn, D.; Dennis, E.S.; Sauter, M.; Dolferus, R. ArabidopsisRAP2.2: An Ethylene Response Transcription Factor That Is Important for Hypoxia Survival. Plant Physiol. 2010, 153, 757–772. [Google Scholar] [CrossRef]
  33. Palozza, P. Can β-carotene regulate cell growth by a redox mechanism? An answer from cultured cells. Biochim. Biophys. Acta (BBA)-Mol. Basis Dis. 2005, 1740, 215–221. [Google Scholar] [CrossRef] [PubMed]
  34. Deng, X.; Bashandy, H.; Ainasoja, M.; Kontturi, J.; Pietiainen, M.; Laitinen, R.A.E.; Albert, V.A.; Valkonen, J.P.T.; Elomaa, P.; Teeri, T.H. Functional diversification of duplicated chalcone synthase genes in anthocyanin biosynthesis of Gerbera hybrida. New Phytol. 2014, 201, 1469–1483. [Google Scholar] [CrossRef] [PubMed]
  35. Bailey, P.C.; Martin, C.; Toledo-Ortiz, G.; Quail, P.H.; Huq, E.; Heim, M.A.; Jakoby, M.; Werber, M.; Weisshaar, B. Update on the Basic Helix-Loop-Helix Transcription Factor Gene Family in Arabidopsis thaliana. Plant Cell 2003, 15, 2497–2502. [Google Scholar] [CrossRef]
  36. Hichri, I.; Deluc, L.; Barrieu, F.; Bogs, J.; Mahjoub, A. A single amino acid change within the R2 domain of the VvMYB5b transcription factor modulates affinity for protein partners and target promoters selectivity. BMC Plant Biol. 2011, 11, 117. [Google Scholar] [CrossRef] [PubMed]
  37. Spelt, C.; Quattrocchio, F.; Mol, J.N.M.; Koes, R. Anthocyanin1 of petunia encodes a basic helixloop-helix protein that directly activates transcription of structural anthocyanin genes. Plant Cell 2000, 12, 1619–1631. [Google Scholar] [CrossRef] [PubMed]
  38. Shen, Y.; Sun, T.; Pan, Q.; Anupol, N.; Chen, H.; Shi, J.; Liu, F.; Deqiang, D.; Wang, C.; Zhao, J.; et al. RrMYB5- and RrMYB10-regulated flavonoid biosynthesis plays a pivotal role in feedback loop responding to wounding and oxidation in Rosa rugosa. Plant Biotechnol. J. 2019, 17, 2078–2095. [Google Scholar] [CrossRef]
  39. Verweij, W.; Spelt, C.E.; Bliek, M.; de Vries, M.; Wit, N.; Faraco, M.; Koes, R.; Quattrocchio, F.M. Functionally Similar WRKY Proteins Regulate Vacuolar Acidification in Petunia and Hair Development in Arabidopsis. Plant Cell 2016, 28, 786–803. [Google Scholar] [CrossRef] [PubMed]
  40. Lloyd, A.; Brockman, A.; Aguirre, L.; Campbell, A.; Bean, A.; Cantero, A.; Gonzalez, A. Advances in the MYB-bHLH-WD Repeat (MBW) Pigment Regulatory Model: Addition of a WRKY Factor and Co-option of an Anthocyanin MYB for Betalain Regulation. Plant Cell Physiol. 2017, 58, 1431–1441. [Google Scholar] [CrossRef]
  41. Bi, M.; Liang, R.; Wang, J.; Qu, Y.; Liu, X.; Cao, Y.; He, G.; Yang, Y.; Yang, P.; Xu, L.; et al. Multifaceted roles of LhWRKY44 in promoting anthocyanin accumulation in Asiatic hybrid lilies (Lilium spp.). Hortic. Res. 2023, 10, uhad167. [Google Scholar] [CrossRef]
Figure 1. Developmental stages of stamens and pigment analysis. (a) Stamen color differs in stages S0–S2. (b) Content analysis of flavonoid. (c) Content analysis of carotene. Statistical significance was determined using Student’s t-test (* p < 0.05, *** p < 0.01).
Horticulturae 10 00420 g001
Figure 2. Transcriptome analysis for C. nitidissima stamens. (a) Counts of differentially expressed genes (DEGs). Venn diagrams showing DEGs in C. nitidissima stamens (b,c). GO enrichment analysis of DEGs (df). KEGG pathway enrichment of DEGs (gi). Statistical significance was determined using Student’s t-test (* p < 0.05).
Horticulturae 10 00420 g002
Figure 3. Flavonoid and carotenoid gene pathways. (a) Expression of flavonoid biosynthesis genes. The enzyme names and flavonoid compounds are abbreviated as follows: PAL, phenylalanine ammonia lyase; C4H, cinnamic acid 4-hydroxylase; 4CL, 4-coumarate: CoA ligase; CHS, chalcone synthase; CHI, chalcone isomerase; FNS, flavone synthase; IFS, isoflavone synthase; HID, 2-hydroxyisoflavanone dehydratase; F3H, flavanone 3-hydroxylase; F3′H: flavonoid 3′-hydroxylase; F3′ 5′H, flavanone 3′,5′-hydroxylase; FLS, flavonol synthase; DFR, dihydroflavonol 4-reductase; ANS, anthocyanidin synthase; UFGT, UDP-glucose flavonoid 3-O glucosyltransferase; LAR, leucoanthocyanidin reductase; ANR, anthocyanidin reductase; DHK, dihydrokaempferol; DHQ, dihydroquercetin; DHM, dihydromyricetin. (b) Expression of carotenoid biosynthesis genes. The enzyme names as follows: PSY, phytoene synthase; PDS, phytoene desaturase; ZDS, ζ-carotene desaturase; LYCB, lycopene β-cyclase; LYCE, lycopene ε-cyclase; BCH, non-heme carotene hydroxylases; VDE, violaxanthin de-epoxidase; ZEP, zeaxanthin epoxidase; CCD, carotenoid cleavage dioxygenases; CCS: lycopene β-cyclase; D27, β-carotene isomerase D27. The expression levels of the genes were Log2(Foldchange) transformed.
Horticulturae 10 00420 g003
Figure 4. Correlation analyses. (a) Network of correlation coefficients of transcription factor families with flavonoid structural genes. (b) Heatmap visualization of correlation coefficients of transcription factors with flavonoid structural genes. (c) Network of correlation coefficients of transcription factor families with carotenoid structural genes. (d) Heatmap visualization of correlation coefficients of transcription factors with carotenoid structural genes. Statistical significance was determined using Student’s t-test (* p < 0.05; ** p < 0.01, *** p < 0.001).
Horticulturae 10 00420 g004
Figure 5. qRT-PCR verification of eight genes. Histograms show the relative expression of qRT-PCR validated genes, and the heatmap shows the RNA-seq data.
Horticulturae 10 00420 g005
Disclaimer/Publisher’s Note: The statements, opinions and data contained in all publications are solely those of the individual author(s) and contributor(s) and not of MDPI and/or the editor(s). MDPI and/or the editor(s) disclaim responsibility for any injury to people or property resulting from any ideas, methods, instructions or products referred to in the content.

