Article

The Effect of Biotic Stress in Plant Species Induced by ‘Candidatus Phytoplasma solani’—An Artificial Neural Network Approach

by
Ivica Djalovic
1,*,
Petar Mitrovic
1,
Goran Trivan
2,
Aleksandra Jelušić
2,
Lato Pezo
3,
Elizabet Janić Hajnal
4 and
Tatjana Popović Milovanović
5
1
Institute of Field and Vegetable Crops, National Institute of the Republic of Serbia, 21101 Novi Sad, Serbia
2
Institute for Multidisciplinary Research, University of Belgrade, 11030 Belgrade, Serbia
3
Institute of General and Physical Chemistry, Studentski trg 12/V, 11000 Belgrade, Serbia
4
Institute of Food Technology, University of Novi Sad, Bulevar Cara Lazara 1, 21000 Novi Sad, Serbia
5
Institute for Plant Protection and Environment, Teodora Drajzera 9, 11040 Belgrade, Serbia
*
Author to whom correspondence should be addressed.
Horticulturae 2024, 10(5), 426; https://doi.org/10.3390/horticulturae10050426
Submission received: 4 April 2024 / Revised: 17 April 2024 / Accepted: 18 April 2024 / Published: 23 April 2024
(This article belongs to the Special Issue The Diagnosis, Management, and Epidemiology of Plant Diseases)

Abstract

:
Infections with phytoplasma present one of the most significant biotic stresses influencing plant health, growth, and production. The phytoplasma ‘Candidatus Phytoplasma solani’ infects a variety of plant species. This pathogen impacts the physiological and morphological characteristics of plants causing stunting, yellowing, leaf curling, and other symptoms that can lead to significant economic losses. The aim of this study was to determine biochemical changes in peony (Paeonia tenuifolia L.), mint (Mentha × piperita L.), and dill (Anethum graveolens L.) induced by ‘Ca. Phytoplasma solani’ in Serbia as well as to predict the impact of the biotic stress using artificial neural network (ANN) modeling. The phylogenetic position of the Serbian ‘Ca. Phytoplasma solani’ strains originated from the tested hosts using 16S rRNA (peony and carrot strains) and plsC (mint and dill strains) sequences indicated by their genetic homogeneity despite the host of origin. Biochemical parameters significantly differed in asymptomatic and symptomatic plants, except for total anthocyanidins contents in dill and the capacity of peony and mint extracts to neutralize superoxide anions and hydroxyl radicals, respectively. Principal Component Analysis (PCA) showed a correlation between different chemical parameters and revealed a clear separation among the samples. Based on the ANN performance, the optimal number of hidden neurons for the calculation of TS, RG, PAL, LP, NBT, OH, TP, TT, Tflav, Tpro, Tant, DPPH, and Car was nine (using MLP 8-9-13), as it produced high r2 values (1.000 during the training period) and low SOS values. Developing an effective early warning system for the detection of plant diseases in different plant species is critical for improving crop yield and quality.

1. Introduction

Plants undergo a wide range of biotic and abiotic stresses that limit their proper growth [1]. Biotic stress in plants is caused by living organisms, including fungi, bacteria, phytoplasma, viruses, nematodes, insects, and weeds, causing diseases or damage [2]. Specific ion channels and kinase cascades and reactive oxygen species (ROS), as well as phytohormones (e.g., abscisic acid, salicylic acid, jasmonic acid, and ethylene), are activated in plants following exposure to stress [3]. Phytoplasmas are plant pathogenic bacteria belonging to the class Mollicutes. They lack cell walls and exclusively inhabit the nutrient-rich phloem tissue of plants [4]. Diseases caused by phytoplasmas pose a threat to agricultural production by leading to substantial losses in yield and the quality of plants. More than 600 diverse diseases have been reported worldwide, mainly on vegetable crops belonging to the families Apiaceae, Asteraceae, Cucurbitaceae, Fabaceae, and Solanaceae [5,6,7,8]. The symptoms of diseases caused by phytoplasmas include yellowing or reddening of leaves, phyllody, stunting, virescence, shortened internodes, big bud, little leaf, witches’ broom or proliferation, leaf curl, giant calyx, floral malformation, and vascular discoloration [7,9]. Phytoplasmas are transmitted from plant to plant by phloem-feeding insect vectors, and they propagate within the cytoplasm of both insects and plants. Phytoplasma attack causes various changes in terms of physiological, biochemical, and metabolic pathways [4,5,7,10,11]. For example, phytoplasma infections have been known to decrease chlorophyll synthesis [5,12] and protein content or to increase peroxidase activity [11]. Our previous studies [5,7] indicated biochemical changes in common evening-primrose (Oenothera biennis L.) and carrot (Daucus carota L.) resulting from infection by ‘Candidatus Phytoplasma solani’. Changes in O. biennis resulted in a significant increase in the peroxidation of lipids, phenylalanine ammonia-lyase activity, total sugars, polyphenols, and anthocyanins content, along with a decrease in photosynthetic pigments and total flavonoids [5]. The oxidative damage of membranes in carrot cells was accompanied by a decrease in the content of photosynthetic pigments, as well as a pronounced reduction in the level of glutathione (GSH) content. Conceivably, anthocyanidins were responsible for the enhanced antioxidative capacity [7].
Artificial neural networks (ANNs) have found applications in diverse domains for forecasting outcomes of intricate systems by processing input data. ANNs belong to a class of machine learning algorithms capable of learning from data and predicting results with precision and dependability, such as identifying plant diseases. ANNs have exhibited remarkable potential in predicting biotic stress in plants resulting from diverse pathogens, enabling real-time plant health monitoring and offering a pre-emptive alert mechanism for farmers, agronomists, and researchers to forestall disease outbreaks.
The present study aimed to determine biochemical changes induced by ‘Ca. Phytoplasma solani’ in the three latest host plants identified in Serbia, including peony (Paeonia tenuifolia L.), mint (Mentha × piperita L.), and dill (Anethum graveolens L.), and to utilize these findings to construct an artificial neural network (ANN) model in order to predict the impact of the biotic stress in these particular plant species.

2. Materials and Methods

2.1. Plant Material

Experiments performed in this study were conceived for three plant species, i.e., P. tenuifolia, Mentha × piperita, and A. graveolens with externally visible disease symptoms caused by ’Ca. Phytoplasma solani’ (Figure 1) [13,14,15]. Plants of each species with symptoms (S–symptomatic) and without symptoms (A–asymptomatic) were collected from Bački Petrovac (45°21′38″ N 19°35′30″ E) in the Bačka region of Vojvodina, Serbia, at the “full-bloom” phenophase. The study field belongs to the Institute of Field and Vegetable Crops, National Institute of the Republic of Serbia (Novi Sad, Serbia), for the purpose of reproduction and maintenance of seed collection.
A minimum of thirty plants of each tested species (per fifteen randomly selected asymptomatic and symptomatic plants) were collected at the growing sites. One part of the collected leaves (two per taken plant) was immersed in liquid nitrogen and further stored under −20 °C, while the other part was dried at ambient temperature in a well-ventilated place. Previously published results of biochemical changes in D. carota plants infected with ’Ca. Phytoplasma solani’ (Figure 1) in Serbia were used for the comparison in all assays [7].

2.2. Phylogenetic Position of the Tested Serbian ‘Ca. Phytoplasma solani’ Strains

Phylogenetic analysis was performed to check the position of the five Serbian ‘Ca. Phytoplasma solani’ strains originating from the same A. graveolens, P. tenuifolia, Mentha × piperita, and D. carota plants as those used for biochemical analysis, in relation to Phytoplasma spp. strains from different hosts and countries. Two separate phylogenetic trees were constructed based on the previously published sequences of the Serbian strains of interest. The first Neighbor-Joining (NJ) phylogenetic tree was constructed based on the 16S rRNA sequences for the three Serbian ‘Ca. Phytoplasma solani’ strains originating from P. tenuifolia (B15 and B18) [14] and D. carota (ML_NS-2016) [7], as well as with 23 comparative Phytoplasma spp. strains belonging to different 16Sr groups (Table 1) retrieved from the GenBank database. The tree was rooted with Acholeplasma laidlawii strain NCTC10116 (Table 1).
The second NJ phylogenetic tree was constructed based on the plsC gene (1-acyl-sn-glycerol-3-phosphate acyltransferase) sequences with the remaining two Serbian ‘Ca. Phytoplasma solani’ strains of interest, originating from A. graveolens (STOL2) [13] and Mentha × piperita (STOL3) [15], and 13 comparative Phytoplasma spp. strains from different hosts and countries (Table 2), which were also from GenBank. This tree was rooted with Acholeplasma laidlawii strain DSM 23060 (Table 2).
Before the construction of each phylogenetic tree, sequences of all strains were aligned to the same size (710 nt for 16S rRNA; 399 nt for plsC) in the BioEdit v.7.0 program using the ClustalW Multiple alignment function. Trees were constructed in Mega7 software, using the bootstrap value of 1000. The Kimura two-parameter nucleotide substitution model was used to compute genetic distances [14].

2.3. Biochemical Analyses of Peony, Mint, Dill, and Carrot Infected by ‘Ca. Phytoplasma solani’

Biochemical analysis includes the determination of parameters related to total sugars (TS), reduced glutathione (GSH), lipid peroxidation intensity (LP), phenylalanine ammonia-lyase (PAL) activity, photosynthetic pigments (total chlorophyll a and b and carotenoids), total polyphenolics (TP) and polyphenolic groups (Tflav-flavonoids, TT-tannins, Tpro-proanthocyanidins, Tant-anthocyanidins), and antioxidant capacity. All methods stated were explained in great detail within their respective references, as well as in our previous papers [7,16]. Total sugars (TS), or precisely, total carbohydrate content expressed as mg glucose equivalents/g fresh weight (fw), were determined from aqueous extracts with sulfuric acid–UV method [15]. Reduced glutathione (GSH) [17] and lipid peroxidation intensity (LP) [18] were determined from trichloroacetic acid extracts (5 and 20%, respectively), while 0.05 M sodium borate buffer was used for phenylalanine ammonia-lyase (PAL) activity [19]. These parameters were expressed as μmol GSH/g fw, nmol MDA equivalents/g fw, and U/g fw for GSH, LP, and PAL, respectively. Photosynthetic pigments (total chlorophyll a and b and carotenoids) were extracted with 80% acetone, as determined by the Von Wettstein (1957) [20] method and expressed as mg/g dry weight (dw). Total polyphenolics (TP) and polyphenolic groups (Tflav-flavonoids, TT-tannins, Tpro-proanthocyanidins, Tant-anthocyanidins) and antioxidant tests were extracted with an acidified methanolic solution (MeOH:H2O:CH3COOH, 140:50:10). All total polyphenolic groups were expressed as mg/g dw and determined by methods explained in detail in following references: TP, TT, and TPro in Makkar (2003) [21] and TFlav in Pękal and Pyrzynska (2014) [22] and Tant by Lee et al. (2005) [23]. Antioxidant capacity was determined through three antioxidant tests, including NBT, OH, and DPPH, by testing the scavenging of 1.1-diphenyl-2-picrylhydrazyl free radicals, superoxide anions (O2), and hydroxyl radicals (OH), respectively. Inhibition (%) of these reactive species in comparison to the control was determined according to Panda (2012) [24], Ahmed (2013) [25], and Sánchez-Moreno (2002) [26], respectively.

2.4. Principal Component Analysis (PCA)

Principal Component Analysis (PCA) is a statistical method commonly used in exploratory data analysis [27] to identify patterns and relationships within a dataset. The transformation is based on the eigenvalue decomposition of a data correlation matrix [28], which ensures that the first principal component captures the highest possible variance in the data. This technique can reveal spatial relationships among processing parameters and facilitate the identification of underlying patterns within complex datasets.

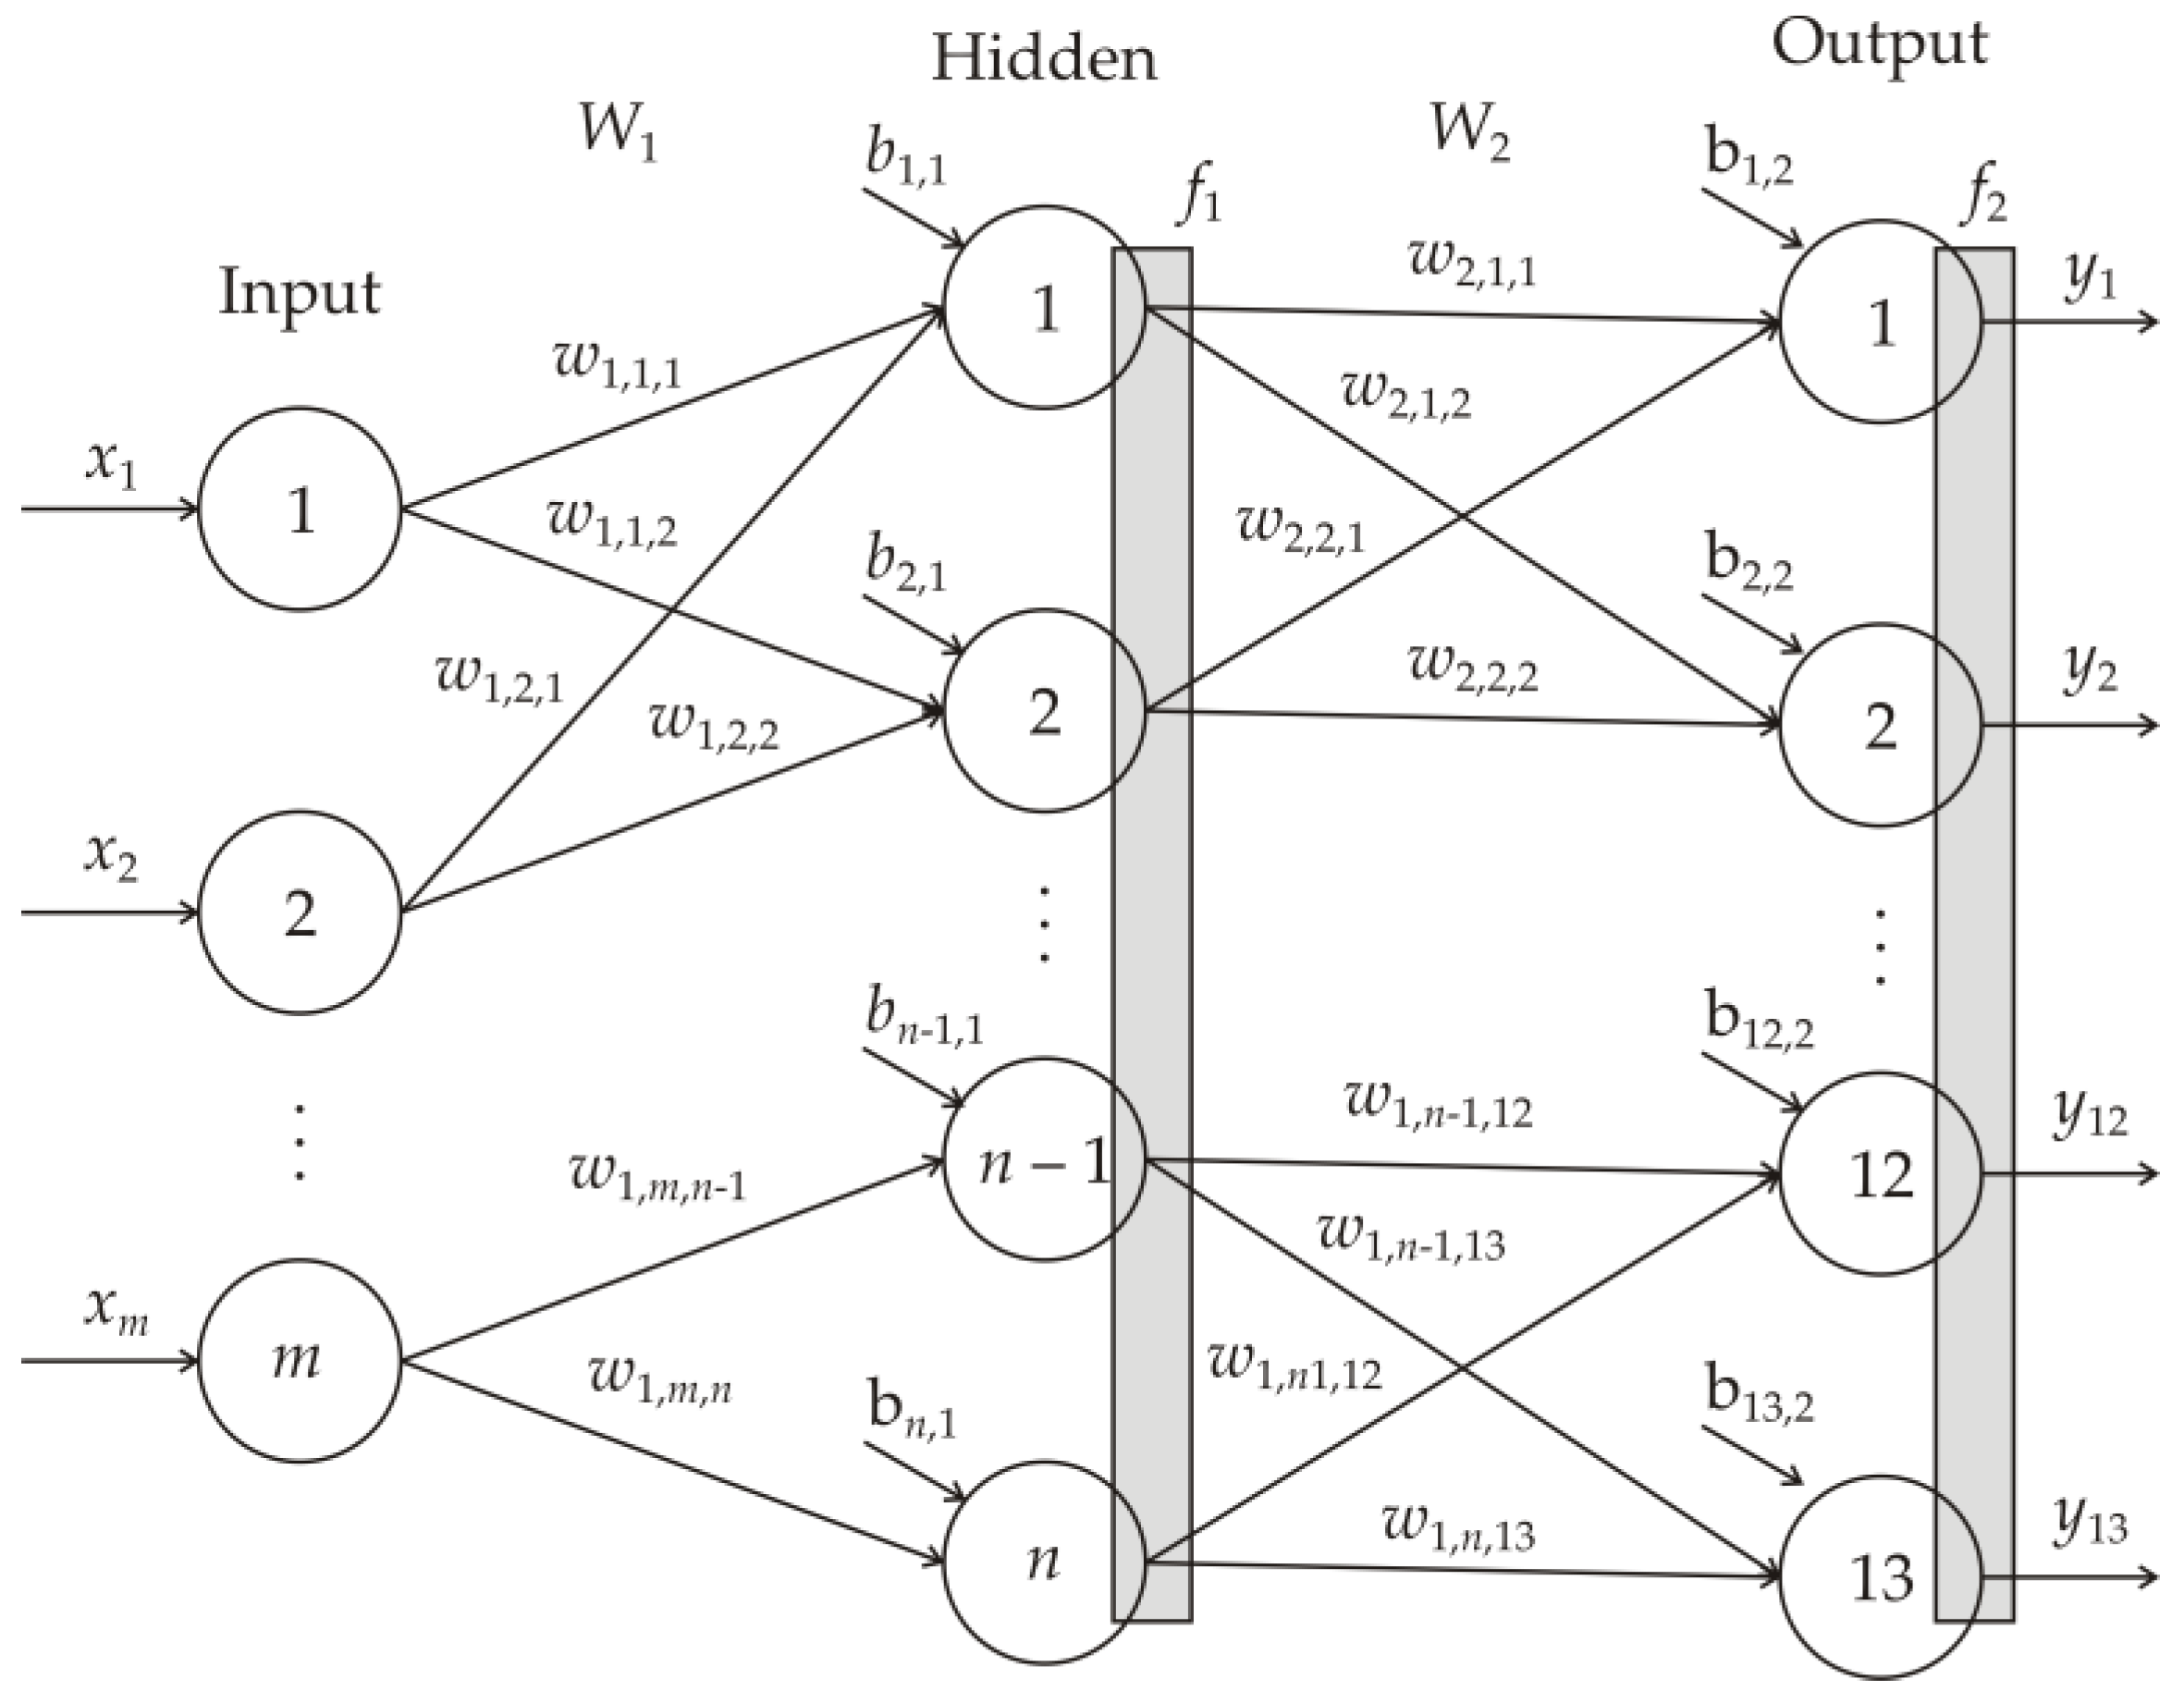
2.5. Artificial Neural Network (ANN) Modeling

During the training cycle for artificial neural network (ANN) modeling, all input and output data were normalized to improve the network’s behavior. The optimal number of hidden layers and neurons in each layer was determined through trial and error to achieve good performance. A multi-layer perceptron (MLP) model with three layers (input, hidden, and output) was chosen for this study, as it is known to be effective at approximating nonlinear functions [29]. In this study, the optimal number of hidden neurons was found to be ten. The ANN scheme is presented in Figure 2. The Broyden–Fletcher–Goldfarb–Shanno (BFGS) algorithm was used for ANN modeling, and the training process was repeated multiple times to achieve the best performance considering parameter variability. Successful training was determined when the learning and cross-validation curves (Sum of Squares vs. training cycles) approached zero. The ANN was tested using the best weights obtained during the training step, and the coefficient of determination (r2) and Sum of Squares (SOS) were used to evaluate the performance (i.e., accuracy) of the ANN. Artificial neural networks show high performance in predicting TS, RG, PAL, LP, TP, TT, Tflav, Tpro, Tant, NBT, OH, DPPH, Tcha, Tchb, and Car by calculating weight coefficients and biases with respect to characteristic input parameters (logical variables including plant type and treatment) [30,31]. The basic equation (Equation (1)) for calculating the output data of artificial neural networks is as follows:
Y = f 1 ( W 2 · f 2 ( W 1 · X + B 1 ) + B 2 )
where Y represents the output value, f1 and f2 represent the transfer function in the hidden and output layer, and X represents the matrix of the input layer [30].

2.6. Global Sensitivity Analysis

Yoon’s global sensitivity equation was used to calculate the relative impact of the input parameters on the output variables, according to the weight coefficients of the developed ANN models [32,33]:
R I i j ( % ) = k = 0 n ( w i k · w k j ) i = 0 m | k = 0 n ( w i k · w k j ) | · 100 %
where w—weight coefficient in the ANN model, i—input variable, j—output variable, k—hidden neuron, n—number of hidden neurons, and m—number of inputs.

3. Results

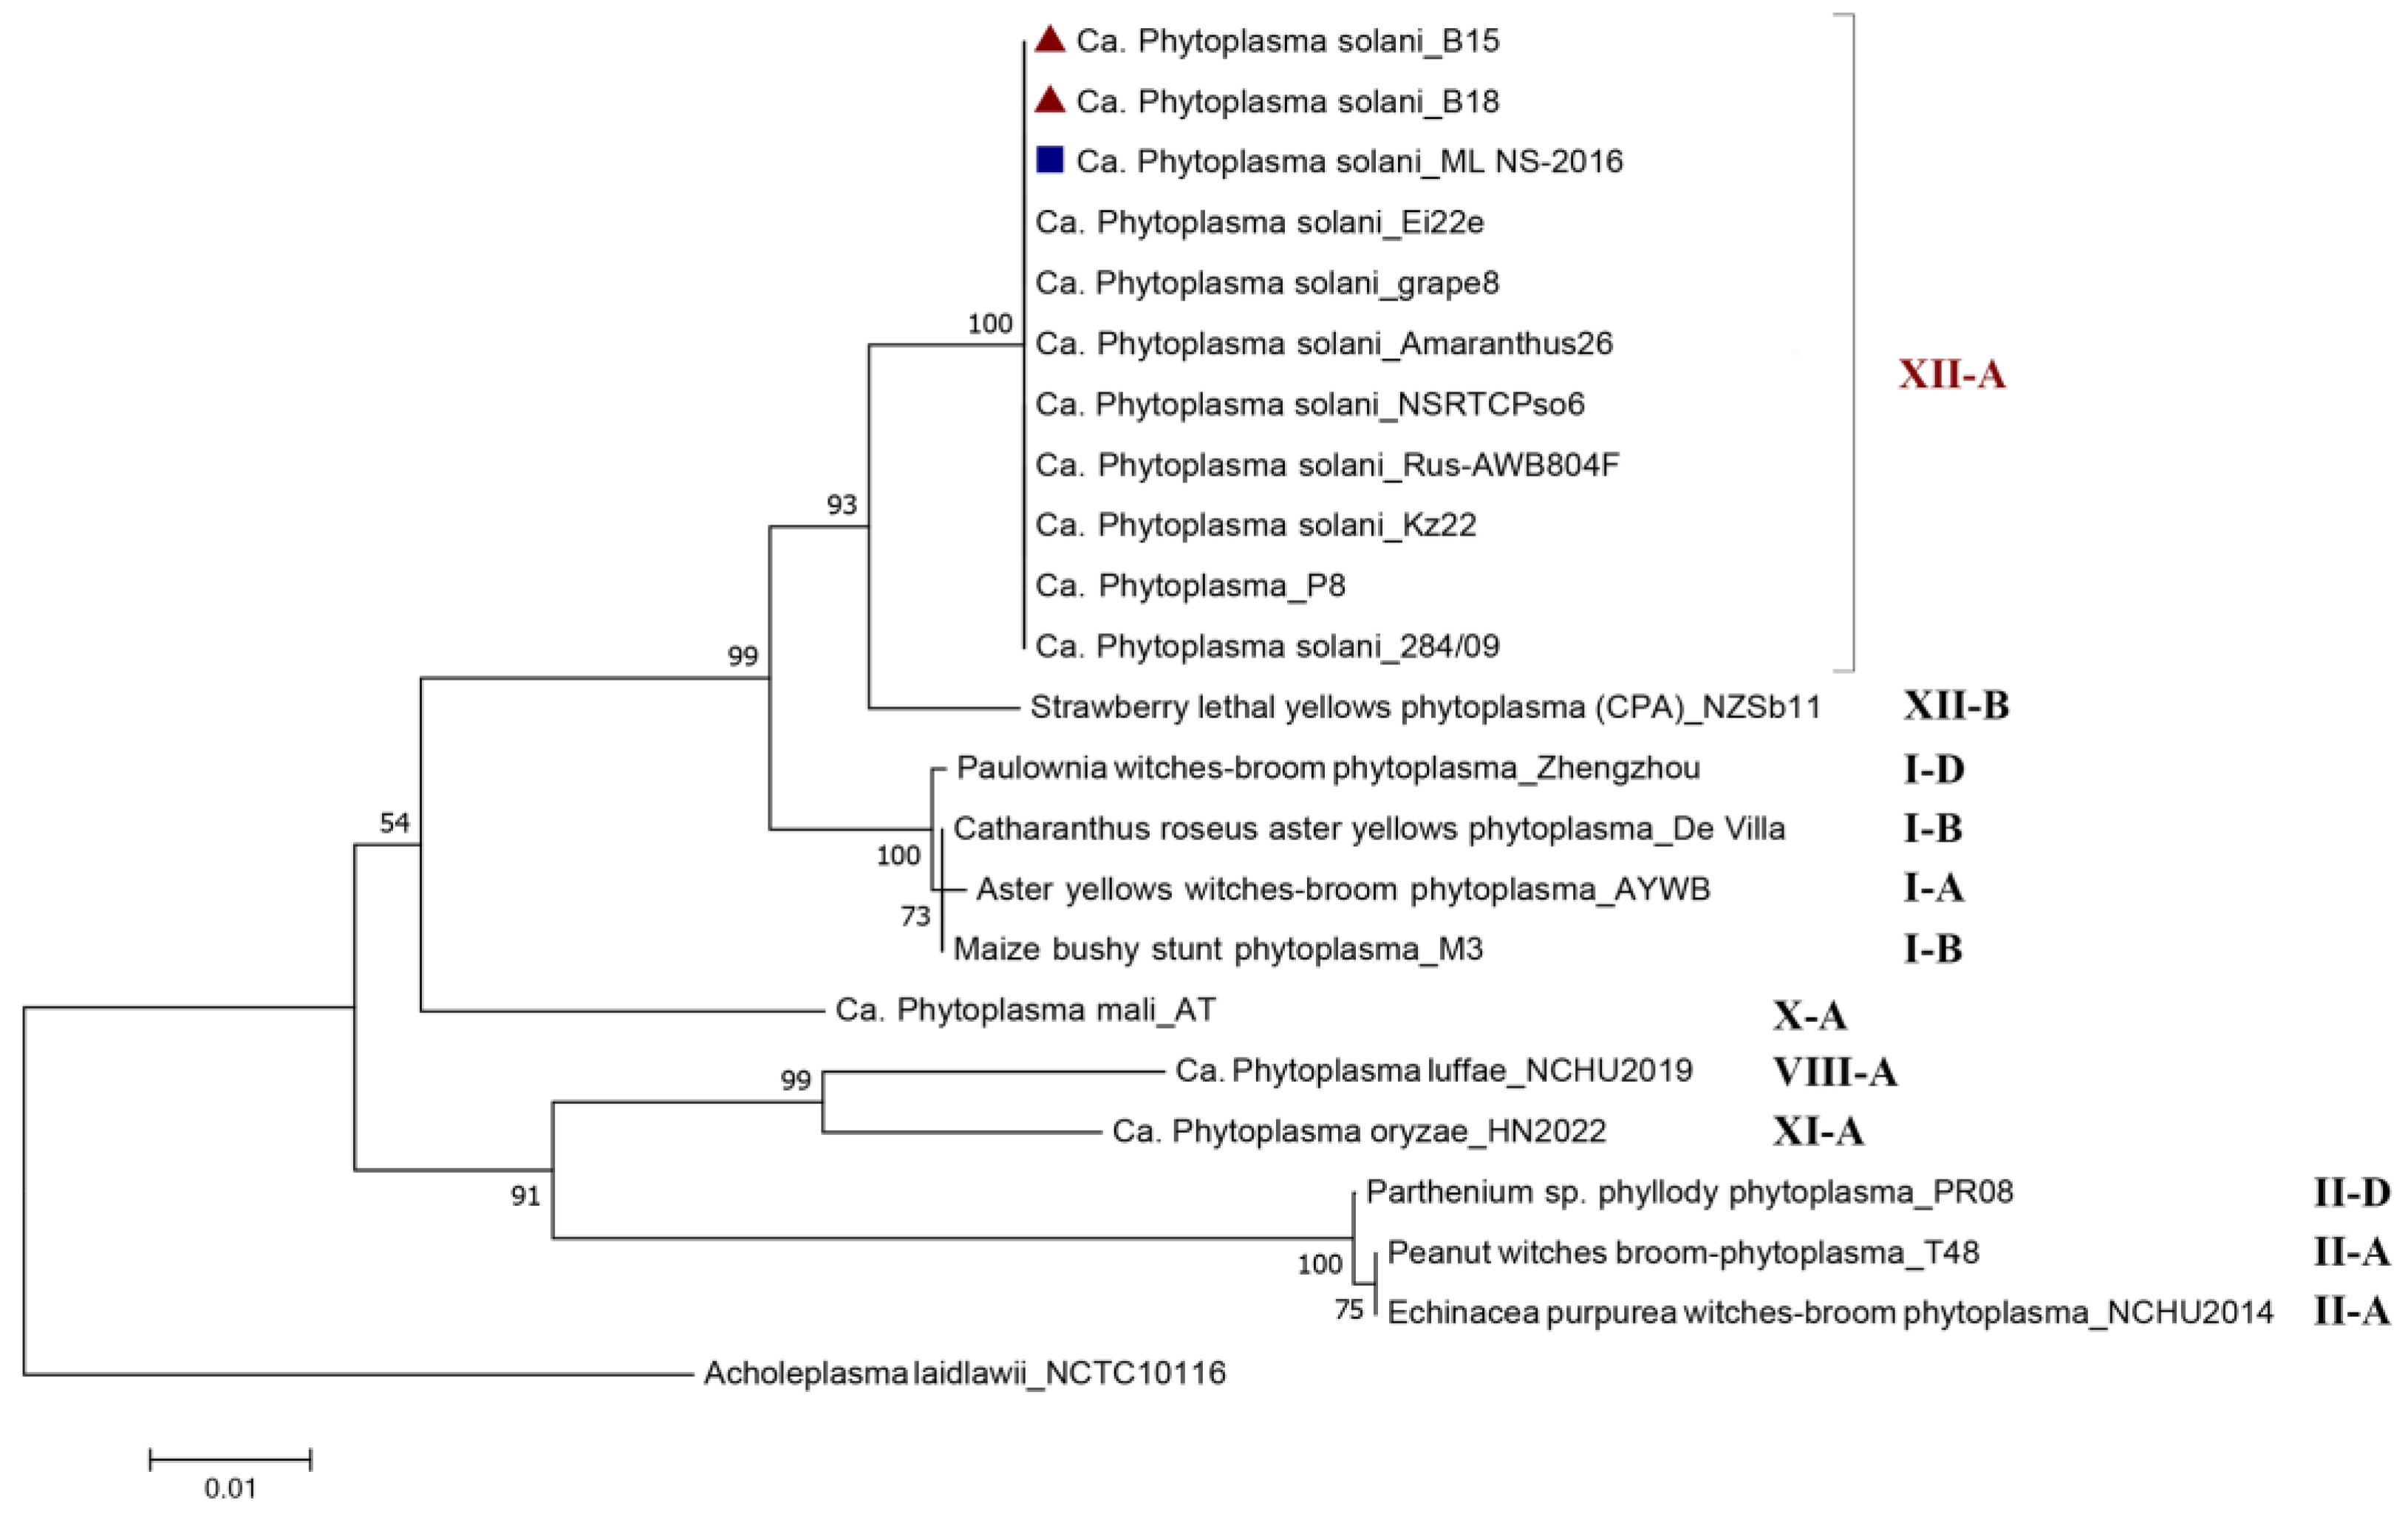
3.1. Phylogenetic Position of ‘Ca. Phytoplasma solani’ Strains

The NJ phylogenetic tree based on the 16S rRNA sequences of three tested Serbian ‘Ca. Phytoplasma solani’ strains from P. tenuifolia (B15 and B18) and D. carota (ML_NS-2016) and the comparative Phytoplasma spp. strains from different hosts/countries is presented in Figure 3. Based on the constructed tree, all tested/comparative ‘Ca. Phytoplasma solani’ strains were placed in the same tree cluster (the XII-A 16Sr Group) showing genetic homogeneity among themselves regardless of the host/country of origin. The remaining Phytoplasma spp. strains belonging to 16Sr Groups I (A, B, and D), II (A and D), VIII-A, X-A, XI-A, and XII-B were clearly separated in other tree branches/clusters, each corresponding to a specific 16Sr Group. Acholeplasma laidlawii strain NCTC10116 was placed on a monophyletic tree branch, as an outgroup (Figure 3).
The NJ phylogenetic tree that was constructed based on the plsC gene sequences for the two tested Serbian ‘Ca. Phytoplasma solani’ strains from A. graveolens and Mentha × piperita and comparative Phytoplasma spp. strains from different hosts/countries is presented in Figure 4. According to the constructed tree, all Serbian tested ‘Ca. Phytoplasma solani’ as well as comparative ‘Ca. Phytoplasma solani’ strains and stolbur phytoplasmas were genetically homogenous and placed in the same cluster. Based on the same gene, sequences of Strawberry lethal yellows phytoplasma (CPA) strain NZSb11 and ‘Ca. Phytoplasma australiense’ strains were identical; therefore, these two strains were grouped together within the second cluster of the tree. An outgroup Acholeplasma laidlawii strain DSM23060 was placed on a monophyletic tree branch.

3.2. Biochemical Analyses of Peony, Mint, Dill, and Carrot Infected by ‘Ca. Phytoplasma solani’

There was a significant difference for most of the tested biochemical parameters when asymptomatic and symptomatic plants were compared, except for total anthocyanidins contents in dill and the capacity of peony and mint extracts to neutralize superoxide anions and hydroxyl radicals, respectively (Table 3).
The total sugars content accumulated in symptomatic leaves was twice the amount of the sugars in healthy leaves. Lipid peroxidation intensity was clearly and dramatically higher in the leaves of symptomatic plants, reaching twice the values of LP for the asymptomatic dill and peony plants. Reduced glutathione content was enhanced slightly but significantly in all tested species. Although the activity of PAL was markedly higher in the symptomatic leaves (1.25–3.5 times higher), only in mint and dill were the amounts of phenolic compounds positively correlated with this trend (possibly because of higher tannin and proanthocyanidins contents); however, the amount of phenolics in peony plants was lower in symptomatic leaves (except for anthocyanidins content) than in those of the other two species. Photosynthetic pigment contents (chlorophyll a and b and carotenoids) significantly decreased (2.45–5.08 times) in the leaves of all tested species. Although there was a difference in antioxidant capacity between asymptomatic and symptomatic plants within species, the mint and dill plants had enhanced antioxidant activity against superoxide anions (NBT test higher than 80% of neutralized radicals), while peony plants had pronounced antioxidant activity against DPPH radicals (DPPH test higher than 90% of neutralized radicals).

3.3. Principal Component Analysis (PCA)

In this study, PCA was used to investigate the correlation between different chemical parameters tested, such as TS, RG, PAL, LP, TP, TT, Tflav, Tpro, Tant, NBT, OH, DPPH, Tcha, Tchb, and Car. The plant samples, including mint AL, mint SL, dill AL, dill SL, peony AL, and peony SL, were observed, and the content of these variables was utilized in the PCA. The first three principal components generated by the PCA were utilized to display the results visually in a PCA graph, which effectively differentiated the six plant samples. By applying PCA to the provided dataset, it was possible to differentiate between the samples based on the processing parameters used. This technique was utilized as a tool in exploratory data analysis to characterize and distinguish the input parameters for the neural network (as shown in Figure 5).
The results of the PCA (shown in Figure 5) reveal a clear separation between the samples, indicating good discrimination. The first three principal components (having eigenvalues of 5.15, 3.36, and 2.17), which account for 71.22% (the total variance explained by principal components was 34.34%; 22.42%, and 14.46%) of the total variability, were found to be sufficient for representing the data. The contents of TS (11.74%, based on correlations), PAL (9.80%), LP (8.68%), TP (11.60%), TT (11.53%), and DPPH (14.55%) had the most negative contributions to the calculation of the first factor coordinate (PC1), while the content of Tcha (7.01%) exerted the most positive influence on the PC1 coordinate calculation. Meanwhile, the content of RG (8.11%, based on correlations), Tflav (12.36%), Tcha (12.86%), and Tchb (12.80%) had negative influences on the second principal component (PCA), while Tpro (14.03%) and Car (11.38%) had positive influences on PC2. The content of LP (7.61%, based on correlations) and Tant (25.21%) had the most negative influence on the third principal component (PC3), while the content of NBT (9.03%), OH (8.34%), TP (8.25%), TT (8.32%), and Tpro (9.26%) exerted the most positive influence on the calculation of the PC3 coordinate.
According to the PCA, the carrot SR and carrot AR samples were characterized by the highest Car content, while peony SL and peony AL were noted to obtain the most prominent value of DPPH, TS, TT TP, PAL, and RG content. The sample mint AL was characterized by augmented Tflav, Tcha, and Tchb contents.

3.4. Neurons in the ANN Hidden Layer

One of the crucial steps in designing an ANN is to determine the appropriate number of hidden layers and neurons in each layer, which depend on the complexity of the input–output relationship. As this relationship becomes more complex, more neurons need to be added to the hidden layer(s) [32]. The optimal number of hidden neurons was selected by minimizing the difference between the predicted and desired output values, using the Sum of Squares (SOS) as the performance indicator during testing. The used MLP model was identified according to StatSoft Statistica’s notation, which indicates the number of inputs, neurons in the hidden layer(s), and outputs. Based on the ANN performance, it was observed that the optimal number of hidden neurons for the calculation of TS, RG, PAL, LP, NBT, OH, TP, TT, Tflav, Tpro, Tant, DPPH, and Car was nine (using MLP 8-9-13), as it produced high r2 values (1.000 during the training period) and low SOS values. The optimal networks used for predicting TS, RG, PAL, LP, NBT, OH, TP, TT, Tflav, Tpro, Tant, DPPH, and Car were able to produce reasonably accurate output values across a wide range of process variables. In most cases, the predicted values were very close to the experimental or target values, as evidenced by the high r2 values obtained from the ANN models. The complexity of the ANN models was quite high, with 211 weight biases required for TS, RG, PAL, LP, NBT, OH, TP, TT, Tflav, Tpro, Tant, DPPH, and Car calculations. However, the models were able to fit the experimental data quite well, owing to the high nonlinearity of the system under investigation [31,32]. During the training period, the r2 values between the experimental measurements and the ANN model outputs for TS, RG, PAL, LP, NBT, OH, TP, TT, Tflav, Tpro, Tant, DPPH, and Car were equal to 1.000.

3.5. Sensitivity Analysis

A sensitivity analysis was conducted to determine the relative influence (RI) of inputs (such as plant type and treatment) on TS, RG, PAL, LP, NBT, OH, TP, TT, Tflav, Tpro, Tant, DPPH, Tcha, Tchb, and Car, The results, shown in Figure 6, indicate how outputs change with respect to infinitesimal changes in inputs, reflecting both experimental errors and the inputs’ influence on the outputs.

4. Discussion

Phytoplasmas belonging to the “stolbur” group 16SrXII-A (‘Ca. Phytoplasma solani’) are known to affect a wide range of wild and cultivated plants worldwide, causing severe economic damage [34]. Since its first report on pepper in Serbia in 1949, ‘Ca. Phytoplasma solani’ has been described on diverse host plants (carrot, corn, grapevine, peony, peppermint, potato, etc.) in this country [12,35,36,37,38,39,40]. Species designation within phytoplasmas was primarily based on conserved 16S rRNA gene; however, since it does not allow distinctions among closely related Ca. Phytoplasma species, recent studies are encouraging the additional use of less conserved, housekeeping genes to enhance the resolving power [41]. However, the use of 16S rRNA sequences in this study allowed us to determine phylogenetic relatedness among the tested Serbian ‘Ca. Phytoplasma solani’ strains. The performed phylogenetic analysis with 16S rRNA sequences of the three Serbian ‘Ca. Phytoplasma solani’ strains from P. tenuifolia (B15 and B18) and D. carota (ML_NS-2016) and various reference Phytoplasma spp. strains belonging to different 16Sr Groups indicated an affiliation between the tested strains and the 16SrXII-A Group and genetic homogeneity with the other (tested/reference) ‘Ca. Phytoplasma solani’ strains placed within this group, regardless of the host or country of origin. Additionally, earlier, D. carota strain ML_NS-2016 was confirmed to be genetically homogenous with different ‘Ca. Phytoplasma solani’ strains originating from various countries (Bulgaria, Canada, China, France, Greece, Italy, Poland, Russia, Serbia, and Turkey) and hosts (corn, grapevine, parsley, parsnip, pea, periwinkle, potato, red sage, tobacco, tomato, and valerian), all belonging to the “stolbur” group (16SrXII-A) [7]. Similar to phylogenetic analysis based on 16S rRNA, a phylogenetic tree constructed based on the sequences of plsC gene, encoding the 1-acyl-sn-glycerol-3-phosphate acyltransferase enzyme involved in glycerophospholipid metabolism [42], placed the tested Serbian (A. graveolens strain STOL2 and Mentha × piperita strain STOL3) and comparative ‘Ca. Phytoplasma solani’ strains in the same “stolbur” tree cluster. This gene was discriminatory enough to distinguish ‘Ca. Phytoplasma australiense’ (first added as Strawberry lethal yellows phytoplasma) from the “stolbur” group. Some future research on Serbian ‘Ca. phytoplasma solani’ strains should be directed toward the sequencing and analysis of multiple housekeeping genes such as tuf, secY, vmp1, stamp, etc. [8,43], which could eventually reveal some genetic differences.
Artificial neural networks (ANNs) have found application in diverse domains for forecasting the outcomes of intricate systems by processing input data. ANNs belong to a class of machine learning algorithms capable of learning from data and predicting results with precision and dependability, such as identifying plant diseases. ANNs have exhibited remarkable potential in predicting biotic stress in plants resulting from diverse pathogens, enabling real-time plant health monitoring and offering a pre-emptive alert mechanism for farmers, agronomists, and researchers to forestall disease outbreaks. Developing an effective early warning system for the detection of plant diseases in different plant species is critical for improving crop yield and quality. The identification and prevention of diseases of crops are essential for improving crop prediction. Based on our results, the ANN model can be considered as an efficient computational methodology for modeling and predicting the effect of the biotic stress in different plants induced by ‘Ca. Phytoplasma solani’.

Author Contributions

Conceptualization, I.D., P.M. and T.P.M.; methodology, I.D., P.M. and L.P.; software, A.J. and L.P.; validation, I.D., P.M., A.J., G.T. and T.P.M.; formal analysis, I.D., A.J., P.M. and E.J.H.; investigation, I.D. and P.M.; resources, I.D., P.M., A.J., G.T. and E.J.H.; data curation, I.D., P.M., A.J., G.T. and T.P.M.; writing—original draft preparation, I.D., P.M., A.J., L.P., E.J.H. and T.P.M.; writing—review and editing, I.D., P.M., A.J., L.P., E.J.H., G.T. and T.P.M.; project administration, I.D. and P.M.; funding acquisition, I.D., P.M. and G.T. All authors have read and agreed to the published version of the manuscript.

Funding

This research was supported by the Ministry of Science, Technological Development and Innovation of the Republic of Serbia, grant numbers 451-03-66/2024-03/200032 (to I.D. and P.M.), 451-03-66/2024-03/200053 (to A.J. and G.T.), 451-03-66/2024-03/200051 (to L.P.), 451-03-66/2024-03/200222 (to E.J.H.), and 451-03-66/2024-03/200010 (to T.P.M.).

Data Availability Statement

The data are contained within this article.

Acknowledgments

This work was carried out as a part of the activities of the Department for Maize and the Department for Sunflower Institute of Field and Vegetable Crops, Novi Sad, Serbia, National Institute of the Republic of Serbia. The authors are grateful to Lato Pezo and Predrag Kojic for the statistical data processing.

Conflicts of Interest

The authors declare no conflicts of interest.

References

  1. Ghosh, S.; Dey, G. Biotic and abiotic stress tolerance through CRISPR-Cas mediated genome editing. J. Plant Biochem. Biotechnol. 2022, 31, 227–238. [Google Scholar] [CrossRef]
  2. Prasad, A.; Senthil-Kumar, M.; Prasad, M. Complex molecular mechanisms determine fitness of plants to biotic and abiotic stresses. J. Plant Biochem. Biotechnol. 2021, 30, 633–635. [Google Scholar] [CrossRef]
  3. Ben Rejeb, I.; Pastor, V.; Mauch-Mani, B. Plant responses to simultaneous biotic and abiotic stress: Molecular mechanisms. Plants 2014, 3, 458–475. [Google Scholar] [CrossRef] [PubMed]
  4. Ayvacı, H.; Güldür, M.E.; Dikilitas, M. Physiological and Biochemical Changes in Lucerne (Medicago sativa) Plants Infected with ‘Candidatus Phytoplasma australasia’-Related Strain (16SrII-D Subgroup). Plant Pathol. J. 2022, 38, 146–158. [Google Scholar] [CrossRef] [PubMed]
  5. Kiprovski, B.; Đalović, I.; Adamović, D.; Mitrović, P.; Marjanović-Jeromela, A.; Malenčić, Đ.; Popović, T. Biochemical changes in Oenothera biennis plants infected by ‘Candidatus Phytoplasma solani’. J. Plant Pathol. 2018, 100, 209–214. [Google Scholar] [CrossRef]
  6. Kumari, S.; Nagendran, K.; Rai, A.B.; Singh, B.; Rao, G.P.; Bertaccini, A. Global status of phytoplasma diseases in vegetable crops. Front. Microbiol. 2019, 10, 1349. [Google Scholar] [CrossRef] [PubMed]
  7. Mitrovic, P.; Djalovic, I.; Kiprovski, B.; Veljović Jovanović, S.; Trkulja, V.; Jelušić, A.; Popović, T. Oxidative stress and antioxidative activity in leaves and roots of carrot plants induced by Candidatus Phytoplasma solani. Plants 2021, 10, 337. [Google Scholar] [CrossRef]
  8. Popović, T.; Mitrović, P.; Kosovac, A. Molecular characterization of Candidatus Phytoplasma solani in celery: Case study in Futog. Field Veg. Crop. Res. 2021, 58, 66–71. [Google Scholar] [CrossRef]
  9. Mitrović, M.; Marinković, S.; Cvrković, T.; Jović, J.; Krstić, O.; Jakovljević, M. Framework for risk assessment of ‘Candidatus Phytoplasma solani’associated diseases outbreaks in agroecosystems in Serbia. J. Plant Pathol. 2022, 104, 537–552. [Google Scholar] [CrossRef]
  10. Zafari, S.; Niknam, V.; Musetti, R.; Noorbakhsh, S.N. Effect of phytoplasma infection on metabolite content and antioxidant enzyme activity in lime (Citrus aurantifolia). Acta Physiol. Plant. 2012, 34, 561–568. [Google Scholar] [CrossRef]
  11. Hameed, S.; Akhtar, K.P.; Hameed, A.; Gulzar, T.; Kiran, S.; Yousaf, S.; Abbas, G.; Asghar, M.J.; Sarwar, N. Biochemical changes in the leaves of mungbean (Vigna radiata) plants infected by phytoplasma. Turk. J. Biochem. 2017, 42, 591–599. [Google Scholar] [CrossRef]
  12. Junqueira, A.; Bedendo, I.; Pascholati, S. Biochemical changes in corn plants infected by the maize bushy stunt phytoplasma. Physiol. Mol. Plant Pathol. 2004, 65, 181–185. [Google Scholar] [CrossRef]
  13. Trkulja, V.; Adamović, D.; Đalović, I.; Mitrović, P.; Kovačić-Jošić, D.; Lukač, Z.; Komić, J. First report of stolbur phytoplasma associated with Anethum graveolens in Serbia. Plant Dis. 2016, 100, 516. [Google Scholar] [CrossRef]
  14. Adamovic, D.; Djalovic, I.; Mitrovic, P.; Kojic, S.; Pivic, R.; Josic, D. First Report on Natural Infection of Paeonia tenuifolia by ‘Candidatus Phytoplasma solani’in Serbia. Plant Dis. 2014, 98, 565. [Google Scholar] [CrossRef]
  15. Mitrović, P.; Trkulja, V.; Adamović, D.; Đalović, I.; Milovac, Ž.; Kovačić-Jošić, D.; Mihić Salapura, J. First report of stolbur phytoplasma on Mentha× piperita in Serbia. Plant Dis. 2016, 100, 853. [Google Scholar] [CrossRef]
  16. Kimura, M. A simple method for estimating evolutionary rates of base substitutions through comparative studies of nucleotide sequences. J. Mol. Evol. 1980, 16, 111–120. [Google Scholar] [CrossRef]
  17. Albalasmeh, A.A.; Berhe, A.A.; Ghezzehei, T.A. A new method for rapid determination of carbohydrate and total carbon concentrations using UV spectrophotometry. Carbohydr. Polym. 2013, 97, 253–261. [Google Scholar] [CrossRef]
  18. Rahman, I.; Kode, A.; Biswas, S.K. Assay for quantitative determination of glutathione and glutathione disulfide levels using enzymatic recycling method. Nat. Protoc. 2006, 1, 3159–3165. [Google Scholar] [CrossRef]
  19. Hodges, D.M.; DeLong, J.M.; Forney, C.F.; Prange, R.K. Improving the thiobarbituric acid-reactive-substances assay for estimating lipid peroxidation in plant tissues containing anthocyanin and other interfering compounds. Planta 1999, 207, 604–611. [Google Scholar] [CrossRef]
  20. Gerasimova, N.G.; Pridvorova, S.M.; Ozeretskovskaya, O.L. Role of L–phenylalanine ammonia Lyase in the induced resistance and susceptibility of sotato plants. Appl. Biochem. Microbiol. 2005, 41, 103–105. [Google Scholar] [CrossRef]
  21. Von Wettstein, D. Chlorophyll-letale und der submikroskopische Formwechsel der plastiden. Exp. Cell Res. 1957, 12, 427–506. [Google Scholar] [CrossRef] [PubMed]
  22. Makkar, H.P.S. Quantification of Tannins in Tree and Shrub Foliage: A Laboratory Manual; Springer Science & Business Media: Berlin/Heidelberg, Germany, 2003. [Google Scholar]
  23. Pękal, A.; Pyrzynska, K. Evaluation of aluminium complexation reaction for flavonoid content assay. Food Anal. Methods 2014, 7, 1776–1782. [Google Scholar] [CrossRef]
  24. Lee, J.; Durst, R.W.; Wrolstad, R.E. Determination of total monomeric anthocyanin pigment content of fruit juices, beverages, natural colorants and wines by the pH differential method: Collaborative study. J. AOAC Int. 2005, 88, 1269–1278. [Google Scholar] [CrossRef] [PubMed]
  25. Panda, S.K. Assay guided comparison for enzymatic and nonenzymatic antioxidant activities with special reference to medicinal plants. In Antioxidant Enzyme, 3rd ed.; El-Missiry, M.A., Ed.; IntechOpen: Rijeka, Croatia, 2012; Volume 14, pp. 382–400. [Google Scholar]
  26. Ahmed, D.; Saman, Z.; Hira, B. In vitro analysis of antioxidant activities of Oxalis corniculata Linn. fractions in various solvents. Afr. J. Tradit. Complement. Altern. Med. 2013, 10, 158–165. [Google Scholar] [CrossRef]
  27. Sánchez-Moreno, C. Methods used to evaluate the free radical scavenging activity in foods and biological systems. Int. J. Food Sci. Technol. 2002, 8, 121–137. [Google Scholar] [CrossRef]
  28. Brlek, T.; Pezo, L.; Voća, N.; Krička, T.; Vukmirović, Đ.; Čolović, R.; Bodroža-Solarov, M. Chemometric approach for assessing the quality of olive cake pellets. Fuel Process. Technol. 2013, 116, 250–256. [Google Scholar] [CrossRef]
  29. Abdi, H.; Williams, L.J. Principal component analysis. Wiley Interdiscip. Rev. Comput. Stat. 2010, 2, 433–459. [Google Scholar] [CrossRef]
  30. Hu, X.; Weng, Q. Estimating impervious surfaces from medium spatial resolution imagery using the self-organizing map and multi-layer perceptron neural networks. Remote Sens. Environ. 2009, 113, 2089–2102. [Google Scholar] [CrossRef]
  31. Karlović, S.; Bosiljkov, T.; Brnčić, M.; Jezek, D.; Tripalo, B.; Dujmić, F.; Dzineva, I.; Skupnjak, A. Comparison of artificial neural network and mathematical models for drying of apple slices pretreated with high intensity ultrasound. Bulg. J. Agric. Sci. 2013, 19, 1372–1377. [Google Scholar]
  32. Chattopadhyaya, P.B.; Rangarajana, R. Application of ANN in sketching spatial nonli-nearity of unconfined aquifer in agricultural basin. Agric. Water Manag. 2014, 133, 81–91. [Google Scholar] [CrossRef]
  33. Yoon, Y.; Swales, G., Jr.; Margavio, T.M. A Comparison of Discriminant Analysis versus Artificial Neural Networks. J. Oper. Res. Soc. 1993, 44, 51–60. [Google Scholar] [CrossRef]
  34. Quaglino, F.; Zhao, Y.; Casati, P.; Bulgari, D.; Bianco, P.A.; Wei, W.; Davis, R.E. ‘Candidatus Phytoplasma solani’, a novel taxon associated with stolbur-and bois noir-related diseases of plants. Int. J. Syst. Evol. Microbiol. 2013, 63, 2879–2894. [Google Scholar] [CrossRef] [PubMed]
  35. Mitrović, M.; Jakovljević, M.; Jović, J.; Krstić, O.; Kosovac, A.; Trivellone, V.; Jermini, M.; Toševski, I.; Cvrković, T. ‘Candidatus phytoplasma solani’genotypes associated with potato stolbur in Serbia and the role of Hyalesthes obsoletus and Reptalus panzeri (hemiptera, cixiidae) as natural vectors. Eur. J. Plant Pathol. 2016, 144, 619–630. [Google Scholar] [CrossRef]
  36. Martinović, M.; Bjegović, P. O nekim bolestima i štetočinama utvrđenim u NR Srbiji u 1949 godini. Zaštita Bilja 1950, 2, 59–68. (In Serbian) [Google Scholar]
  37. Duduk, B.; Botti, S.; Ivanović, M.; Krstić, B.; Dukić, N.; Bertaccini, A. Identification of phytoplasmas associated with grapevine yellows in Serbia. J. Phytopathol. 2004, 152, 575–579. [Google Scholar] [CrossRef]
  38. Duduk, B.; Bertaccini, A. Corn with symptoms of reddening: New host of stolbur phytoplasma. Plant Dis. 2006, 90, 1313–1319. [Google Scholar] [CrossRef] [PubMed]
  39. Jović, J.; Ember, I.; Mitrović, M.; Cvrković, T.; Krstić, O.; Krnjajić, S.; Acs, Z.; Kolber, M.; Toševski, I. Molecular detection of potato stolbur phyto-plasma in Serbia. Bull. Insectology 2011, 64, S83–S84. [Google Scholar]
  40. Mitrović, J.; Pavlović, S.; Duduk, B. Survey and Multigene Characterization of Stolbur Phytoplasmas on Various Plant Species in Serbia. Phytopathol. Mediterr. 2013, 52, 8. [Google Scholar] [CrossRef]
  41. Martini, M.; Quaglino, F.; Bertaccini, A. Multilocus Genetic Characterization of Phytoplasmas. In Phytoplasmas: Plant Pathogenic Bacteria-III: Genomics, Host Pathogen Interactions and Diagnosis; Springer: Singapore, 2019; pp. 161–200. [Google Scholar]
  42. Böhm, J.W.; Duckeck, D.; Duduk, B.; Schneider, B.; Kube, M. Genome Comparison of ‘Candidatus Phytoplasma rubi’with Genomes of Other 16SrV Phytoplasmas Highlights Special Group Features. Appl. Microbiol. 2023, 3, 1083–1100. [Google Scholar] [CrossRef]
  43. Contaldo, N.; Stepanović, J.; Pacini, F.; Bertaccini, A.; Duduk, B. Molecular Variability and Host Distribution of ‘Candidatus Phytoplasma Solani’ Strains from Different Geographic Origins. Microorganisms 2021, 9, 2530. [Google Scholar] [CrossRef]
Figure 1. Symptoms caused by ‘Ca. Phytoplasma solani’ on (A) peony—P. tenuifolia, (B) dill—A. graveolens, (C) mint—Mentha × piperita, and (D) carrot—D. carota.
Horticulturae 10 00426 g001
Figure 2. ANN topology with three layers (input, output, and hidden) with weights, biases, and transfer functions.
Horticulturae 10 00426 g002
Figure 3. Neighbor-joining phylogenetic tree showing the position of the three tested Serbian ‘Ca. Phytoplasma solani’ strains from P. tenuifolia Horticulturae 10 00426 i001 and D. carota Horticulturae 10 00426 i002 and 23 comparative Phytoplasma spp. strains belonging to different 16Sr Groups. Acholeplasma laidlawii strain NCTC10116 from the GenBank database served as an outgroup.
Horticulturae 10 00426 g003
Figure 4. Neighbor-joining phylogenetic tree showing the position of the two tested Serbian ‘Ca. Phytoplasma solani’ strains from A. graveolens Horticulturae 10 00426 i003 and Mentha × piperita Horticulturae 10 00426 i004 and 13 comparative Phytoplasma spp. strains according to sequences of the plsC gene. Acholeplasma laidlawii strain DSM23060 from the GenBank database served as an outgroup.
Horticulturae 10 00426 g004
Figure 5. Biplot graph of chemical analysis for asymptomatic (A) and symptomatic (S) samples of the leaves of peony, mint, dill, and carrot.
Horticulturae 10 00426 g005
Figure 6. The relative influence of plant type and treatment on (a) TS, (b) RG, (c) PAL, (d) LP, (e) ATO2, (f) ATOH, (g) TP, (h) TT, (i) Tflav, (j) Tpro, (k) Tant, (l) DPPH, (m) Car, (n) Tcha, and (o) Tchb.
Horticulturae 10 00426 g006
Table 1. List of Phytoplasma spp. strains from GenBank used to construct the phylogenetic tree based on 16S rRNA sequences.
Species16Sr Group ClassificationStrainIsolation SourceCountryAcc. No.
Ca. Phytoplasma solani’XII-AB15 aP. tenuifoliaSerbiaKC960487
B18 aP. tenuifoliaSerbiaKF614623
ML_NS-2016 aD. carotaSerbiaMF503627
Ei22Euscelis incisusSerbiaMN047263
grape8Vitis viniferaIranMK392488
Amaranthus26Amaranthus sp.-MN007088
NSRTCPso6Prunus domesticaJordanMH085229
Rus-AWB804FMedicago sativaRussiaKY587525
Kz22Citrus sp.IranMG563790
P8Solanum tuberosumGermanyPP261349
284/09Nicotiana tabacum-NC_022588
Strawberry lethal yellows phytoplasma (CPA)XII-B variantNZSb11-Australia and New ZealandCP002548
Aster yellows witches’-broom phytoplasmaI-AAYWBLactuca sativaUSACP000061
Catharanthus roseus’ aster yellows phytoplasmaI-BDe VillaCatharanthus roseusSouth AfricaCP035949
Maize bushy stunt phytoplasmaI-BM3Dalbulus maidisBrazilCP015149
Paulownia witches’-broom phytoplasmaI-DZhengzhouPaulowniaChinaCP066882
Peanut witches’-broom phytoplasmaII-AT48Areca catechuChinaOR239773
Echinacea purpurea’ witches’-broom phytoplasmaII-ANCHU2014Catharanthus roseusTaiwanCP040925
Parthenium sp.’ phyllody phytoplasmaII-DPR08Parthenium hysterophorusIndiaCP097207
Ca. Phytoplasma ziziphi’V-BJwb-nkyZiziphus jujubaChinaCP025121
Ca. Phytoplasma luffae’VIII-ANCHU2019Luffa aegyptiacaTaiwanCP054393
Ca. Phytoplasma mali’X-AAT--CU469464
Ca. Phytoplasma oryzae’XI-AHN2022-ChinaCP116038
Acholeplasma laidlawii b-NCTC10116--LS483439
a Serbian Ca. Phytoplasma solani strains of interest in this study; b outgroup.
Table 2. List of Phytoplasma spp. strains from GenBank used to construct the phylogenetic tree based on plsC gene sequences.
SpeciesStrainIsolation SourceCountryAcc. No.
Ca. Phytoplasma solani’STOL2 aA. graveolensSerbiaKT281866
STOL3 aMentha × piperitaSerbiaKT281865
284/09Nicotiana tabacum-FO393427
231/09--FO393428
Stol11_3_CConvolvulus arvensis-JQ977746
Stol11_1_CConvolvulus arvensis-JQ977744
Stol11_2_UUrtica dioica-JQ977745
Rubus fruticosus’ stolbur phytoplasmaStol11-Rubus1/2010-BgRubus fruticosusBulgariaJN561701
Convolvulus arvensis’ stolbur phytoplasmaStol11-Conv2/2010-BgConvolvulus arvensisBulgariaJN561700
Convolvulus arvensis’ stolbur phytoplasmaStol11-Conv12/2011-BgConvolvulus arvensisBulgariaJN561699
Lavender decline stolbur phytoplasmaStol 11--AF447596
Strawberry lethal yellows phytoplasma (CPA)NZSb11--CP002548
Ca. Phytoplasma australiense’---AM422018
Acholeplasma laidlawii bDSM 23060 NZ_QRDS01000001
a Serbian ‘Ca. Phytoplasma solani’ strains of interest in this study; b outgroup.
Table 3. Biochemical parameters of healthy (A—asymptomatic) and ‘Ca. Phytoplasma solani’-infected (S—symptomatic) leaves of mint (Mentha × piperita), dill (A. graveolens), and peony (P. tenuifolia) plants. Data on carrot (D. carota) plants served as a comparison in this study.
Carrot a
(Daucus carota)
Mint
(Mentha × piperita)
Dill
(Anethum graveolens)
Peony
(Paeonia tenuifolia)
ASASASAS
Total sugars (% fw) X ¯ ± Se5.79 ± 0.015.15 ± 0.013.45 ± 0.086.62 ± 0.013.44 ± 0.025.15 ± 0.014.80 ± 0.0111.98 ± 0.01
t-test A/S****
Reduced glutathione (μmol GSH/g fw) X ¯ ± Se2.75 ± 0.013.10 ± 0.013.28 ± 0.013.93 ± 0.014.21 ± 0.015.07 ± 0.024.55 ± 0.015.01 ± 0.01
t-test A/S****
Phenylalanine ammonia-lyase (U/g fw) X ¯ ± Se258.82 ± 0.2970.94 ± 0.03164.33 ± 0.09300.91 ± 0.06247.63 ± 0.19310.20 ± 0.42413.51 ± 0.281450.21 ± 0.41
t-test A/Snd***
Lipid peroxidation (nmol MDA/g fw) X ¯ ± Se871.57 ± 0.261064.43 ± 3.80590.77 ± 1.04641.43 ± 0.30597.37 ± 0.861476.27 ± 0.64722.83 ± 0.121636.60 ± 1.70
A/S** * *
Total polyphenols (mg/g dw) X ¯ ± Se4.03 ± 0.021.42 ± 0.014.10 ± 0.017.45 ± 0.065.17 ± 0.026.27 ± 0.0194.02 ± 0.1686.56 ± 0.23
t-test A/S****
Total tannins (mg/g dw) X ¯ ± Se3.33 ± 0.041.18 ± 0.032.66 ± 0.025.83 ± 0.031.94 ± 0.012.34 ± 0.0182.18 ± 0.0277.35 ± 0.08
t-test A/S****
Total flavonoids (mg/g dw) X ¯ ± Se0.043 ± 0.00.000 ± 0.00.263 ± 0.0020.275 ± 0.0020.032 ± 0.0010.022 ± 0.0010.050 ± 0.0000.051 ± 0.001
t-test A/Snd* * *
Total proanthocyanidins (mg/g dw) X ¯ ± Se0.40 ± 0.06.02 ± 0.010.87 ± 0.010.79 ± 0.010.86 ± 0.012.20 ± 0.014.75 ± 0.013.61 ± 0.01
t-test A/S****
Total anthocyanidins (mg/g dw) X ¯ ± Se0.003 ± 0.00.000 ± 0.00.003 ± 0.000.000 ± 0.000.009 ± 0.010.012 ± 0.000.003 ± 0.000.137 ± 0.00
t-test A/Snd* nd *
Total chlorophyll a (mg/g dw) X ¯ ± Se0.78 ± 0.010.54 ± 0.011.86 ± 0.010.46 ± 0.000.93 ± 0.010.27 ± 0.000.61 ± 0.010.12 ± 0.01
t-test A/S****
Total chlorophyll b (mg/g dw) X ¯ ± Se0.18 ± 0.00.15 ± 0.00.77 ± 0.000.21 ± 0.010.42 ± 0.010.14 ± 0.000.24 ± 0.000.05 ± 0.00
t-test A/S****
Carotenoids (mg/g dw) X ¯ ± Se0.36 ± 0.010.17 ± 0.00.39 ± 0.000.12 ± 0.000.35 ± 0.010.08 ± 0.000.29 ± 0.000.12 ± 0.00
t-test A/S****
NBT test (% neutralized radicals) X ¯ ± Se20.33 ± 0.2882.57 ± 0.2393.53 ± 0.2988.37 ± 0.0982.10 ± 0.0688.40 ± 0.0644.30 ± 0.3552.60 ± 0.23
t-test A/S** * nd
OH test (% neutralized radicals) X ¯ ± Se10.81 ± 2.420.69 ± 0.0416.40 ± 0.1515.17 ± 1.9435.37 ± 1.284.70 ± 0.1236.30 ± 0.4630.90 ± 0.06
t-test A/S*nd**
DPPH test (% neutralized radicals) X ¯ ± Se19.95 ± 0.0210.90 ± 0.0114.30 ± 0.0115.43 ± 0.1213.74 ± 0.0822.80 ± 0.2092.91 ± 0.0690.87 ± 0.02
t-test A/S****
*—difference between A and S according to the t-test (p < 0.05); nd—no difference. a carrot data retrieved from a previous study by Mitrović et al. [7] and not the primary result of this work.
Disclaimer/Publisher’s Note: The statements, opinions and data contained in all publications are solely those of the individual author(s) and contributor(s) and not of MDPI and/or the editor(s). MDPI and/or the editor(s) disclaim responsibility for any injury to people or property resulting from any ideas, methods, instructions or products referred to in the content.

