Article

Genome-Wide Identification, Characterization, and Expression Profile of SWEETs Gene Family in Grapevine (Vitis vinifera L.)

1
State Key Laboratory for Crop Stress Resistance and High-Efficiency Production, College of Horticulture, Northwest A&F University, Xianyang 712100, China
2
Key Laboratory of Horticultural Plant Biology and Germplasm Innovation in Northwest China, Ministry of Agriculture, Northwest A&F University, Xianyang 712100, China
*
Authors to whom correspondence should be addressed.
These authors contributed equally to this work.
Horticulturae 2024, 10(5), 428; https://doi.org/10.3390/horticulturae10050428
Submission received: 20 March 2024 / Revised: 14 April 2024 / Accepted: 18 April 2024 / Published: 23 April 2024
(This article belongs to the Section Genetics, Genomics, Breeding, and Biotechnology (G2B2))

Abstract

:
SWEET (Sugars Will Eventually Be Exported Transporter) proteins, identified recently as a novel class of sugar transporters, play pivotal roles in the transport and distribution of photosynthetic products in plants. They are integral to physiological processes such as response to biotic and abiotic stress, growth and development, and fruit quality formation. In this study, leveraging the latest grapevine genomic data, we identified 18 members of the grapevine SWEET family and named them based on their homologs in Arabidopsis. We conducted a detailed analysis of these protein-encoding genes, focusing on their structure, conserved domains, and phylogenetic relationships. Phylogenetic analysis revealed that the grapevine SWEET family members could be categorized into four clades, with the majority of members displaying relatively conserved gene structures and motifs. Chromosomal localization and homology analysis indicated an uneven distribution of VvSWEETs across 11 chromosomes, with evidence of two segmental duplication events during evolution. Furthermore, we investigated the transcription levels of SWEET genes across different tissues, organs, and developmental stages of fruit, as well as their response patterns under abiotic stress (drought, cold, and salt stress) and biotic stress (Botrytis cinerea infection). Expression profiling demonstrated strong tissue-specificity and temporal-spatial specificity of VvSWEETs, correlated with their respective clades. It is noteworthy that the expression levels of most members within Clade 1 of the VvSWEET gene family, especially VvSWEET1, were markedly upregulated in response to a broad range of stress conditions. Our results provide a comprehensive bioinformatic characterization and analysis of the grapevine SWEET gene family, unveiling the potential functions of grapevine SWEET genes and offering a vital reference for further functional studies.

1. Introduction

Sugar serves as an essential carbon source for plant growth and development, participating in numerous physiological processes such as energy metabolism and signal transduction as substrates for the production of primary and secondary metabolites. This participation is crucial for maintaining plant growth and development, as well as responding to stress [1,2]. Consequently, the transport and distribution of sugars are vital in plants. However, sugars cannot independently cross the plant’s biomembrane systems for transport and require the assistance of specific sugar transporter proteins [3]. In plants, three main families of sugar transport proteins exist: Monosaccharide Transporters (MSTs) [4], Sucrose Transporters (SUTs) [5], and Sugars Will Eventually be Exported Transporters (SWEETs) [6]. SWEETs represent a newly discovered sugar transport protein family (PF03083) in recent years. In comparison to the former two, SWEETs can transport sugars bidirectionally across membranes without depending on the environmental pH and along concentration gradients [5,7]. In eukaryotic organisms, SWEET proteins consist of a typical 7-transmembrane α-helical structure domain (7-TMs), including two conserved MtN3/saliva domains. Each domain is comprised of 3-TMs forming triple-helix bundles (THB). In prokaryotic organisms, SWEET homologs, known as semi-SWEET, only contain a single 3-TMs domain but still possess the ability to transport sucrose.
SWEET proteins are ubiquitously present in prokaryotes, plants, humans, and other animals, and exhibit a high degree of conservation. With the completion of plant genome sequencing, SWEET genes in multiple species have been successively identified. To date, the identification and analysis of the SWEET gene family have been reported in a variety of plants (Table 1). Phylogenetic analysis reveals that this family is generally divided into four clades, with members of Clade I and Clade II primarily transporting hexoses, Clade III members mainly transporting sucrose, and Clade IV members localized to the vacuolar membrane, tending to transport fructose [8].
Numerous studies have demonstrated that SWEET sugar transport proteins participate in essential physiological processes related to plant growth and development by regulating the transportation, distribution, and storage of sugar compounds within plants. These processes include pollen development, fruit ripening, and leaf senescence, among others [9,10]. Mutation in the AtSWEET8 gene results in male sterility, as it fails to transport glucose for pollen nutrition, leading to pollen unviability [6]. Similarly, in rice, OsSWEET11 supports pollen vitality; silencing of the OsSWEET11 gene reduces starch content in pollen and may lead to male sterility in rice [11]. In pineapple, AnmSWEET5 and AnmSWEET11 are highly expressed in the early stages of fruit development [12]. Likewise, in the apple genome, nine MdSWEET genes are highly expressed throughout fruit development, with MdSWEET9b and MdSWEET15a likely involved in the regulation of sugar accumulation in apples [13]. Overexpression of OsSWEET5 in rice results in stunted plant growth [14].
The SWEET family also extensively responds to various stress conditions. Overexpression of AtSWEET16 and AtSWEET17 in Arabidopsis enhances the transgenic plants’ cold tolerance [15]. In tea plants, the expression of CsSWEET2, CsSWEET3, and CsSWEET16 is significantly suppressed under cold stress, whereas the expression of CsSWEET1 and CsSWEET17 dramatically increases [16]. Transgenic Arabidopsis overexpressing AtSWEET15(SAG29) is more sensitive to salt stress, and AtSWEET15 mutants exhibit enhanced salt tolerance [17]. Heat stress negatively affects the SWEET functions in phloem loading, unloading, and long-distance transport of sugars, ultimately leading to abnormal plant growth and development [18]. Drought stress induces the expression of AtSWEET11 and AtSWEET12, promoting the transport of sucrose from leaves to roots [19]. In tomatoes, the SlSWEET genes have multiple cis-acting elements related to stress and hormone responses in their promoter regions. The expression levels of several SlSWEET genes change significantly in leaves, roots, mature green fruits, and ripe red fruits under high-sugar, high-salt, high-temperature, and low-temperature conditions [20]. In addition to the abiotic stresses mentioned, most pathogens require glucose from the host plant as a carbon source for their growth before successful invasion. SWEET sugar transport proteins control the sugar competition at the plant–microbe interface, and their regulation determines the outcome of the interaction. For example, in rice, the pathogen Xanthomonas oryzae pv. oryzae secretes specific transcription activator-like (TAL) effecto rs after infection, which bind precisely to the cis-regulatory elements of the rice OsSWEET11 gene promoter, regulating transcription and increasing sugar efflux, which is ultimately exploited by the pathogen, leading to plant susceptibility [21].
Grapes (Vitis vinifera L.) are one of the world’s most economically valuable perennial fruit crops. Breeding for improved varieties through conventional breeding and biotechnological approaches holds great promise, but progress is limited due to a general lack of understanding of key genes involved in stress responses, restricting the selection process. Research on gene families is critical for analyzing gene origins and predicting gene functions. The publication of the grape genome [22] has facilitated the identification of gene families. In this study, we identified members of the SWEET family from the grape genome and conducted a bioinformatics analysis of the SWEET genes, including phylogenetic relationships, chromosomal localization, exon–intron structures, motif composition, and collinearity analysis. Furthermore, we extracted related transcriptome data to analyze the expression patterns of the SWEET family in different grape tissues and organs, at various fruit developmental stages, and under abiotic stress conditions. In summary, this work provides important information for future research on the biological functions of grape SWEET family members and lays a foundation for further utilization of these genes in breeding high-quality new grape varieties.
Table 1. SWEET families of several plant species.
TypeSpeciesNumber of SWEET MembersReference
MonocotyledonsOryza sativa21[23]
Sorghum bicolor23[24]
Musa acuminata25[25]
Ananas comosus39[12]
Bletilla striata17[26]
Saccharum spontaneum22[27]
Zea mays24[28]
Prunus mume17[29]
Triticum aestivuml59[30]
Hordeum vulgare23[31]
DicotyledonsArabidopsis thaliana17[6]
Manihot esculenta23[32]
Citrus sinensis16[33]
Eucalyptus grandis52[34]
Glycine max52[35]
Solanum lycopersicum29[20]
Solanum tuberosum35[36]
Pyrus bretschneideri18[37]
Gossypium hirsutum55[38]
Malus domestica25[13]
Camellia sinensis13[39]
Litchi16[40]
Medicago truncatula25[41]
Brassica oleracea30[42]
Juglans regia25[43]
Citrullus lanatus22[44]
Punica granatum20[45]
Dimocarpus longan20[46]
Beta vulgaris16[47]
Rosa rugosa25[48]
Prunus salicina15[49]
Capsicum annuum33[50]
Medicago polymorpha23[51]
Ziziphus jujuba19[52]
Betula platyphylla13[53]
Potentilla anserina23[54]

2. Materials and Methods

2.1. Identification and Annotation of SWEET Genes in the Grapevine Genome

To pinpoint potential SWEET genes in grapevine, the newest grape genome iteration (12X.v2) along with the VCost.V3 gene annotations were retrieved from the URGI portal (https://urgi.versailles.inra.fr/Species/Vitis/Annotations, accessed on 2 January 2023) [55]. The Hidden Markov Model (HMM) profile specific to the MtN3_saliva domain (accession:PF03083) was acquired from the Pfam database (http://pfam.xfam.org/family/PF03083) (accessed on 2 January 2023) [56], and the search for prospective SWEET genes in the grape genome was conducted using the HMMER3.0 tool, setting the E-value ≤ 0.01 [57,58]. CRIBI v2.1 ID and Locus ID information were sourced from the Phytozome v13 database (https://phytozome-next.jgi.doe.gov) (accessed on 2 January 2023) [59] and the Grape Genome Browser (12X) (https://www.genoscope.cns.fr/vitis) (accessed on 3 January 2023) [22]. Verification of the MtN3_saliva domain’s authenticity was carried out using the SMART resource (http://smart.embl-heidelberg.de) (accessed on 3 January 2023) [60] and the Conserved Domain Database (https://www.ncbi.nlm.nih.gov/Structure/cdd/wrpsb.cgi) (accessed on 3 January 2023) [61]. Predictions on the molecular weight (Mw) and isoelectric point (pI) of the identified SWEET proteins were made via the ProtParam utility (http://web.expasy.org/protparam/) (accessed on 3 January 2023) [62].

2.2. Phylogenetic and Conserved Domain Alignment Analysis

The alignment of the amino acid sequences within the MtN3_saliva domain was executed employing DNAMAN (Version 7.0.2, Lynnon Biosoft, San Ramon, CA, USA), followed by the generation of sequence logos utilizing WebLogo 3 (http://weblogo.threeplusone.com) (accessed on 4 January 2023) [63,64]. To align full-length protein sequences, the Muscle tool integrated into the MEGA 7.0 software suite was utilized, facilitating the subsequent construction of a phylogenetic tree through the Neighbor-Joining (NJ) method [65], supported by 1000 bootstrap iterations. The analysis was conducted under the following parameters: application of the Poisson correction model, assumption of uniform evolutionary rates across sites, consideration of sites as homogeneous (identical), and the implementation of pair-wise deletion for handling gaps. Sequences of SWEET proteins from various species, including Arabidopsis (AtSWEET), Oryza sativa (OsSWEET), Cucumis sativus (CsSWEET), and Hemerocallis (HfSWEET), were procured from their respective species-specific genome repositories.

2.3. Analysis of Exon–Intron Structure and Conserved Motifs

The exon–intron configurations of validated SWEET genes were ascertained through comparison of their coding sequences against the complete genomic sequences found in the Grapevine Genome (12X) repository (https://www.genoscope.cns.fr/vitis/) (accessed on 5 January 2023) [22]. Illustrations of these exon–intron configurations were produced via the Gene Structure Display Server 2.0, accessible online (http://gsds.cbi.pku.edu.cn) (accessed on 5 January 2023) [66]. In addition, the conserved motifs within all SWEET proteins were delineated employing the MEME analysis platform available online (http://meme-suite.org/tools/meme) (accessed on 5 January 2023) [67], setting the limit for the number of motifs to 16 while maintaining default settings for all other parameters. Only motifs exhibiting an E-value inferior to 0.05 were considered for presentation. Furthermore, TBtools software (version 1.098) was engaged to visualize the distribution of these conserved motifs [68].

2.4. Chromosomal Localization and Synteny Analysis

Based on the physical location information from the latest version of the grape genome annotation, the chromosomal positions of each VvSWEET gene were determined [69]. MCScanX software (version 1.1.11) was used to identify and analyze the collinearity blocks between grape SWEET genes and between grape and Arabidopsis. The collinearity analysis and chromosomal localization maps were drawn using the Circos-0.69-6 program (http://circos.ca) (accessed on 10 January 2023) [70]. The non-synonymous (Ka) and synonymous (Ks) substitution rates for each gene pair were calculated using TBtools software [69]. The divergence time (T) was calculated using the Ks values with the formula: T = Ks/(2λ), where λ is the rate of divergence for the grape species, estimated at 6.5 × 10⁻⁹ [71].

2.5. Analysis of Expression Profiles in Various Organs and Different Berry Developmental Stages

VvSWEET microarray expression data from different vegetative and reproductive organs at various developmental stages were acquired from the GEO datasets from the GSE36128 series [72] (see Supplementary File: Table S1). The microarray expression data from different developmental stages of berries were obtained from the GEO database series GSE98923 [73] (see Supplementary File: Table S2).

2.6. Analysis of Expression Profiles in Different Abiotic Stress Conditions

The RNA-seq data of VvSWEET exhibit responses to cold, drought, and salt stress, derived from datasets available in the published literature as detailed below:
  • Leaves from one-year-old potted grapevine plants with cold-resistant (V. amurensis S‘huangyou’) and cold-sensitive (V. vinifera cultivar R‘ed Globe’) varieties after cold stress (0 °C) for 3, 12, 48, and 72 h [74].
  • Leaves of two-year-old potted cutting seedlings from the drought-resistant (V. yeshanensis ’Yanshan-1’) and the drought-sensitive (V. riparia’ He’an’) varieties, after drought stress for 0, 8, 16, and 24 days [75].
  • Two-year-old potted grapevine rootstocks, including the salt-tolerant varieties 3309C (V. riparia × V. rupestris), 520A (V. berlandieri × V. riparia), and 1103P (V. berlandieri × V. rupestris), as well as the salt-sensitive varieties 5BB (V. berlandieri × V. riparia), 101–14 (V. riparia × V. rupestris), and Beta (V. riparia × V. labrusca), were irrigated with a 130 mmol L−1 NaCl solution for two consecutive days to induce salt stress [76].
The RPKM (Reads Per Kilobase of transcript per Million mapped reads) values were employed to evaluate the expression of VvSWEET, and all heatmaps were produced utilizing the software package R version 4.2.2 (https://www.r-project.org/) (accessed on 10 January 2023).

2.7. Expression Profiles to Biotic Stress

Eight grapevine cultivars were selected for resistance/susceptibility to Botrytis cinerea from the grapevine germplasm resource vineyard of Northwest A&F University, Yangling, Shaanxi, China (34°20′ N, 108°24′ E). Specifically, young leaves of four resistant varieties (Red Globe’, Gebixinxiu’, Thompson Seedless’, JingXiangyu’) and four susceptible varieties (Shuangyou’, Beihong’, Beimei’, Gold Finger’) grown under natural environmental conditions [77,78,79]. Among these, young leaves from Shuangyou’ and Red Globe’ were inoculated with Botrytis cinerea as previously described [77] and collected at 0, 24, and 48 h post-inoculation. All samples were rapidly frozen in liquid nitrogen and stored at −80 °C.

2.8. RNA Extracted and qRT–PCR Analysis

Total RNA was extracted and purified using EZNA Plant RNA Kit (R6827–01, Omega Bio-tek, Norcross, GA, USA). RNA purity and quantity were determined using a NanoDrop 2000 Spectrophotometer (Thermo Fisher Scientific, Wilmington, DE, USA). Firststrand cDNA synthetization was performed using the Prime Script RT reagent Kit (TaKaRa Biotechnology, Dalian, China). The resulting cDNA was diluted sixfold for use in quantitative RT-PCR experiments. Three biological replicates were set up. Relative expression levels were calculated using the 2−ΔΔCT method with the grapevine ACTIN1 (Vitvi04g01613.t01) as a reference gene [80]. GraphPad Prism 8.0 software was used for Student’s t-test (p < 0.01) and correlation analysis (p < 0.01).

3. Results

3.1. Identification and Characterization of Grape SWEET Genes

Through the search and filtration of grapevine genomic data (https://www.genoscope.cns.fr/vitis) (accessed on 10 January 2023), we have identified a total of putative 18 SWEET genes. Given the consistency of the grapevine naming system [81] and their homology with Arabidopsis, these 18 genes were designated as VvSWEET1-VvSWEET17d (Table 2). The analysis of physicochemical properties revealed that the sizes of grapevine SWEET genes range from 606 bp (VvSWEET17a) to 897 bp (VvSWEET17d), encoding proteins between 201 to 289 amino acids in length, with an average length of 254.3 amino acids. The predicted molecular weights ranged from 22.0 to 32.8 kDa, with an average molecular weight of 28.4 kDa, and theoretical isoelectric points varied from 5.1 to 9.7. All identified grapevine SWEET proteins exhibited an average hydrophobicity index greater than 0, classifying them as hydrophobic proteins.

3.2. Phylogenetic Analysis of the Grape SWEET Proteins

To analyze the evolutionary relationships and potential functional divergences within the VvSWEET gene family, we compiled a dataset consisting of 94 SWEET protein sequences from various species, including 17 from Arabidopsis, 21 from rice, 17 from cucumber, 19 from daylily, and 18 from grape. A phylogenetic tree was constructed using the Neighbor-Joining (NJ) method (Figure 1). These SWEET proteins were divided into four typical clades. Clade I includes 4 VvSWEETs (1, 2a, 2b, 3), Clade II comprises 4 VvSWEETs (4, 5a, 5b, 7), Clade III consists of 6 VvSWEETs (9a–c, 10a, 10b, 15), and Clade IV includes 4 VvSWEETs (7a–d). Among these, five pairs of proteins, VvSWEET2a/2b, 5a/5b, 10b/15, 9a/9b, and 17b/17c, exhibit high amino acid sequence similarity and are closely branched on the phylogenetic tree, suggesting possible functional redundancy among these VvSWEET genes. In contrast, five other VvSWEET proteins (VvSWEET1, VvSWEET13, VvSWEET17, VvSWEET10a, VvSWEET17a) show lower homology compared to other family members, resulting in their distant and independent branches on the phylogenetic tree.

3.3. Analysis of Conserved Protein Motifs and Exon–Intron Structure of Grape SWEET Genes

To further understand the conservation and diversity of the grape SWEET gene family, we analyzed the conserved protein motifs encoded by the genes, identifying a total of 11 conserved motifs (Figure 2B). The phylogenetic tree constructed from the conserved domain sequences of the 18 grape SWEET proteins (Figure 2A) shares a generally consistent topology with the evolutionary tree constructed from SWEET proteins of five plant species (Figure 1). Members with similar motif compositions clustered into groups, indicating functional similarities among SWEET proteins within the same group. Motifs 1, 2, 3, 4, and 6 were found in almost all VvSWEET proteins, demonstrating their high conservation in the VvSWEET protein sequences. Motif 11 is unique to Clade II, which may be a reason for the functional diversification of VvSWEET genes. An analysis of the exon–intron structures of the 18 VvSWEET genes was also conducted (Figure 2C). The number of introns in most VvSWEET genes is relatively stable, with 14 genes having 5 introns, accounting for 77.8% of the total number of family members. Notably, VvSWEET9b exhibits the lowest intron count with only three introns. The distribution of introns shows a phase order of 1, 2, 0. VvSWEETs with closer evolutionary relationships often have similar exon–intron structures, such as the 4 members of Clade I (VvSWEET1~VvSWEET3) which have the same number of exons.

3.4. Chromosomal Distribution and Synteny Analysis among Grape SWEET Genes

Based on genomic localization data, the 18 VvSWEET genes are dispersed throughout 11 chromosomes of the grapevine (Figure 3). Chromosome 17 harbors the largest number of VvSWEET genes, totaling five, whereas Chromosome 14 and Chromosome 4 contain three and two VvSWEET genes, respectively. Chromosomes 1, 2, 5, 7, 10, 16, 17, and 19 each accommodate a single VvSWEET gene.
Segmental and tandem duplications contribute to the evolution of gene families [82]. As observed in Figure 3a, there were two segmental duplication events from VvSWEET4 to VvSWEET5a and from VvSWEET10 to VvSWEET15a, with no tandem duplications detected. This suggests that segmental duplication alone participated in the evolution of the grape SWEET gene family, indicating that large segmental chromosomal duplications are the primary mode of expansion for members of the grape SWEET family. Phylogenetic and chromosomal localization analyses revealed that all collinear gene pairs are located on different chromosomes, leading to the speculation that genes with collinearity mainly originate from inter-chromosomal segmental duplications or whole-genome duplication events. To further understand the evolutionary relationship between VvSWEET and AtSWEET genes, a collinearity analysis between the grape and Arabidopsis genomes was conducted, identifying 12 pairs of genes with collinear relationships, involving 9 VvSWEETs and 11 AtSWEETs (Figure 3b). This indicates that the large-scale expansion of these SWEET genes occurred before the divergence of grape and Arabidopsis. Phylogenetic analysis shows that each pair of collinear genes is positioned within the same branch in evolutionary terms, further supporting the reliability of the grouping. Among the VvSWEET and AtSWEET genes, there are 6 pairs with a one-to-one collinear relationship, where one AtSWEET gene corresponds to one VvSWEET gene, such as AtSWEET2-VvSWEET2b and AtSWEET3-VvSWEET3. Moreover, there are one-to-many and many-to-one collinear relationships, with the former referring to one AtSWEET gene corresponding to two or more VvSWEET genes, such as AtSWEET10-VvSWEET10b/VvSWEET15, and the latter referring to two or more AtSWEET genes corresponding to one VvSWEET gene, such as AtSWEET4/AtSWEET8-VvSWEET4.
To investigate the potential selective pressures on the duplication events of VvSWEET genes, we calculated the rates of nonsynonymous (Ka) and synonymous (Ks) substitutions. In grape and Arabidopsis, or exclusively in grape, all segmentally duplicated gene pairs exhibited a Ka/Ks ratio less than 1, indicating that they primarily evolved under purifying selection. Specifically in grape, the divergence time for segmental duplication events was estimated to be approximately 150 to 200 million years ago (Mya) (Table S3); between grape and Arabidopsis, the divergence times ranged from approximately 132 to 263 Mya, with an average of 179.7 Mya (Table S4). This suggests that the SWEET gene family was subjected to strong purifying selection following the divergence of the grape genome.

3.5. Expression Analysis of Grape SWEET Genes in Different Tissues

An expression atlas for all VvSWEET genes was constructed utilizing microarray data from 54 unique combinations of organs/tissues at varying developmental stages (Figure 4). We observed that VvSWEET7 exhibited broad expression throughout grape development, particularly showing elevated expression levels in tendrils, mature leaves, and senescing leaves. Conversely, VvSWEET17a predominantly displayed expression in young buds, leaves, and fruit skins. Notably, VvSWEET10b and VvSWEET15, closely related in the evolutionary tree of the grape SWEET gene family, demonstrated similar expression patterns, with pronounced expression in the flesh and skin of fruits during veraison and maturity. Moreover, compared to other tissue types, distinct expression patterns were observed for specific VvSWEET genes: VvSWEET1 showed heightened expression in woody stems and buds; VvSWEET5a exhibited increased expression in floral organs such as the stamen; VvSWEET9c displayed enhanced expression in seeds; and VvSWEET3 had elevated expression in the fruit peduncle.

3.6. Expression Analysis of Grape SWEET Genes during Fruit Developmental Stages

To elucidate the potential roles of VvSWEET genes in the development and ripening of grape berries, we utilized RNA sequencing data from the Gene Expression Omnibus (GEO) database. Our analysis focused on the expression patterns of VvSWEET genes across various developmental stages of grape berries (Figure 5). We identified fourteen genes that were active at different phases of berry maturation, categorizing them into two groups. The first group comprised eight VvSWEET genes, such as VvSWEET10b and VvSWEET17d, which exhibited lower expression levels during the early green fruit stage and véraison in the Tangwei’, followed by a marked increase at the ripening phase. Interestingly, this expression trajectory was not consistent across all varieties; for instance, VvSWEET10b did not demonstrate a notable change in expression in the Tonghua-3’. Meanwhile, genes like VvSWEET4 and VvSWEET7 showed varying degrees of upregulation in both Tangwei’ and Tonghua’. The second group, including six genes such as VvSWEET17a and VvSWEET17b, displayed higher expression during the green fruit stage, with a subsequent decrease as the fruit developed.

3.7. Expression Patterns of Grape SWEET Genes under Abiotic Stress Conditions

Utilizing published grapevine transcriptome datasets, we analyzed the expression patterns of VvSWEET under various abiotic stress conditions, including cold, drought, and salt stress. The datasets include numerous resources from wild grape species in China, such as Vitis amurensis, Vitis yeshanensis, and Vitis bryoniifolia, among others. Due to the diversity of their native environments, these wild grapes typically exhibit superior adaptability and resistance. These characteristics make them ideal subjects for studying the response of grapevines to abiotic stress. Utilizing transcriptomic data from these representative varieties helps us to uncover the expression differences of the SWEET gene family members under abiotic stress conditions.
Under salt stress, Clade I members (VvSWEET1, VvSWEET2b, VvSWEET3) and Clade IV’s VvSWEET17a showed variable upregulation, with VvSWEET1 and VvSWEET2b experiencing notably significant increases (Figure 6A). Conversely, Clade II and III members experienced slight downregulation across various grape varieties. Similarly, under drought stress, the expression patterns of SWEET genes mirrored those observed under salt stress. Specifically, VvSWEET1, VvSWEET2b, VvSWEET3, and VvSWEET17a were upregulated to varying extents, while the expression of other members decreased following stress induction (Figure 6B). After exposure to low temperatures, Clade I genes again showed differential upregulation, with VvSWEET1 registering the most significant increase. In contrast, cold stress led to the suppression of most VvSWEET genes’ expression levels (Figure 6C).

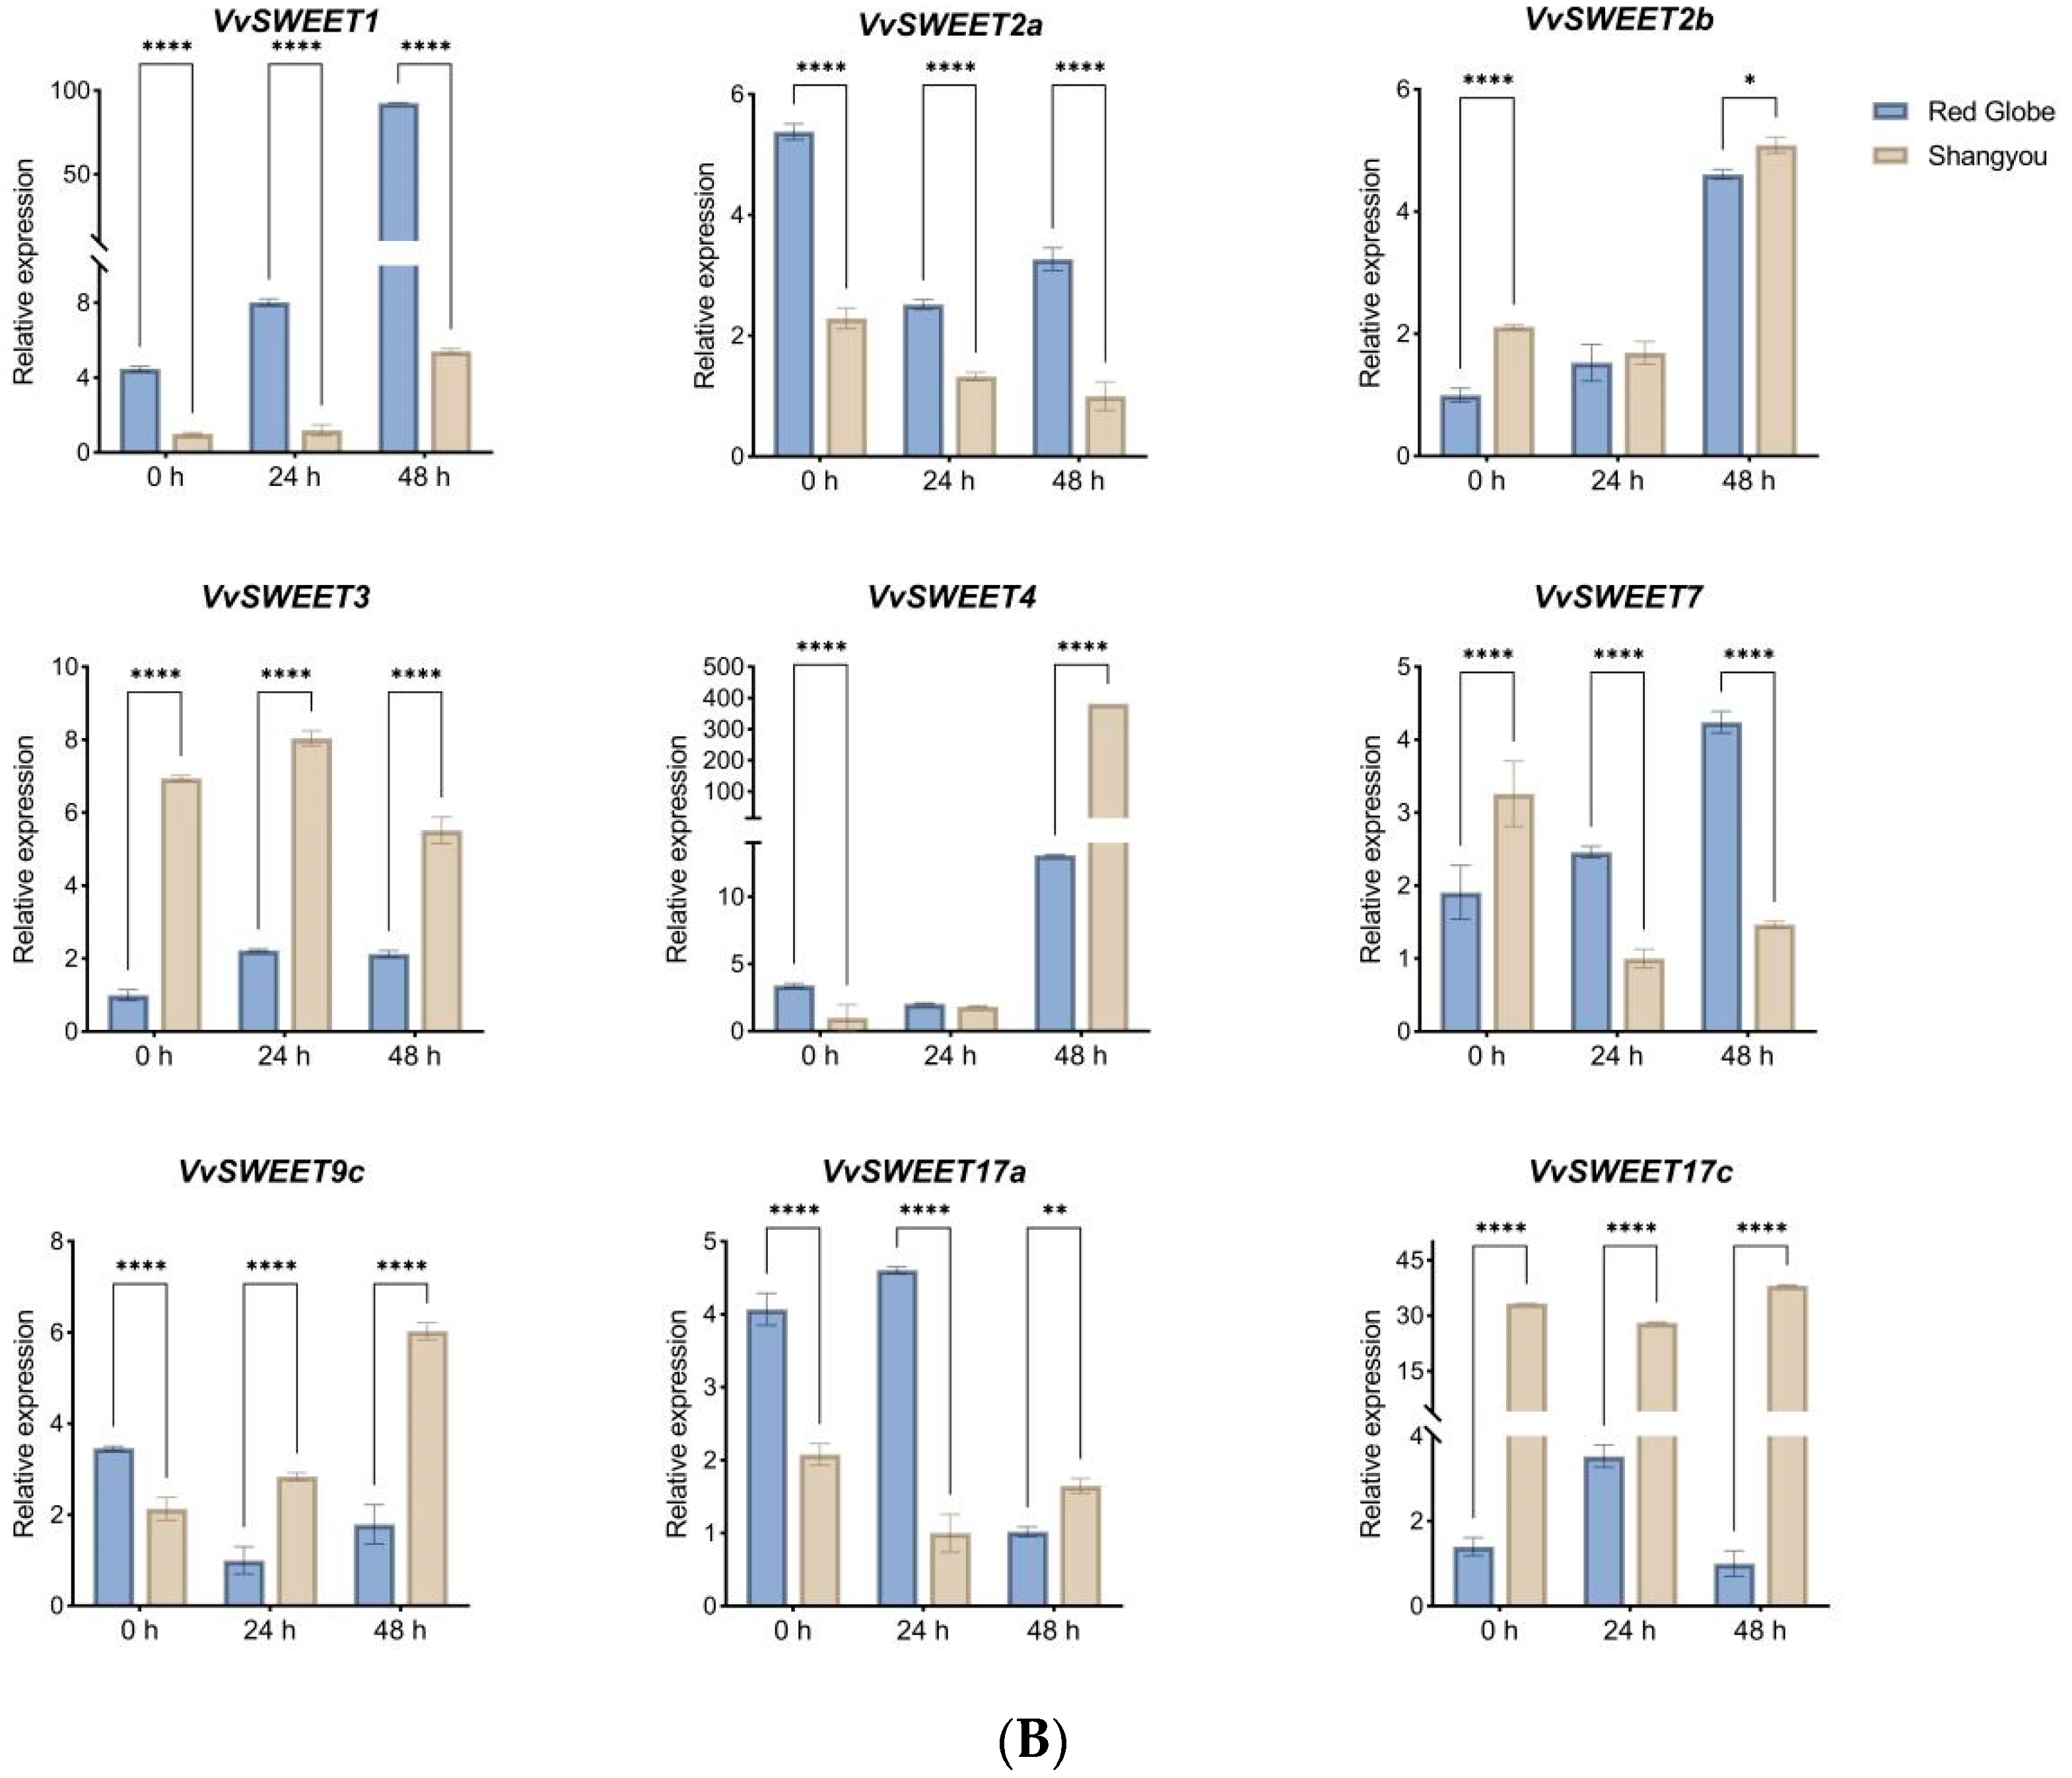
3.8. qRT-PCR Analysis of VvSWEET Genes in Relation to Grape Botrytis cinerea Infection

Beyond abiotic stress, our research further investigated the expression dynamics of VvSWEET genes within grapes subjected to biotic stress. Employing qRT-PCR for rigorous quantification, we analyzed the expression profiles of VvSWEET genes in four Botrytis cinerea-resistant grape varieties versus four susceptible varieties (Figure 7A). The analysis unveiled notable disparities in the expression levels of select VvSWEET genes between the resistant and susceptible groups. Specifically, VvSWEET1 and VvSWEET10b exhibited elevated expressions in the susceptible varieties, whereas VvSWEET3 demonstrated enhanced expression in the resistant varieties. To delve deeper into the role of VvSWEET genes in grape leaf response to Botrytis cinerea infection, we inoculated leaves from the susceptible R‘ed Globe’ variety alongside those from the highly resistant S‘huangyou’ variety, observed the entity of the disease (Figure S1) and subsequently analyzed VvSWEET gene expression patterns at various intervals post-inoculation. The qRT-PCR findings highlighted a significant induction of VvSWEET1, VvSWEET2b, VvSWEET3, and VvSWEET4 expression levels post-infection. Particularly, from 0 to 48 h post-inoculation, R‘ed Globe’ leaves manifested consistently higher expression levels of VvSWEET1 and VvSWEET2a compared to S‘huangyou’ leaves (Figure 7B); conversely, the expression trends of VvSWEET3 and VvSWEET17c exhibited an inverse relationship.

4. Discussion

In this study, bioinformatics methods were utilized to identify a total of 18 VvSWEET genes from the grape genome. These genes were named according to the naming convention as VvSWEETs (Table 2), and their genomic locations were annotated on specific chromosomes (Figure 3). Table 2 provides detailed information about these genes, including gene ID, accession number, and the physicochemical properties of the encoded proteins. This research identified one more gene than previously reported studies, thanks to the utilization of a newly assembled grape genome. Furthermore, we discovered that among plants, wheat (Triticum aestivum) has the highest number of SWEET members, totaling 105, while loquat (Eriobotrya japonica) has the fewest, with only 7 members. In allohexaploid species such as bread wheat, the presence of each genome may contribute to additional copies of SWEET genes. Consequently, compared to other diploid or lower ploidy plant species, there is a greater likelihood of increased expression and functional diversification of SWEET genes. The significant variation in gene numbers across different plants may be attributed to genomic sequences that have not yet been sequenced, or it may reflect species-specific duplications or deletions that occurred during the evolutionary process.
We conducted a phylogenetic analysis of SWEET protein sequences from grapes and four other plant species. The phylogenetic tree indicates that grape SWEET proteins are more closely related to those from Arabidopsis and cucumber, suggesting a closer evolutionary relationship with dicots than with monocots like rice and daylily, which might be attributed to the more recent divergence of dicotyledonous plants. The 18 grape SWEET proteins can be classified into four distinct clades. Within the same clade, the distribution of motifs among VvSWEET proteins was generally similar, though there were exceptions (Figure 3). For instance, Motif 11 was unique to members of Clade II, while in Clade III, Motif 7 was only present in two genes, VvSWEET9a and VvSWEET9b, and Motif 9 was exclusive to three genes, VvSWEET10a, VvSWEET10b, and VvSWEET15; Motif 2 was absent only in VvSWEET9b. These findings suggest that these VvSWEET proteins may possess unique functions.
The structure of introns and exons is closely related to gene evolution [83]. We found that the number of exons in the 18 VvSWEET genes was stable, with most SWEET genes containing 6 exons, and a minority, constituting 22.2% of the family, having only 4–5 exons. This is similar to the proportions observed in the SWEET families of pear [37], tomato [20], soybean [35], and pineapple [12], indicating a conserved number and position of introns across different species. VvSWEET genes with similar exon–intron structures clustered together in the phylogenetic tree. Specifically, two pairs of genes (VvSWEET4/VvSWEET5a and VvSWEET10/VvSWEET15a) had the same number of exons and almost identical exon lengths (Figure 2C), suggesting they may have arisen from segmental or tandem duplications, a hypothesis supported by collinearity analysis results (Figure 3). These results further demonstrate the evolutionary conservation of SWEET proteins. Additionally, the gain or loss of introns can lead to structural complexity, a key evolutionary mechanism in most gene families. The first two exons of VvSWEET genes are relatively short and may be easily lost during evolution. We observed exon–intron loss, with VvSWEET9a containing six exons while its paralog, VvSWEET9b, contained only four exons (Figure 2C). This indicates that VvSWEET9b may have lost two exons during evolution, undergoing a deletion of genetic information. Similar findings were reported in two members of the pear SWEET family, PbSWEET8 and PbSWEET16 [37]. This evolutionary mechanism leads to a more complex gene structure and diverse gene functions, preventing functional redundancy within the gene family. Notably, the distribution of introns in the grape SWEET gene family exhibits a phase pattern of 1, 2, 0, perhaps explaining why introns with phase 2 in the middle sequences of genes are conserved and do not undergo structural loss. From the results of the conserved domain distribution, most SWEET genes contain eight conserved domains, with some experiencing the loss of individual domains, resulting in only seven or six conserved domains. The loss of sequences at both ends of the genes led to the corresponding loss of conserved domains, with both results being interrelated. The distribution of domains on the genes, showing their appearance order and location to be largely consistent, indirectly reflects the high level of conservation in the grape SWEET gene family.
Segmental duplication and tandem duplication are significant driving forces behind the expansion of gene families. In this study, we identified two pairs of segmentally duplicated genes on grape chromosomes 1, 14, and 17, but no tandem duplications were detected (Figure 3). Additionally, the segmentally duplicated gene pairs (e.g., VvSWEET4/VvSWEET5a) were located in the same group and exhibited similar exon–intron structures (Figure 2), indicating that segmental duplication has contributed to the expansion of the SWEET gene family in grape. We also identified 12 pairs of genes with collinearity, deriving from segmental duplications between grape and Arabidopsis, suggesting they may have a common ancestor. Therefore, the biological functions of grape SWEET genes can be preliminarily predicted based on the functions of their Arabidopsis SWEET homologs.
Previous studies have confirmed that the SWEET gene family plays roles in different tissues and organs during plant growth and development. Analysis of the expression patterns of SWEET genes in different tissues of grape reveals that VvSWEET10b and VvSWEET15 are highly expressed in the flesh and grape SWEET gene family skin of the fruit. The tissue-specific expression patterns of these two genes are very similar, which may be related to their close phylogenetic relationship within the and their nearly identical gene structures. VvSWEET5a is expressed significantly higher in flowers than in other tissues, leading to the preliminary prediction that this gene may be related to grape reproductive development. This suggests that the functional differentiation of SWEET genes is closely related to their expression patterns in different tissues, highlighting the importance of studying these genes for understanding the molecular mechanisms underlying plant development and stress responses.
Fruit maturation is a complex biological process. The sugars accumulated in grapefruits mainly consist of fructose and glucose, with a small amount of sucrose. During the growth and development of the fruit, sugars are transported from the source organs (leaves) to the fruit’s vascular bundle phloem in the form of sucrose via long-distance transport through the phloem, and then from the phloem parenchyma cells to the phloem apoplast. Members of the SWEET gene family, localized on the plasma membrane, are required to transfer sucrose from the phloem parenchyma through the apoplast into the sieve tubes and companion cells. SWEET proteins have been reported to play a key role in the development and maturation of fruits, including apples [13], pears [37], tomatoes [20], citrus [33], and pineapple [12], especially in terms of sugar accumulation. In this study, the expression of nearly all SWEET genes changed during the fruit maturation process. VvSWEET4, VvSWEET7, VvSWEET10a, VvSWEET10b, and others were upregulated from the green fruit stage to the ripening process, showing a positive correlation with sugar accumulation in the fruit. Conversely, VvSWEET3, VvSWEET17a, VvSWEET17b, VvSWEET17c, etc., were downregulated, showing a negative correlation with sugar accumulation. We speculate that VvSWEET4 and VvSWEET7 genes mainly function in the transport and accumulation of sugars during fruit maturation, while VvSWEET3 mainly functions in the transport and accumulation of sugars during the immature stage of fruit development. In apples, MdSWEET1.1/2, MdSWEET2.4, and MdSWEET3.5 have higher expression levels in young fruits, while MdSWEET3.6/7 are more expressed in larger fruits. Notably, unlike pineapple SWEETs, which show high levels of expression in the early stages of fruit development [11], in grapes, there are many genes that show high levels of expression during the maturation stage, suggesting that the SWEET gene family may play a more important role in the maturation period of grapefruit development. Overall, the study of the function of SWEET genes in grapefruits provide a new direction for future research, which is crucial for improving the quality of grapefruits.
Soluble sugars are crucial sources of energy and matter within cells. When plants face adverse environmental stress, the redistribution of soluble sugars in tissues can be modulated to maintain cellular osmotic potential balance, thereby enhancing their resistance to stress and ensuring normal growth. Sugar transport proteins are key factors in regulating the redistribution of soluble sugars, and the role of SWEET proteins in responding to various stress responses has been extensively documented. In Arabidopsis, several SWEET genes, such as AtSWEET17, AtSWEET16, AtSWEET12, AtSWEET11, and AtSWEET4, are closely linked to stress responses. They participate in the development of plant shoots or roots and regulate responses to abiotic stress through the modulation of sugar transport [84]. AtSWEET15 (SAG29), a plasma membrane-localized transporter, has its expression induced by osmotic stress through the ABA pathway and is associated with cell viability under high salinity and other osmotic stress conditions [17]. AtSWEET4 enhances plant frost resistance; AtSWEET4-RNAi interference lines show reduced sugar accumulation and increased sensitivity to frost damage, whereas AtSWEET4-OE lines accumulate more sugar, exhibiting greater frost resistance [85]. In tea plants, the vacuolar-membrane-localized CsSWEET16 protein promotes the compartmentalization of sugars within vacuoles and improves drought resistance in Arabidopsis [40]; the expression of CsSWEET1a and CsSWEET17 can be induced by cold stress, and their overexpression in Arabidopsis enhances plant cold tolerance, further confirming their protective role against frost damage [86]. A genome-wide analysis of cabbage SWEET identified a candidate SWEET gene that could enhance plant cold tolerance through the promotion of sugar transport [42]. Additionally, in banana, the upregulation of MaSWEETs expression plays a significant role in responding to low temperature, salt stress, and osmotic stress [25]. Upon exposure to low temperature and other stress conditions, soluble sugars accumulate within cells. Vacuoles, which account for about 90% of plant cell volume, play a key role in the temporary and long-term storage of soluble sugars. The sugar storage capacity of vacuoles is crucial for regulating osmotic homeostasis; a significant increase in monosaccharide content within vacuoles can stabilize cell membranes, protect membrane proteins, and act as osmolytes and antifreeze agents, thereby enhancing plant stress resistance. We found that most genes in the grape SWEET family are downregulated under stress conditions such as salt, drought, and low temperature, while most members of Clade 1, such as VvSWEET1, VvSWEET2b, and VvSWEET3, are upregulated. Similarly, under the biotic stress of Botrytis cinerea infection, members of Clade 1 exhibit a higher level of induction compared to other VvSWEET members, with certain genes displaying significant differences between disease-resistant and susceptible varieties. Studies suggest that Clade 1 members, which are localized on vacuolar membranes and mainly transport glucose, may play a role in enhancing plant stress resistance. It is speculated that grapes might induce the expression of Clade 1 members of the VvSWEET family, particularly VvSWEET1, to transport more glucose into vacuoles, leading to feedback regulation of sugar metabolism and thus affecting the content changes of other carbohydrates, regulating plant stress resistance.

5. Conclusions

In this study, we identified 18 VvSWEET genes based on the latest version of the grape genome annotation. A comprehensive analysis of the SWEET gene family was conducted, encompassing phylogenetic relationships, gene structure, conserved motifs, chromosomal localization, gene collinearity, and expression patterns. The expression profiles of VvSWEET genes under various abiotic and biotic stress conditions, throughout fruit maturation, and in different tissues and organs suggest their significant roles in grape growth, development, and response to diverse stress conditions. Overall, this whole-genome analysis of the VvSWEET family provides a foundation for further research on the functions of SWEET genes in grapes, contributing to our understanding of the molecular mechanisms underlying grape development and stress adaptation.

Supplementary Materials

The following supporting information can be downloaded at: https://www.mdpi.com/article/10.3390/horticulturae10050428/s1, Figure S1: Disease development after inoculation of leaves from the highly susceptible Vitis vinifera Red Globe and the highly resistant Vitis amurensis shuangyou; Table S1: Description of sample of Vitis vinifera cultivar used for microarray analysis; Table S2: Description of sample used for microarray analysis; Table S3: Segmental duplications within grapevine VvSWEET genes and Ka/Ks ratios analysis of segmental duplicate gene pairs; Table S4: Segmental duplications of SWEET genes between grapevine and Arabidopsis and Ka/Ks ratios analysis of segmental duplicate gene pair.

Author Contributions

Data curation, S.X. and Y.L.; formal analysis, S.X; funding acquisition, M.G.; investigation, Z.Y.; proiect administration, M.G.; resources, X.C. and J.Z.; supervision, X.W. and M.G.; validation, C.S. and N.Z.; writing—original draft, L.Z.; writing—review & editing, S.X. and Z.L. All authors have read and agreed to the published version of the manuscript.

Funding

This research was funded by the National Natural Science Foundation of China Grant No. 32302502 and the Natural Science Basic Research Program of Shaanxi (2022JQ-161).

Data Availability Statement

The original contributions presented in the study are included in the article and Supplementary Materials, further inquiries can be directed to the corresponding author.

Conflicts of Interest

The authors declare no conflicts of interest.

References

  1. Yamada, K.; Osakabe, Y. Sugar compartmentation as an environmental stress adaptation strategy in plants. Semin. Cell Dev. Biol. 2017, 83, 106–114. [Google Scholar] [CrossRef]
  2. Pommerrenig, B.; Ludewig, F.; Cvetkovic, J.; Trentmann, O.; Klemens, P.A.W.; Neuhaus, H.E. In Concert: Orchestrated Changes in Carbohydrate Homeostasis Are Critical for Plant Abiotic Stress Tolerance. Plant Cell Physiol. 2018, 59, 1290–1299. [Google Scholar] [CrossRef] [PubMed]
  3. Lalonde, S.; Wipf, D.; Frommer, W.B. Transport mechanisms for organic forms of carbon and nitrogen between source and sink. Annu. Rev. Plant Biol. 2004, 55, 341–372. [Google Scholar] [CrossRef] [PubMed]
  4. Slewinski, T.L. Diverse functional roles of monosaccharide transporters and their homologs in vascular plants: A physiological perspective. Mol. Plant 2011, 4, 641–662. [Google Scholar] [CrossRef] [PubMed]
  5. Kühn, C.; Grof, C.P. Sucrose transporters of higher plants. Curr. Opin. Plant Biol. 2010, 13, 288–298. [Google Scholar] [CrossRef] [PubMed]
  6. Chen, L.Q.; Hou, B.H.; Lalonde, S.; Takanaga, H.; Hartung, M.L.; Qu, X.Q.; Guo, W.J.; Kim, J.G.; Underwood, W.; Chaudhuri, B.; et al. Sugar transporters for intercellular exchange and nutrition of pathogens. Nature 2010, 468, 527–532. [Google Scholar] [CrossRef]
  7. Chen, L.Q.; Qu, X.Q.; Hou, B.H.; Sosso, D.; Osorio, S.; Fernie, A.R.; Frommer, W.B. Sucrose efflux mediated by SWEET proteins as a key step for phloem transport. Science 2012, 335, 207–211. [Google Scholar] [CrossRef] [PubMed]
  8. Eom, J.S.; Chen, L.Q.; Sosso, D.; Julius, B.T.; Lin, I.W.; Qu, X.Q.; Braun, D.M.; Frommer, W.B. SWEETs, transporters for intracellular and intercellular sugar translocation. Curr. Opin. Plant Biol. 2015, 25, 53–62. [Google Scholar] [CrossRef] [PubMed]
  9. Kanno, Y.; Oikawa, T.; Chiba, Y.; Ishimaru, Y.; Shimizu, T.; Sano, N.; Koshiba, T.; Kamiya, Y.; Ueda, M.; Seo, M. AtSWEET13 and AtSWEET14 regulate gibberellin-mediated physiological processes. Nat. Commun. 2016, 7, 13245–13256. [Google Scholar] [CrossRef]
  10. Sosso, D.; Luo, D.; Li, Q.B.; Sasse, J.; Yang, J.; Gendrot, G.; Suzuki, M.; Koch, K.E.; McCarty, D.R.; Chourey, P.S.; et al. Seed filling in domesticated maize and rice depends on SWEET-mediated hexose transport. Nat. Genet. 2015, 47, 1489–1493. [Google Scholar] [CrossRef]
  11. Wu, L.-B.; Eom, J.-S.; Isoda, R.; Li, C.; Char, S.N.; Luo, D.; Schepler-Luu, V.; Nakamura, M.; Yang, B.; Frommer, W.B. OsSWEET11b, a potential sixth leaf blight susceptibility gene involved in sugar transport-dependent male fertility. New Phytol. 2022, 234, 975–989. [Google Scholar] [CrossRef] [PubMed]
  12. Guo, C.Y.; Li, H.Y.; Xia, X.Y.; Liu, X.Y.; Yang, L. Functional and evolution characterization of SWEET sugar transporters in Ananas comosus. Biochem. Biophys. Res. Commun. 2018, 496, 407–414. [Google Scholar] [CrossRef] [PubMed]
  13. Zhen, Q.L.; Fang, T.; Peng, Q.; Liao, L.; Zhao, L.; Owiti, A.; Han, Y.P. Developing gene-tagged molecular markers for evaluation of genetic association of apple SWEET genes with fruit sugar accumulation. Hortic. Res. 2018, 5, 14. [Google Scholar] [CrossRef] [PubMed]
  14. Zhou, Y.; Liu, L.; Huang, W.; Yuan, M.; Zhou, F.; Li, X.; Lin, Y. Overexpression of OsSWEET5 in rice causes growth retardation and precocious senescence. PLoS ONE 2014, 9, e94210. [Google Scholar] [CrossRef] [PubMed]
  15. Klemens, P.A.W.; Patzke, K.; Krapp, A.; Chardon, F.; Neuhaus, H.E. SWEET16 and SWEET17, two novel vacuolar sugar carriers with impact on cellular sugar homeostasis and plant traits. Biochem. Cell Biol. 2014, 92, 589. [Google Scholar]
  16. Yue, C.; Cao, H.; Wang, L.; Zhou, Y.; Huang, Y.; Hao, X.; Wang, Y.; Wang, B.; Yang, Y.; Wang, X. Effects of cold acclimation on sugar metabolism and sugar-related gene expression in tea plant during the winter season. Plant Mol. Biol. 2015, 88, 591–608. [Google Scholar] [CrossRef] [PubMed]
  17. Seo, P.J.; Park, J.M.; Kang, S.K.; Kim, S.G.; Park, C.M. An Arabidopsis senescence-associated protein SAG29 regulates cell viability under high salinity. Planta 2011, 233, 189–200. [Google Scholar] [CrossRef] [PubMed]
  18. Julius, B.T.; Leach, K.A.; Tran, T.M.; Mertz, R.A.; Braun, D.M. Sugar Transporters in Plants: New Insights and Discoveries. Plant Cell Physiol. 2017, 58, 1442–1460. [Google Scholar] [CrossRef] [PubMed]
  19. Durand, M.; Porcheron, B.; Hennion, N.; Maurousset, L.; Lemoine, R. Water deficit enhances C export to the roots in Arabidopsis thaliana plants with contribution of sucrose transporters in both shoot and roots. Plant Physiol. 2016, 170, 1460–1479. [Google Scholar] [CrossRef]
  20. Feng, C.Y.; Han, J.X.; Han, X.X.; Jiang, J. Genome-wide identification, phylogeny, and expression analysis of the SWEET gene family in tomato. Gene 2015, 573, 261–272. [Google Scholar] [CrossRef]
  21. Streubel, J.; Pesce, C.; Hutin, M.; Koebnik, R.; Boch, J.; Szurek, B. Five phylogenetically close rice SWEET genes confer TAL effector-mediated susceptibility to Xanthomonas oryzae pv. oryzae. New Phytol. 2013, 200, 808–819. [Google Scholar] [CrossRef] [PubMed]
  22. Jaillon, O.; Aury, J.-M.; Noel, B.; Policriti, A.; Clepet, C.; Casagrande, A.; Choisne, N.; Aubourg, S.; Vitulo, N.; Jubin, C.; et al. The grapevine genome sequence suggests ancestral hexaploidization in major angiosperm phyla. Nature 2007, 449, 463–467. [Google Scholar] [PubMed]
  23. Yuan, M.; Wang, S. Rice MtN3/saliva/SWEET family genes and their homologs in cellular organisms. Mol. Plant. 2013, 6, 665–674. [Google Scholar] [CrossRef] [PubMed]
  24. Mizuno, H.; Kasuga, S.; Kawahigashi, H. The sorghum SWEET gene family: Stem sucrose accumulation as revealed through transcriptome profiling. Biotechnol. Biofuels 2016, 9, 127. [Google Scholar] [CrossRef] [PubMed]
  25. Miao, H.; Sun, P.; Liu, Q.; Miao, Y.; Liu, J.; Zhang, K.; Hu, W.; Zhang, J.; Wang, J.; Wang, Z.; et al. Genome-wide analyses of SWEET family proteins reveal involvement in fruit development and abiotic/biotic stress responses in banana. Sci Rep 2017, 7, 3536. [Google Scholar] [CrossRef] [PubMed]
  26. Zhang, Y.; Hao, L.; Wang, N.; Bai, X.L.; Zhang, Y.M. Transcriptome-wide identification and expression profiling of the SWEET family in Bletilla striata and regulation analysis with non-coding RNAs. Ind. Crop. Prod. 2023, 201, 116876. [Google Scholar] [CrossRef]
  27. Hu, W.; Hua, X.; Zhang, Q.; Wang, J.; Shen, Q.; Zhang, X.; Wang, K.; Yu, Q.; Lin, Y.R.; Ming, R.; et al. New insights into the evolution and functional divergence of the SWEET family in Saccharum based on comparative genomics. BMC Plant Biol. 2018, 18, 270. [Google Scholar] [CrossRef] [PubMed]
  28. Zhu, J.L.; Zhou, L.; Li, T.F.; Ruan, Y.Y.; Zhang, A.; Dong, X.M.; Zhu, Y.S.; Li, C.; Fan, J.J. Genome-Wide Investigation and Characterization of SWEET Gene Family with Focus on Their Evolution and Expression during Hormone and Abiotic Stress Response in Maize. Genes 2022, 13, 1682. [Google Scholar] [CrossRef]
  29. Wen, Z.Y.; Li, M.Y.; Meng, J.; Li, P.; Cheng, T.R.; Zhang, Q.X.; Sun, L.D. Genome-wide identification of the SWEET gene family mediating the cold stress response in Prunus mume. PeerJ 2022, 10, e13273. [Google Scholar] [CrossRef]
  30. Gao, Y.; Wang, Z.Y.; Kumar, V.; Xu, X.F.; Yuan, D.P.; Zhu, X.F.; Li, T.Y.; Jia, B.L.; Xuan, Y.H. Genome-wide identification of the SWEET gene family in wheat. Gene 2018, 642, 284–292. [Google Scholar] [CrossRef]
  31. Yue, W.H.; Cai, K.F.; Xia, X.; Liu, L.; Wang, J.M. Genome-wide identification, expression pattern and genetic variation analysis of SWEET gene family in barley reveal the artificial selection of HvSWEET1a during domestication and improvement. Front. Plant Sci. 2023, 14, 1137434. [Google Scholar] [CrossRef] [PubMed]
  32. Cohn, M.; Bart, R.S.; Shybut, M.; Dahlbeck, D.; Gomez, M.; Morbitzer, R.; Hou, B.H.; Frommer, W.B.; Lahaye, T.; Staskawicz, B.J. Xanthomonas axonopodis virulence is promoted by a transcription activator-like effector–mediated induction of a SWEET sugar transporter in cassava. Mol. Plant-Microbe Interact. 2014, 27, 1186–1198. [Google Scholar] [CrossRef] [PubMed]
  33. Zheng, Q.; Tang, Z.; Xu, Q.; Deng, X.X. Isolation, phylogenetic relationship and expression profiling of sugar transporter genes in sweet orange (Citrus sinensis). Plant Cell Tissue Organ Cult. 2014, 119, 609–624. [Google Scholar] [CrossRef]
  34. Yin, Q.; Zhu, L.; Du, P.; Fan, C.; Wang, J.; Zhang, B.; Li, H. Comprehensive analysis of SWEET family genes in Eucalyptus (Eucalyptus grandis). Biotechnol. Biotechnol. Equip. 2020, 34, 595–604. [Google Scholar] [CrossRef]
  35. Patil, G.; Valliyodan, B.; Deshmukh, R.; Prince, S.; Nicander, B.; Zhao, M.Z.; Sonah, H.; Song, L.; Lin, L.; Chaudhary, J.; et al. Soybean (Glycine max) SWEET gene family: Insights through comparative genomics, transcriptome profiling and whole genome re-sequence analysis. BMC Genomics 2015, 16, 520. [Google Scholar] [CrossRef] [PubMed]
  36. Manck-Götzenberger, J.; Requena, N. Arbuscular mycorrhiza symbiosis induces a major transcriptional reprogramming of the potato SWEET sugar transporter family. Front. Plant Sci. 2016, 7, 487. [Google Scholar] [CrossRef] [PubMed]
  37. Li, J.; Qin, M.; Qiao, X.; Cheng, Y.; Li, X.; Zhang, H.; Wu, J. A new insight into the evolution and functional divergence of SWEET transporters in Chinese white pear (Pyrus bretschneideri). Plant Cell Physiol. 2017, 58, 839–850. [Google Scholar] [CrossRef] [PubMed]
  38. Li, W.; Ren, Z.Y.; Wang, Z.Y.; Sun, K.; Pei, X.Y.; Liu, Y.G.; He, K.L.; Zhang, F.; Song, C.X.; Zhou, X.J.; et al. Evolution and Stress Responses of Gossypium hirsutum SWEET Genes. Int. J. Mol. Sci. 2018, 19, 769. [Google Scholar] [CrossRef] [PubMed]
  39. Wang, L.; Yao, L.; Hao, X.; Li, N.; Qian, W.; Yue, C.; Ding, C.; Zeng, J.; Yang, Y.; Wang, X. Tea plant SWEET transporters: Expression profiling, sugar transport, and the involvement of CsSWEET16 in modifying cold tolerance in Arabidopsis. Plant Mol. Biol. 2018, 96, 577–592. [Google Scholar] [CrossRef]
  40. Xie, H.H.; Wang, D.; Qin, Y.Q.; Ma, A.N.; Fu, J.X.; Qin, Y.H.; Hu, G.B.; Zhao, J.T. Genome-wide identification and expression analysis of SWEET gene family in Litchi chinensis reveal the involvement of LcSWEET2a/3b in early seed development. BMC Plant Biol. 2019, 19, 499. [Google Scholar] [CrossRef]
  41. Hu, B.; Wu, H.; Huang, W.F.; Song, J.B.; Zhou, Y.; Lin, Y.J. SWEET Gene Family in Medicago truncatula: Genome-Wide Identification, Expression and Substrate Specificity Analysis. Plants 2019, 8, 338. [Google Scholar] [CrossRef]
  42. Zhang, W.; Wang, S.; Yu, F.W.; Tang, J.; Shan, X.; Bao, K.; Yu, L.; Wang, H.; Fei, Z.J.; Li, J.B. Genome-wide characterization and expression profiling of SWEET genes in cabbage (Brassica oleracea var. capitata L.) reveal their roles in chilling and clubroot disease responses. BMC Genomics 2019, 20, 93. [Google Scholar] [CrossRef] [PubMed]
  43. Jiang, S.J.; Balan, B.; Assis, R.D.B.; Sagawa, C.H.D.; Wan, X.Q.; Han, S.; Wang, L.; Zhang, L.L.; Zaini, P.A.; Walawage, S.L.; et al. Genome-Wide Profiling and Phylogenetic Analysis of the SWEET Sugar Transporter Gene Family in Walnut and Their Lack of Responsiveness to Xanthomonas arboricola pv. juglandis Infection. Int. J. Mol. Sci. 2020, 21, 1251. [Google Scholar] [CrossRef]
  44. Xuan, C.Q.; Lan, G.P.; Si, F.F.; Zeng, Z.L.; Wang, C.X.; Yadav, V.; Wei, C.H.; Zhang, X. Systematic Genome-Wide Study and Expression Analysis of SWEET Gene Family: Sugar Transporter Family Contributes to Biotic and Abiotic Stimuli in Watermelon. Int. J. Mol. Sci. 2021, 22, 8407. [Google Scholar] [CrossRef]
  45. Zhang, X.H.; Wang, S.; Ren, Y.; Gan, C.Y.; Li, B.B.; Fan, Y.Y.W.; Zhao, X.Q.; Yuan, Z.H. Identification, Analysis and Gene Cloning of the SWEET Gene Family Provide Insights into Sugar Transport in Pomegranate (Punica granatum). Int. J. Mol. Sci. 2022, 23, 2471. [Google Scholar] [CrossRef]
  46. Fang, T.; Rao, Y.; Wang, M.Z.; Li, Y.; Liu, Y.J.; Xiong, P.P.; Zeng, L.H. Characterization of the SWEET Gene Family in Longan (Dimocarpus longan) and the Role of DlSWEET1 in Cold Tolerance. Int. J. Mol. Sci. 2022, 23, 8914. [Google Scholar] [CrossRef] [PubMed]
  47. La, H.V.; Chu, H.D.; Ha, Q.T.; Tran, T.T.H.; Tong, H.V.; Tran, T.V.; Le, Q.T.N.; Bui, H.T.T.; Cao, P.B. SWEET Gene Family in Sugar Beet (Beta vulgaris): Genome-Wide Survey, Phylogeny and Expression analysis. Pak. J. Biol. Sci. 2022, 25, 387–395. [Google Scholar]
  48. Song, X.S.; Kou, Y.P.; Duan, M.G.; Feng, B.; Yu, X.Y.; Jia, R.D.; Zhao, X.; Ge, H.; Yang, S.H. Genome-Wide Identification of the Rose SWEET Gene Family and Their Different Expression Profiles in Cold Response between Two Rose Species. Plants 2023, 12, 1474. [Google Scholar] [CrossRef] [PubMed]
  49. Jiang, C.C.; Zeng, S.M.; Yang, J.; Wang, X.A. Genome-Wide Identification and Expression Profiling Analysis of SWEET Family Genes Involved in Fruit Development in Plum (Prunus salicina Lindl). Genes 2023, 14, 1679. [Google Scholar] [CrossRef]
  50. Han, X.W.; Han, S.; Zhu, Y.X.; Liu, Y.Q.; Gao, S.H.; Yin, J.L.; Wang, F.; Yao, M.H. Genome-Wide Identification and Expression Analysis of the SWEET Gene Family in Capsicum annuum L. Int. J. Mol. Sci. 2023, 24, 17408. [Google Scholar] [CrossRef]
  51. Liu, N.; Wei, Z.; Min, X.; Yang, L.; Zhang, Y.; Li, J.; Yang, Y. Genome-Wide Identification and Expression Analysis of the SWEET Gene Family in Annual Alfalfa (Medicago polymorpha). Plants 2023, 12, 1948. [Google Scholar] [CrossRef] [PubMed]
  52. Yang, C.; Zhao, X.; Luo, Z.; Wang, L.H.; Liu, M.J. Genome-wide identification and expression profile analysis of SWEET genes in Chinese jujube. PeerJ 2023, 11, e14704. [Google Scholar] [CrossRef] [PubMed]
  53. Zhang, H.; Ding, Y.T.; Yang, K.Y.; Wang, X.Y.; Gao, W.S.; Xie, Q.J.; Liu, Z.Y.; Gao, C.Q. An Insight of Betula platyphylla SWEET Gene Family through Genome-Wide Identification, Expression Profiling and Function Analysis of BpSWEET1c under Cold Stress. Int. J. Mol. Sci. 2023, 24, 13626. [Google Scholar] [CrossRef] [PubMed]
  54. Iqbal, J.; Zhang, W.H.; Fan, Y.D.; Dong, J.; Xie, Y.Y.; Li, R.H.; Yang, T.; Zhang, J.Z.; Che, D.D. Genome-Wide Bioinformatics Analysis of SWEET Gene Family and Expression Verification of Candidate PaSWEET Genes in Potentilla anserina. Plants 2024, 13, 406. [Google Scholar] [CrossRef] [PubMed]
  55. Canaguier, A.; Grimplet, J.; Di Gaspero, G.; Scalabrin, S.; Duchêne, E.; Choisne, N.; Mohellibi, N.; Guichard, C.; Rombauts, S.; Le Clainche, I.; et al. A new version of the grapevine reference genome assembly (12X. v2) and of its annotation (VCost. v3). Genom Data 2017, 14, 56–62. [Google Scholar] [CrossRef] [PubMed]
  56. El-Gebali, S.; Mistry, J.; Bateman, A.; Eddy, S.R.; Luciani, A.; Potter, S.C.; Qureshi, M.; Richardson, L.J.; Salazar, G.A.; Smart, A.; et al. The Pfam protein families database in 2019. Nucleic Acids Res. 2019, 47, D427–D432. [Google Scholar] [CrossRef] [PubMed]
  57. Eddy, S.R. Profile hidden Markov models. Bioinformatics 1998, 14, 755–763. [Google Scholar] [CrossRef]
  58. Zhang, X.; Zhang, L.; Ji, M.; Wu, Y.; Zhang, S.; Zhu, Y.; Yao, J.; Li, Z.; Gao, H.; Wang, X. Genome-wide identification and expression analysis of the B-box transcription factor gene family in grapevine (Vitis vinifera L.). BMC Genomics 2021, 22, 221. [Google Scholar] [CrossRef] [PubMed]
  59. Goodstein, D.M.; Shu, S.; Howson, R.; Neupane, R.; Hayes, R.D.; Fazo, J.; Mitros, T.; Dirks, W.; Hellsten, U.; Putnam, N.; et al. Phytozome: A comparative platform for green plant genomics. Nucleic Acids Res. 2012, 40, D1178–D1186. [Google Scholar] [CrossRef]
  60. Letunic, I.; Bork, P. 20 years of the SMART protein domain annotation resource. Nucleic Acids Res. 2018, 46, D493–D496. [Google Scholar] [CrossRef]
  61. Marchler-Bauer, A.; Bo, Y.; Han, L.; He, J.; Lanczycki, C.J.; Lu, S.; Chitsaz, F.; Derbyshire, M.K.; Geer, R.C.; Gonzales, N.R.; et al. CDD/SPARCLE: Functional classification of proteins via subfamily domain architectures. Nucleic Acids Res. 2017, 45, D200–D203. [Google Scholar] [CrossRef] [PubMed]
  62. Wilkins, M.R.; Gasteiger, E.; Bairoch, A.; Sanchez, J.C.; Williams, K.L.; Appel, R.D.; Hochstrasser, D.F. Protein identification and analysis tools on the ExPASy server. In The Proteomics Protocols Handbook; Walker, J.M., Ed.; Humana Press: Totowa, NJ, USA, 2005; pp. 571–607. [Google Scholar]
  63. Zhang, X.; Ma, J.; Yang, S.; Yao, W.; Zhang, N.; Hao, X.; Xu, W. Analysis of GATA transcription factors and their expression patterns under abiotic stress in grapevine (Vitis vinifera L.). BMC Plant Biol. 2023, 23, 611. [Google Scholar] [CrossRef]
  64. Crooks, G.E.; Hon, G.; Chandonia, J.M.; Brenner, S.E. WebLogo: A sequence logo generator. Genome Res. 2004, 14, 1188–1190. [Google Scholar] [CrossRef]
  65. Kumar, S.; Stecher, G.; Tamura, K. MEGA7: Molecular Evolutionary Genetics Analysis Version 7.0 for Bigger Datasets. Mol. Biol. Evol. 2016, 33, 1870–1874. [Google Scholar] [CrossRef] [PubMed]
  66. Hu, B.; Jin, J.; Guo, A.Y.; Zhang, H.; Luo, J.; Gao, G. GSDS 2.0: An upgraded gene feature visualization server. Bioinformatics 2015, 31, 1296–1297. [Google Scholar] [CrossRef] [PubMed]
  67. Bailey, T.L.; Boden, M.; Buske, F.A.; Frith, M.; Grant, C.E.; Clementi, L.; Ren, J.; Li, W.W.; Noble, W.S. MEME SUITE: Tools for motif discovery and searching. Nucleic Acids Res. 2009, 37 (Suppl. S2), W202–W208. [Google Scholar] [CrossRef]
  68. Chen, C.; Chen, H.; Zhang, Y.; Thomas, H.R.; Frank, M.H.; He, Y.; Xia, R. TBtools: An Integrative Toolkit Developed for Interactive Analyses of Big Biological Data. Mol. Plant 2020, 13, 1194–1202. [Google Scholar] [CrossRef]
  69. Wang, Y.; Tang, H.; Debarry, J.D.; Tan, X.; Li, J.; Wang, X.; Lee, T.-h.; Jin, H.; Marler, B.; Guo, H.; et al. MCScanX: A toolkit for detection and evolutionary analysis of gene synteny and collinearity. Nucleic Acids Res. 2012, 40, e49. [Google Scholar] [CrossRef]
  70. Krzywinski, M.; Schein, J.; Birol, I.; Connors, J.; Gascoyne, R.; Horsman, D.; Jones, S.J.; Marra, M.A. Circos: An information aesthetic for comparative genomics. Genome Res. 2009, 19, 1639–1645. [Google Scholar] [CrossRef]
  71. Cao, J.; Han, X.; Zhang, T.; Yang, Y.; Huang, J.; Hu, X. Genome-wide and molecular evolution analysis of the subtilase gene family in Vitis vinifera. BMC Genom. 2014, 15, 1116. [Google Scholar] [CrossRef]
  72. Fasoli, M.; Dal Santo, S.; Zenoni, S.; Tornielli, G.B.; Farina, L.; Zamboni, A.; Porceddu, A.; Venturini, L.; Bicego, M.; Murino, V.; et al. The grapevine expression atlas reveals a deep transcriptome shift driving the entire plant into a maturation program. Plant Cell 2012, 24, 3489–3505. [Google Scholar] [CrossRef] [PubMed]
  73. Zhang, X.; Wu, Y.; Zhang, Y.; Yin, X.; van Nocker, S.; Guo, J.; Li, Z.; Gao, M.; Song, J.; Wang, X. Identification of potential key genes in resveratrol biosynthesis via transcriptional analyses of berry development in grapevine (Vitis spp.) genotypes varying in trans-resveratrol content. Fruit Res. 2022, 2, 6. [Google Scholar] [CrossRef]
  74. Gu, B.; Zhang, B.; Ding, L.; Li, P.; Shen, L.; Zhang, J. Physiological Change and Transcriptome Analysis of Chinese Wild Vitis amurensis and Vitis vinifera in Response to Cold Stress. Plant Mol. Biol. Rep. 2020, 38, 478–490. [Google Scholar] [CrossRef]
  75. Cui, X.; Xue, J.; Zhang, B.; Chen, C.; Tang, Y.; Zhang, P.; Zhang, J. Physiological change and screening of diferentially expressed genes of wild Chinese Vitis yeshanensis and American Vitis riparia in response to drought stress. Sci. Hortic. 2020, 266, 109140. [Google Scholar] [CrossRef]
  76. Zhao, F.; Zheng, T.; Liu, Z.; Fu, W.; Fang, J. Transcriptomic Analysis Elaborates the Resistance Mechanism of Grapevine Rootstocks against Salt Stress. Plants 2022, 11, 1167. [Google Scholar] [CrossRef] [PubMed]
  77. Wan, R.; Hou, X.; Wang, X.; Qu, J.; Singer, S.D.; Wang, Y.; Wang, X. Resistance evaluation of Chinese wild Vitis genotypes against Botrytis cinerea and different responses of resistant and susceptible hosts to the infection. Front. Plant Sci. 2015, 6, 854. [Google Scholar] [CrossRef]
  78. Gabler, F.M.; Smilanick, J.L.; Mansour, M.; Ramming, D.W.; Mackey, B.E. Correlations of Morphological, Anatomical, and Chemical Features of Grape Berries with Resistance to Botrytis cinerea. Phytopathology 2003, 93, 1263–1273. [Google Scholar] [CrossRef]
  79. Rahman, M.U.; Hanif, M.; Wan, R.; Hou, X.; Ahmad, B.; Wang, X. Screening Vitis Genotypes for Responses to Botrytis cinerea and Evaluation of Antioxidant Enzymes, Reactive Oxygen Species and Jasmonic Acid in Resistant and Susceptible Hosts. Molecules 2019, 24, 5. [Google Scholar] [CrossRef]
  80. Livak, K.J.; Schmittgen, T.D. Analysis of relative gene expression data using real-time quantitative PCR and the 2−ΔΔCT method. Methods 2001, 25, 402–408. [Google Scholar] [CrossRef]
  81. Grimplet, J.; Adam-Blondon, A.-F.; Bert, P.-F.; Bitz, O.; Cantu, D.; Davies, C.; Delrot, S.; Pezzotti, M.; Rombauts, S.; Cramer, G.R. The grapevine gene nomenclature system. BMC Genomics 2014, 15, 1077. [Google Scholar] [CrossRef]
  82. Cannon, S.B.; Mitra, A.; Baumgarten, A.; Young, N.D.; May, G. The roles of segmental and tandem gene duplication in the evolution of large gene families in Arabidopsis thaliana. BMC Plant Biol. 2004, 4, 10. [Google Scholar] [CrossRef] [PubMed]
  83. Li, X.; Duan, X.; Jiang, H.; Sun, Y.; Tang, Y.; Yuan, Z.; Guo, J.; Liang, W.; Chen, L.; Yin, J.; et al. Genome-wide analysis of basic/helix-loop-helix transcription factor family in rice and Arabidopsis. Plant Physiol. 2006, 141, 1167–1184. [Google Scholar] [CrossRef] [PubMed]
  84. Le Hir, R.; Spinner, L.; Klemens, P.A.W.; Chakraborti, D.; de Marco, F.; Vilaine, F.; Wolff, N.; Lemoine, R.; Porcheron, B.; Géry, C.; et al. Disruption of the Sugar Transporters AtSWEET11 and AtSWEET12 Affects Vascular Development and Freezing Tolerance in Arabidopsis. Mol. Plant 2015, 8, 1687–1690. [Google Scholar] [CrossRef] [PubMed]
  85. Liu, X.; Zhang, Y.; Yang, C.; Tian, Z.; Li, J. AtSWEET4, a hexose facilitator, mediates sugar transport to axial sinks and affects plant development. Sci. Rep. 2016, 6, 24563. [Google Scholar] [CrossRef]
  86. Yao, L.; Ding, C.; Hao, X.; Zeng, J.; Yang, Y.; Wang, X.; Wang, L. CsSWEET1a and CsSWEET17 Mediate Growth and Freezing Tolerance by Promoting Sugar Transport across the Plasma Membrane. Plant Cell Physiol. 2020, 61, 1669–1682. [Google Scholar] [CrossRef]
Figure 1. Phylogenetic analysis of SWEET proteins from grapevine, Arabidopsis, Rice, Cucumber, and Daylily. The tree was divided into four clades, which are marked by different colors and named as Clade I, II, III and IV. The bootstrap values are indicated at each node.
Horticulturae 10 00428 g001
Figure 2. Characterization of grapevine SWEET genes. (A) Phylogenetic analysis of SWEET proteins in grapevine; (B) distribution of conserved motifs identified in the 18 VvSWEET proteins; and (C) exon–intron structure of grapevine SWEET genes. Exons are represented by pink boxes and black lines connecting two exons represent an intron.
Horticulturae 10 00428 g002
Figure 3. Chromosomal distribution and synteny analysis among grape SWEET genes. (a) Distribution and synteny analysis of VvSWEET genes on grapevine chromosomes. The approximate chromosomal locations of the SWEET genes are indicated on the periphery. The colored lines linking genes from different chromosomes denote segmental duplication events. (b) Synteny analysis of SWEET genes between grapevine and Arabidopsis. The chromosomes of grapevine and Arabidopsis are arranged as a circle. Syntenic occurrences of SWEET genes are represented by colored lines.
Horticulturae 10 00428 g003
Figure 4. VvSWEET expression profiles in various tissues at different developmental stages. VvSWEET transcript levels in various tissues were investigated based on the mean expression value of each gene in a public transcriptome database [73]. The violet and orange colors represent the higher and lower relative expression levels, respectively. Bud (-L: latent bud, -W: winter bud, -S: bud swell, -B: bud burst, -AB: after-burst); inforescence (-Y: young inforescence, -WD: well developed inforescence); flower (-FB: fowering begins, -F: fowering); tendril (-Y: young tendril, -WD: well developed tendril, -FS: mature tendril); leaf (-Y: young leaf, -FS: mature leaf, -S: senescencing leaf); berry pericarp (-FS: fruit set, -PFS: post-fruit set, -V: véraison, -MR: mid-ripening, -R: ripening, -PHWI: post-harvest withering I, -PHWII: post-harvest withering II, -PHWIII: post-harvest withering III); berry skin/flesh (-PFS: post-fruit set, -V: véraison, -MR: mid-ripening, -R: ripening, -PHWI: post-harvest withering I, -PHWII: post-harvest withering II, -PHWIII: post-harvest withering III); seed (-FS: fruit set, -PFS: post-fruit set, -V: véraison, -MR: mid-ripening); rachis (-FS: fruit set, -PFS: post-fruit set, -V: véraison, -MR: mid-ripening, -R: ripening); and stem (-G: green stem, -W: woody stem).
Horticulturae 10 00428 g004
Figure 5. Expression of the VvSWEET gene family in grapefruits during the green fruit stage, veraison, and ripening based on transcriptome data.
Horticulturae 10 00428 g005
Figure 6. VvSWEET expression analysis in response to various abiotic stresses including cold (A), drought (B) and salt (C) treatments. The color scale represents log2(FPKM + 1) normalized transformed counts where orange indicates low expression and violet indicates high expression.
Horticulturae 10 00428 g006
Figure 7. qRT-PCR analysis of expression of selected VvSWEET genes. (A) Expression of VvSWEET genes in Botrytis cinerea-resistant and -susceptible varieties. (B) Expression of VvSWEET genes following Botrytis cinerea inoculation. The grapevine ACTIN1 gene was used as an internal control to normalize expression levels. Mean values and standard deviations (SDs) are indicated by error bars. Asterisks indicate significance of the indicated differences in gene expression according to the t-test (* p < 0.05, ** p < 0.01,**** p < 0.0001).
Horticulturae 10 00428 g007aHorticulturae 10 00428 g007b
Table 2. Detailed information of VvSWEET gene family members in grapevine.
Gene NameVCost. v3 IDGene Locus IDAccession NoCDS
(bp)
ORF
(aa)
ChromosomeMWpIInstability
Index
Aliphatic
Index
GRAVY
VvSWEET1Vitvi18g01215.t01GSVIVT01010015001XP_002265836.1747248Chr18: 13476398—-13478625 (−)27,352.749.6428.21111.290.682
VvSWEET2Vitvi10g00679.t01GSVIVT01021317001XP_002269484.1699232Chr10: 7519651—7522710 (+)25,777.628.8453.21115.990.839
VvSWEET2bVitvi19g00024.t01GSVIVT01014088001XP_010644065.1708235Chr19: 278130—280739 (−)26,117.959.3047.26117.320.741
VvSWEET3Vitvi16g01984.t01GSVIVT01028713001XP_002267886.1750249Chr16: 21023729—21025870 (+)28,036.279.1339.81116.140.535
VvSWEET4Vitvi14g01783.t01GSVIVT01032489001XP_002274582.1765254Chr14: 27825326—27827944 (−)27,899.029.3638.85108.980.517
VvSWEET5aVitvi17g00791.t01GSVIVT01007779001XP_002283068.1705234Chr17: 9249190—9250708 (+)26,160.489.4329.69124.060.693
VvSWEET5bVitvi17g00793.t01GSVIVT01007777001XP_002279850.1699232Chr17: 9294434—9295940 (+)25,967.169.4930.31119.660.698
VvSWEET7Vitvi02g00181.t01GSVIVT01019601001XP_002263697.1783260Chr02: 1670296—1672808 (−)28,845.499.6243.99116.540.695
VvSWEET9aVitvi04g01075.t01GSVIVT01026399001XP_002267792.1837278Chr04: 15790881—15792999 (−)31,515.379.0539.12112.160.576
VvSWEET9bVitvi04g01077.t01-RVW45685.1795264Chr04: 15798938—15800244 (+)29,875.248.3431.28100.800.454
VvSWEET9cVitvi07g00250.t01GSVIVT01010993001XP_002270131.1831276Chr07: 2749916—2751667 (−)31,004.899.3034.08106.050.535
VvSWEET10aVitvi17g00069.t01GSVIVT01008597001XP_002280599.1852283Chr17: 678049—680301 (+)31,699.789.3438.63112.930.575
VvSWEET10bVitvi17g00070.t01GSVIVT01008595001XP_002284244.1813270Chr17: 682658—684513 (+)30,608.808.9034.63127.700.836
VvSWEET15Vitvi01g01719.t01GSVIVT01000938001NP_001384792.1864289Chr01: 23092093—23093857 (−)32,149.039.0835.66110.000.492
VvSWEET17aVitvi05g00013.t01GSVIVT01035138001XP_010649584.1606201Chr05: 123990—126791 (−)21,952.925.0636.17122.690.772
VvSWEET17bVitvi14g00147.t01GSVIVT01031172001RVW97796.1714237Chr14: 1525182—1527230 (−)26,266.346.2948.06128.230.845
VvSWEET17cVitvi14g00148.t01GSVIVT01031172001RVW97798.1717238Chr14: 1533798—1535492 (−)26,473.406.9046.38124.790.782
VvSWEET17dVitvi14g00149.t01GSVIVT01031170001XP_002279031.1897298Chr17: 1541544—1545073 (−)32,764.719.6837.96107.580.424
CDS: coding sequence, ORF: open reading frame, MW: molecular weight, pI: isoelectric points, and GRAVY: grand average of hydropathicity.
Disclaimer/Publisher’s Note: The statements, opinions and data contained in all publications are solely those of the individual author(s) and contributor(s) and not of MDPI and/or the editor(s). MDPI and/or the editor(s) disclaim responsibility for any injury to people or property resulting from any ideas, methods, instructions or products referred to in the content.

