Article

Exploring Leaf Anthocyanin Concentrations and Light Effects on Lettuce Growth

by
Peyton Lou Palsha
1,*,
Marc W. van Iersel
1,
Ryan William Dickson
2,
Lynne Seymour
3,
Melanie Yelton
4 and
Rhuanito Soranz Ferrarezi
1,*
1
Department of Horticulture, University of Georgia, 1111 Miller Plant Sciences, Athens, GA 30605, USA
2
Department of Horticulture, University of Arkansas, 316 Plant Sciences Building, Fayetteville, AR 72701, USA
3
Department of Statistics, University of Georgia, 310 Herty Drive, Athens, GA 30602, USA
4
Grow Big Consultants, 1519 Masonic Avenue, San Francisco, CA 94117, USA
*
Authors to whom correspondence should be addressed.
Horticulturae 2024, 10(5), 437; https://doi.org/10.3390/horticulturae10050437
Submission received: 22 March 2024 / Revised: 18 April 2024 / Accepted: 22 April 2024 / Published: 24 April 2024
(This article belongs to the Special Issue LED Lighting to Control Plants’ Growth and Development)

Abstract

:
Anthocyanins are secondary metabolites classified as water-soluble, non-photosynthetic pigments with the potential ability to shield chloroplasts from excess light energy. This study investigated the morphological and physiological responses of six lettuce (Lactuca sativa) cultivars with different leaf anthocyanin contents grown in a greenhouse under different supplemental photosynthetic photon flux densities (PPFD). Cultivars ‘Cherokee’, ‘Teodore’, ‘Rex’, and ‘Rouxai’ decreased in specific leaf area with increasing PPFD, respectively. We observed that growth in cultivars with higher leaf anthocyanin content (‘Cherokee’ and ‘Rouxai’) increased with increasing PPFD. Light use efficiency (LUE) is an important physiological parameter affecting biomass accumulation, and cultivars ‘Cherokee’, ‘Rex’, ‘Teodore’, and ‘Rouxai’ had the highest LUE and shoot weight. We found that red lettuce varieties, especially ‘Cherokee’ and ‘Rouxai’, showed increased shoot dry weight as light intensity increased. Interestingly, these varieties also had the highest anthocyanin levels in their leaves. This suggests that higher anthocyanin content might contribute to the increased shoot dry weight under higher light intensity, although this was mainly evident in ‘Cherokee’.

1. Introduction

Anthocyanins belong to the flavonoid subgroup and are responsible for the red, blue, and purple coloration observed in plants [1,2,3]. Anthocyanins represent the largest group of water-soluble natural phenolic compounds and are generally present as anthocyanin glycosides and acylated anthocyanins [2,3,4]. Anthocyanins are pigments that do not contribute to photosynthesis [5,6]. As photosystems reach their light saturation threshold, any surplus radiation is dissipated as heat through a mechanism referred to as the xanthophyll cycle [2]. The xanthophyll cycle is an essential photoprotective response to light saturation sincethis process reduces the availability of photons necessary for photosynthesis, ultimately impeding crop growth [2]. When leaves receive more light than can be used in photochemistry, there is a decline in photosynthesis due to a decline in quantum efficiency, called photoinhibition [7]. When photoinhibition is severe, chloroplasts generate reactive oxygen species, which can destroy the thylakoid membranes, damage DNA, and denature proteins associated with electron transport in photosynthesis [7]. Nevertheless, several studies suggest anthocyanins have a photoprotective function [2], which is often associated with reducing the frequency and severity of photoinhibition in many species [7].
Anthocyanin concentrations differ among lettuce (Lactuca sativa) varieties and between cultivated types (commercial and traditional) and their wild relatives [8]. Due to these differences, the effect of environmental factors on growth can be enhanced when these phenolic compounds are present because they protect the leaves from excess radiation without compromising photosynthesis [8].
In recent years, several studies have contributed valuable insights into the influence of light on lettuce growth, particularly regarding the role of anthocyanins. Most of the studies focus on the light spectrum on the development and quality of lettuce. Saito et al. [9] highlighted the importance of light quality in influencing lettuce physiology and morphology. They observed that red and blue LED lights promoted anthocyanin accumulation in lettuce leaves, leading to enhanced photoprotection and improved antioxidant capacity. Building upon these findings, Samuolienė et al. [10] conducted a comprehensive study on the impact of LED light spectra on the biosynthesis of secondary metabolites, such as anthocyanins in lettuce. Spectroscopic analysis and physiological assessments demonstrated that specific red, blue, and far-red LED light combinations significantly influenced anthocyanin production in lettuce leaves.
In a related study, Mohamed et al. [11] investigated the effects of different light intensities on lettuce growth and phytochemical composition, including anthocyanins. Their research revealed that moderate light intensities stimulated anthocyanin accumulation in lettuce leaves, whereas excessive light exposure led to photoinhibition and reduced anthocyanin content. These findings emphasize the delicate balance between light availability and photoprotection in regulating anthocyanin metabolism in lettuce plants. Song et al. [12] evaluated the combination of four light intensities (150 to 450 μmol m−2  s−1) and three nutrient solution concentrations (1/4, 1/2, and 3/4 strength) and found that the antioxidant contents increased with the increase in light intensity and decreased with increasing nutrient solution concentration levels. The results revealed that optimal light conditions promoted flavonoid accumulation within lettuce tissues, whereas excessive light exposure induced photoinhibition. These effects underscore the significance of maintaining a delicate balance between light availability and nutrient solution concentrations to regulate flavonoid metabolism in lettuce.
Collectively, these studies highlight the multifaceted interactions between light spectrum and intensity, anthocyanin biosynthesis, and lettuce physiology. By elucidating the underlying mechanisms governing these processes, researchers can develop strategies to optimize light conditions for enhancing anthocyanin accumulation and promoting the growth and nutritional quality of lettuce crops. Such insights are invaluable for advancing sustainable agriculture practices and meeting the growing demand for nutritious and high-quality produce.
This study investigated the morphological and physiological responses of six different lettuce cultivars characterized by varying leaf anthocyanin contents. We hypothesized that cultivars with lower leaf anthocyanin content values will increase shoot weight with increasing photosynthetic photon flux densities (PPFD) levels.

2. Materials and Methods

2.1. Seedling and Transplant Management

For seedling production, all six lettuce cultivars were sown in rockwool plugs measuring 2.5 × 2.5 × 4 cm (A0 25/40; Grodan Rockwool BV, Roermond, The Netherlands) on 13 February 2023. Prior to seeding, the rockwool plugs were thoroughly saturated with water. Subsequently, a single lettuce seed was placed into each rockwool plug, with 120 plugs constituting 1 tray. Six trays were seeded—one tray for each cultivar. After seeding all six trays, the rockwool was misted again to ensure adequate moisture for seed germination. These rockwool plugs were placed in double-stacked, black, rectangular plastic mesh trays measuring 50.8 × 12.7 × 5.08 cm. The seeded trays were transferred to a walk-in vertical farm and positioned on shelves beneath 1.1 m-long white-light-emitting diode (LED) light fixtures (RAY with Physiospec indoor spectrum; Fluence Bioengineering, Austin, TX, USA), delivering a photosynthetically active radiation (PAR) of 250 µmol·m−2·s−1 during a 16-h photoperiod.
Seeds were sown on 13 February 2023, and transparent plastic domes were utilized to cover the trays for the first four days, creating an environment conducive to maintaining high humidity during germination. Plants were fertilized daily for 5 min using ebb-and-flow subirrigation with a water-soluble fertilizer containing a 15N–2.2P–12.45K solution with 100 mg·L−1 of nitrogen (N; 15-5-15 Cal-Mag Jack’s Professional LX; J. R. Peters, Allentown, PA, USA).
The most uniform seedlings from each cultivar were selected eleven days after seeding (on 24 February 2023). These seedlings were randomly transplanted among light treatments into 36 net pots (4.8 cm height × 4.5 cm top diameter × 3.3 cm in bottom diameter; Teku G46; Pöppelmann GmbH & Co., Lohne, Germany) inserted on top of a 1.9 cm × 1.2 m × 1.2 m unfaced foam insulation board (R-3.75; Kingspan Insulation, Atlanta, GA, USA) to enable flotation in a 144-L 1.2 × 1.2 m × 10 cm tray, simulating a deep water culture hydroponic system. Foam insulation boards accommodated the plants and net pots within each tray. These lids featured 36 holes, evenly spaced 12.90 square cm apart, and each hole had a width of 4.1 cm. Each hole held a net pot containing a plant in rockwool.
A consistent water-soluble hydroponic nutrient solution was utilized for all trays and replications. This nutrient solution was formulated as a combination of various fertilizers: Blend 9-7-37 Hydroponic Fertilizer (HortAmericas, Bedford, TX, USA), Ca(NO3) (YaraTera Calcinit; Yara, Oslo, Norway), and MgSO4 (EPSOTop; K + S Minerals and Agriculture GmbH, Kassel, Germany). To ensure proper aeration of the fertilizer solution, plastic tubing and six air stones (Pawfly Aquarium, Guangzhou, China) were placed within each tray. An air pump (EcoPlus-7; Hawthorne gardening company, Vancouver, WA, USA, 0.48 bar, 3.0 A, 120V, Tube Size: 12.7 mm in diameter) was employed to facilitate air circulation and maintain optimal oxygen levels in the nutrient solution. The initial pH for the solution was 6.53, while the electrical conductivity (EC) was 1.22 mS/cm. We used 2 M of H3PO4 solution to reduce the pH of the hydroponic solution between 5.5 and 6.5. The 2 M H3PO4 solution was used throughout the study to keep the pH from going above 6.5, but multiple times throughout the study, the pH was between 6.78 and 7.20, with the highest pH recorded at 7.30. The temporary increase in pH may have caused an increase in tip-burn symptoms; however, tip-burn incidence for this study was not measured.

2.2. Growing and Environmental Conditions

Plants were grown in a glass-covered greenhouse at the University of Georgia (College of Agricultural and Environmental Sciences, Department of Horticulture, Controlled Environment Agriculture Laboratory) in Athens, USA (lat. 33°57′26.676″ N, long. 83°22′36.48″ W), from 13 February to 22 March 2023 (37 days after germination). This study involved 216 plants, where 1 tray with 36 plants represented 1 block. In total, there were six blocks in this study. Each block consisted of six different PPFD light treatments per tray. To prevent bias and ensure that the effects of different cultivars were evenly assessed in each lighting treatment, one plant from each of the six cultivars was randomly assigned to each light treatment and replication. As a result, there was one representative of each of the six cultivars in each light treatment. The average daily temperature was 20.1 ± 1.45 °C, relative humidity was 62.2 ± 13.6%, and the vapor pressure deficit during the entirety of this study was 0.89 ± 0.27 kPa.

2.3. Treatments

Six lettuce cultivars: ‘Rex’, ‘Cherokee’, ‘Rouxai’, ‘Teodore’, ‘Salanova® Red Batavia’, and ‘Salanova® Hydroponic Red Batavia’ (Johnny’s Selected Seeds, Winslow, ME, USA), were chosen for their distinctive characteristics, encompassing variations in morphology, anthocyanin content, and pigmentation. All six cultivars were subjected to diverse PPFDs provided by supplemental LED lighting throughout the growing cycle.
The collected PPFD measurements were grouped into six lighting treatments, each comprising six plants. These groupings were based on the similarity of PPFD levels, resulting in six lighting treatments with an average maximum supplemental PPFD of 142, 196, 264, 307, 303, and 372 µmol·m−2·s−1, respectively (Figure 1), with a photoperiod of 16 h. Consequently, the supplemental PPFD values had a daily light integral (DLI) of 8.2, 11.3, 14.6, 17.7, 17.4, and 21.4 mol·m−2·d−1, without considering the DLI received from natural sunlight since that was constant for all plants. When adding both lighting sources, the averaged total DLI values throughout the experiment were 28.6, 31.7, 35.0, 38.1, 37.8, and 41.8 mol·m−2·d−1. As a result, the total DLI received from the sunlight and LEDs exceeded the provided supplemental DLI values from only LEDs (Supplementary Materials Table S1).

2.4. Lighting Conditions and Measurement Setup

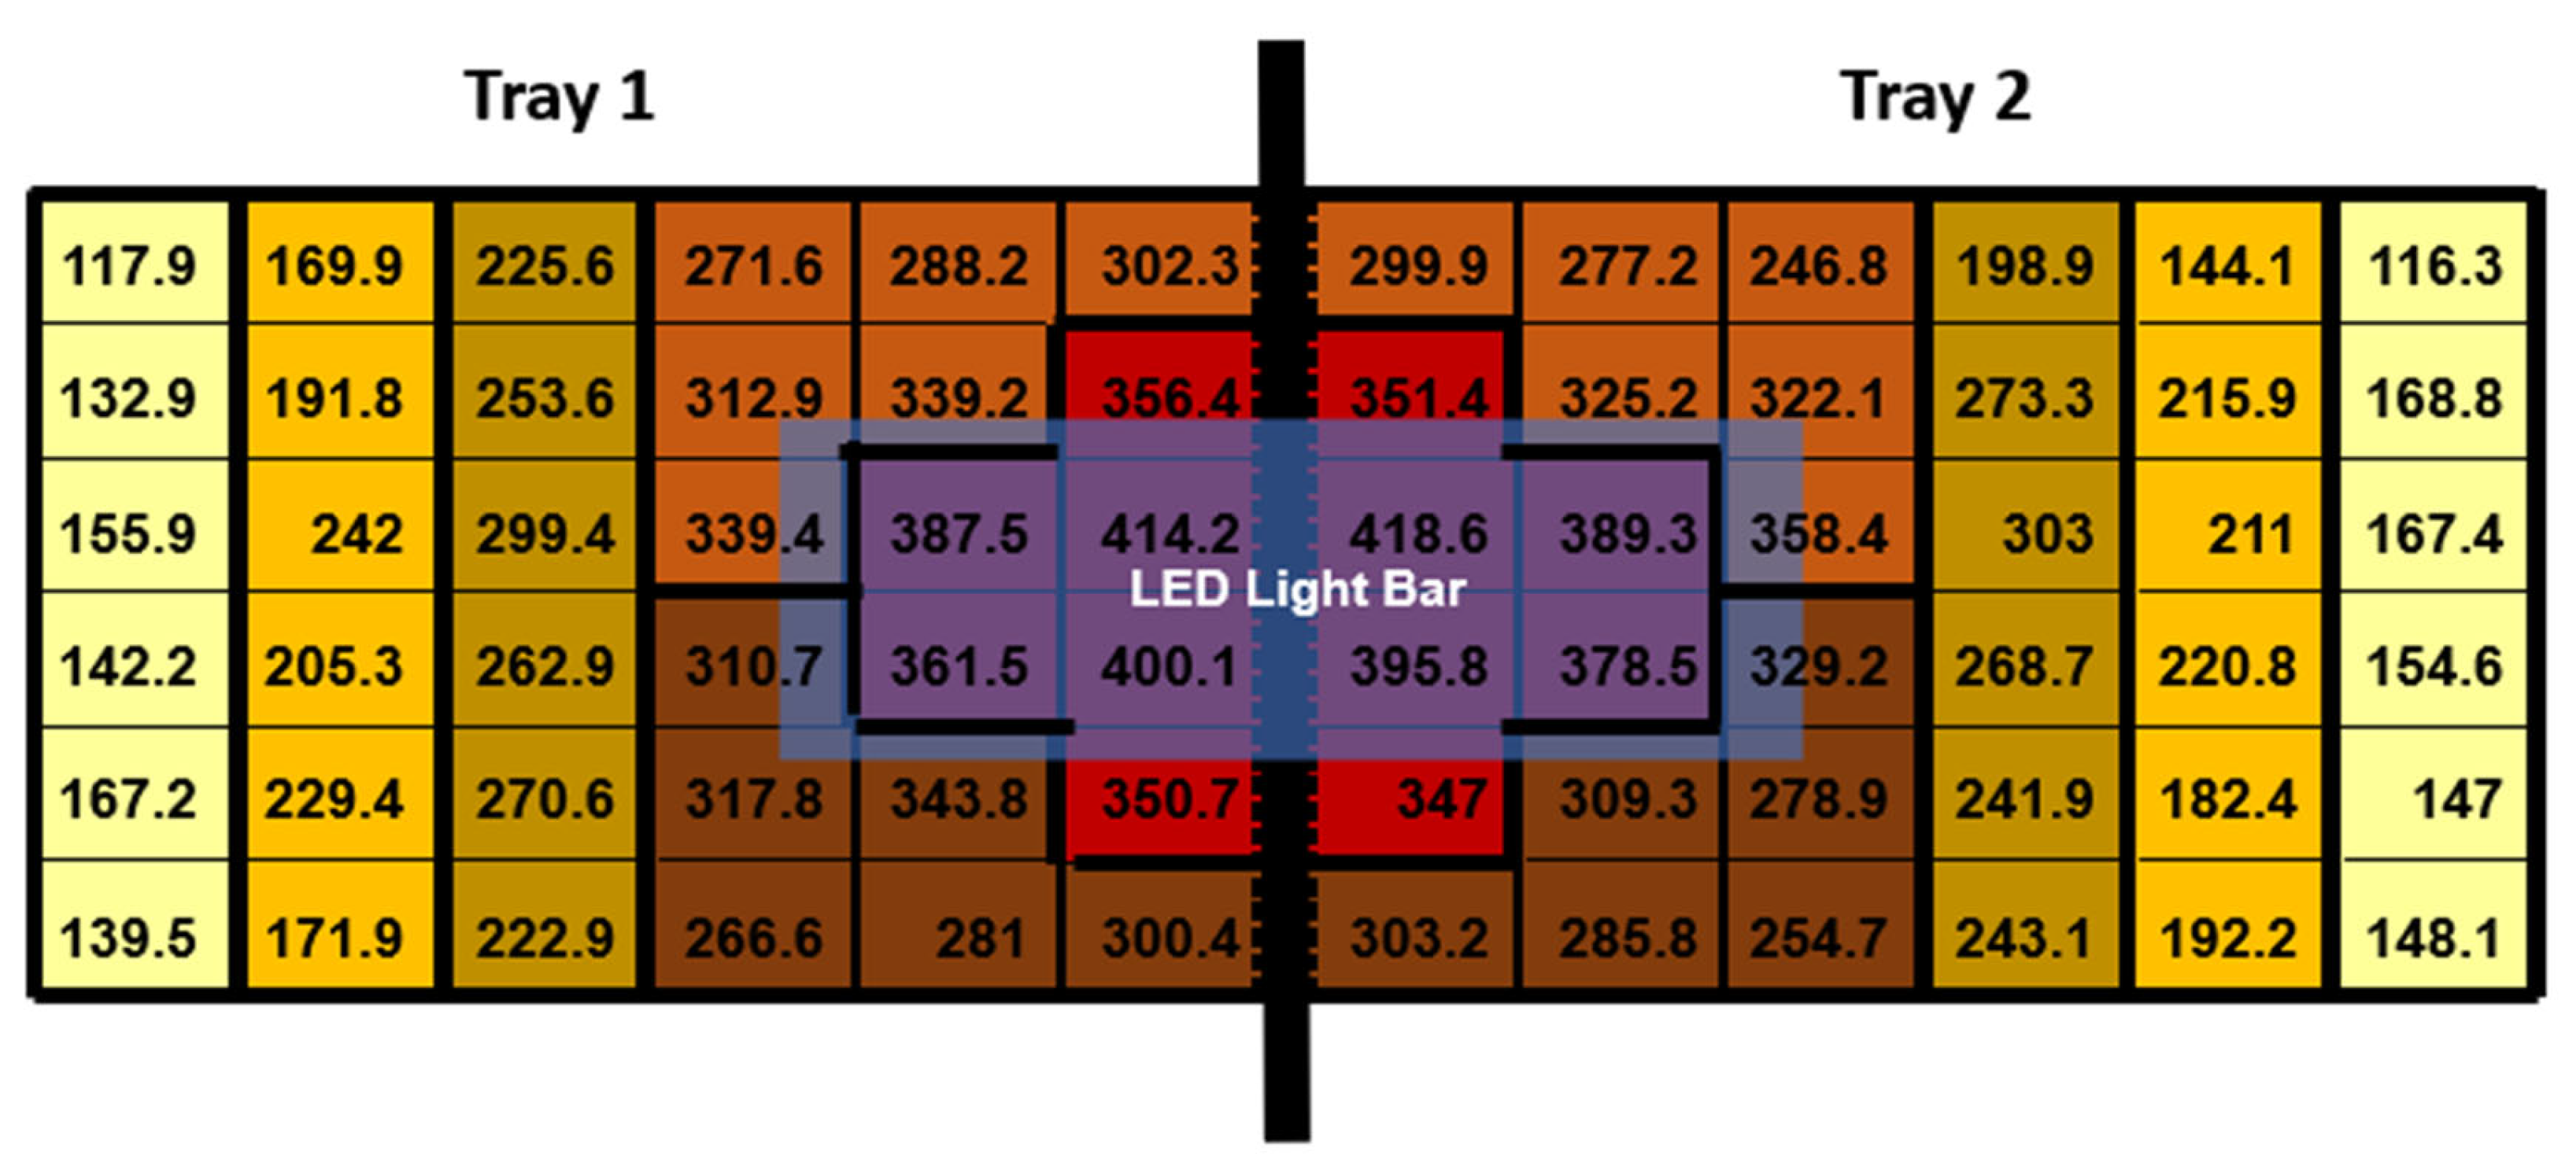
On 21 February 2023, three days before transplanting, six 1.2 m-long LED light fixtures were set up directly over the central portion of each bench (Arize Element Top Light PPR; Current, Montreal, QC, Canada). This deliberate arrangement was designed to introduce natural PPFD variations to achieve a supplemental PPFD of approximately 400 µmol·m−2·s−1 in the highest lighting treatment (Arize Element Top Light PPR; Current, Montreal, QC, Canada). To ensure that the LED fixtures primarily provided supplemental lighting to the bench they were positioned above, we installed aluminum reflectors on the sides of each LED fixture. Each LED light fixture illuminated two trays positioned side-by-side on a single bench. Above the LED fixtures was a 70% shade net used to reduce the sunlight entering the greenhouse. Between two trays, we placed one photosynthetically active radiation (PAR) sensor (SQ500-SS; Apogee Instruments, Logan, UT, USA). The PAR sensor was used to monitor the intensity of light the LED fixtures gave off. Two additional PAR sensors were placed above the LED fixtures but below the 70% shade net to measure the sunlight intensity entering the greenhouse, which was recorded and used to calculate weather conditions. All quantum sensors were connected to a datalogger (CR1000; Campbell Scientific, Logan, UT, USA) to control the dimmable LED drivers, but for this experiment, the dimmable LEDs were not used and were kept at a constant maximum power PPFD threshold.
To measure the PPFD provided by the LED fixtures at full power for each of the 36 holes per tray, we affixed 36 interconnected diodes to a foam board. Each diode was placed in the same location where each of the 36 plants would grow. We simultaneously captured the PPFD measurements from all 36 planting locations, managed through proprietary software (LoggerNet version 4.1; Cambell Scientific, Logan, UT, USA). These measurements were obtained at night, exclusively under supplemental lighting conditions. Throughout the 16 h photoperiod, the supplemental LED fixtures remained consistently powered, ensuring uniform lighting conditions for the study.
The supplemental LED fixtures did not adjust to increasing or decreasing sunlight throughout the day and were kept at a constant target level of 400 ± 18 µmol·m−2·s−1. As the distance from the LED fixture increased, the supplementary PPFD values decreased (Figure 2).

2.5. Data Collection

On 22 March 2023, at 9:30 p.m., 26 days after transplanting and on the night before the destructive harvest, we assessed the quantum yield of photosystem II (ΦPSII). This assessment was performed using a pulse-amplitude-modulated (PAM) fluorometer (Mini-PAM II; Heinz Walz, Effeltrich, Germany). We recorded the ΦPSII measurements from the upper-most fully expanded leaves from every plant under each lighting treatment for all three blocks. These ΦPSII measurements were acquired exclusively under supplemental lighting at night.
To identify each cultivar’s morphological responses to varying supplemental PPFDs, the measurements taken encompassed various parameters, such as the shoot and root dry weight per plant and the leaf area for each plant in two out of three blocks. Just prior to the leaf area measurements, all plants were imaged individually in a multispectral imaging system to determine the leaf anthocyanin content before proceeding with destructive measurements (Topview; Aris, Eindhoven, The Netherlands). Individual leaves were carefully separated from each plant to gauge the total leaf area and then measured using a leaf area meter (LI-3100; LI-COR, Lincoln, NE, USA). Subsequently, the shoots and roots were placed in a drying oven at 80 °C for 7 days, following which their dry weights were measured. Specific leaf area (SLA) was calculated using shoot dry weight and total leaf area (SLA: total leaf area/shoot dry weight). Light use efficiency (LUE) was calculated by first determining the amount of shoot dry weight produced in square meters. Next, we calculated the total amount of light energy provided over the entire growing period on the same square meter. By dividing the total grams of shoot dry weight by the total light energy moles, we could calculate the LUE [13].

2.6. Experimental Design and Statistical Analysis

The experimental framework employed a randomized complete block design encompassing six lighting treatments within a single block. The experimental unit comprised 36 plants per block, with 6 blocks, resulting in 216 total plants. To investigate the influence of varying PPFDs on canopy dimensions and growth, hydroponically cultivated lettuce was subjected to supplemental LED illumination, with the PPFD levels from the LEDs spanning 93 to 418.6 µmol·m−2·s−1. Subsequent analyses were performed via multiple regression analysis utilizing statistical software (SigmaPlot version 11.0; Systat Software, San Jose, CA, USA). This method aimed to discern any potential interaction effects PPFD had on various parameters, including shoot and root dry weights per plant, leaf area per plant, SLA, and LUE.

3. Results

3.1. Shoot Dry Weight

‘Cherokee’ exhibited the highest shoot dry weight at 9.73 g per plant, with ‘Rex’ and ‘Teodore’ being 17.37% lower than ‘Cherokee’, followed by ‘Rouxai’ that yielded 32% less biomass than ‘Cherokee’ (Figure 3). ‘Salanova® Red Batavia’ and ‘Salanova® Hydroponic Red Batavia’ recorded the lowest dry weights among the cultivars, producing half of the biomass of ‘Cherokee’ (Figure 3). When examining the relationship between shoot dry weight and PPFD, we observed that ‘Cherokee’ exhibited the highest shoot dry weight, which also increased significantly with rising PPFD (p < 0.0001; Figure 4). Similarly, ‘Rex’ (p = 0.0287) and ‘Rouxai’ (p = 0.0111) displayed a comparable trend, showing increased shoot dry weights as PPFD levels increased (Figure 4). The increasing PPFD values did not significantly affect ‘Teodore’ (p = 0.8669; Figure 4). As noted above, ‘Salanova® Red Batavia’ had the lowest shoot dry weights among all the cultivars and did not show a statistically significant increase in shoot dry weight with increasing PPFD values (p = 0.1060; Figure 4).

3.2. Anthocyanin Content vs. PPFD

‘Rouxai’ exhibited the highest leaf anthocyanin content at 0.458 ACI, followed by ‘Cherokee’ at 0.389 ACI and ‘Salanova® Hydroponic Red Batavia’ at 0.375 ACI with the second- and third-highest values (Figure 5). Conversely, ‘Teodore’ and ‘Salanova® Red Batavia’ had the fourth- and fifth-highest leaf anthocyanin content at 0.356 and 0.324 ACI, respectively (Figure 5). ‘Rex’ recorded the lowest leaf anthocyanin content (0.058 ACI) among the cultivars, attributed to its status as the only green cultivar (Figure 5). ‘Salanova® Hydroponic Red Batavia’ and ‘Salanova® Red Batavia’ both exhibited an increase in leaf anthocyanin content with rising PPFD levels (p < 0.0001 and p = 0.0001, respectively; Figure 6). Interestingly, even though ‘Rex’ was a green cultivar, it also displayed an increase in leaf anthocyanin content with increasing PPFD (p = 0.0005; Figure 6). Leaf anthocyanin content did not increase with increasing PPFD for ‘Teodore’ (p = 0.0743) and ‘Rouxai’ (p = 0.5865; Figure 6).

3.3. Light Use Efficiency vs. PPFD

The three cultivars that exhibited the highest LUE at 0.395, 0.352, and 0.33 g·mol−1 were ‘Cherokee’, ‘Rex’, and ‘Teodore’, respectively (Figure 7). The fourth-ranking cultivar for LUE was ‘Rouxai’ at 0.284 g·mol−1 (Figure 7). ‘Salanova® Hydroponic Red Batavia’ and ‘Salanova® Red Batavia’ consistently demonstrated the lowest LUE values at 0.162 and 0.153 g·mol−1, respectively (Figure 7). In evaluating LUE versus PPFD, all cultivars exhibited a significant trend (p > 0.05; Figure 8). With increasing PPFD, LUE in all cultivars decreased: ‘Cherokee’ (p = 0.0397), ‘Rex’ (p = 0.0031), ‘Teodore’ (p = 0.0008), ‘Rouxai’ (p = 0.0081), ‘Salanova® Red Batavia’ (p = 0.0028), and ‘Salanova® Hydroponic Red Batavia’ (p = 0.0032; Figure 8). Ultimately, LUE was highest for all cultivars when exposed to lower PPFDs than higher PPFDs (Figure 8).

3.4. Specific Leaf Area vs. PPFD

‘Salanova® Red Batavia’ and ‘Salanova® Hydroponic Red Batavia’ exhibited the highest SLA values among all the cultivars at 237.3 and 231.37 cm2·g−1, respectively (Figure 9). ‘Cherokee’, ‘Teodore’, ‘Rex’, and ‘Rouxai’ shared the second-highest SLA values at 184.25, 172.43, 158.93, and 156.58 cm2·g−1, respectively (Figure 9). While ‘Salanova® Red Batavia’ (p = 0.1262) and ‘Salanova® Hydroponic Red Batavia’ (p = 0.2100) exhibited the highest SLA values, this was attributed to their lower shoot dry weights. ‘Cherokee’ (p = 0.0381), ‘Teodore’ (p = 0.0034), ‘Rex’ (p < 0.0001), and ‘Rouxai’ (p < 0.0001) all exhibited a reduction in SLA in response to increasing PPFD levels (Figure 10).

3.5. ΦPSII vs. PPFD

ΦPSII decreased as PPFD levels increased across all cultivars: ‘Cherokee’ (p < 0.0001), ‘Teodore’ (p < 0.0001), ‘Rex’ (p < 0.0001), ‘Rouxai’ (p < 0.0001), ‘Salanova® Red Batavia’ (p < 0.0001), and ‘Salanova® Hydroponic Red Batavia’ (p < 0.0001; Figure 11). All six cultivars had higher chlorophyll fluorescence values when grown under lower PPFDs compared to when they were grown under high PPFDs.

4. Discussion

Anthocyanins play a multifaceted role in plants, influencing traits such as pigmentation, stress response, and potentially even growth and yield. Plant responses depend on varietal differences, light intensity, and the complexity of anthocyanin functions, such as stress responses due to antioxidant properties, contributing to various physiological processes. Regarding cultivar differences, ‘Cherokee’, ‘Rex’, ‘Teodore’, and ‘Rouxai’ exhibited the highest shoot dry weights, respectively (Figure 3). Previous studies have reported that higher anthocyanin levels result in lower biomass when compared to green plants [14]. Because anthocyanins are non-photosynthetic pigments, they reduce the fraction of absorbed photons that can be used in the light reactions of photosynthesis, which reduces biomass accumulation [14]. However, the only green cultivar in this study was ‘Rex’, which had the lowest leaf anthocyanin content but the second highest shoot dry weight, while ‘Cherokee’ had the highest shoot dry weight (Figure 3). In [14], the authors saw that red cultivars had less dry weight than green cultivars, but in this study, the red cultivar ‘Cherokee’ had a higher shoot dry weight than our only green cultivar, ‘Rex’. One possible explanation is that although ‘Cherokee’ exhibited the second-highest leaf anthocyanin content, it also could have displayed higher chlorophyll levels toward the center of the leaves, with the primary anthocyanin concentration predominantly localized at the edges [15]. However, leaf chlorophyll content was not measured during that study, which was a limitation.
With increasing PPFD, the shoot dry weights for ‘Cherokee’, ‘Rex’, and ‘Rouxai’ increased (Figure 4). This rise in shoot dry weight was most likely due to the increase in PPFD the plants received, which caused an increase in photosynthesis activity [16]. When PPFD conditions increase, the photosystem II reaction centers close to minimize photodamage. This protective mechanism results in a greater dissipation of absorbed light energy as heat (non-photochemical quenching) [17].
We hypothesized that cultivars with lower leaf anthocyanin content would increase in shoot weight with increasing PPFD. The cultivars with the three lowest leaf anthocyanin content values were ‘Rex’ (0.058 ACI), ‘Salanova® Red Batavia’ (0.324 ACI), and ‘Teodore’ (0.356 ACI), respectively. The cultivars with the three highest leaf anthocyanin content values were ‘Rouxai’ (0.458 ACI), ‘Cherokee’ (0.389 ACI), and ‘Salanova® Hydroponic Red Batavia’ (0.375 ACI), respectively (Figure 5). While ‘Rex’ was the only green lettuce cultivar used, we saw that all red lettuce cultivars except ‘Cherokee’ that had a low leaf anthocyanin content did not increase as much in shoot dry weight as ‘Rex’ (Figure 5). Studies on various lettuce cultivars have consistently shown that anthocyanins can hinder growth [14]. This reduction in growth is most likely attributed to the diminished availability of photons for photosynthesis due to anthocyanins [14].
The cultivars ‘Rouxai’ and ‘Cherokee’ exhibited increased growth with increasing PPFD, which is important because they were the cultivars with the first- and second-highest leaf anthocyanin content. ‘Rex’ had the lowest leaf anthocyanin content and the second highest shoot dry weight. It is known that plants can increase their anthocyanin concentrations under high light stress to mitigate photooxidative damage [16,18]. This could explain the increased growth associated with high leaf anthocyanin content values, suggesting their potential role in reducing photooxidative damage.
‘Salanova® Hydroponic Red Batavia’ and ‘Salanova® Red Batavia’ had the lowest shoot dry weights but the highest SLA (Figure 9). The higher SLA observed in these two cultivars can be primarily attributed to their low shoot weight. This increase in SLA is likely due to thinner leaves, a characteristic also observed in plants grown under 400 µmol·m−2·s−1 in a similar study [19]. However, this high SLA for ‘Salanova® Hydroponic Red Batavia’ and ‘Salanova® Red Batavia’ was not significantly influenced by the PPFD. Regarding cultivar differences in SLA, all cultivars, except for ‘Salanova® Hydroponic Red Batavia’ and ‘Salanova® Red Batavia’, showed a reduction in SLA with increasing PPFD (Figure 10). Other studies also showed that with increasing PPFD, a decrease in SLA is seen [13]. At lower PPFDs, an increase in SLA is observed, likely facilitating greater light absorption to enhance photosynthesis [20,21,22].
The cultivar differences for LUE showed that ‘Cherokee’, ‘Rex’, ‘Teodore’, and ‘Rouxai’ had the highest LUE, respectively (Figure 7). Increasing PPFD decreased the LUE for all cultivars (Figure 8). In a previous study [14], the authors found that the LUE of red cultivars was lower than that of green cultivars due to an inhibitory effect of anthocyanins on photosynthesis [14]. This study saw that ‘Cherokee’, a red cultivar, had on average a higher LUE than the green cultivar ‘Rex’; however, both decreased with increasing PPFD. The reason LUE for all cultivars decreased with increasing PPFD is most likely due to the ΦPSII decreasing with increasing PPFD [16]. Light is used more efficiently to drive photosynthesis at lower PPFDs, which is why plants have a lower LUE under higher PPFDs [16,23,24].
With increasing PPFD, the ΦPSII for all cultivars decreased (Figure 11). The highest ΦPSII among all cultivars was observed under lower PPFD conditions. This phenomenon can be attributed to the rising PPFD, which causes the closure of a large portion of the reaction centers in photosystem II, thus preventing them from accepting additional excited energy photons [16]. This trend aligns with findings from another study [16], where an increase in PPFD corresponded to a decrease in ΦPSII.
Toward the conclusion of the study, we found the pH of the nutrient solution rose to 7.30, surpassing the optimal pH range recommended for hydroponic systems, typically between 5.5 and 6.5. The pH was readjusted back into the optimal recommended range. We did observe tip-burn symptoms but did not document tip-burn incidence during this study. If this study is further repeated, it would be worth recording tip-burn incidence in each cultivar to determine if leaf anthocyanin content plays a role in reducing tip-burn symptoms.

5. Conclusions

This study examined how different lettuce varieties respond morphologically and physiologically when grown under varying levels of supplemental light in a greenhouse. ‘Cherokee’ and ‘Rouxai’ showed increased shoot dry weights as the light intensity increased. Interestingly, these varieties also had the highest leaf anthocyanin levels. This suggests that the higher anthocyanin content might have contributed to the increased shoot dry weight under higher light intensity, although this was mainly evident in ‘Cherokee’. Our hypothesis that cultivars with the lowest leaf anthocyanin content values could have an increased shoot weight with increasing PPFD levels was not validated.
This study highlighted significant differences between lettuce varieties, indicating the need for further investigation into the role of anthocyanins in plant growth. While we observed an increase in anthocyanin content with higher light intensity, particularly in red varieties, such as ‘Salanova® Red Batavia’ and ‘Salanova® Hydroponic Red Batavia’, exploring methods to boost anthocyanin content through light exposure could be valuable for future research in enhancing these pigments [25]. Employing an automated lighting control system to maintain a target DLI instead of supplying supplemental light could also provide insights into how DLI influences the relationship between anthocyanin content, plant morphology, and growth.

Supplementary Materials

The following supporting information can be downloaded at https://doi.org/10.5281/zenodo.10849484. Table S1: Average photosynthetic photon flux densities (PPFD) used as six lighting treatments in the trial. The lights were on for a photoperiod of 16 h, and the respective daily light integral (DLI) provided by the light-emitting diode (LED) lights, sunlight, and the sum of LED + sunlight was calculated for all treatments and each cultivar.

Author Contributions

Conceptualization, P.L.P., M.W.v.I. and R.S.F.; methodology, P.L.P., M.W.v.I. and R.S.F.; software, P.L.P.; validation, P.L.P., M.W.v.I., R.W.D., L.S., M.Y. and R.S.F.; formal analysis, P.L.P.; investigation, P.L.P., M.W.v.I. and R.S.F.; resources, M.W.v.I. and R.S.F.; data curation, P.L.P.; writing—original draft preparation, P.L.P., M.W.v.I., R.W.D., L.S., M.Y. and R.S.F.; writing—review and editing, P.L.P., M.W.v.I., R.W.D., L.S., M.Y. and R.S.F.; visualization, P.L.P., M.W.v.I., R.W.D., L.S., M.Y. and R.S.F.; supervision, M.W.v.I. and R.S.F.; project administration, M.W.v.I. and R.S.F.; funding acquisition, M.W.v.I. and R.S.F. All authors have read and agreed to the published version of the manuscript.

Funding

This research was funded by the USDA-NIFA-SCRI, award number 2018-51181-28365, project ‘LAMP: Lighting Approaches to Maximize Profits’.

Data Availability Statement

All data are available upon reasonable request.

Acknowledgments

We thank the Horticultural Physiology and the Controlled Environment Agriculture Lab members for the technical support provided. We also thank Cari Peters and J. R. Peters for the fertilizer donation.

Conflicts of Interest

Author Melanie Yelton was employed by the company Grow Big Consultants, 1519 Masonic Avenue, San Francisco, CA 94117, USA. The remaining authors declare that the research was conducted in the absence of any commercial or financial relationships that could be construed as a potential conflict of interest.

References

  1. Giampieri, F.; Cianciosi, D.; Alvarez-Suarez, J.M.; Quiles, J.L.; Forbes-Hernández, T.Y.; Navarro-Hortal, M.D.; Machì, M.; Casanova, R.d.J.P.; Espinosa, J.C.M.; Chen, X.; et al. Anthocyanins: What do we know until now? J. Berry Res. 2023, 13, 1–6. [Google Scholar] [CrossRef]
  2. Liakopoulos, G.; Nikolopoulos, D.; Klouvatou, A.; Vekkos, K.-A.; Manetas, Y.; Karabourniotis, G. The Photoprotective Role of Epidermal Anthocyanins and Surface Pubescence in Young Leaves of Grapevine (Vitis vinifera). Ann. Bot. 2006, 98, 257–265. [Google Scholar] [CrossRef] [PubMed]
  3. Oliveira, H.; Correia, P.; Pereira, A.R.; Araújo, P.; Mateus, N.; de Freitas, V.; Oliveira, J.; Fernandes, I. Exploring the Applications of the Photoprotective Properties of Anthocyanins in Biological Systems. Int. J. Mol. Sci. 2020, 21, 7464. [Google Scholar] [CrossRef]
  4. Assefa, A.D.; Hur, O.-S.; Hahn, B.-S.; Kim, B.; Ro, N.-Y.; Rhee, J.-H. Nutritional Metabolites of Red Pigmented Lettuce (Lactuca sativa) Germplasm and Correlations with Selected Phenotypic Characters. Foods 2021, 10, 2504. [Google Scholar] [CrossRef] [PubMed]
  5. Chalker-Scott, L. Environmental Significance of Anthocyanins in Plant Stress Responses. Photochem. Photobiol. 1999, 70, 1–9. [Google Scholar] [CrossRef]
  6. Landi, M.; Tattini, M.; Gould, K.S. Multiple functional roles of anthocyanins in plant-environment interactions. Environ. Exp. Bot. 2015, 119, 4–17. [Google Scholar] [CrossRef]
  7. Gould, K.S. Nature’s Swiss Army Knife: The Diverse Protective Roles of Anthocyanins in Leaves. J. Biomed. Biotechnol. 2004, 2004, 415423. [Google Scholar] [CrossRef] [PubMed]
  8. Medina-Lozano, I.; Bertolín, J.R.; Díaz, A. Nutritional value of commercial and traditional lettuce (Lactuca sativa L.) and wild relatives: Vitamin C and anthocyanin content. Food Chem. 2021, 359, 129864. [Google Scholar] [CrossRef]
  9. Saito, Y.; Shimizu, H.; Nakashima, H.; Miyasaka, J.; Ohdoi, K. The effect of light quality on growth of lettuce. IFAC Proc. Vol. 2010, 43, 294–298. [Google Scholar] [CrossRef]
  10. Samuolienė, G.; Viršilė, A.; Miliauskienė, J.; Haimi, P.J.; Laužikė, K.; Brazaitytė, A.; Duchovskis, P. The Physiological Response of Lettuce to Red and Blue Light Dynamics Over Different Photoperiods. Front. Plant Sci. 2021, 11, 610174. [Google Scholar] [CrossRef]
  11. Mohamed, S.J.; Rihan, H.Z.; Aljafer, N.; Fuller, M.P. The Impact of Light Spectrum and Intensity on the Growth, Physiology, and Antioxidant Activity of Lettuce (Lactuca sativa L.). Plants 2021, 10, 2162. [Google Scholar] [CrossRef]
  12. Song, J.; Huang, H.; Hao, Y.; Song, S.; Zhang, Y.; Su, W.; Liu, H. Nutritional quality, mineral and antioxidant content in lettuce affected by interaction of light intensity and nutrient solution concentration. Sci. Rep. 2020, 10, 2796. [Google Scholar] [CrossRef]
  13. Jin, W.; Ji, Y.; Larsen, D.H.; Huang, Y.; Heuvelink, E.; Marcelis, L.F.M. Gradually increasing light intensity during the growth period increases dry weight production compared to constant or gradually decreasing light intensity in lettuce. Sci. Hortic. 2023, 311, 111807. [Google Scholar] [CrossRef]
  14. Kim, C.; van Iersel, M.W. Morphological and Physiological Screening to Predict Lettuce Biomass Production in Controlled Environment Agriculture. Remote Sens. 2022, 14, 316. [Google Scholar] [CrossRef]
  15. Steyn, W.J.; Wand, S.J.E.; Holcroft, D.M.; Jacobs, G. Anthocyanins in vegetative tissues: A proposed unified function in photoprotection. New Phytol. 2002, 155, 349–361. [Google Scholar] [CrossRef]
  16. Elkins, C.; van Iersel, M.W. Longer Photoperiods with the Same Daily Light Integral Increase Daily Electron Transport through Photosystem II in Lettuce. Plants 2020, 9, 1172. [Google Scholar] [CrossRef]
  17. Lu, D.; Zhang, Y.; Zhang, A.; Lu, C. Non-Photochemical Quenching: From Light Perception to Photoprotective Gene Expression. Int. J. Mol. Sci. 2022, 23, 687. [Google Scholar] [CrossRef] [PubMed]
  18. Khoo, H.E.; Azlan, A.; Tang, S.T.; Lim, S.M. Anthocyanidins and anthocyanins: Colored pigments as food, pharmaceutical ingredients, and the potential health benefits. Food Nutr. Res. 2017, 61, 1361779. [Google Scholar] [CrossRef] [PubMed]
  19. Bhuiyan, R.; van Iersel, M.W. Only Extreme Fluctuations in Light Levels Reduce Lettuce Growth under Sole Source Lighting. Front. Plant Sci. 2021, 12, 619973. [Google Scholar] [CrossRef]
  20. Kim, J.K.; Kang, H.M.; Na, J.K.; Choi, K.Y. Changes in Growth Characteristics and Functional Components of Lactuca indica L. ‘Sunhyang’ Baby Leaf Vegetable by Light Intensity and Cultivation Period. Hortic. Sci. Technol. 2019, 37, 579–588. [Google Scholar] [CrossRef]
  21. Milla, R.; Reich, P.B.; Niinemets, Ü.; Castro-Díez, P. Environmental and developmental controls on specific leaf area are little modified by leaf allometry. Funct. Ecol. 2008, 22, 565–576. [Google Scholar] [CrossRef]
  22. Liu, Y.; Dawson, W.; Prati, D.; Haeuser, E.; Feng, Y.; van Kleunen, M. Does greater specific leaf area plasticity help plants to maintain a high performance when shaded? Ann. Bot. 2016, 118, 1329–1336. [Google Scholar] [CrossRef] [PubMed]
  23. Jin, W.; Formiga Lopez, D.; Heuvelink, E.; Marcelis, L.F.M. Light use efficiency of lettuce cultivation in vertical farms compared with greenhouse and field. Food Energy Secur. 2023, 12, e391. [Google Scholar] [CrossRef]
  24. Velez-Ramirez, A.I.; van Ieperen, W.; Vreugdenhil, D.; Millenaar, F.F. Plants under continuous light. Trends Plant Sci. 2011, 16, 310–318. [Google Scholar] [CrossRef]
  25. Lu, Y.; Zhang, M.; Meng, X.; Wan, H.; Zhang, J.; Tian, J.; Hao, S.; Jin, K.; Yao, Y. Photoperiod and shading regulate coloration and anthocyanin accumulation in the leaves of malus crabapples. Plant Cell Tissue Organ Cult. (PCTOC) 2015, 121, 619–632. [Google Scholar] [CrossRef]
Figure 1. Illustration of the greenhouse setup: (A) Representation of three benches arranged in the greenhouse, each holding two growing trays. A single light-emitting diode (LED) fixture positioned at the center over each bench provided supplemental lighting for both trays on the bench, resulting in six trays in use. (B) Within each tray, six sections were categorized based on the similarity of supplemental light received from the LED fixture, creating distinct light treatments. These six lighting treatments included six planting holes with similar photosynthetic photon flux densities.
Horticulturae 10 00437 g001
Figure 2. Photosynthetic photon flux density (PPFD) lighting treatments provided by the LED fixtures. The farther away from the LED light bar the plants were, the less supplemental light was provided. Plants directly under the LED fixture had high supplemental PPFD values. The six groups of six plants were grouped by tray based on their similarity in PPFD light measurements to create the six light treatments (different colors in the figure).
Horticulturae 10 00437 g002
Figure 3. Shoot dry weight of lettuce (Lactuca sativa ‘Rex’, ‘Cherokee’, ‘Rouxai’, ‘Teodore’, ‘Salanova Red Batavia’, and ‘Salanova Hydroponic Red Batavia’) plants grown under different photosynthetic photon flux densities (PPFDs) in deep water culture hydroponics. Bars with different letters indicate a significant difference among cultivars (p = 0.05, n = 6). Green bars indicate green cultivars, while red bars indicate red cultivars (mean ± standard error).
Horticulturae 10 00437 g003
Figure 4. Shoot dry weight of lettuce (Lactuca sativa ‘Rex’, ‘Cherokee’, ‘Rouxai’, ‘Teodore’, ‘Salanova Red Batavia’, and ‘Salanova Hydroponic Red Batavia’) plants grown under different photosynthetic photon flux densities (PPFDs) in deep water culture hydroponics. Lines show multiple regression analysis results, indicating significant PPFD interactions. Each data point represents the average of six plants (mean ± standard error).
Horticulturae 10 00437 g004
Figure 5. Leaf anthocyanin content of lettuce (Lactuca sativa ‘Rex’, ‘Cherokee’, ‘Rouxai’, ‘Teodore’, ‘Salanova Red Batavia’, and ‘Salanova Hydroponic Red Batavia’) plants grown under different photosynthetic photon flux densities (PPFDs) in deep water culture hydroponics. Bars with different letters indicate a significant difference between cultivars (p = 0.05, n = 6). Each data point represents the average of six plants. Green bars indicate green cultivars, while red bars indicate red cultivars (mean ± standard error).
Horticulturae 10 00437 g005
Figure 6. Leaf anthocyanin content of lettuce (Lactuca sativa ‘Rex’, ‘Cherokee’, ‘Rouxai’, ‘Teodore’, ‘Salanova Red Batavia’, and ‘Salanova Hydroponic Red Batavia’) plants grown under different photosynthetic photon flux densities (PPFDs) in deep water culture hydroponics. Lines show multiple regression analysis results, indicating significant PPFD interactions. Each data point represents the average of six plants (mean ± standard error).
Horticulturae 10 00437 g006
Figure 7. Light use efficiency of lettuce (Lactuca sativa ‘Rex’, ‘Cherokee’, ‘Rouxai’, ‘Teodore’, ‘Salanova Red Batavia’, and ‘Salanova Hydroponic Red Batavia’) plants grown under different photosynthetic photon flux densities (PPFDs) in deep water culture hydroponics. Bars with different letters indicate a significant difference between cultivars (p = 0.05, n = 6). Each data point represents the average of six plants. Green bars indicate green cultivars, while red bars indicate red cultivars (mean ± standard error).
Horticulturae 10 00437 g007
Figure 8. Light use efficiency (LUE) of lettuce (Lactuca sativa ‘Rex’, ‘Cherokee’, ‘Rouxai’, ‘Teodore’, ‘Salanova Red Batavia’, and ‘Salanova Hydroponic Red Batavia’) plants grown under different photosynthetic photon flux densities (PPFDs) in deep water culture hydroponics. LUE was calculated by dividing the total plant dry weight by the light integral. Lines show multiple regression analysis results, indicating significant PPFD interactions. Each data point represents the average of six plants (mean ± standard error).
Horticulturae 10 00437 g008
Figure 9. Specific leaf area of lettuce (Lactuca sativa ‘Rex’, ‘Cherokee’, ‘Rouxai’, ‘Teodore’, ‘Salanova Red Batavia’, and ‘Salanova Hydroponic Red Batavia’) plants grown under different photosynthetic photon flux densities (PPFDs) in deep water culture hydroponics. Bars with different letters indicate a significant difference between cultivars (p = 0.05, n = 6). Each data point represents the average of six plants. Green bars indicate green cultivars, while red bars indicate red cultivars (mean ± standard error).
Horticulturae 10 00437 g009
Figure 10. Specific leaf area (SLA) of lettuce (Lactuca sativa ‘Rex’, ‘Cherokee’, ‘Rouxai’, ‘Teodore’, ‘Salanova Red Batavia,’ and ‘Salanova Hydroponic Red Batavia’) plants grown under different photosynthetic photon flux densities (PPFDs) in deep water culture hydroponics. SLA was calculated by dividing the total leaf area by the shoot dry weight. Lines show multiple regression analysis results, indicating significant PPFD interactions. Each data point represents the average of six plants (mean ± standard error).
Horticulturae 10 00437 g010
Figure 11. Quantum yield of photosystem II (ΦPSII) of lettuce (Lactuca sativa ‘Rex’, ‘Cherokee’, ‘Rouxai’, ‘Teodore’, ‘Salanova Red Batavia’, and ‘Salanova Hydroponic Red Batavia’) plants grown under different photosynthetic photon flux densities (PPFDs) in deep water culture hydroponics. Lines show multiple regression analysis results, indicating significant PPFD interactions. Each data point represents the average of six plants (mean ± standard error).
Horticulturae 10 00437 g011
Disclaimer/Publisher’s Note: The statements, opinions and data contained in all publications are solely those of the individual author(s) and contributor(s) and not of MDPI and/or the editor(s). MDPI and/or the editor(s) disclaim responsibility for any injury to people or property resulting from any ideas, methods, instructions or products referred to in the content.

