Poinsettia Growth and Development Response to Container Root Substrate with Biochar


1
Department of Horticultural Sciences, Texas A&M University, 2133 TAMU, College Station, TX 77843, USA
2
Texas A&M AgriLife Research and Extension Center, Texas A&M University System, 1380 A&M Circle, El Paso, TX 79927, USA
3
Department of Plant Sciences, University of California, Davis, CA 95616, USA
4
Department of Horticultural Sciences, Texas A&M AgriLife Extension Service, College Station, TX 77843, USA
*
Author to whom correspondence should be addressed.
Horticulturae 2018, 4(1), 1; https://doi.org/10.3390/horticulturae4010001
Submission received: 6 November 2017
/
Revised: 20 December 2017
/
Accepted: 21 December 2017
/
Published: 4 January 2018
(This article belongs to the Special Issue Plant Production in Controlled Environment)
Abstract
:A greenhouse study was conducted to evaluate the growth and development of poinsettia ‘Prestige Red’ (Euphorbia pulcherrima) grown in a commercial peat-based potting mix (Sunshine Mix #1) amended with biochar at 0%, 20%, 40%, 60%, 80%, or 100% (by volume) at four different fertigation regimes: F1: 100 to 200 mg·L−1 nitrogen (N), F2: 200 to 300 mg·L−1 N (control), F3: 300 to 400 mg·L−1 N, or F4: 400 to 500 mg·L−1 N. The experiment was a two-factor factorial design with 10 replications for each combination of biochar by fertigation. As the percentage of biochar increased, root substrate pore space and bulk density increased, while container capacity decreased. Root rot and red bract necrosis only occurred in F4 combined with 100% biochar. Plants grown in 40% biochar had a similar growth and development to those in 0% biochar. Up to 80% biochar, plants exhibited no significant change, except in terms of dry weight, which decreased at higher biochar percentages (60% and 80%). In summary, at a fertigation rate of 100 mg·L−1 N to 400 mg·L−1 N, up to 80% biochar could be used as an amendment to peat-based root substrate with acceptable growth reduction and no changes in quality.
1. Introduction
The number of potted poinsettias (Euphorbia pulcherrima) sold in 2015 was over thirty million, ranking no. 1 in number sold, with a wholesale value of $140 million, ranking no. 2 in value of potted flowering plants in the U.S. [1]. Root substrate is important for poinsettia production since a healthy functional root system is crucial to poinsettia growth and development [2]. The majority of greenhouse poinsettia production uses peat-based root substrate [3].
Peatmoss-based root substrate is a dependable medium in the greenhouse industry [4]. Although the amount of peatmoss reserve is still significant, the need to find environmentally friendly substrates is increasing due to the annually decreasing volume of global peatland, the fragility of peatlands’ natural environments, and the large demand for peatmoss in the horticultural industry [5,6,7]. In Europe, environmental, scientific, and governmental agencies have proposed to limit the use and extraction of peatmoss [8]. In the U.S., there are currently no restrictions regarding peatmoss use [9]. However, the increase of fuel prices in recent years has increased the transportation cost of peatmoss, which is mined and shipped from Canada. Thus, many scientists are interested in finding less expensive, renewable, and locally available substitutes to reduce the use of peatmoss in the horticultural industry [9,10].
Many peatmoss substitutes have been evaluated in poinsettia greenhouse production. Hidalgo and Harkess [3] reported that better quality poinsettias were produced in peat-based root substrate amended with 25% earthworm castings made from sheep (Ovis aries) or cattle (Box taurus) manures than in substrate-only treatments. Poinsettias were successfully produced in loblolly pine (Pinus taeda) root substrate with small particles (2.38 mm screen) or large particles (4.76 mm screen) amended with 25% peatmoss [9]. Using root substrate blended with composted cotton burrs resulted in a lower dry weight and smaller bracts in poinsettias [11]. Composted organic materials amended with peat-based root substrate at different rates (50% poultry litter, yard trimmings or municipal solid waste composts; 25% polymer-dewatered bio solids or crab offal composts; 25% olive (Olea europaea) mill wastes compost; by volume) have been used for poinsettia production without a significant change in plant quality [12,13]. However, the disadvantages of those materials as alternative substrates are the lack of uniformity and risk of root substrate shrinkage during the plant production period [9,10].
Biochar, a byproduct of thermochemical pyrolysis for bio-energy production, has been considered as a possible root substrate amendment in greenhouse production to reduce the use of peatmoss [10]. Pyrolysis is a process of thermochemical decomposition of biomass at high temperatures (from 225–850 °C) with the absence of oxygen [14,15,16]. The characteristics of biochar depend on the thermal conversion process type (pyrolysis method and temperature) and the biomass source [17]. The high temperatures of the pyrolysis process make biochar a weed-, pathogen-, and insect-free root substrate amendment. Physical and chemical properties of biochar may vary due to differences in the production process and biomass source. Considering the production cost, biochar yield, and characteristics of biochar, the optimum biochar for use in agricultural production is probably produced at 450–550 °C by slow pyrolysis [18,19]. According to a survey conducted in 2013, 90% of 827 tons of biochar transaction occurred in the U.S. and Europe, yet compared to large scale enterprise selling, most biochar transactions were relatively small volumes and only used in small scale agricultural operations. The retail price of biochar ranged from $0.08 to $13.48 per kg, with an average of $2.48 per kg [20].
In recent years, multiple studies have reported that biochar has great potential to be used as an alternative root substrate in greenhouse production. In a study performed by Altland and Locke [21], amending 10% biochar (by volume) to peat-based root substrate increased the root substrate macronutrient retention capacity. By mixing 25% biochar pellets (mixture of biochar, wood flour, polylactic acid, and starch; by volume) with 75% peat-based substrate, Dumroese et al. [22] observed an improvement in the water retention of the substrate. This mixed substrate also had a desirable 40% porosity, although there was concern about the lower cation exchange capacity and higher C/N ratio of the substrate. Gu et al. [10] reported that up to 30% biochar (by volume) could be used as an amendment to peat-based root substrate to produce ‘Fireworks’ gomphrena (Gomphrena pulchella) without significant changes in plant quality. Other research showed that a small amendment of biochar (1 to 5% by weight) to coconut (Cocos nucifera) fiber-tuff potting root substrate improved tomato (Lycopersicum esculentum) and pepper (Capsicum annuum) growth [23]. Biochar made from sewage sludge with commercial peat-based substrate was reported to increase macronutrient content of media, increase lettuce (Lactuca sativa) biomass by 184 to 270%, increase microbial biomass by 966%, and reduce the transfer of metal concentration compared to the direct use of sewage sludge [24].
There is insufficient research to make a large-scale wholesale recommendation that biochar be added to soilless substrate for the production of greenhouse plants. Since a significant amount of peatmoss is used annually in the U.S. for poinsettia production, finding an alternative root substrate suitable for poinsettia production could substantially reduce the use of peatmoss. There is no data on using biochar as a root substrate for a long-season crop, such as poinsettias. The objectives of this experiment were to determine which biochar amendment percentage and fertigation combinations can provide optimal conditions for the growth and development of ‘Prestige Red’ poinsettias in greenhouse production.
2. Materials and Methods
2.1. Growth Substrate Treatments and Plant Materials
Six root substrates used in this experiment were sunshine Mix #1 (Sun Gro® Horticulture, Agawam, MA, USA) amended with biochar (provided by Department of Agricultural and Biological Engineering, Mississippi State University) at 0%, 20%, 40%, 60%, 80%, or 100% (by volume). The biochar used in this experiment was the byproduct of the fast pyrolysis of pinewood at 450 °C [10]. Particle size distribution was determined by passing 100 g biochar through 2.0-, 1.4-, and 0.59-mm soil sieves, and the weight was measured to determine the percentage of each particle size as 15.7, 27.3, 49.1, and 7.9% respectively. The biochar had an initial pH of 5.4 and an EC of 0.15 mS·cm−1 (using 2:1 method; [25]). Poinsettia ‘Prestige Red’ rooted cuttings (Ball Horticultural Company, West Chicago, IL, USA) were transplanted on 23 August 2013, to six-inch azalea plastic pots (1.25 L, The HC Companies, Inc., Middlefield, OH, USA) with one of the six substrates. Plants were pinched (removing apical growing point to leave seven to nine nodes) on 15 September 2013 to stimulate branching. Plants were grown in a glass greenhouse located on Texas A&M University campus in College Station, TX, USA. The average greenhouse temperature (T), relative humidity (RH), and daily light integral (DLI) in the greenhouse, recorded by Watchdog 450 sensors (Spectrum Technologies Inc., Paxinos, PA, USA), were 27.2 °C day/20.4 °C night, 59.8%, and 8.8 mol·m−2·day−1, respectively.
Banrot® 40 WP (Scotts Miracle-Gro Company, Marysville, OH, USA) was applied monthly as a drench to prevent root rot disease. Avid® 0.15 EC (Syngenta, Syngenta Crop Protection Inc., Greensboro, NC, USA) and Kontos® (OHP Inc., Mainland, PA, USA) were sprayed weekly in rotation to control whitefly, starting in late October. No growth regulators were applied in this experiment.
2.2. Fertigation Regimes
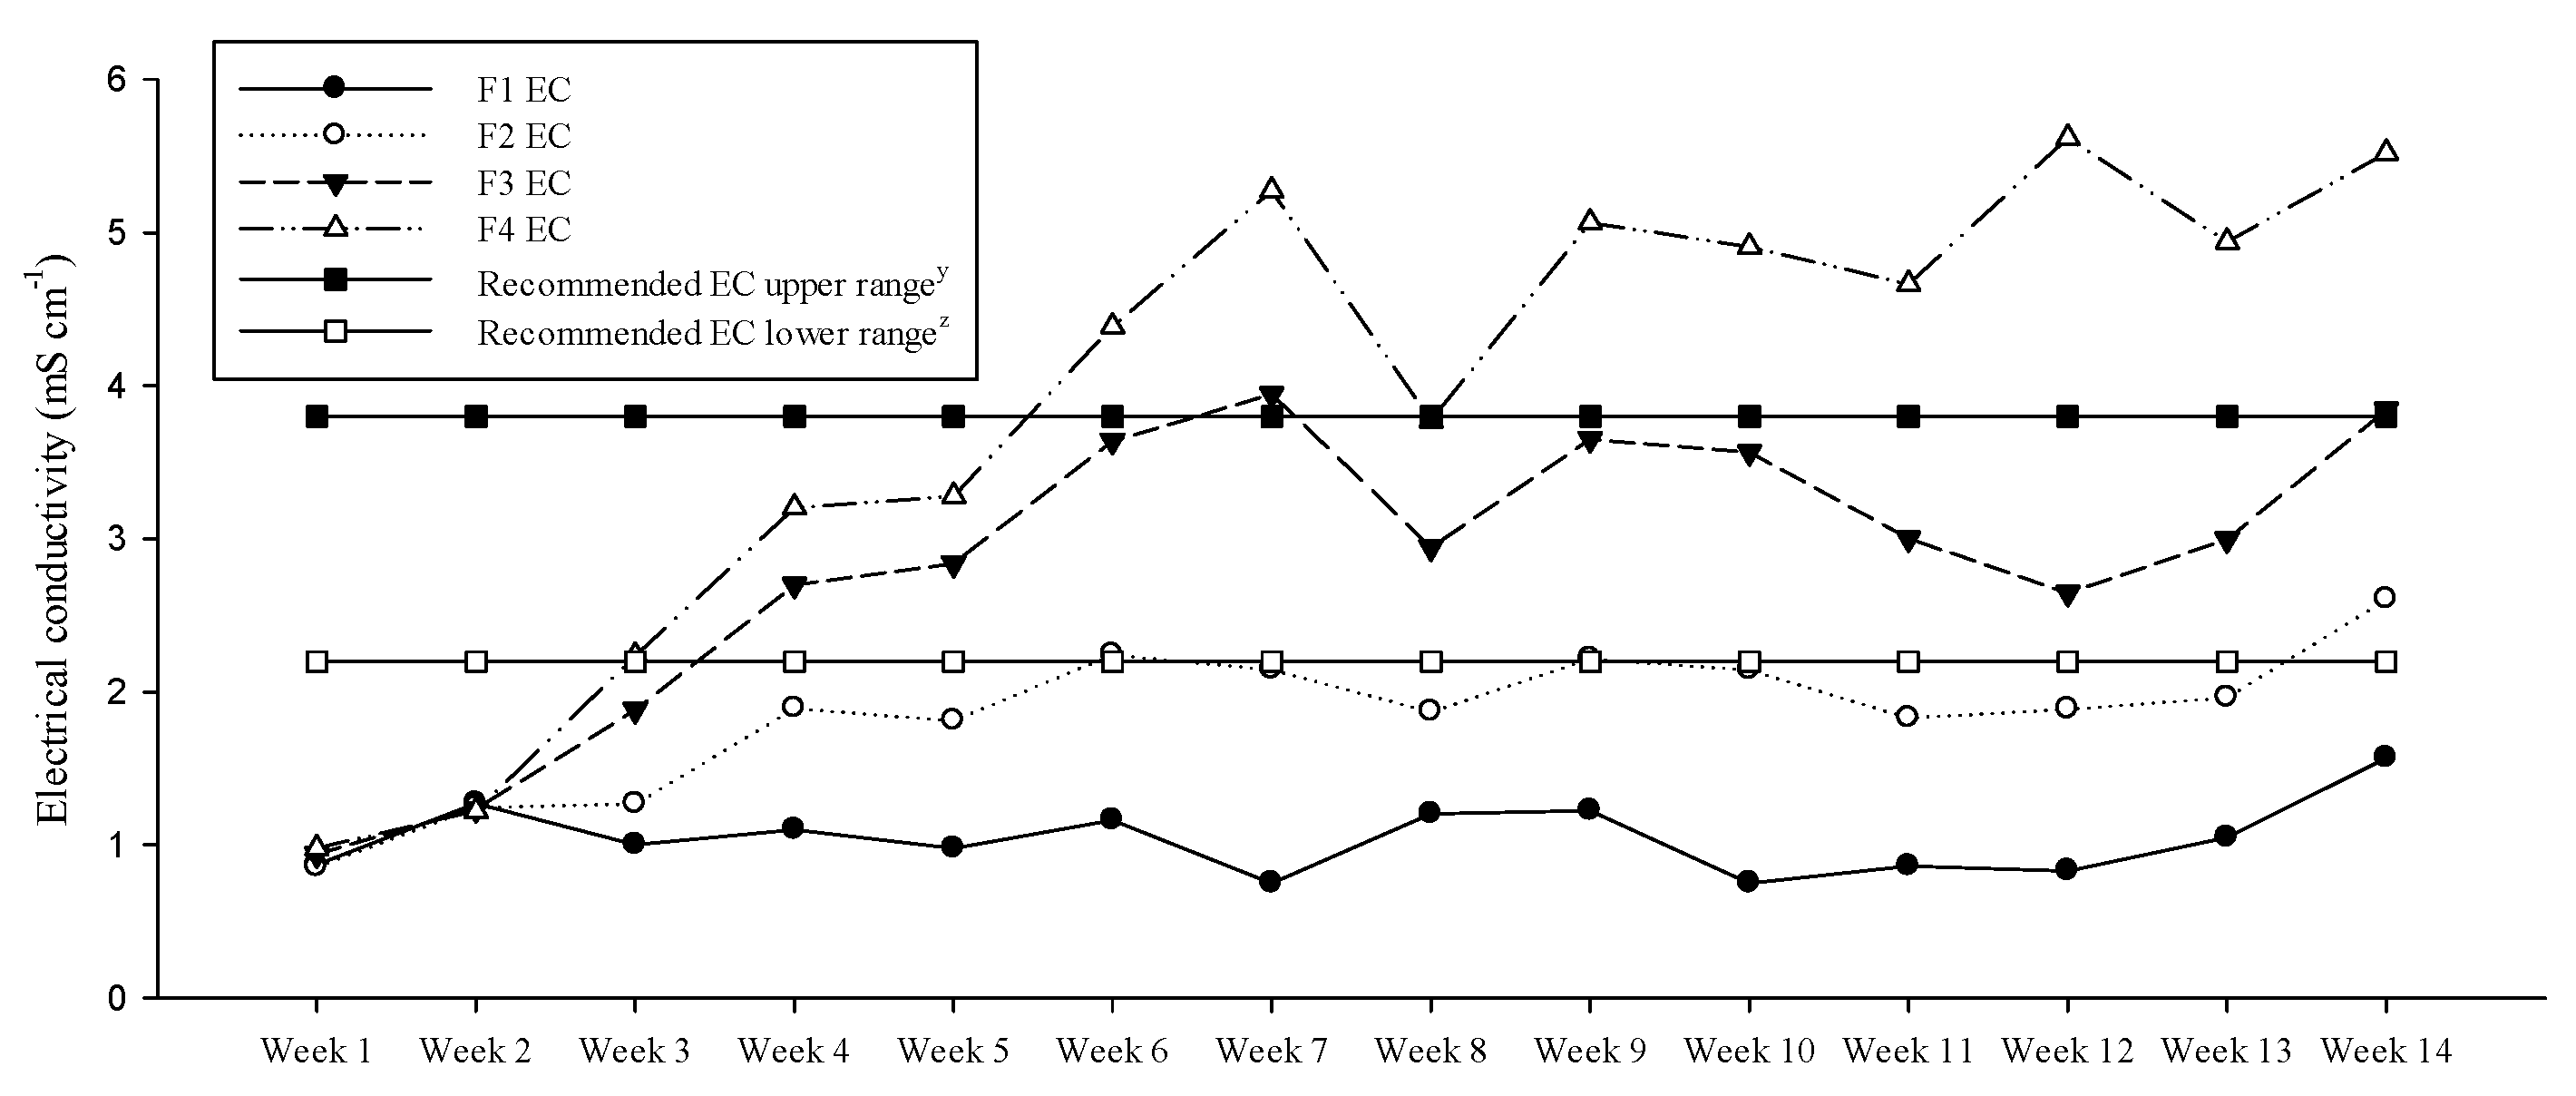
There were four fertigation regimes using a water soluble fertilizer (20N-4.4P-16.6K Peters 20-10-20; Scotts Miracle-Gro Company, Marysville, OH, USA). According to the Ecke poinsettia manual, the recommended fertilizer level is between 200 and 300 mg·L−1 N. In this experiment, we set fertigation regime 2 (F2: 200 to 300 mg·L−1 N) as the control fertilizer level [26]. Fertigation regime 1 (F1: 100 to 200 mg·L−1 N) was 100 mg·L−1 N lower than F2, fertigation regime 3 (F3: 300 to 400 mg·L−1 N) was 100 mg·L−1 N higher than F2, and fertigation regime 4 (F4: 400 to 500 mg·L−1 N) was 200 mg·L−1 N higher than F2. Fertilizer concentration in F2 was adjusted to keep the root substrate EC level around 2.2 mS·cm−1 [27] (Figure 1), and the other three fertigation regimes were adjusted accordingly every week, with all plants fertilized at 200 mg·L−1 N in week 1 and week 2. Irrigation was applied by hand uniformly within each treatment combination when pots were light in weight or multiple plants within the same treatment combination showed signs of water deficiency (wilting). Root substrate EC was determined weekly using the pour-through method [28,29].
2.3. Measurements
The root substrate physical characteristics, including the total porosity, container capacity, air space, bulk density, and bulk density at container capacity, were determined in a laboratory, according to the North Carolina State University Porometer Method [30]. Plant height was measured from the root substrate surface to the plant growing point. Two plant widths were measured across 1) the greatest plant width, and 2) the perpendicular width. Plant height and two widths were recorded biweekly, and the growth index (GI) was calculated as: GI = plant height/2 + (plant width 1 + plant width 2)/4. In week 9, gas exchange (photosynthetic rate, stomatal conductance to H2O, and transpiration rate) was measured by putting a recent fully expanded leaf in the leaf chamber (cuvette) of a CO2 analyzer (LI-6400XT, LI-COR Inc., Lincoln, NE, USA). The cuvette environment was maintained at 25 °C, 400 µmol·m−2·s−1 CO2 concentration, and 1200 µmol·m−2·s−1 photosynthetic photon flux density (PPFD). Due to a time limitation, gas exchange was only measured on five replications for each treatment combination of three biochar percentages (0%, 40%, and 100%) and three fertigation regimes (F1, F2, and F3). Shoot DW was determined after severing plant shoots at the root substrate surface and oven drying the shoots at 80 °C to a constant weight for 48 h.
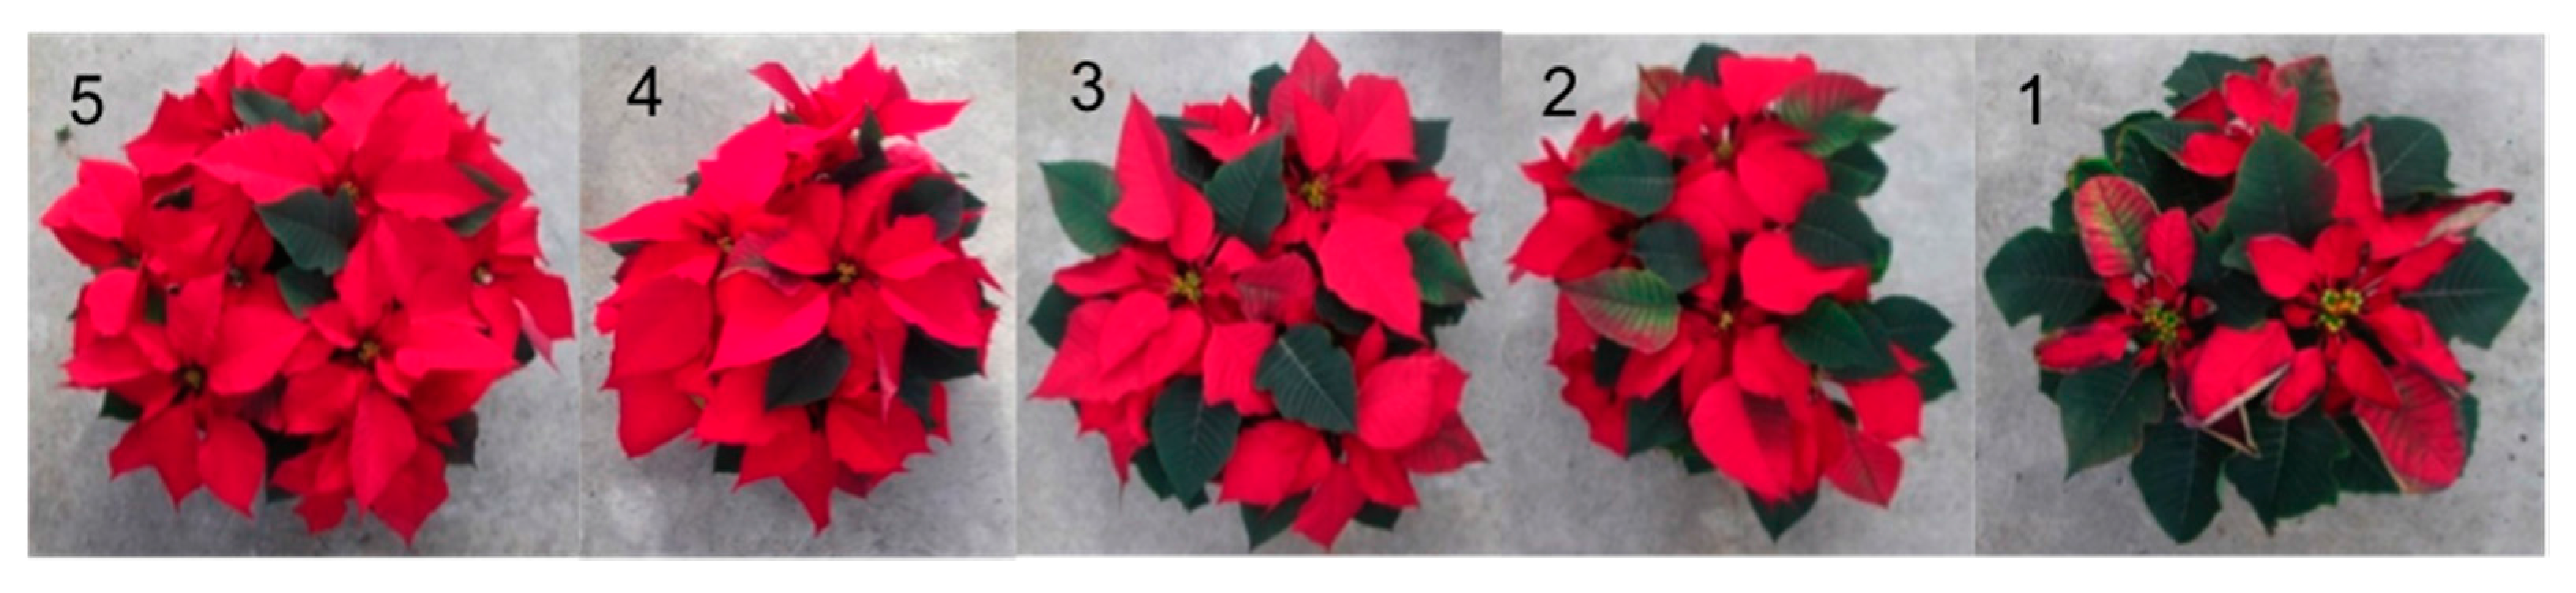
The relative greenness of leaves (SPAD) was measured by a chlorophyll meter (SPAD-502 Minolta Camera Co., Osaka, Japan) in weeks 10, 12, and 14. SPAD readings of the third fully expanded green leaf per plant were taken from three plants per treatment. The average number of red bracts from three main shoots was recorded from week 11, when they started turning red, to week 14. Plants were harvested when there were at least two-opened cyathia, which occurred in week 15. The number of green leaves, coverage of red bracts, and plant dry weight (DW) were determined at harvest. In week 15, the visual quality of shoots was rated from one to five on every plant based on three top view photos taken before harvest (Figure 2). A rating of 5 indicated plants had a full coverage of red bracts on the top layer with a round structure without horizontal branches or bracts with marginal necrosis. A 4 indicated plants had 90 to 100% red bracts coverage on the top layer with one or two horizontal branches. A 3 indicated plants had 75 to 90% coverage of red bracts on the top layer with less than two horizontal branches. A 2 indicated plants had 50 to 75% red bracts coverage on the top layer with one or two horizontal branches. A 1 indicated plants had less than 50% red bract coverage on the top layer with bracts with marginal necrosis, and with or without horizontal branches.
2.4. Experimental Design and Statistical Analysis
The experiment was a two-factor factorial design with 10 replications. There were six biochar percentages and four fertigation regimes, and a randomized complete block design was used within each treatment combination. A two-way analysis of variance (ANOVA version 9.3; SAS Institute, Cary, NC, USA) was used to test the effects of biochar percentage and fertigation regime on plant growth and development. When the main effect was significant, a mean separation was conducted using the Student-Newman-Keuls test at p < 5% significance level. Quadratic regression analyses were performed to ascertain the nature of the association between plant total dry weight and red bract dry weight using SigmaPlot (Version 12.0; Systat Software Inc., San Jose, CA, USA).
3. Results and Discussion
3.1. Growth Substrate Characteristics
Total porosity (TP) was the lowest at 60% (75.3) biochar, and there was no difference among 0, 20, 40, and 100% biochar (Table 1). Total porosity in all treatments was within the recommended range of 50 to 85%, except for 20% biochar [31]. Container capacity (CC) and air space (AS) of all root substrate treatments were within the recommended range (45–65% and 10–30%, respectively; Table 1). Air space (AS) increased as biochar percentage increased, while CC decreased as biochar percentage increased. Root substrate without biochar had the lowest AS, while 100% biochar had the highest AS.
In a study by Dumroese et al. [22], 25% biochar (by weight) of pelletized material made from a mixture of biochar and other ingredients increased the root substrate water holding capacity while maintaining a desirable air-filled porosity. Similarly, Dole and Wilkins [32] suggested that root substrate with approximately 20% AS and 50% CC was suitable for poinsettia growth. Bulk density (BD) increased as biochar percentage increased; however, BD at container capacity decreased as biochar percentage increased (Table 1). Bulk density for all root substrate treatments was lower than the lower range of the recommended range (0.19–0.7 g·cm−3) [31]. Considering that Yeager’s recommended BD was for field containers, the BD at CC for greenhouse substrate, 0.64–0.96 g·cm−3, suggested by Dole and Wilkins [32], was probably more suitable for comparison with the results presented in this experiment. For the BD at CC, 60% and 80% biochar was slightly lower than the suggested range, while 0%, 20%, 40%, and 100% biochar were within the suggested range, and 80% and 100% biochar were not significantly different [32] (Table 1). However, Dumroese et al. [22] reported decreased AS in root substrate with pelleted biochar. Biochar used in this experiment was a fine granulate biochar. Over 70% (by weight) of biochar particles were within 0.59–2.0 mm. The fine particle size could have contributed to the physical properties of biochar that allowed it to be used as greenhouse substrate amendment. Particle size and type of biochar most likely influenced the physical characteristics of the substrate, and thus further tests will be required for optimization of the particle size and biochar type for incorporating biochar as greenhouse substrate [33]. Overall, up to 60% biochar resulted in substrate characteristics that were closest to the recommended ranges for porosity, container capacity, air space, and bulk density (Table 1).
3.2. Root Substrate Electrical Conductivity
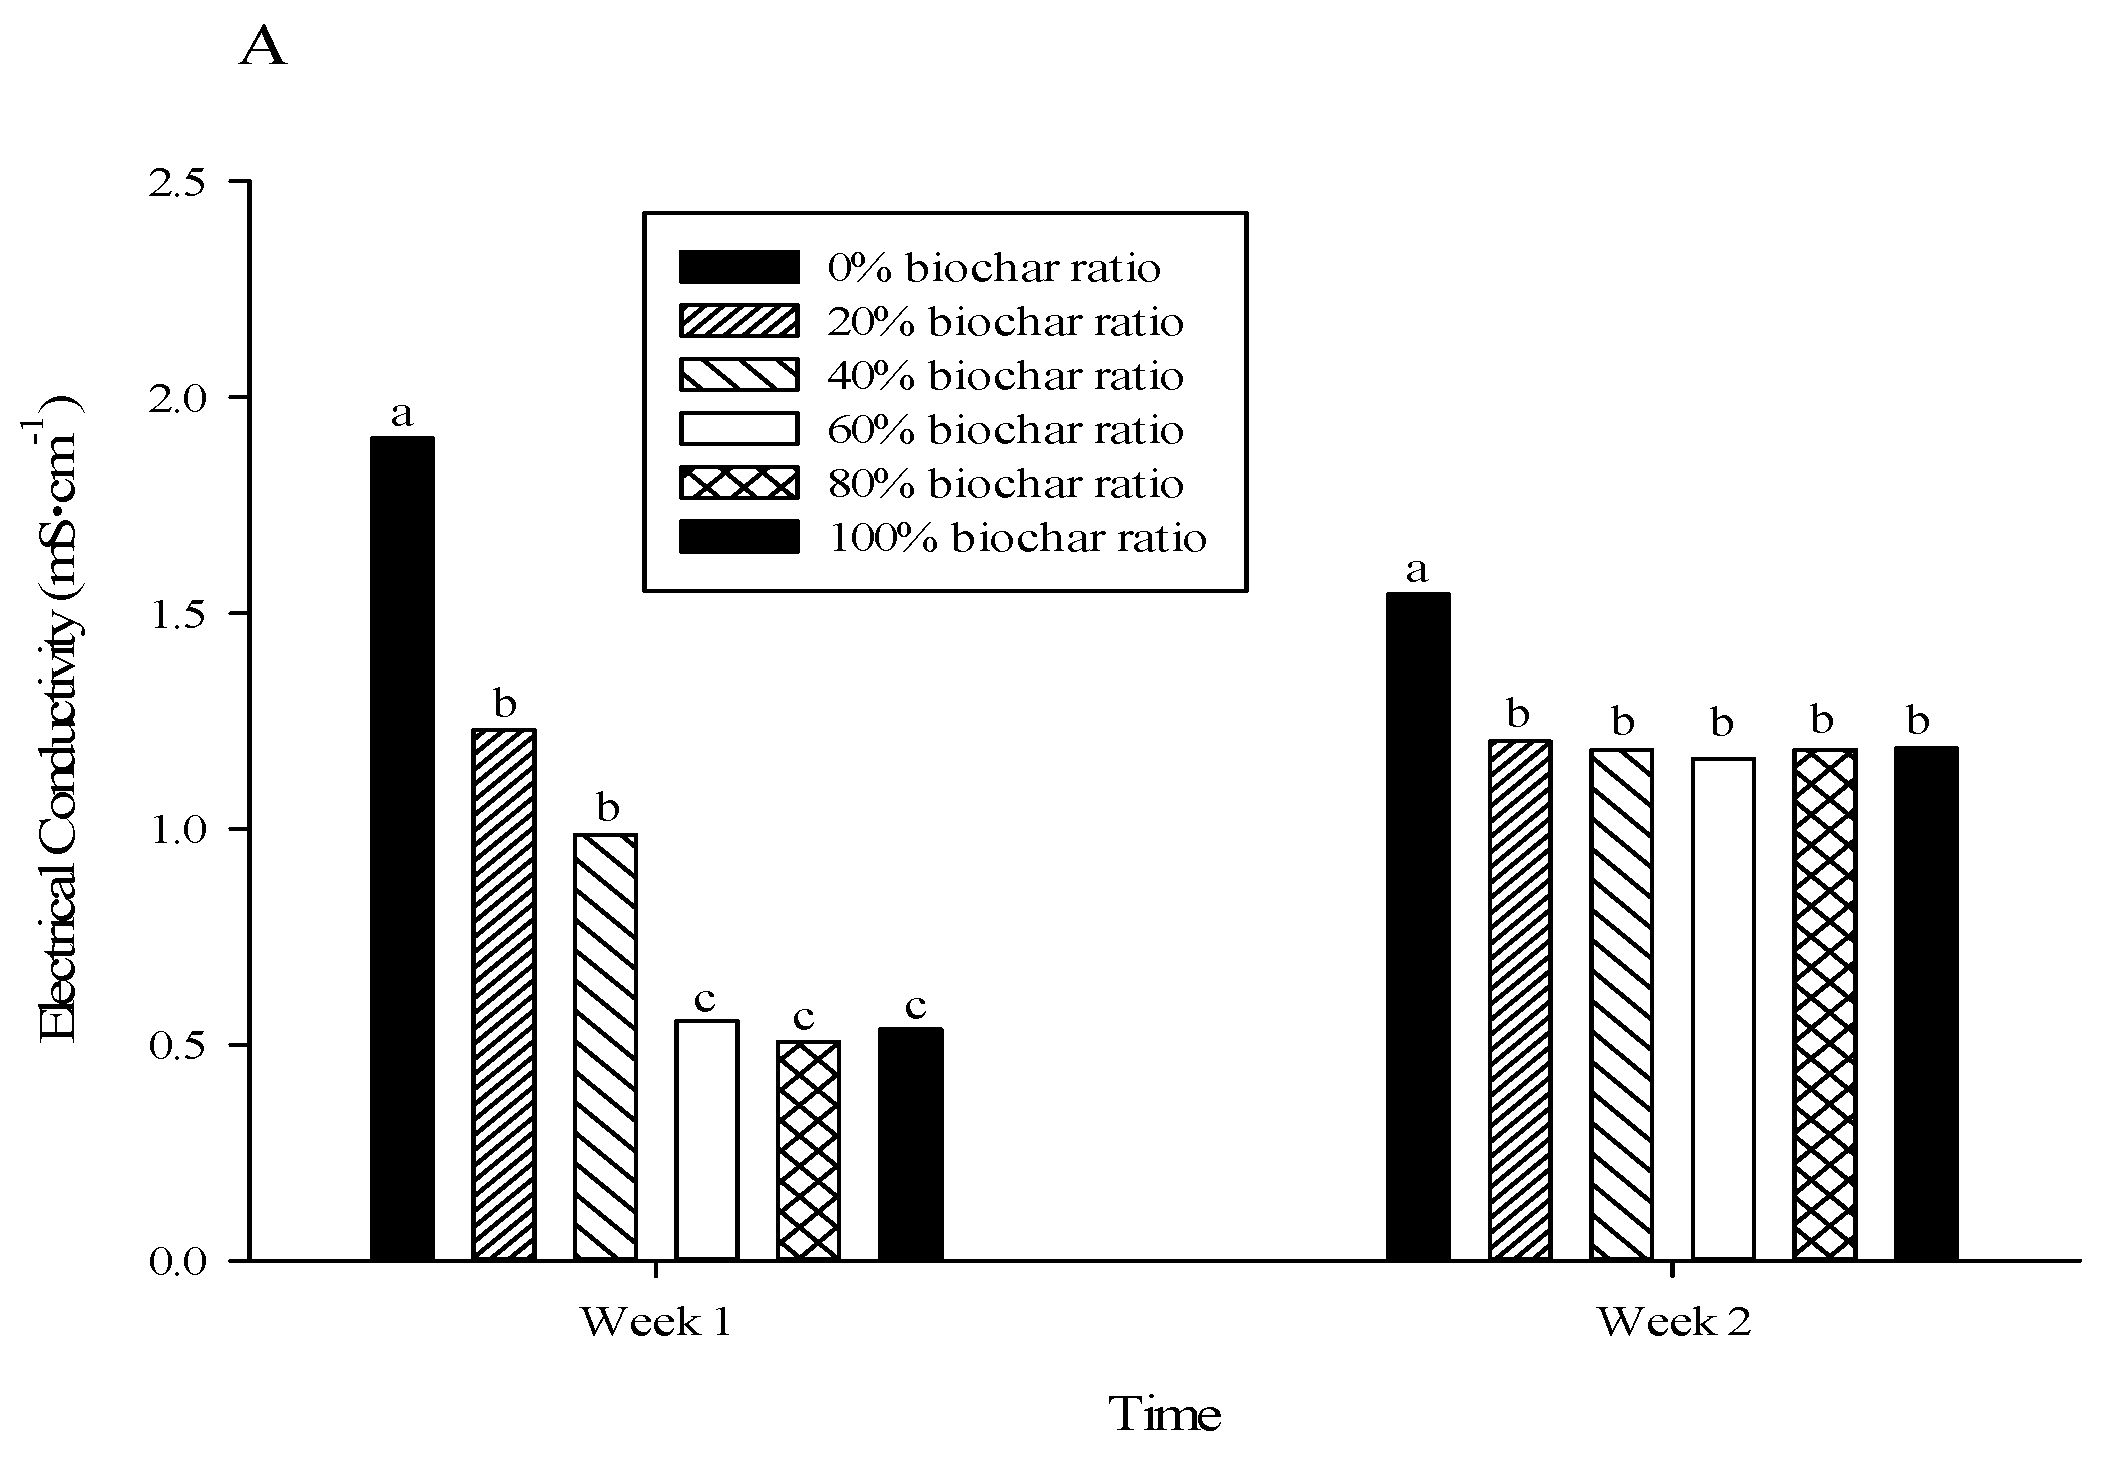
Biochar had a significant effect on the electrical conductivity (EC) of the root substrate leachate in the first two weeks after transplanting (Figure 3). Root substrate leachate EC was reduced as biochar percentage increased in week 1 (Figure 3). In week 2, 20 to 100% biochar had similar EC values, though they were lower than that of 0% biochar. From week 3, root substrate EC was mainly affected by fertigation regime and data were pooled from different biochar percentages (Figure 1). Starting from week 3, the EC of fertigation regime 1 (F1) was lower than the lowest EC level (1.5 mS·cm−1) recommended for poinsettia production [27]. The EC of root substrate fertilized under fertigation regime 2 (F2) was at the lower end of the acceptable range (2.2 to 3.8 mS·cm−1), that of root substrate fertilized under fertigation regime 3 (F3) was at the high end of the acceptable range [27], and the EC of root substrate fertilized under fertigation regime 4 (F4) was close to the highest EC level that can be used for poinsettia production (Figure 1). Steiner and Harttung [33] reported that the initial leachate EC of fresh biochar, made from crushed wood, was similar to that of unfertilized peatmoss, which matched our findings for the biochar-amended leachate during the first two weeks. The lower leachate EC of root substrate with biochar regardless of percentage at the first two weeks of the experiment could also be caused by the moderating effect of biochar on extreme fluctuation of macronutrients [21]. In addition, the lower leachate EC with the highest biochar percentages in week 1 may have been caused by the starter nutrients charge added in the Sunshine Mix #1. As more volume was taken up by biochar, less starter nutrients were present in the initial mix. The field studies revealed that by amending biochar into soil, it introduced highly stable C into the soil that could reduce the net soil CO2 equivalent emissions (CO2, NO2, and CH4) [34,35,36]. The mechanisms involve biochar change in the physical, chemical, and biological environment of the soil [37]. Since the root substrate has its own microenvironment, using biochar as an alternative substrate amendment could have a potential effect on greenhouse gas emission during greenhouse crop production and postproduction.
3.3. Plant Growth
There was no significant interaction between biochar percentage and fertigation regime on poinsettia growth index (GI; Table 2). There was no difference in GI between plants grown in 0% or 40% biochar from week 1 to week 15. Plant GI was the highest in plants grown in 20% biochar in Week 11 and Week 13. In week 13 and week 15, the GI of plants grown in 0%, 40%, 60%, or 80% biochar was not significantly different, and plants grown in 100% biochar had the lowest GI. Fertigation regimes had no significant effect on plant GI in weeks 1, 3, 5, or 9. There were no significant differences in plant GI among plants fertigated at F2, F3, or F4 in week 11, 13, and 15. In week 13 and week 15, plants fertigated at F2, F3, or F4 had a higher GI than plants fertigated at F1.
There was no significant interaction between biochar percentage and fertigation regime for the total DW, green leaf DW, or stem DW. Total DW was the highest at 20% biochar, and then decreased as the biochar percentage increased. There was no difference for green leaf DW and stem DW between 0% and 40% biochar (Table 3). Plants grown in 80% and 100% biochar had a significantly lower total leaf DW and stem DW. Fertigation regime had no significant effect on stem DW. Plants fertigated at F2, F3, and F4 had a higher total DW and green leaf DW than plants fertigated at F1. The results indicated that 20% biochar increased plant growth, as reflected in the higher total DW.
Growth index and DW of poinsettia were previously shown to be affected by root substrate compositions [9,11]. In our experiment, the low plant DW and the small plant GI in plants grown in 100% biochar may be caused by the lower CC of 100% biochar (Table 1), or the lack of starter nutrients in the initial mix. Jackson et al. [9] reported a similar reduction in poinsettia DW for plants grown in a low CC substrate. The results of this experiment indicated that 20% biochar increased plant growth, as reflected in the higher plant total DW. Similar to this result, Graber et al. [23] reported that a small amount of biochar (1–5% by weight) could increase tomato and pepper growth in soilless medium. Tian et al. [38] reported calathea (Calathea rotundifola cv. Fasciata) plants grown in 50% biochar had a higher total dry weight, yet those grown in 100% biochar had the lowest dry weights of three biochar percentages (0%, 50%, or 100% biochar by volume). These results suggest that amending peat-based root substrates with biochar could provide better root substrate physical properties and higher nutrient retention for plant growth than commercial peat-based substrate, though the suitable percentage of biochar may depend on plant species and the biochar type. For example, Steiner and Harttung [33] reported no increase in fresh weight or plant height for mini sunflowers grown in root substrate with biochar, and lower fresh weights were observed for those grown in 50% and 100% biochar compared to plants grown in 0% biochar. Our data for poinsettia suggest that perhaps the biochar percentages tested in their experiment may have already been too high, as 20% biochar was the optimal for poinsettia growth in our experiment. It is also possible that different plant growth responses across various experiments could be caused by the different type and particle size of the biochar used in the experiments.
3.4. Gas Exchange
There were no interactions between biochar percentage and fertigation regime for any leaf gas exchange parameters (Table 4). Plants grown in root substrate without biochar had the highest photosynthetic rate. There was no difference in photosynthetic rate among plants grown in 40% and 100% biochar. No differences were found in stomatal conductance and transpiration rate among the three biochar percentages. The photosynthetic rate, stomatal conductance, and transpiration rate increased as the fertigation rate increased, which might explain the lower plant DW and GI with F1. Previous research showed that a higher EC and fertilizer concentration could be the reason for the increased plant photosynthetic rate and growth as higher leaf N is strongly related to higher rates of photosynthesis [39,40].
3.5. Plant Quality
There were interactions between the biochar percentage and fertigation regime for the total number of leaves, the number of red bracts, and red bract DW (Table 5). At F1, the total number of leaves, the total number of red bracts, and red bract DW decreased as biochar percentage increased (Table 5). At F2, F3, and F4, plants grown in 100% biochar had the lowest total number of leaves, total number of red bracts, and red bract DW. For the total number of leaves and the total number of red bracts, there were no differences among 0%, 20%, 40%, 60%, and 80% biochar at F2, F3, or F4. Plants grown in 60%, 80%, and 100% biochar had a lower red bract DW than those grown in root substrate without biochar at F1 and F2. For plants grown in root substrate without biochar, fertigation regimes had no effect on red bract DW. For plants grown in root substrate with 20–80% biochar, bract DW was lower at F1. Red bract DW and the number of red bracts were determined because red bract is an important parameter of poinsettia’s quality and visual appeal [9]. The number of leaves is also important for plant quality. A lower total number of leaves could reduce plant visual appeal.
There was no interaction between biochar percentage and fertigation regime for the number of green leaves, which was significantly affected by the biochar percentage. There was no difference in the number of green leaves among plants grown in 0 to 80% biochar, and only 100% biochar reduced the number of green leaves significantly (data not shown). Similar to this result, Tian et al. [38] reported that Calathea makoyana grown in 100% biochar had a lower leaf biomass, lower leaf number, and smaller leaf surface area than those grown in 0% biochar.
There was no significant interaction between biochar percentage and fertigation regime for SPAD reading, or the average number of red bracts (from three main shoots) (Table 6). Biochar treatments had no significant effect on the plant SPAD reading. Plants fertigated at F2, F3, or F4 had a higher SPAD reading than plants fertigated at F1. SPAD readings are highly correlated with leaf nitrogen concentration and could have been affected by increasing the N fertilizer rate [41,42,43,44]. Plants grown in 20% biochar had a higher average number of red bracts than the other biochar percentages in week 12 (Table 6). Compared to plants grown in 0% biochar, the average number of red bracts was significantly affected by biochar percentages in weeks 12 and 14. Plants fertigated with F3 or F4 had higher average numbers of red bracts than plants fertigated with F1, and there was no difference between F1 and F2.
There were significant interactions between biochar percentage and fertigation regime for the final shoot rating, but only poinsettias grown in 100% biochar and fertigated with F4 had a significantly reduced visual quality (Table 7), with bract necrosis on eight out of 10 replications. Five plants in 100% biochar at F4 were dead due to pythium (Pythium spp.) root rot before week 15. Bract necrosis could be caused by any condition leading to reduced calcium uptake, such as root rot, or a low EC level or low percentages of ammonium [32]. On the other hand, medium to high EC could increase plant susceptibility to root disease [32]. The high bract necrosis and pythium root rot rate in plants grown in 100% biochar at F4 could be caused by the high fertilizer concentration of F4, biochar nutrient retention ability, and poor root development.
Plants grown in root substrate with biochar showed no differences compared to those in root substrate without biochar for plant quality ratings such as the SPAD reading, final shoot rating (except plants grown under the 100% biochar combined with F4), or average number of red bracts, indicating that a low concentration of fertilizer at 100 mg·L−1 to 200 mg·L−1 N was enough for poinsettia greenhouse production.
4. Conclusions
The results of this experiment indicated that peat-based commercial root substrate (Sunshine Mix #1) amended with up to 80% biochar could be used in poinsettia greenhouse production. Poinsettias grown in 20% biochar exhibited a greater growth than those in 0% biochar, as reflected in the higher plant total dry weight. On the other hand, 60% and 80% biochar treatments reduced dry weight, yet this reduction had no effect on the plant final visual rating or plant growth index. Poinsettias grown in 40% biochar were similar to those grown in Sunshine Mix #1. Treatment with 100% biochar suppressed plant growth as reflected in the plant growth index, plant dry weight, the total number of leaves, the total number of red bracts, and final shoot visual rating. A higher fertigation regime (F4) combined with 100% biochar increased the susceptibility of plants to root rot and bract necrosis. Fertigation regime F1 slightly decreased the plant SPAD reading and the average number of red bracts, but the effects were minor. Root substrate with biochar had a lower leachate EC during the first two weeks of the experiment, which did not affect plant growth and development. Based on the results of this research, a low fertilization regime (Fertigation regime F1, 100 mg·L−1 to 200 mg·L−1 N) could be considered for poinsettia production without affecting the quality of plants.
Biochar used in this experiment had an acceptable bulk density, container capacity, air space, and total porosity. These physical characteristics showed a potential for amending this type of biochar with peat-based root substrate in greenhouse production. Further experiments may be conducted to determine the suitable biochar percentage for biochar made from other sources using different pyrolysis methods with different particle sizes, as well as for other popular greenhouse crops, such as orchid (Phalaenopsis spp.), rose (Rosa spp.), chrysanthemum (Chrysanthemum spp.), and Easter lily (Lilium longiflorum). Biochar is considered a carbon sink for terrestrial ecosystems, and was reported to reduce greenhouse gas emission in field studies [45,46]. Therefore, introducing biochar to garden soil through transplanting plants produced with biochar and studying biochar’s effects on greenhouse gas emission during and after greenhouse production would be an interesting direction for future research.
Author Contributions
This work was a product of the combined effort of all the authors. All authors conceptualized and designed the study. Yanjun Guo performed the experiments, collected and analyzed the data, and wrote the manuscript with assistance from all other authors, mainly Mengmeng Gu. Genhua Niu, Terri Starman, and Astrid Volder provided technical advice and assistance when the study was conducted, and revised and improved the manuscript.
Conflicts of Interest
The authors declare no conflict of interest.
References
- Floriculture Crops 2015 Summary, 2016. National Agricultural Statistics Service, United States Department of Agriculture, April 2016. Available online: http://usda.mannlib.cornell.edu/usda/current/FlorCrop/FlorCrop-04-26-2016.pdf (accessed on 26 December 2017).
- Bilderback, T. Container Soils and Soilless Media; NCPM. No. 9; North Carolina Agricultural Extension Service: Raeigh, NC, USA, 1982. [Google Scholar]
- Hidalgo, P.R.; Harkess, R.L. Earthworm castings as a substrate for poinsettia production. HortScience 2002, 37, 304–308. [Google Scholar]
- Clarke, D. Wise use of peat in horticulture. Acta Hortic. 2008, 779, 161–164. [Google Scholar] [CrossRef]
- Apodaca, E.L. Mineral Commodity Summaries 2013; U.S. Geological Survey: Lakewood, CO, USA, 2013; pp. 114–116.
- Rivière, L.; Morel, P.J.M.; Charpentier, S. Growing media in French horticulture. Acta Hortic. 2008, 779, 33–38. [Google Scholar] [CrossRef]
- Robertson, R.A. Peat, horticulture and environment. Biodivers. Conserv. 1993, 2, 541–547. [Google Scholar] [CrossRef]
- Carlile, W.R. Growing media and environment lobby in UK 1997–2001. Acta Hortic. 2004, 644, 107–113. [Google Scholar] [CrossRef]
- Jackson, E.B.; Wright, R.D.; Barnes, M.C.; Hall, S. Pine tree substrate, nitrogen rate, article size, and peat amendment affect poinsettia growth and substrate physical properties. HortScience 2008, 43, 2155–2161. [Google Scholar]
- Gu, M.; Li, Q.; Steele, P.H.; Niu, G.; Yu, F. Growth of ‘Fireworks’ gomphrena grown in substrates amended with biochar. J. Food Agric. Environ. 2013, 11, 819–821. [Google Scholar]
- Wang, Y.; Blessington, T.M. Growth and interior performance of poinsettia in media containing composted cotton burrs. HortScience 1990, 25, 407–408. [Google Scholar]
- Ku, S.M.C.; Bouwkamp, J.C.; Gouin, F.R. Effects of compost source and timing of fertigation initiation on growth of potted poinsettia. Compost Sci. Util. 1998, 6, 57–66. [Google Scholar] [CrossRef]
- Papafotiou, M.; Phsyhalou, M.; Kargas, G.; Chatzipavlidis, I.; Chronopoulos, J. Olive-mill wastes compost as growing medium component for production of poinsettia. Sci. Hortic. 2004, 102, 167–175. [Google Scholar] [CrossRef]
- Bridgwater, A.V.; Meier, D.; Radlein, D. An overview of fast pyrolysis of biomass. Org. Geochem. 1999, 30, 1479–1493. [Google Scholar] [CrossRef]
- Phanphanich, M.; Mani, S. Impact of torrefaction on the grindability and fuel characteristics of forest biomass. Bioresour. Technol. 2011, 102, 1246–1253. [Google Scholar] [CrossRef] [PubMed]
- Salleh, M.A.M.; Kisiki, N.H.; Yusuf, H.M.; Ghani, W.A.W.A.K. Gasification of biochar from empty fruit bunch in a fluidized bed reactor. Energies 2010, 3, 1344–1352. [Google Scholar] [CrossRef]
- Spokas, K.A.; Cantrell, K.B.; Novak, J.M.; Archer, D.W.; Ippolito, J.A.; Collins, H.P.; Boateng, A.A.; Lima, I.M.; Lamb, M.C.; McAloon, A.J.; et al. Biochar: A synthesis of its agronomic impact beyond carbon sequestration. J. Environ. Qual. 2012, 41, 973–989. [Google Scholar] [CrossRef] [PubMed]
- Filiberto, D.M.; Gaunt, J.L. Practicality of biochar additions to enhance soil and crop productivity. Agriculture 2013, 3, 715–725. [Google Scholar] [CrossRef]
- Lehmann, J. Bio-energy in black. Front. Ecol. Environ. 2007, 5, 381–387. [Google Scholar] [CrossRef]
- Jirka, S.; Tomlinson, T. 2013 State of the Biochar Industy, Asurvey of Commercial Activity in the Biochar Field; International Biochar Initiative (IBI): Philadelphia, PA, USA, 2014; 61p, Available online: http://www.biochar-international.org/sites/default/files/State_of_the_Biochar_Industry_2013.pdf (accessed on 26 December 2017).
- Altland, J.E.; Locke, J.C. Biochar affects macronutrient leaching from a soilless substrate. HortScience 2012, 47, 1136–1140. [Google Scholar]
- Dumroese, R.K.; Heiskanen, J.; Englund, K.; Tervahauta, A. Pelleted biochar: Chemical and physical properties show potential use as a substrate in container nurseries. Biomass Bioenergy 2011, 35, 2018–2027. [Google Scholar] [CrossRef]
- Graber, E.R.; Harel, Y.M.; Kolton, M.; Cytryn, E.; Silber, A.; David, D.R.; Tsechansky, L.; Borenshtein, M.; Elad, Y. Biochar impact on development and productivity of pepper and tomato grown in fertigated soilless media. Plant Soil 2010, 337, 481–496. [Google Scholar] [CrossRef]
- Méndez, A.; Cárdenas-Aguiar, E.; Paz-Ferreiro, J.; Plaza, C.; Gascó, G. The effect of sewage sludge biochar on peat-based growing media. Biol. Agric. Hortic. 2017, 33, 40–51. [Google Scholar] [CrossRef]
- Cavins, T.J.; Gibson, J.L.; Whipker, B.E.; Fonteno, W.C. pH and EC Meters-Tool for Substrate Analysis; North Carolina State University: Raleigh, NC, USA, 2000; Available online: https://www.ces.ncsu.edu/depts/hort/floriculture/Florex/PH%20EC%20Meter%20Comparison.pdf (accessed on 26 December 2017).
- Ecke, P.; Faust, J.E.; Higgins, A.; Williams, J. The Ecke Poinsettia Manual; Ball Publishing: West Chicago, IL, USA, 2004. [Google Scholar]
- Ecke, P., Jr.; Matkin, O.A.; Hartley, D.E. Poinsettia Manual, 3rd ed.; Paul Ecke Poinsettias: Encinitas, CA, USA, 1990. [Google Scholar]
- LeBude, A.V.; Bilderback, T.E. Pour-through Extraction Procedure: A Nutrient Management Tool for Nursery Crops. North Carolina Cooperative Extension 1–8. August 2009. Available online: https://content.ces.ncsu.edu/the-pour-through-extraction-procedure-a-nutrient-management-tool-for-nursery-crops (accessed on 26 December 2017).
- Wright, R.D.; Grueber, K.L.; Leda, C. Medium nutrient extraction pour-through and saturated with medium extract procedures for poinsettia. HortScience 1990, 25, 658–660. [Google Scholar]
- Fonteno, W.C.; Cassel, D.K.; Larson, R.A. Physical properties of three container media and their effect on poinsettia height. J. Am. Soc. Hortic. Sci. 1981, 106, 736–741. [Google Scholar]
- Yeager, T.H.; Fare, D.C.; Lea-Cox, J.; Ruter, J.; Bilderback, T.E.; Gilliam, C.H.; Niemiera, A.X.; Warren, S.L.; Whitwell, T.E.; Wright, R.D.; et al. Best Management Practices: Guide for Producing Container-Grown Plants, 2nd ed.; Sourn Nurserymen’s Assoc.: Marietta, GA, USA, 2007. [Google Scholar]
- Dole, M.J.; Wilkins, H.F. Floriculture Principles and Species, 2nd ed.; Pearson Prentice Hall: Upper Saddle River, NJ, USA, 2005. [Google Scholar]
- Steiner, C.; Harttung, T. Biochar as growing media additive and peat substitute. Solid Earth Discuss. 2014, 6, 1023–1035. [Google Scholar] [CrossRef]
- Case, S.D.C.; McNamara, N.P.; Reay, D.S.; Whitaker, J. Can biochar reduce soil greenhouse gas emissions from a Miscanthus bioenergy crop? Glob. Chang. Biol. Bioenergy 2014, 6, 76–89. [Google Scholar] [CrossRef] [Green Version]
- Wang, J.; Pan, X.; Liu, Y.; Zhang, X.; Xiong, Z. Effects of biochar amendment in two soils on greenhouse gas emissions and crop production. Plant Soil 2012, 360, 287–298. [Google Scholar] [CrossRef]
- Rogovska, N.; Laird, D.; Cruse, R.; Fleming, P.; Parkin, T.; Meek, D. Impact of Biochar on Manure Carbon Stabilization and Greenhouse Gas Emissions. Soil Sci. Soc. Am. J. 2011, 75, 871–879. [Google Scholar] [CrossRef]
- Cayuela, M.L.; van Zwieten, L.; Singh, B.P.; Jeffery, S.; Roig, A.; Sánchez-Monedero, M.A. Biochar’s role in mitigating soil nitrous oxide emissions: A review and meta-analysis. Agric. Ecosyst. Environ. 2014, 191, 5–16. [Google Scholar] [CrossRef]
- Tian, Y.; Sun, X.; Li, S.; Wang, H.; Wang, L.; Cao, J.; Zhang, L. Biochar made from green waste as peat substitute in growth media for Calathea rotundifola cv. Fasciata. Sci. Hortic. 2012, 143, 15–18. [Google Scholar] [CrossRef]
- Ku, S.M.C.; Hershey, R.D. Leachate electrical conductivity and growth of potted poinsettia with leaching fractions of 0 to 0.4 J. Am. Soc. Hortic. Sci. 1991, 116, 802–806. [Google Scholar]
- Yelanich, M.V.; Biernbaum, J.A. Root-medium nutrient concentration and growth of poinsettia at three fertilizer concentrations and four leaching fractions. HortScience 1993, 118, 771–776. [Google Scholar]
- Gaborcik, N. Relationship between contents of chlorophyll (a + b) (SPAD values) and nitrogen of some temperate grasses. Photosynthetica 2003, 41, 285–287. [Google Scholar] [CrossRef]
- Li, Y.C.; Alva, A.K.; Calvert, D.V.; Zhang, M. A rapid nondestructive technique to predict leaf nitrogen status of grapefruit tree with various nitrogen fertilization practices. HortTechnology 1998, 8, 81–86. [Google Scholar]
- Neilsen, D.; Hogue, E.J.; Neilsen, G.H. Using SPAD-502 values to assess nitrogen status of apple trees. HortScience 1995, 30, 508–512. [Google Scholar]
- Sibley, J.L.; Eakes, D.J.; Gilliam, C.H.; Keever, G.J.; Dozier, W.A.; Himelrick, D.G. Foliar SPAD-502 meter values, nitrogen levels, and extractable chlorophyll for red maple selections. HortScience 1996, 31, 468–470. [Google Scholar]
- Lehmann, J.; Gaunt, J.; Rondon, M. Bio-char sequestration in terrestrial ecosystems—A review. Mitig. Adapt. Strateg. Glob. Chang. 2006, 11, 395–419. [Google Scholar] [CrossRef]
- Kammann, C.; Ratering, S.; Eckhard, C.; Müller, C. Biochar and hydrochar effects on greenhouse gas (carbon dioxide, nitrous oxide, and methane) fluxes from soils. J. Environ. Qual. 2012, 41, 1052–1066. [Google Scholar] [CrossRef] [PubMed]
Figure 1.
Weekly electrical conductivity (EC) of root substrate amended with biochar at different percentages, after four different fertigated regimes were initiated from week 3 (6 September 2013) and ended in week 15 (5 December 2013, termination of the experiment); y EC level considered as high for greenhouse poinsettia production using pour-through method [27]; z EC level considered as low for greenhouse poinsettia production using pour-through method [27].

Figure 2.
Photos of shoots used as the rating standard for visual rating. Numbers on the photo are ratings on a scale from 5 to 1.
Figure 2.
Photos of shoots used as the rating standard for visual rating. Numbers on the photo are ratings on a scale from 5 to 1.

Figure 3.
Week 1 and week 2 electrical conductivity (EC) of root substrate amended with biochar at different percentages. All plants were fertigated with 200 mg·L−1 N. Columns followed by the same letter within week are not significantly different according to Student-Newman-Keuls multiple comparison at p ≤ 0.05 (week 1, six days after potting, and week 2, 13 days after potting).


Table 1.
Root substrate physical properties (total porosity, TP; container capacity, CC; air space, AS; and bulk density, BD) of Sunshine Mix #1 amended with six different percentages of biochar (by volume).
Table 1.
Root substrate physical properties (total porosity, TP; container capacity, CC; air space, AS; and bulk density, BD) of Sunshine Mix #1 amended with six different percentages of biochar (by volume).
| Biochar Percentage | TP y (% vol) | CC x (% vol) | AS w (% vol) | BD v (g·cm−3) | BD u at CC (g·cm−3) |
|---|---|---|---|---|---|
| 0% | 84.2 ab z | 62.8 a | 21.5 e | 0.10 f | 0.73 a |
| 20% | 86.5 a | 61.5 a | 24.9 d | 0.11 e | 0.72 a |
| 40% | 79.8 bcd | 55.8 b | 24.0 d | 0.12 d | 0.68 b |
| 60% | 75.3 d | 46.3 c | 29.0 c | 0.14 c | 0.60 d |
| 80% | 78.5 cd | 47.2 c | 31.3 b | 0.16 b | 0.63 c |
| 100% | 82.6 abc | 46.9 c | 35.7 a | 0.18 a | 0.65 c |
| Suitable Range t | 50–85 | 45–65 | 10–30 | 0.19–0.70 | 0.64–0.96 |
z Means within a column followed by the same letter are not significantly different according to Student-Newman-Keuls multiple comparison at p ≤ 0.05; y Total porosity is equal to container capacity + air space; x Container capacity is (wet weight − dry weight)/volume of the sample; w Air space is the volume of water drained from the sample/volume of the sample; u Bulk density just after watering at container capacity; v Bulk density after oven drying at 80 °C for one week. t Recommended physical properties of container root substrate by Yeager et al. (2007) [31].
Table 2.
Growth index of ‘Prestige Red’ poinsettia grown in Sunshine Mix #1 amended with six different percentages of biochar and fertigated at four regimes from Week 1 to Week 15.
Table 2.
Growth index of ‘Prestige Red’ poinsettia grown in Sunshine Mix #1 amended with six different percentages of biochar and fertigated at four regimes from Week 1 to Week 15.
| Treatment | Growth Index (cm) | |||||||
|---|---|---|---|---|---|---|---|---|
| Week 1 | Week 3 | Week 5 | Week 7 | Week 9 | Week 11 | Week 13 | Week 15 | |
| Biochar | ||||||||
| 0% | 12.3 a z | 20.8 a | 25.4 a | 29.0 a | 32.7 ab | 37.7 b | 40.8 b | 44.1 ab |
| 20% | 12.5 a | 20.1 ab | 24.7 a | 30.0 a | 33.7 a | 39.5 a | 42.6 a | 45.2 a |
| 40% | 12.3 a | 20.3 a | 24.9 a | 29.1 a | 33.0 ab | 37.5 b | 40.8 b | 44.2 ab |
| 60% | 12.5 a | 19.5 b | 24.5 a | 28.6 a | 32.2 b | 36.9 b | 40.6 b | 43.7 ab |
| 80% | 12.0 a | 18.7 c | 24.2 a | 28.4 a | 30.7 c | 35.7 c | 39.5 b | 42.7 b |
| 100% | 11.8 a | 17.0 d | 22.3 b | 24.6 b | 26.4 d | 32.5 d | 35.1 c | 37.5 c |
| Fertigation | ||||||||
| F1 | 12.1 a | 19.4 a | 24.8 a | 29.1 a | 31.6 a | 35.6 b | 37.6 b | 40.9 b |
| F2 | 12.3 a | 19.2 a | 23.6 a | 28.6 ab | 31.7 a | 36.8 ab | 40.4 a | 43.1 a |
| F3 | 12.2 a | 19.7 a | 24.7 a | 27.9 bc | 31.4 a | 37.2 a | 40.8 a | 44.0 a |
| F4 | 12.4 a | 19.1 a | 24.2 a | 27.1 c | 31.0 a | 36.9 ab | 40.8 a | 43.7 a |
| Significance | ||||||||
| Biochar | NS y | *** | *** | *** | *** | *** | *** | *** |
| Fertigation | NS | NS | NS | *** | NS | *** | *** | *** |
| Biochar × Fertigation | NS | NS | NS | NS | NS | NS | NS | NS |
z Means within a column under each main factor followed by the same letter are not significantly different according to Student-Newman-Keuls multiple comparison at p ≤ 0.05.
Table 3.
Total dry weight (Total DW = green leaf DW + red bract DW + stem DW), green leaf and stem DW of ‘Prestige Red’ poinsettia grown in Sunshine Mix #1 amended with six different percentages of biochar and fertigated at four different regimes. All data were collected at 15 weeks after transplanting.
| Dry Weight (g) | |||
|---|---|---|---|
| Treatment | Total DW | Green Leaf DW | Stem DW |
| Biochar | |||
| 0% | 39.8 b z | 15.1 ab | 10.6 a |
| 20% | 43.1 a | 16.1 a | 10.9 a |
| 40% | 38.1 bc | 14.7 b | 10.7 a |
| 60% | 35.9 c | 14.2 b | 9.7 a |
| 80% | 32.0 d | 12.4 c | 8.7 b |
| 100% | 24.1 e | 9.3 d | 6.7 c |
| Fertigation | |||
| F1 | 32.5 b | 12.2 b | 9.5 a |
| F2 | 36.3 a | 13.9 a | 10.0 a |
| F3 | 36.6 a | 14.1 a | 9.4 a |
| F4 | 38.0 a | 14.9 a | 9.5 a |
z Means within a column under each main factor followed by the same letter are not significantly different according to Student-Newman-Keuls multiple comparison at p ≤ 0.05.
Table 4.
Leaf gas exchange (photosynthetic rate, stomatal conductance to H2O, transpiration rate) of ‘Prestige Red’ poinsettia nine weeks after transplanting in root substrate amended with 0%, 40%, and 100% biochar and fertigated with fertigation regimes 1, 2, and 3.
Table 4.
Leaf gas exchange (photosynthetic rate, stomatal conductance to H2O, transpiration rate) of ‘Prestige Red’ poinsettia nine weeks after transplanting in root substrate amended with 0%, 40%, and 100% biochar and fertigated with fertigation regimes 1, 2, and 3.
| Treatment | Photosynthetic Rate (μmol CO2 m−2·s−1) | Stomatal Conductance (mol H2O m−2·s−1) | Transpiration Rate (mmol H2O m−2·s−1) |
|---|---|---|---|
| Biochar | |||
| 0% | 10.83 a z | 0.41 a | 4.47 a |
| 40% | 8.13 b | 0.41 a | 4.55 a |
| 100% | 8.11 b | 0.42 a | 4.58 a |
| Fertigation | |||
| F1 | 7.09 b | 0.36 b | 4.23 b |
| F2 | 9.47 a | 0.42 ab | 4.63 ab |
| F3 | 10.51 a | 0.45 a | 4.74 a |
| Significance | |||
| Biochar | ** y | NS | NS |
| Fertigation | *** | * | * |
| Biochar × Fertigation | NS | NS | NS |
z Means within a column under each main factor followed by the same letter are not significantly different according to Student-Newman-Keuls multiple comparison at p ≤ 0.05. y NS (nonsignificant) or significant at p ≤ 0.05 (*), 0.01 (**), or 0.001 (***).
Table 5.
The total number of leaves (green leaf + red bract), the total number of red bracts, and red bract dry weight of ‘Prestige Red’ poinsettia 15 weeks after transplanting in Sunshine Mix #1 amended with six different percentages of biochar and fertigated at four different regimes. All data were collected at 15 weeks after transplanting.
| Biochar | Fertigation Regime | |||
|---|---|---|---|---|
| F1 | F2 | F3 | F4 | |
| Total Number of Leaves | ||||
| 0% | 235.7 a z | 219.2 a | 225.3 a | 211.5 a |
| 20% | 214.6 ab | 217.8 a | 232.8 a | 221.8 a |
| 40% | 222.5 ab | 210.4 a | 202.7 ab | 231.0 a |
| 60% | 188.4 b | 213.3 a | 224.9 a | 224.0 a |
| 80% | 194.2 b | 190.0 ab | 209.3 ab | 188.3 a |
| 100% | 155.0 c | 161.4 b | 187.0 b | 118.8 b |
| Total Number of Red Bracts | ||||
| 0% | 143.9 a | 128.3 a | 137.2 ab | 136.1 a |
| 20% | 127.7 ab | 130.8 a | 143.9 a | 137.5 a |
| 40% | 128.7 ab | 122.1 a | 121.9 ab | 142.1 a |
| 60% | 106.9 bc | 123.0 a | 134.0 ab | 136.4 a |
| 80% | 113.8 bc | 107.0 ab | 120.9 ab | 115.4 a |
| 100% | 96.8 c | 96.9 b | 115.7 b | 66.5 b |
| Dry Weight of Red Bract (g) | ||||
| 0% | 13.8 a z A y | 13.7 ab A | 13.8 ab A | 13.9 ab A |
| 20% | 12.2 a B | 15.0 a A | 15.1 a A | 15.4 a A |
| 40% | 10.3 b C | 12.4 bc B | 12.7 bc B | 14.4 ab A |
| 60% | 9.9 b B | 12.1 c A | 12.7 bc A | 12.7 b A |
| 80% | 9.6 b B | 11.0 c A | 11.9 c A | 11.0 c A |
| 100% | 7.1 c BC | 8.4 d AB | 9.7 d A | 5.9 d C |
z Means within a column under each fertigation regime followed by the same lower case letter are not significantly different according to Student-Newman-Keuls multiple comparison at P ≤ 0.05; y Means within a row of each biochar % followed by the same upper case letter are not significantly different according to Student-Newman-Keuls multiple comparison at p ≤ 0.05.
Table 6.
Leaf Chlorophyll index [Special Products Analysis Division (SPAD) values] at weeks 10, 12, and 14, the average number of red bracts from weeks 11 to 14, and final root visual rating of ‘Prestige Red’ poinsettia 15 weeks after transplanting in root substrate amended with six different percentages of biochar and fertilized with four fertigation regimes.
| Treatment | SPAD Values | Average Number of Red Bracts | |||||
|---|---|---|---|---|---|---|---|
| Week 10 | Week 12 | Week 14 | Week 11 | Week 12 | Week 13 | Week 14 | |
| Biochar | |||||||
| 0% | 41.7 a z | 45.1 a | 53.1 a | 1.5 ab | 5.2 b | 8.9 a | 10.1 ab |
| 20% | 41.5 a | 45.6 a | 53.7 a | 1.8 a | 5.8 a | 9.1 a | 10.5 a |
| 40% | 40.1 a | 44.1 a | 54.1 a | 1.3 ab | 4.9 b | 8.4 a | 9.8 ab |
| 60% | 40.3 a | 45.4 a | 54.4 a | 1.2 ab | 4.8 b | 8.4 a | 10.0 ab |
| 80% | 40.1 a | 46.2 a | 54.2 a | 1.2 ab | 4.8 b | 8.3 a | 9.7 b |
| 100% | 39.9 a | 45.4 a | 54.9 a | 1.1 b | 4.8 b | 8.4 a | 9.5 b |
| Fertigation | |||||||
| F1 | 39.0 b | 43.5 b | 53.0 b | 1.0 b | 4.6 c | 8.1 b | 9.3 b |
| F2 | 40.4 ab | 45.1 a | 54.1 ab | 1.2 ab | 4.8 bc | 8.4 ab | 9.7 b |
| F3 | 41.5 a | 46.4 a | 55.0 a | 1.5 a | 5.2 ab | 8.9 a | 10.2 a |
| F4 | 41.5 a | 46.2 a | 54.1 ab | 1.6 a | 5.5 a | 8.9 a | 10.3 a |
| Significance | |||||||
| Biochar | NS y | NS | NS | ** | *** | ** | ** |
| Fertigation | ** | *** | ** | ** | *** | *** | *** |
| Biochar × Fertigation | NS | NS | NS | NS | NS | NS | NS |
z Means within a column under each main factor followed by the same letter are not significantly different according to Student-Newman-Keuls multiple comparison at p ≤ 0.05; y NS (nonsignificant) or significant at p ≤ 0.01 (**), or 0.001 (***).
Table 7.
Shoot final visual rating of ‘Prestige Red’ poinsettia 15 weeks after transplanting in root substrate amended with six different percentages of biochar and fertilized with four fertigation regimes.
Table 7.
Shoot final visual rating of ‘Prestige Red’ poinsettia 15 weeks after transplanting in root substrate amended with six different percentages of biochar and fertilized with four fertigation regimes.
| Biochar | Fertigation | |||
|---|---|---|---|---|
| F1 | F2 | F3 | F4 | |
| Final Shoot Rating | ||||
| 0% | 4.4 a z A y | 4.1 a AB | 4.5 a A | 3.9 a B |
| 20% | 4.6 a A | 4.0 a A | 4.2 a A | 4.2 a A |
| 40% | 4.9 a A | 4.1 a B | 4.1 a B | 4.4 a B |
| 60% | 4.4 a A | 4.2 a A | 4.2 a A | 3.6 a A |
| 80% | 4.5 a A | 4.3 a A | 4.1 a A | 3.3 a B |
| 100% | 4.5 a A | 3.3 a A | 4.3 a A | 1.8 b B |
z Means within a column under each fertigation regime followed by the same lower case letter are not significantly different according to Student-Newman-Keuls multiple comparison at p ≤ 0.05; y Means within a row for each biochar % followed by the same upper case letter are not significantly different according to Student-Newman-Keuls multiple comparison at p ≤ 0.05.
© 2018 by the authors. Licensee MDPI, Basel, Switzerland. This article is an open access article distributed under the terms and conditions of the Creative Commons Attribution (CC BY) license (http://creativecommons.org/licenses/by/4.0/).
Share and Cite
MDPI and ACS Style
Guo, Y.; Niu, G.; Starman, T.; Volder, A.; Gu, M. Poinsettia Growth and Development Response to Container Root Substrate with Biochar. Horticulturae 2018, 4, 1. https://doi.org/10.3390/horticulturae4010001
AMA Style
Guo Y, Niu G, Starman T, Volder A, Gu M. Poinsettia Growth and Development Response to Container Root Substrate with Biochar. Horticulturae. 2018; 4(1):1. https://doi.org/10.3390/horticulturae4010001
Chicago/Turabian StyleGuo, Yanjun, Genhua Niu, Terri Starman, Astrid Volder, and Mengmeng Gu. 2018. "Poinsettia Growth and Development Response to Container Root Substrate with Biochar" Horticulturae 4, no. 1: 1. https://doi.org/10.3390/horticulturae4010001
Note that from the first issue of 2016, this journal uses article numbers instead of page numbers. See further details here.