Article

Effect of Paclobutrazol Application on Plant Photosynthetic Performance and Leaf Greenness of Herbaceous Peony

Jiangsu Key Laboratory of Crop Genetics and Physiology, College of Horticulture and Plant Protection, Yangzhou University, Yangzhou 225009, China
*
Author to whom correspondence should be addressed.
Horticulturae 2018, 4(1), 5; https://doi.org/10.3390/horticulturae4010005
Submission received: 25 October 2017 / Revised: 12 February 2018 / Accepted: 16 February 2018 / Published: 6 March 2018

Abstract

:
Paclobutrazol (PBZ) has been associated with effects on the photosynthetic capacity of plants. PBZ affects the growth and development of plants in general. However, little is known about the effects of PBZ on photosynthetic performance and related anatomical features of herbaceous peony (Paeonia lactiflora Pall.) leaves. In the present study, PBZ application resulted in a significant reduction in peony plant height. Furthermore, PBZ application significantly increased photosynthetic rate (Pn), transpiration rate (Tr) and water use efficiency (WUE), but significantly decreased intercellular CO2 concentration (Ci) at some stages from the bolting stage to the bud stage of the plants, compared to controls. Moreover, PBZ application increased the maximum quantum yield of PSII photochemistry (Fv/Fm), coefficient of photochemical quenching (qP) and intrinsic PSII efficiency (ΦPSII), but decreased the coefficient of non-photochemical quenching (qN) and non-photochemical quenching (NPQ). Leaves treated with PBZ had a heavy aggregation of chloroplasts close to the cell wall, with distinct grana lamellae, more and bigger starch grains (on average for a chloroplast), and fewer plastoglobuli, as compared to the control. PBZ increased chlorophyll content (SPAD) and the number of chloroplasts in individual cells in the foliar ultrastructure. PBZ-treated leaves had a darker green color with decreased luminosity (L*) and increased hue angle (h°). The results indicated that plants treated with PBZ were superior in terms of increased photosynthetic characteristics when compared with untreated controls. The direct cause of the increase in Pn and leaf greenness of PBZ-treated P. lactiflora may be the increase in chlorophyll content.

1. Introduction

Herbaceous peony (Paeonia lactiflora Pall.) is one of the most popular traditional flowers used in China, and has more than 400 years of cultivation history. Peony flowers in various forms. Its flowers are colorful and come in a wide array of varieties. These flowers are mainly used in display gardens, flowerbeds, by edges of forests, as potted plants, and as cut flowers. In China, there are few varieties suitable for cut flower production and plant cultivation. Only a few varieties are of high mechanical strength [1]. Most cultivars are prone to lodging, which is detrimental to their ornamental and commercial value. The exogenous application of phytohormones has emerged as an alternative approach for strengthening and improving plants without altering genetic makeup. Paclobutrazol (PBZ), a synthetic plant growth regulator, is a triazole-type inhibitor of gibberellin (GA) biosynthesis which affects plant growth and development [2]. It inhibits the activity of ent-kaurene oxidase, which is an enzyme in the GA biosynthetic pathway that catalyzes the oxidation of ent-kaurene to ent-kaurenoic acid [3]. PBZ application has reduced plant height, improved stem diameter and leaf number, altered root architecture [4], directly contributed to yield increase, and indirectly reduced the event of lodging [5] Applications of PBZ have been reported in mango [6], cowpea [7], peanut [8] and other crops. However, few studies have been conducted on improving the quality of peony and enhancing mechanical resistance. Hence, there is an important need to improve the quality of peony for outdoor cultivation and increase various types of growth indicators through PBZ application. This would promote the commercialization of peony production in China and elsewhere. In addition to the above-mentioned effects, we found that PBZ could significantly darken the green color of leaves, which has rarely been reported. Photosynthesis, which is one of the most fundamental metabolic processes in plants, is directly related to the abundance of chlorophyll which absorbs light energy that drives carbon-fixation. Hence, leaf greenness may be closely correlated to photosynthetic performance.
Previous investigations have indicated that PBZ application has improved photosynthetic capacity of crop plants [9]. According to Zhou [10], PBZ significantly increased chlorophyll content and photosynthetic rates, prolonged leaf longevity, and increased green pod area of rape (Brassica napus). Tekalign found that foliar-applied PBZ on potato gave a higher rate of net photosynthesis than a soil drench, and all significantly reduced total leaf area and increased assimilate partitioning to the tubers of potato [11]. However, to date, its mode of action remains largely unknown.
The photosynthetic capacity of plants is closely correlated to many kinds of growth indices. It has been proven that improving photosynthetic capacity can increase quantity and quality of flowers, flowering longevity and ornamental value [12]. The chloroplast is the site of photosynthesis. Their size, quantity, number of grains, thickness of the grana, and number of grana lamellae will have an impact on photosynthesis. In the present study, the objective was to determine the effect of PBZ on the photosynthetic characteristics and ultrastructure of peony leaves. Specifically, the cause of the increase in leaf greenness after PBZ application and the relationship between leaf greenness and photosynthetic capacity was investigated by ultrastructural observation.

2. Materials and Methods

2.1. Plant Materials

A 3-year-old tall peony cultivar ’Zi Fengyu’ was selected for this study because it has been studied in the germplasm repository of Horticulture and Plant Protection College at Yangzhou University, Jiangsu Province, China (32°30′ N, 119°25′ E). The field-grown plants grew well in the natural environment with standard cultural management practices. A foliar spray of PBZ (Solarbio, Beijing, China) at 100 mg/mL was applied once a week for 4 consecutive weeks on windless evenings from the bolting stage of the plants in April to the bud stage in May 2016, each consecutive week considered as a stage (S1 = week 1, S2 = week 2, S3 = week 3, S4 = week 4), while the control plants were treated with deionized water at the same time. There were 40 plants for each treatment. Chlorophyll content, photosynthetic parameters, morphological indexes and leaf ultrastructure of plants were measured every seven days after the first treatment application.

2.2. Photosynthetic and Chlorophyll Fluorescence Parameters

Photosynthetic rate (Pn), intercellular CO2 concentration (Ci), stomatal conductance (gs), transpiration rate (Tr) and water use efficiency (WUE) were measured with a portable photosynthesis system (LI-6400XT; LI-COR, Lincoln, NE, USA) between 8:00 and 10:00 a.m. once a week. Chlorophyll fluorescence parameters were measured using a portable fluorescence system PAM-2500 Chlorophyll Fluorometer (WALZ, Effeltrich, Germany) between 7:00 and 10:00 p.m. After 30 min of dark adaptation and a 5.2 min measurement, the initial fluorescence yield (Fo) and maximal fluorescence yield (Fm) emitted during a saturating red radiation (630 nm) pulse were determined. Photochemical efficiency of PSII was estimated as the maximum quantum yield of PSII from the variable-to-maximal fluorescence ratio (Fv/Fm) and intrinsic PSII efficiency (ΦPSII). In addition, non-photochemical quenching (NPQ), coefficient of photochemical quenching (Qp) and coefficient of non-photochemical quenching (qN) of functional leaves were also measured in vivo. All the parameters were measured on the third fully expanded leaves from the plant apex of six different plants on the same day (Day 7 after treatment).

2.3. Chlorophyll Content

The measurement of the relative chlorophyll index was conducted using a SPAD502 meter (Konica Minolta Optic Inc., Tokyo, Japan) on the third fully expanded leaves from the plant apex between 8:00 and 10:00 a.m. For the measurement of chlorophyll concentrations, leaf tissues on the third fully expanded leaves from the plant apex were collected, suspended in 10 mL of 80% acetone, and kept overnight in the dark. The extract absorption was determined at 663 and 645 nm using a UV2550 spectrophotometer (Shimadzu, Kyoto, Japan). Total chlorophyll concentration (Chl) was calculated using the following equations [13]: chlorophyll a (Chla) = 12.7A663 − 2.69A645; chlorophyll b (Chlb) = 22.9A645 − 24.68A663; and, Chl = Chla + Chlb.

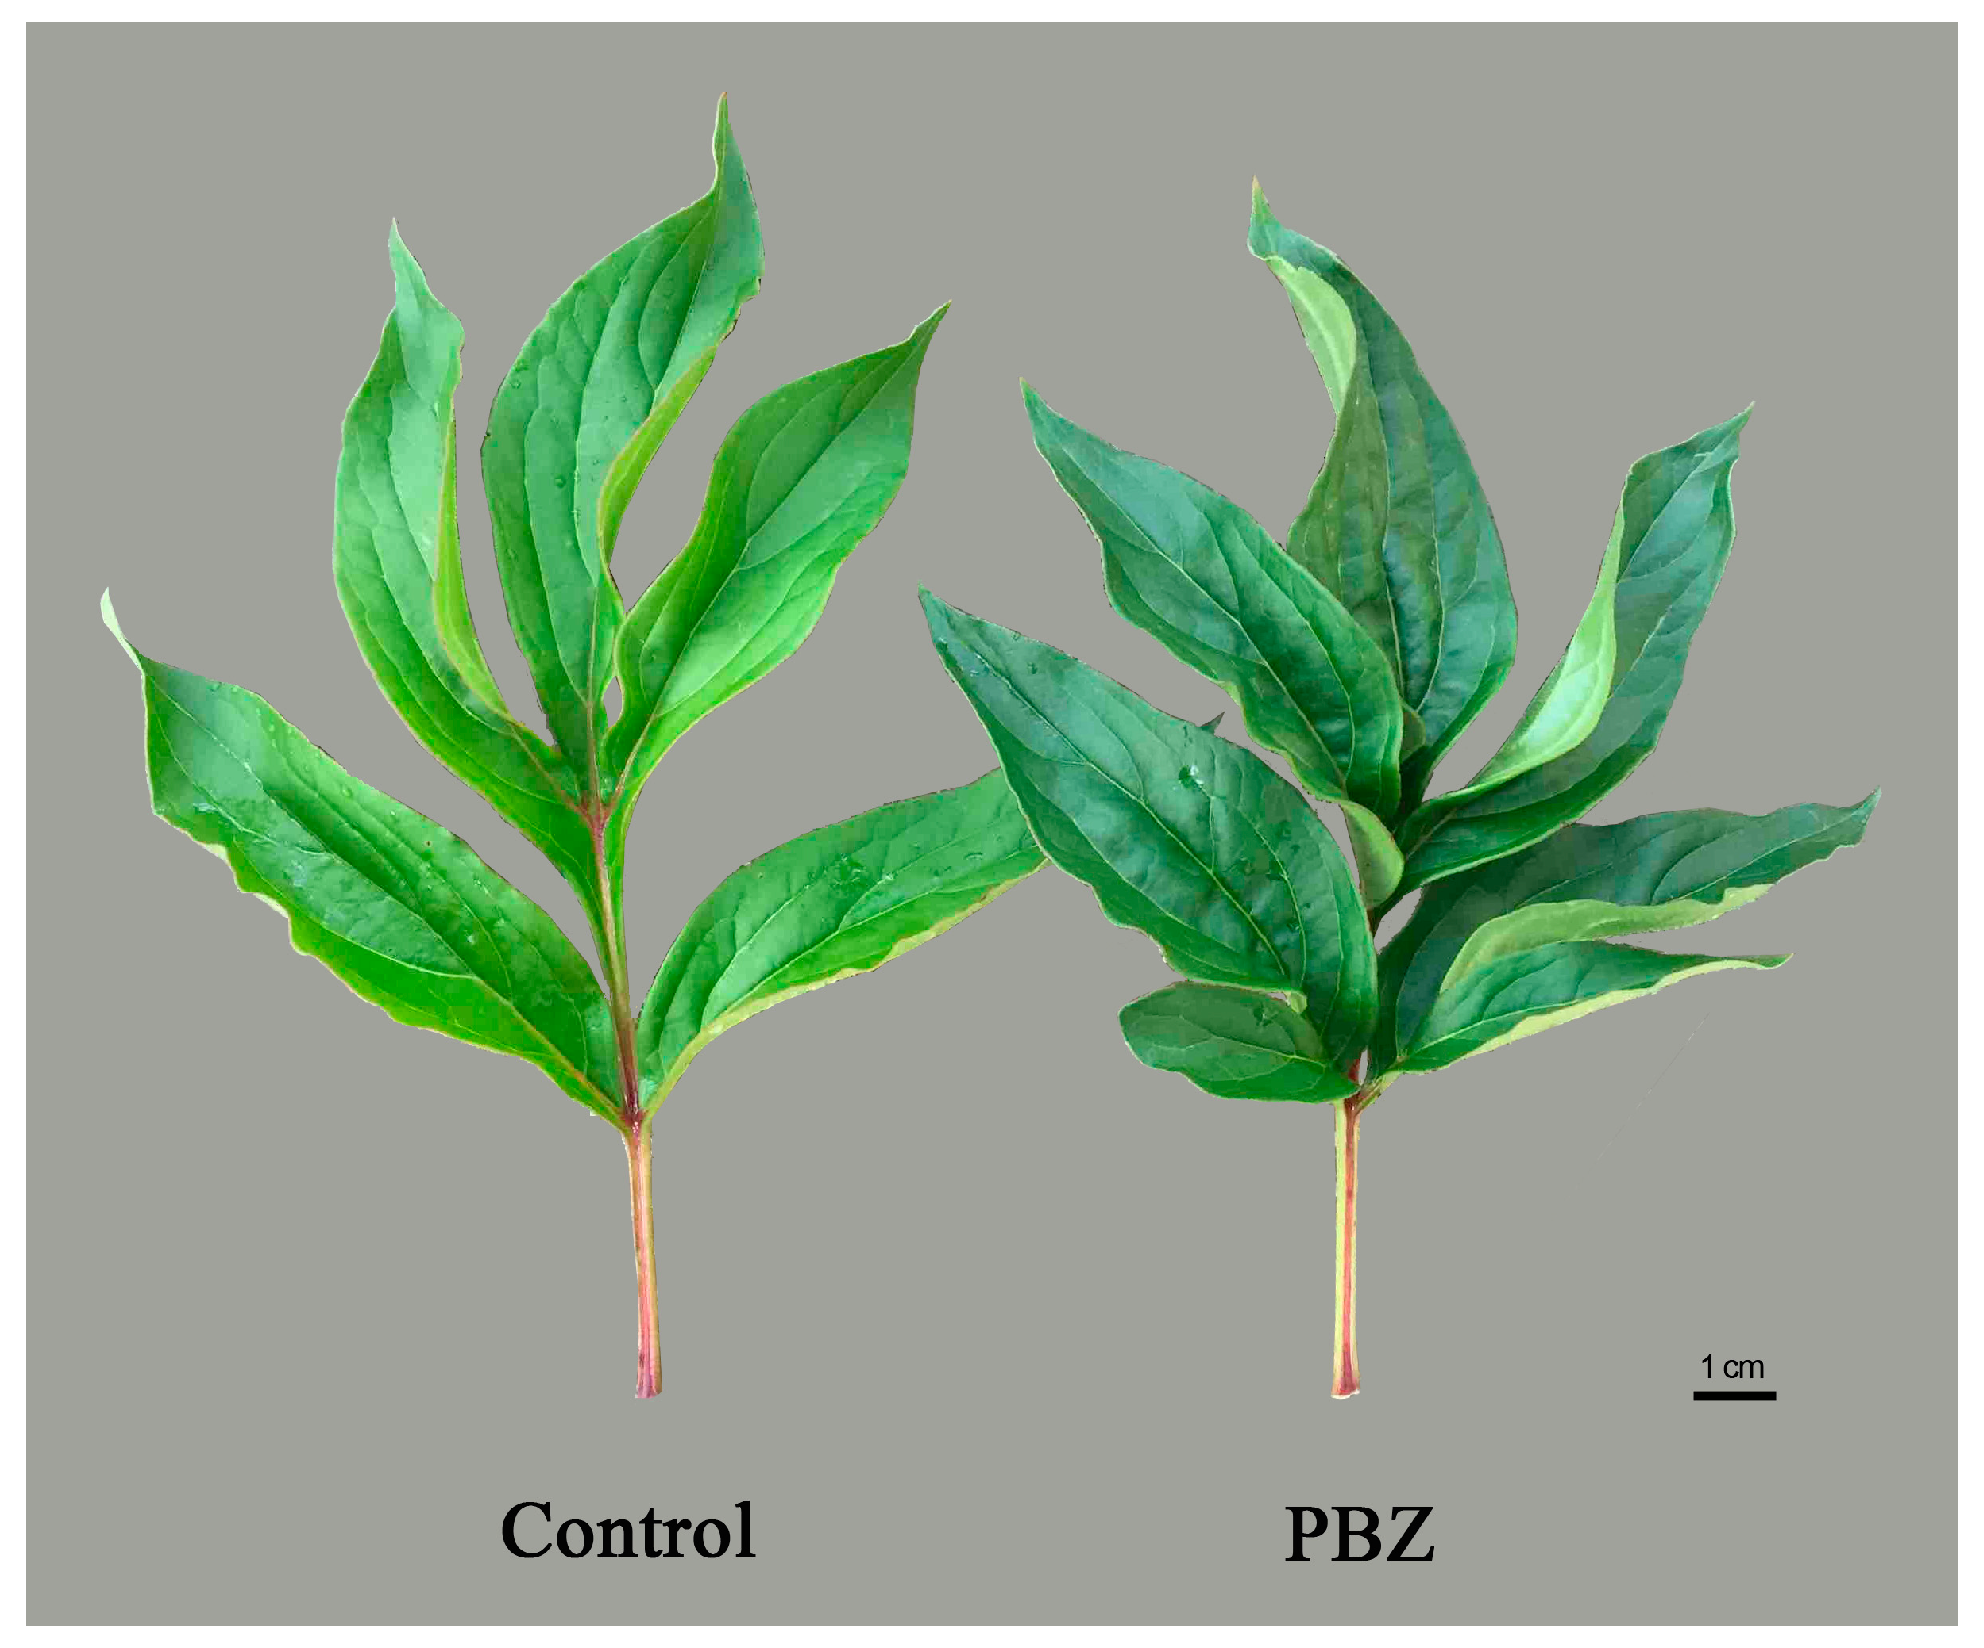
2.4. Morphological Parameters

Seven days after the last application, 10 branches were randomly selected from 10 plants for each treatment. The length of the branches (from the base of the branch to the base of the flower), the upper stem width (stem diameter at 5 cm below flower base), the middle stem width (stem diameter at the midpoint of the branch), and the lower stem width (stem diameter at 5 cm above branch base) were measured using a meter stick (Zhejiang Yuyao Sanxin Measuring Tools Co. Ltd., Zhejiang, China). The color of the third fully expanded leaves from the plant apex was determined using a Minolta CR-300 Chroma Meter (Konica Minolta Optic Inc., Tokyo, Japan), and the CIE L*, a* and b* values were recorded. The measurements were performed at three points (leaf base, leaf middle, leaf apex) for every leaf, and an average value per leaf was calculated.

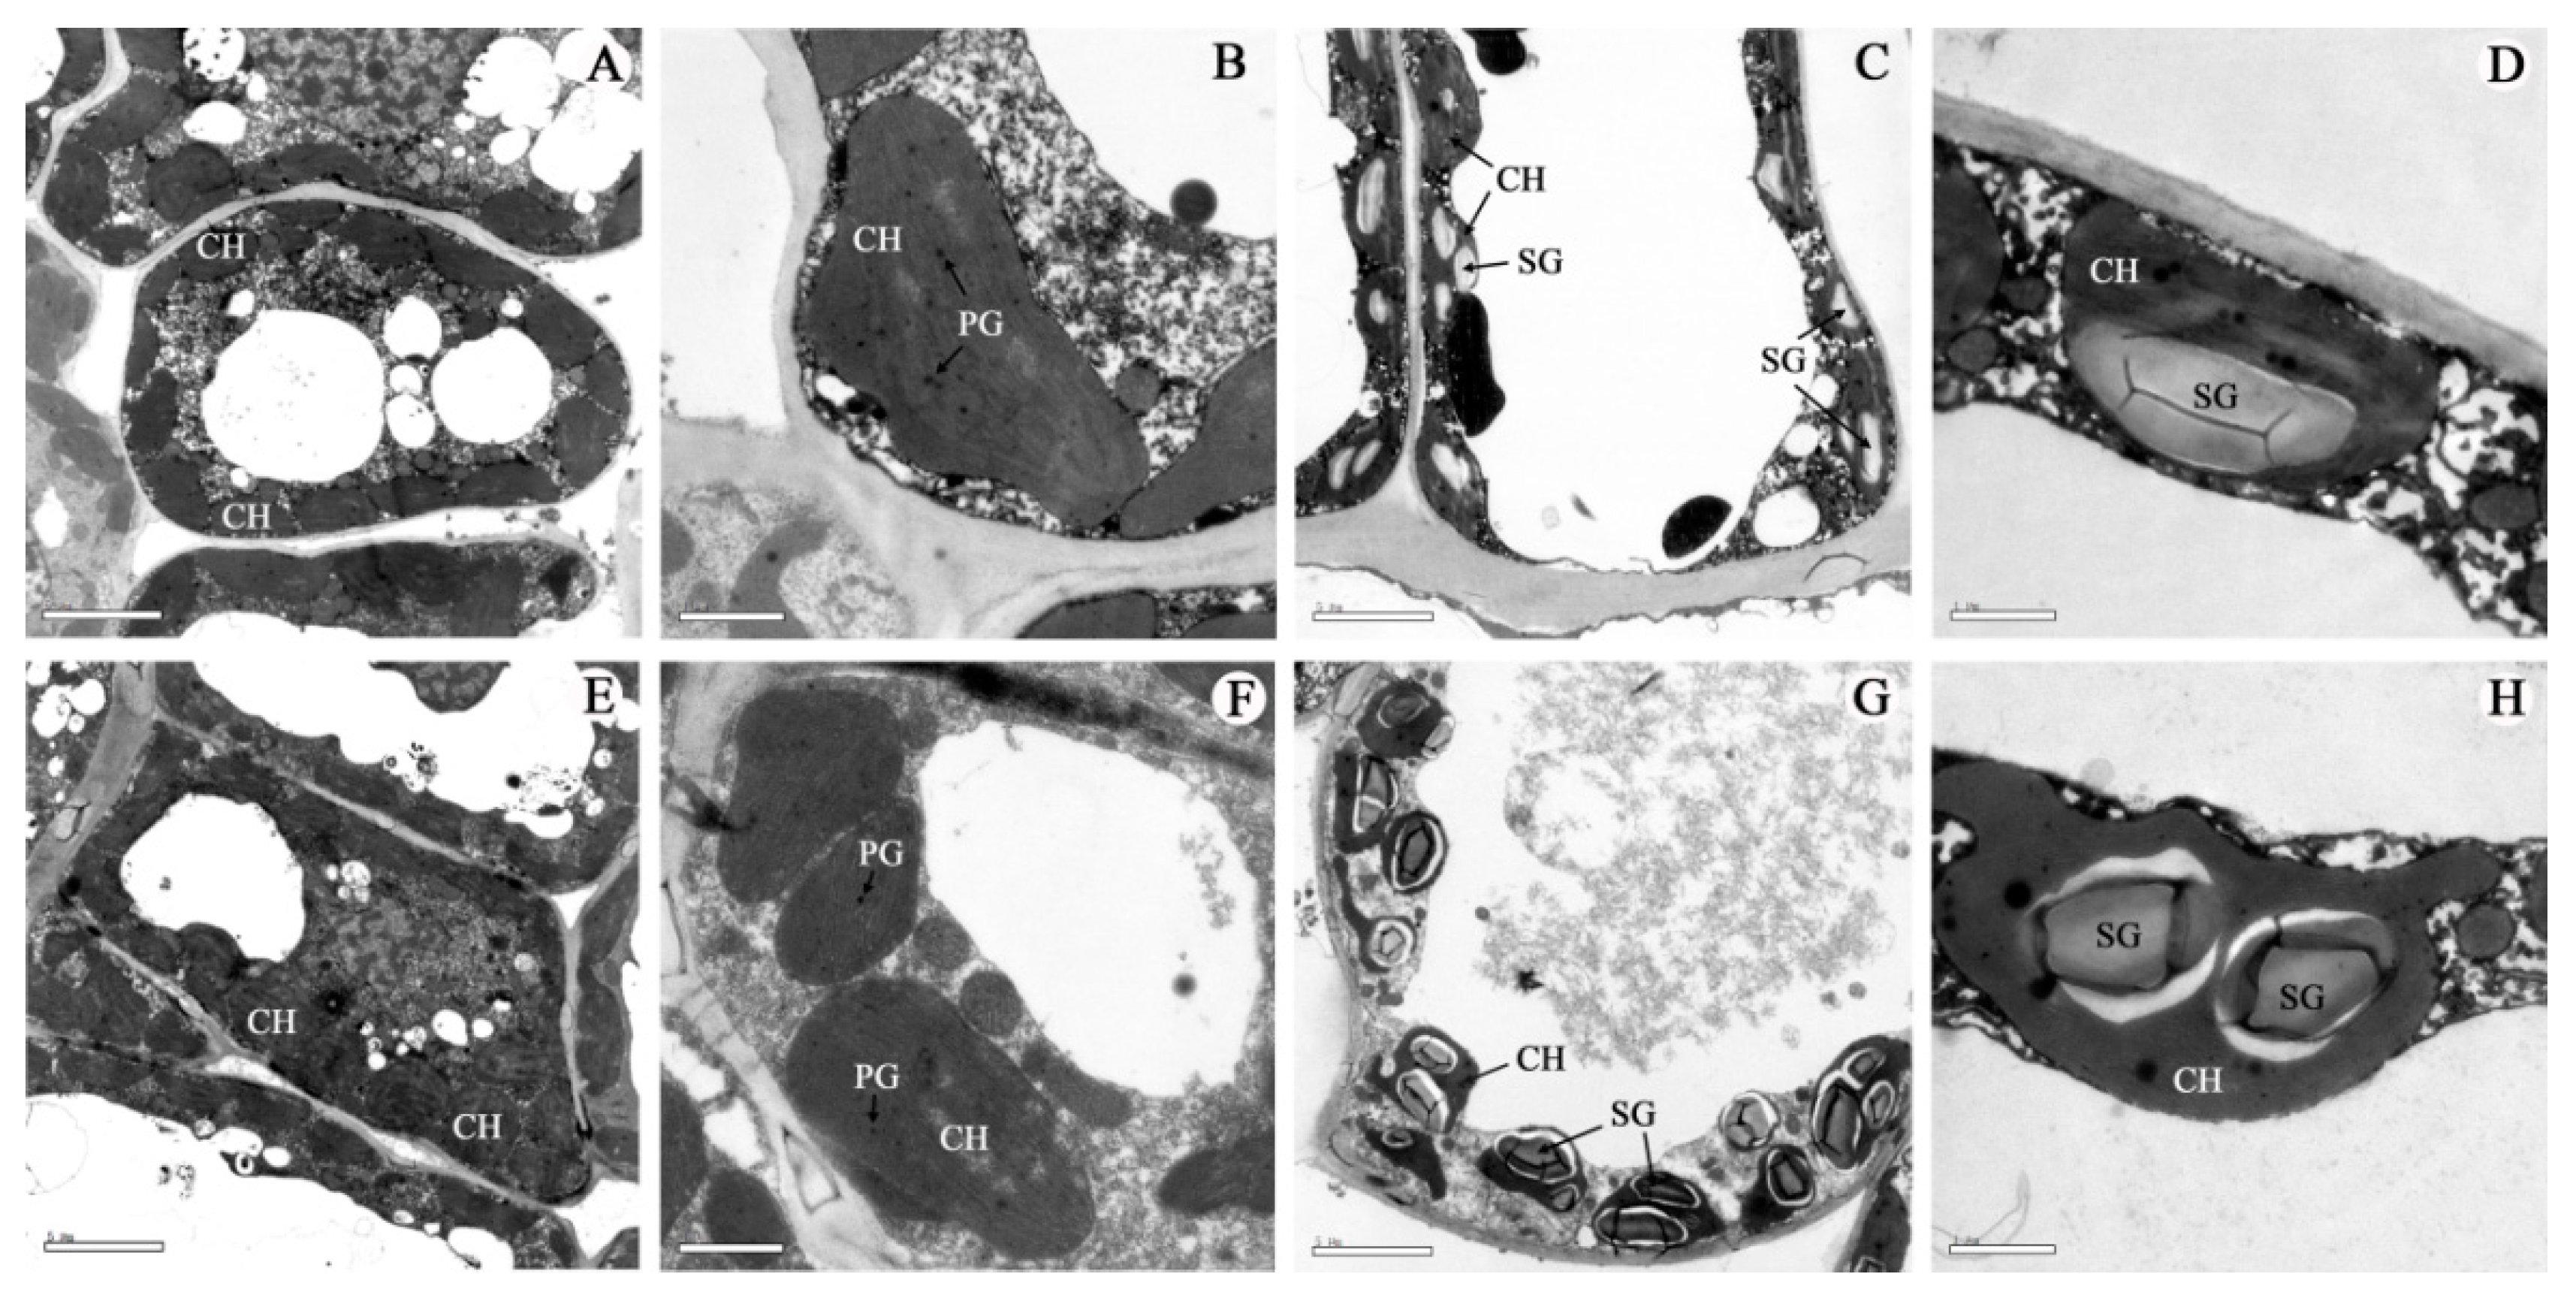
2.5. Light and Electron Microscopy Analysis

Square leaf lamina sections (1 mm × 1 mm) were cut near the center vein of the third fully expanded leaf from the plant apex after double fixation with 2.5% glutaraldehyde for 4 h followed by 1% osmic acid treatment, and then sections were dehydrated through ethanol/acetone series. After being embedded in Spurr resin at 70 °C for 8 h, thin sections were cut from leaf samples with an LKB-V ultramicrotome. Samples were double-stained using stem uranyl acetate and lead citrate and then observed and randomly photographed using a Philips CM100 transmission electron microscope (Royal Dutch Philips Electronics Ltd., Amsterdam, The Netherlands).

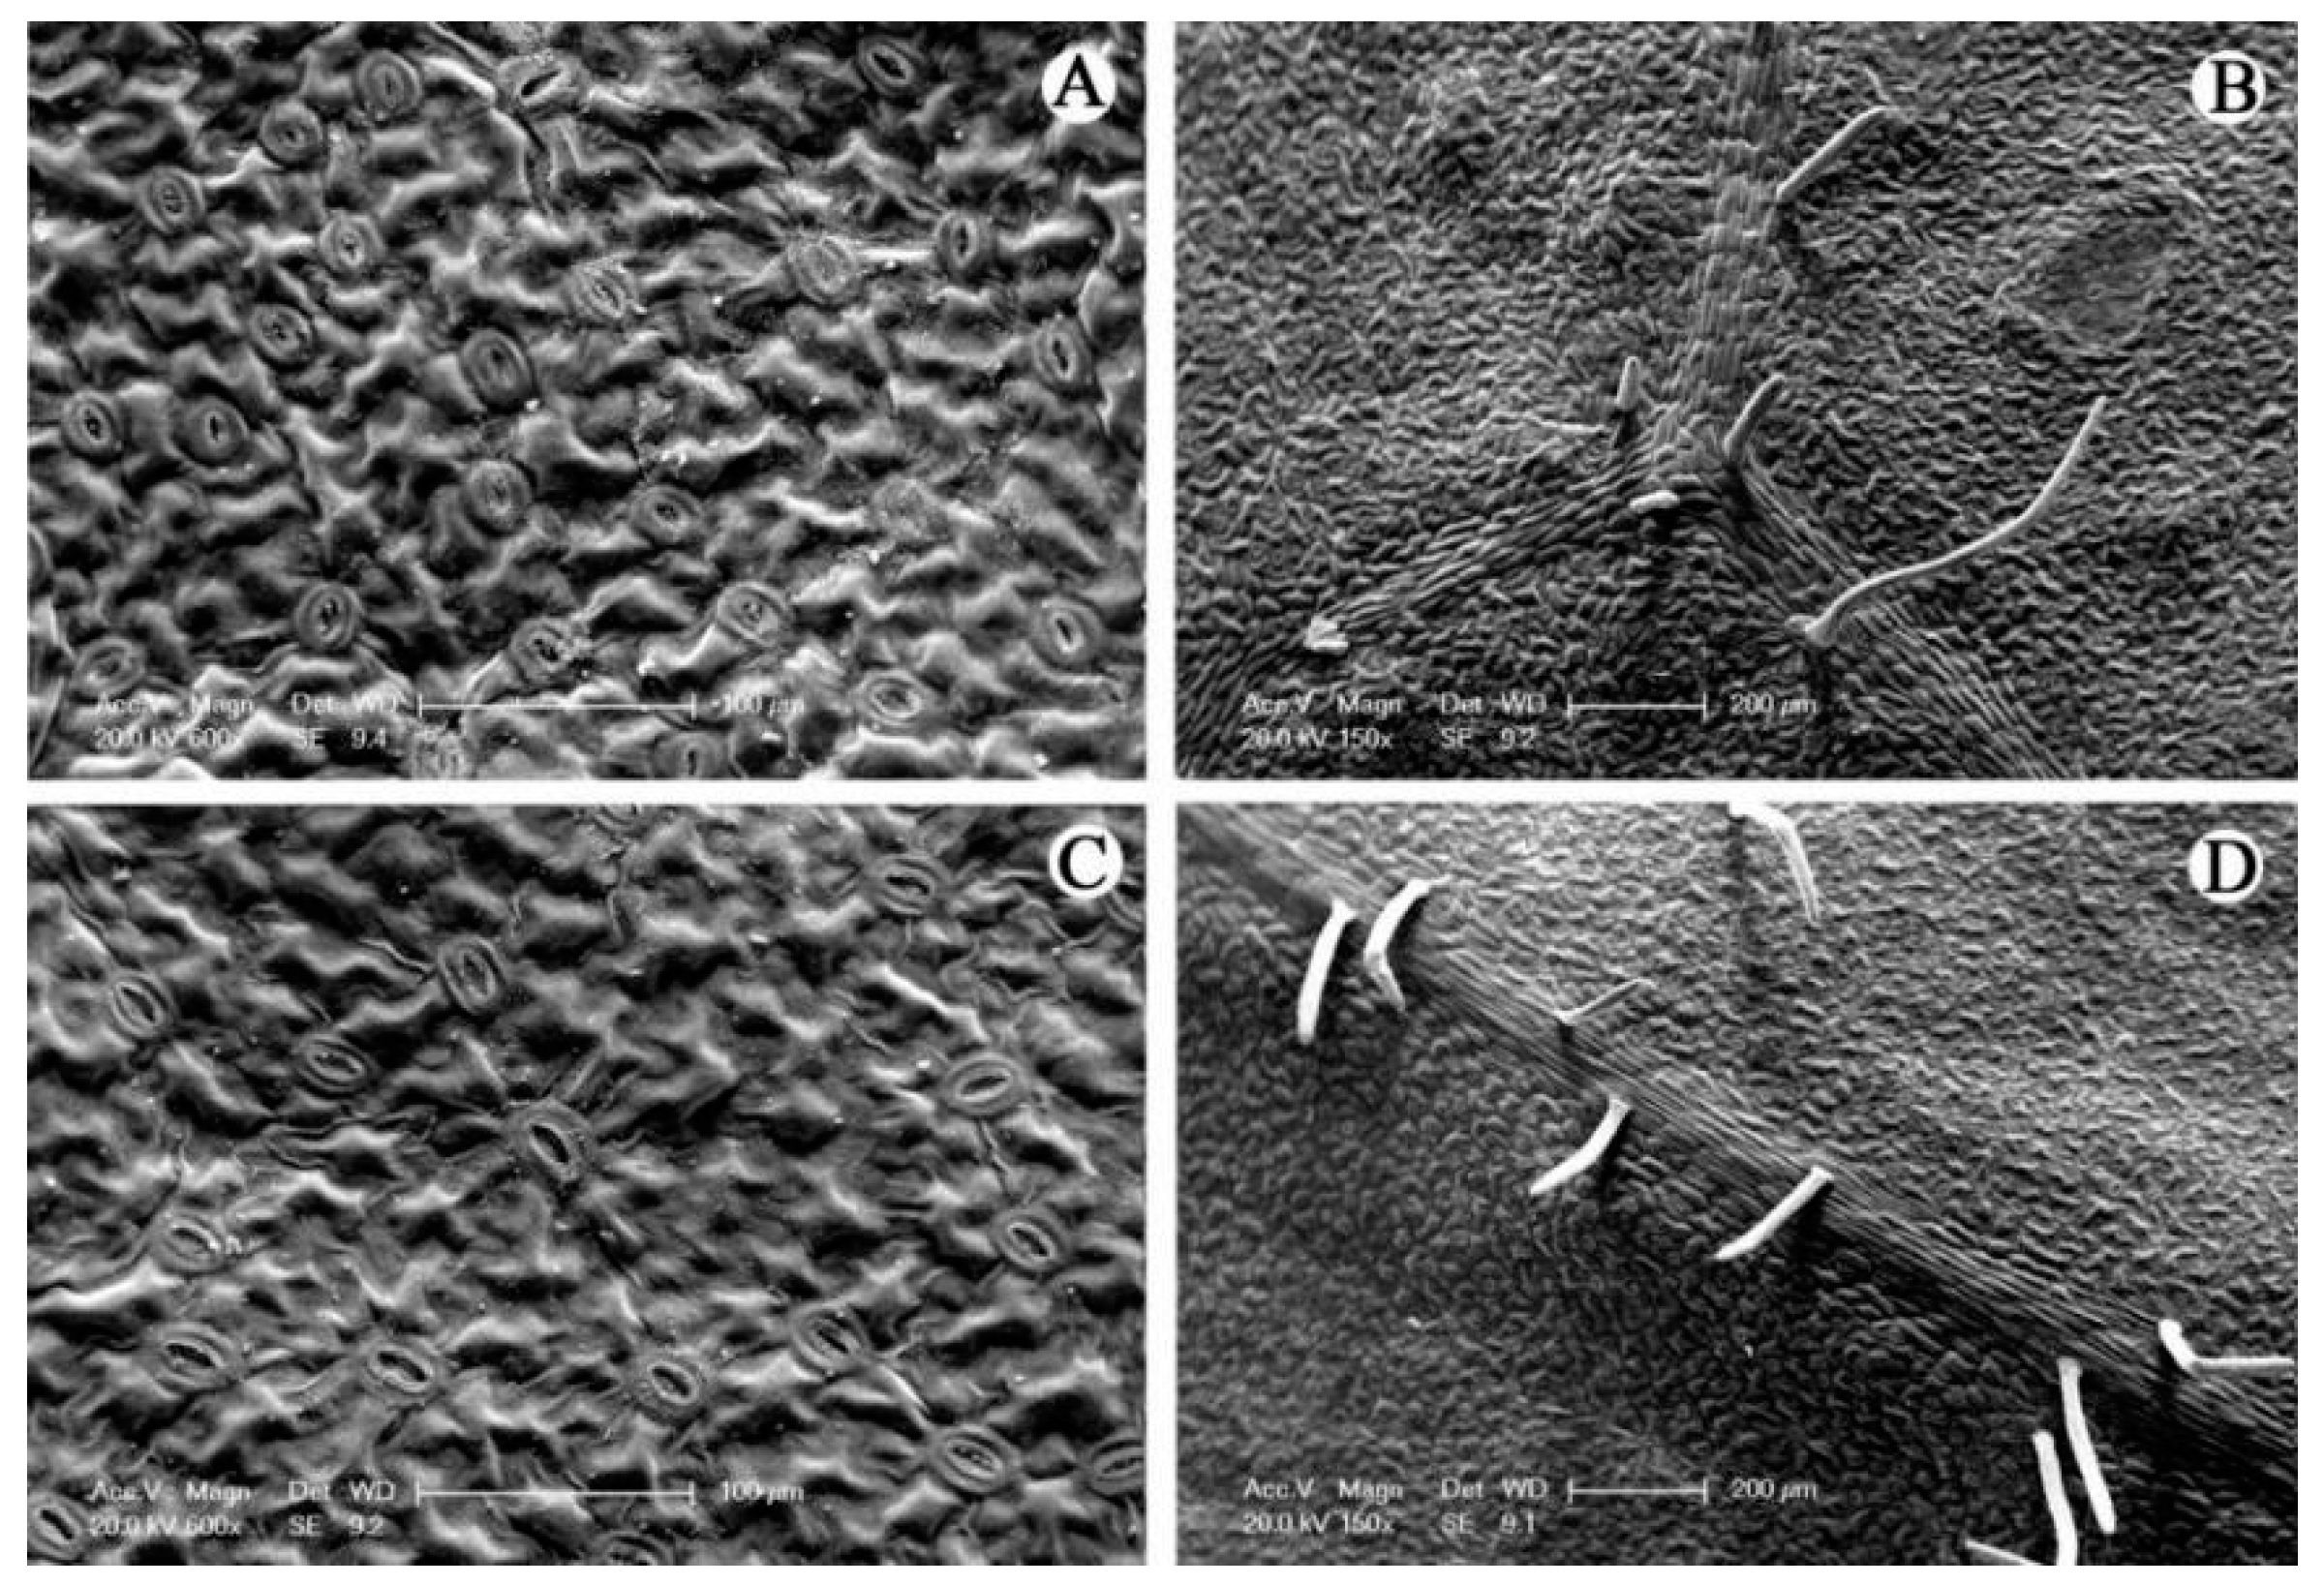
2.6. Microstructures Observation

Leaf blade tissues (5 mm × 5 mm) of peony were fixed, at 4 °C for 4 h, in a solution of 2.5% buffered glutaraldehyde. The fixed samples were first washed three times with 0.1 mol/L phosphate buffer, and were then dehydrated using a gradient ethanol solution (30%, 50%, 70%, 85%, 95% and 100%, 15 min at each %), followed by a final immersion in two consecutive acetone baths of 1 h each. After the critical point of drying and spraying gold using ion-sputtering equipment EIKO IB-3 (Eiko Engineer Co., Ibaraki, Japan) for 5 min, environmental scanning electron microscopy Philips XL-30 ESEM (Royal Dutch Philips Electronics Ltd., Amsterdam, The Netherlands) was used to observe the samples.

2.7 Statistical Analysis
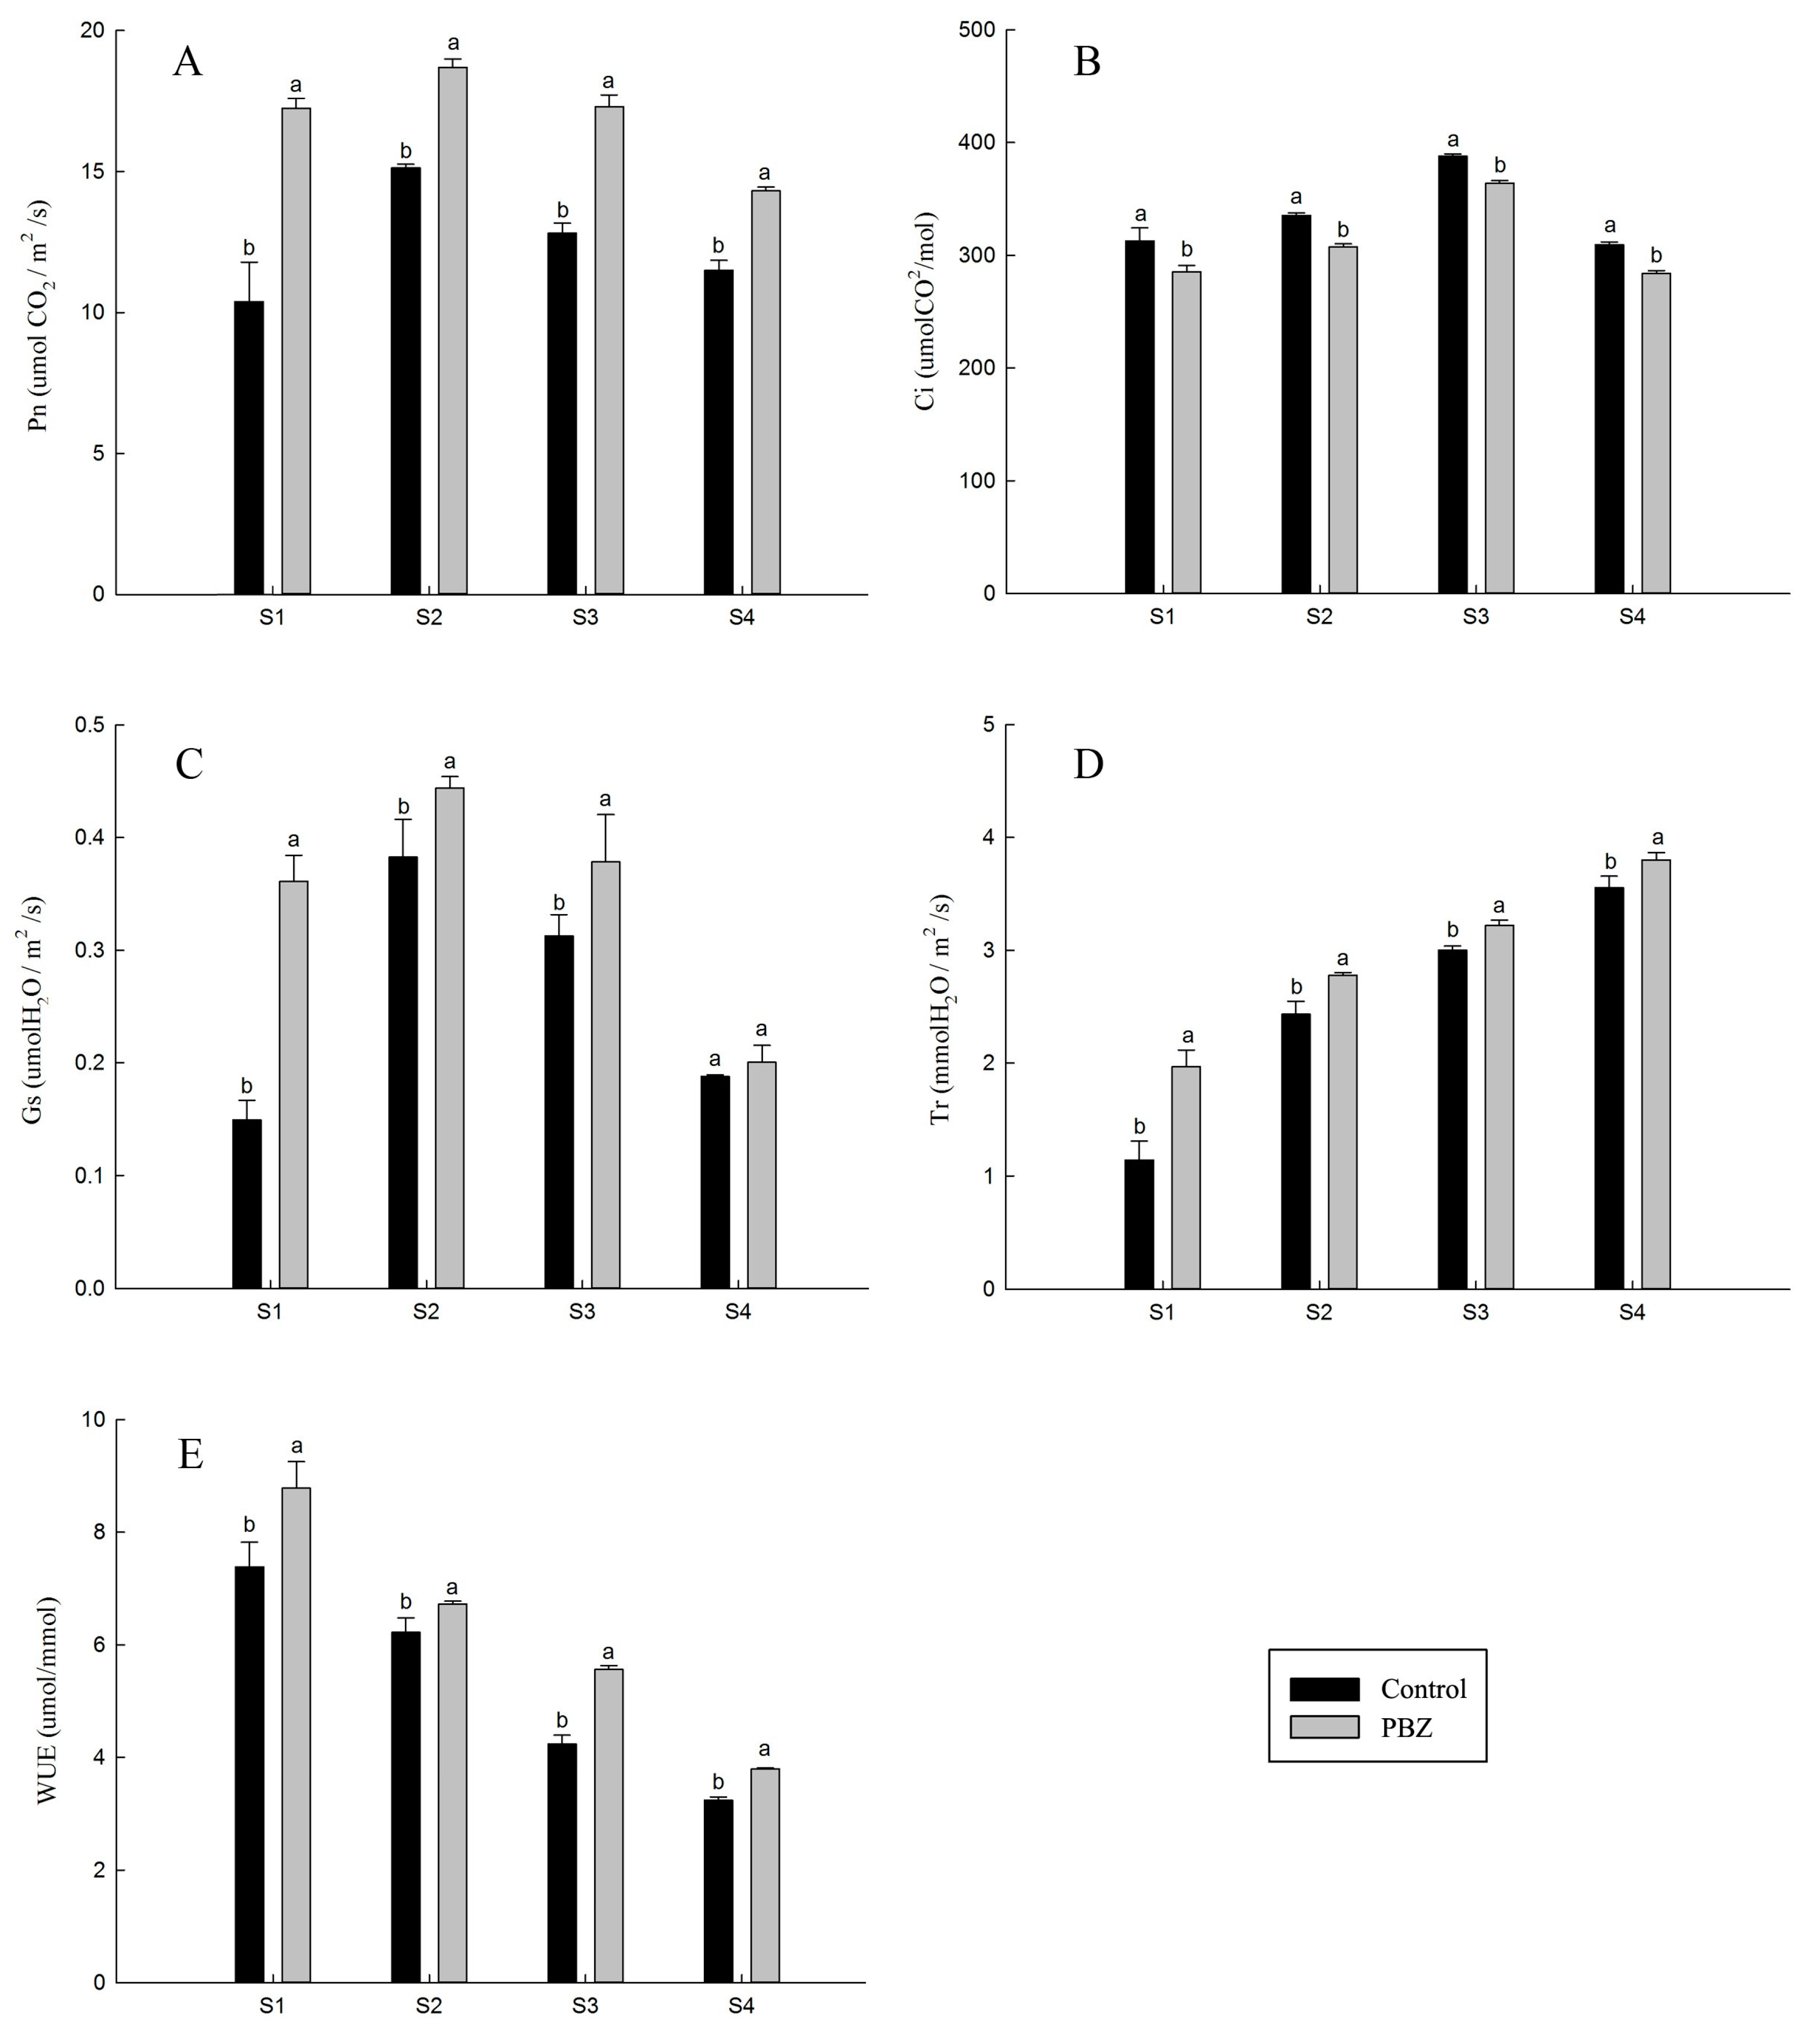
The treatments were applied in a randomized complete block design. Averages and standard deviations were calculated using Excel 2013 (Microsoft Office Professional Plus 2013, Microsoft, Redmond, WA, USA). Correlation analyses and significance tests were performed using IBM SPSS Statistics version 19 (IBM, Armonk, NY, USA).

3. Results

The fully-expanded leaves of the PBZ-treated plants were a darker green than the leaves of the control plants (Figure 1). PBZ application resulted in a significant reduction of peony plant height, irrespective of growth conditions (Table 1). PBZ application also decreased upper and middle stem width.
PBZ application significantly increased Chla, Chl, SPAD, a* and h*, but significantly decreased L*, b* and C* throughout the four stages, compared to controls. Chlb increased after PBZ treatment in the last two stages only (Table 2). Significant positive correlations were found among Chla, Chl, SPAD, and h°, while significant negative correlations were found between Chla and Chl with L* (Table 3). In addition, PBZ application resulted in the deepening of the leaf color of peony plants (Figure 1), which was in accordance with a decrease in L* and an increase in SPAD and h° (Table 2).
PBZ application significantly increased Pn, Tr and WUE, but significantly decreased Ci throughout the four stages, compared to control plants (Figure 2A,B,E). Furthermore, gs also slightly increased in PBZ-treated plants relative to control plants (Figure 2C). In addition, Pn exhibited the same pattern across stages as gs, with both PBZ application and controls having the highest Pn and gs values at S2, which then declined until S4 (Figure 2A,C). Peony plants at S3 had the highest Ci values, but there was no significant change at the other stages (Figure 2B). Tr exhibited a pattern opposite to the increase in WUE (Figure 2D,E). At S1, when peony plants had minimum Tr values, PBZ-treated or control plants had the highest WUE values. In contrast, peony plants at the later stages had the highest Tr values but lowest WUE values.
PBZ application increased Fv/Fm, qP and ΦPSII at S2, but decreased qN and NPQ at S2 and S3, compared to controls (Table 4). Significant correlations were found among Fv/Fm, qP, and ΦPSII and Chl content (Table 5). Moreover, there were significant positive correlations between Fv/Fm, qP, and ΦPSII and qN with NPQ.
Throughout the study, the tissue of leaves and roots from control and PBZ-treated plants revealed intact cells with clearly defined nuclei and other organelles (Figure 3A,E). PBZ-treated tissues were structurally altered compared to controls, with heavy aggregational chloroplasts (Figure 3F), dissipated plastoglobuli (Figure 3F), and more and bigger starch grains (average in a chloroplast) (Figure 3G,H).
PBZ significantly increased leaf stomatal aperture (80%) (mean = 7.34 um) compared to controls (mean = 4.07 um) (Figure 3A,C). PBZ application increased stomatal opening, which was in accordance with the study on chlorophyll fluorescence parameters. This suggests that in the case of strong light irradiation, the reactive oxygen produced by the light reaction was consumed more quickly, and the excess light energy in the form of heat dissipated. The lower epidermis was comprised of one layer of isodiametric cells, with a continuous layer of overlapping stellar trichomes, hiding the small and abundant stomata. PBZ application significantly increased the number of stellar hairs (Figure 4B,D).

4. Discussion

It has been widely recognized that the next significant breakthrough in horticultural crop yield is mainly dependent on the improvement of photosynthesis. Photosynthesis is fundamental for plant growth and development. Increased yield has been achieved by increasing or extending photosynthetic rate per unit of leaf area, and improving the partitioning of crop biomass to the harvested product [14]. In the present study, Pn significantly increased in PBZ-treated peony plants, compared to control plants, as observed in previous reports [15,16]. PBZ induced an increase in ABA and cytokinin [17], which helped in floral bud formation, since these were found to occur in the buds [6]. Photosynthetic products can provide a material basis for plant growth and development which can maintain the excellent ornamental properties of peony.
At the same time, in the present study, PBZ increased leaf chlorophyll content and SPAD value (Table 1), which represents the relative content of chlorophyll [7]. The apparent increase in the number of chloroplasts in individual cells found in the ultrastructure of PBZ-treated leaves (Figure 3B,F) was consistent with the results of the increase in total chlorophyll content. In leaves of wheat and potato, chloroplast number per cell and total chlorophyll were increased by PBZ treatment when compared to control leaves [18,19]. Chl, which is a critical component of the primary photosynthetic reaction, has a dual function in photosynthesis. It captures light, and also serves as a medium for the light-driven charge separation and transport of electrons [9]. Total chlorophyll represents photosynthetic capacity [8]. The results of the present study revealed that the increase in Pn after PBZ application may be directly caused by the increase in total chlorophyll. The biosynthesis of chloroplast pigments may be affected by PBZ. Khalil [15] reported that chlorophyll concentration per unit leaf area was enhanced by PBZ due to a greater concentration of chlorophyll in a much smaller leaf area. However, Salopek-Sondi et al. [16] reported that plants treated with PBZ synthesized more cytokinin, which in turn enhanced chloroplast differentiation and chlorophyll biosynthesis, and prevented chlorophyll degradation. Furthermore, PBZ appears to have delayed the onset of senescence, represented by the rate of chlorophyll degradation in attached mung bean leaves, which was probably due to the enhanced endogenous level of cytokinins through their secondary effect on plants [17]. Similar to an earlier report with cucumber cotyledons [20], the mechanism of the PBZ effect on chlorophyll is not clear. Therefore, more research is needed.
Similar to previous studies, the present investigation showed that plants treated with PBZ were superior to control plants regarding plant development. PBZ application resulted in a significant reduction of peony plant height, irrespective of growth conditions (Table 1). This was in line with previous published reports [21]. PBZ application also decreased stem width in all tested conditions (Table 1). Costa reported that PBZ reduced fruit size in spite of a very small pear crop, and flattened its shape; when it was applied in conjunction with GA3, the effect was overcome and a normal crop was obtained [22]. The reduced size of PBZ-treated plants may be linked to its inhibitory action on GA biosynthesis, which is involved in cell division [20]. Increased PSII photochemical efficiency (Fv/Fm and ΦPSII) may contribute to the improvement of Pn. Stomatal opening is one of the major limitations for photosynthesis [23]. It was observed that PBZ-treated plants had significantly higher gs and Tr than control plants, which was in accordance with the effect on leaf stomatal aperture (Figure 4A,C). Berova also found that Tr and gs were higher in PBZ-treated triticale plants than in control plants [24]. In general, larger stomatal opening and conductance were favorable for CO2 entrance into the intercellular space, which was needed to facilitate photosynthetic enhancement. Meanwhile, transpiration was unavoidably increased. QP and qN are two parameters that directly reflect the photochemical efficiency of leaves in vivo and the intrinsic mechanism of the photosynthetic apparatus. In the present study, PBZ-treated plants had higher qP in S2 and lower qN in S2 and S3, compared with control plants. The change in qN leads to a decrease in excitation energy, which is primarily utilized in the photochemical reaction. The qP represents the dissipation of excitation energy in the form of electron transfer. Accordingly, the excessive deoxidization of the primary stable quinine acceptor of PSII (QA) could be avoided through the decline in qP and an increase in qN.
The differences in leaf greenness determined by SPAD values have also been reported in field crops [25,26,27,28]. In the present study, SPAD values significantly increased after PBZ treatment on peony plants, compared to control plants (Table 1). Chl and Chla were positively correlated with SPAD values (Table 3). Kim found that leaf greenness (SPAD) was significantly correlated with Chla concentration in two rice varieties with different leaf color types [29]. Hence, difference in leaf greenness were likely due to the concentration of chlorophyll [30].
While control plant leaves were green in color, PBZ-treated leaves were darker green (Figure 1). Jalikop [31] reported that trispecies Annonaceae hybrids revealed segregation for leaf color (green or dark green). In addition, chloroplasts in dark green leaves had more appressed lamellae, and denser grana and stroma, compared to light green leaves. Moreover, shade-loving plants generally have darker green leaves with higher concentrations of chlorophyll, larger chloroplasts, and a higher thylakoid/grana ratio, compared to sun-loving leaves [32]. Despite a darker green color, shade leaves had lower photosynthetic capacity due to poorer leaf structure, as reflected by their thinner lamina [33,34]. In addition, Bondada [35] observed that excessive N supply may lead to an increase in leaf greenness, but not necessarily an increase in photosynthesis. From the above conclusions, it can be deduced that the difference in optical properties of the light green and dark green leaves of peony was due to differences in tissue traits. Wang et al. [36] reported that leaf color was related to leaf structure and pigment content. The application of PBZ, a member of the triazole plant growth inhibitor group, induced a darker green color of peony leaves. Banon et al. also found that PBZ treatment reduced the leaf blade area and imparted a slightly darker green color to the leaves of oleander [37]. The darker green leaves of PBZ-treated peony plants had heavy aggregations of chloroplasts close to the cell wall, with distinct grana lamellae, more and bigger starch grains (average in a chloroplast), and fewer plastoglobuli, when compared to their respective controls (Figure 3). The more appressed lamellae and stacked grana in the chloroplasts of darker green leaves indicated a higher density of light-harvesting assemblies, which would be more efficient in the absorption of light quanta [38], compared to lighter green leaves. Wan et al. [39] observed that the increased number and volume of plastoglobuli induced the degradation of thylakoids after heat treatment occurred within an injured chloroplast, and this change in spheroids was observed in senescent mesophyll cells, susceptible leaf cells and chilled leaf cells [40], respectively. The PBZ treatment of leaves with fewer lipid spheres revealed that PBZ improved the leaf ultrastructure of peony and improved the structure of chloroplasts. The increase in the amount and volume of starch granules resulted in a larger volume of a chloroplast, which also affected leaf area to a certain extent. The volume of starch granules increased and the number slightly increased, which was consistent with the analysis of leaf starch content [23]. The change in the morphology and quantity of starch granules also reflected an increase in photosynthetic assimilation products. Different nitrogen and potassium levels in a leaf chloroplast ultrastructure also had a similar effect [41]. This showed that the application of PBZ may be equivalent to increasing the loading and application of fertilizers, providing the same positive effects in promoting the photosynthetic assimilation of leaves.

5. Conclusions

Herbaceous peony treated with PBZ were superior in terms of increased photosynthetic characteristics when compared with untreated controls. The direct cause of the increase in Pn and leaf greenness of PBZ-treated peony may be the increase in chlorophyll content.

Acknowledgments

This work was supported by the Agricultural Science & Technology Independent Innovation Fund of Jiangsu Province (CX [14] 2023), the building project of combined and major innovation carrier of Jiangsu province (BM2016008), the program of key members of Yangzhou University outstanding young teacher.

Author Contributions

D.Z. conceived and designed the experiments; X.X. performed the experiments; X.X., Y.T. and M.W. analyzed the data; X.X. wrote the paper.

Conflicts of Interest

The authors declare no conflict of interest.

References

  1. Li, C.Z.; Sun, Y.; Zhao, D.Q.; Tao, J. Relationship between Mechanical Strength and Morphological Index of Inflorescence Stem of Herbaceous Peony (Paeonia lactiflora Pall.). Acta Agric. Zhejiangensis 2015, 27, 182–188. (In Chinese) [Google Scholar]
  2. Ogata, T.; Hasukawa, H.; Shiozaki, S.; Horiuchi, S.; Kawase, K.; Iwagaki, I.; Okuda, H. Seasonal Changes in Endogenous Gibberellin Contents in Satsuma Mandarin during Flower Differentiation and the Influence of Paclobutrazol on Gibberellin Synthesis. J. Jpn. Soc. Hortic. Sci. 1996, 65, 245–253. [Google Scholar] [CrossRef]
  3. Kondhare, K.R.; Hedden, P.; Kettlewell, P.S.; Farrell, A.D.; Monaghan, J.M. Use of the hormone-biosynthesis inhibitors fluridone and paclobutrazol to determine the effects of altered abscisic acid and gibberellin levels on pre-maturity α-amylase formation in wheat grains. J. Cereal Sci. 2014, 60, 210–216. [Google Scholar] [CrossRef]
  4. Pal, S.; Zhao, J.S.; Khan, A.; Yadav, N.S.; Batushansky, A.; Barak, S.; Rewald, B.; Fait, A.; Lazarovitch, N.; Rachmilevitch, S. Paclobutrazol Induces Tolerance in Tomato to Deficit Irrigation through Diversified Effects on Plant Morphology, Physiology and Metabolism. Sci. Rep. 2016, 6, 39321. [Google Scholar] [CrossRef] [PubMed]
  5. Syahputra, B.S.A.; Sinniah, U.R.; Ismail, M.R.; Swamy, M.K. Optimization of Paclobutrazol Concentration and Application Time for Increased Lodging Resistance and Yield in Field-Grown Rice. Philipp. Agric. Sci. 2016, 99, 221–228. [Google Scholar]
  6. Srivastav, M.; Kishor, A.; Dahuja, A.; Sharma, R.R. Effect of Paclobutrazol and Salinity on Ion Leakage, Proline Content and Activities of Antioxidant Enzymes in Mango (Mangifera indica L.). Sci. Hortic. 2010, 125, 785–788. [Google Scholar] [CrossRef]
  7. Manivarman, P.; Jaleel, C.A.; Kishorekumar, A.; Sankar, B.; Somasundaram, R.; Panneerselvam, R. Protection of Vigna unguiculata (L.) Walp. Plants from Salt Stress by Paclobutrazol. Colloid Surf. B. 2008, 61, 315–318. [Google Scholar] [CrossRef] [PubMed]
  8. Zhang, J.L.; Wang, Y.Y.; Sun, L.Q.; Wei, T.T.; Gu, X.H.; Gao, F.; Li, X.D. Effects of Paclobutrazol on the Yield, Quality, and Related Enzyme Activities of Different Quality Type Peanut Cultivars. Chin. J. Appl. Ecol. 2013, 24, 2850–2856. (In Chinese) [Google Scholar]
  9. Zhao, J.; Zhang, W.; Qiu, Q.; Li, Z.P.; Zhang, M.H.; Yan, X.Y.; Du, D.H. Effects of PP333 Spraying at Different Stages on Soybean Agronomic and Physiological Characters. Soybean Sci. 2011, 30, 211–214. (In Chinese) [Google Scholar]
  10. Zhou, W.J.; Xi, H.F. Effects of Mixtalol and Paclobutrazol on Photosynthesis and Yield of Rape (Brassica napus). J. Plant Growth Regul. 1993, 12, 157–161. [Google Scholar] [CrossRef]
  11. Tekalign, T.; Hammes, P.S. Response of Potato Grown under Non-inductive Condition to Paclobutrazol: Shoot Growth, Chlorophyll Content, Net Photosynthesis, Sssimilate Partitioning, Tuber Yield, Quality, and Dormancy. Plant Growth Regul. 2004, 43, 227–236. [Google Scholar] [CrossRef]
  12. Feng, L.J.; Yuan, Z.H.; Yi, Y.L.; Zhao, X.Q. Effects of Paclobutrazol on Photosynthetic Characteristics and Ultrastructure of Dahurian Leaves. Acta Pratacult. Sin. 2014, 23, 114–121. (In Chinese) [Google Scholar]
  13. Arnon, D.I. Copper enzymes in isolated chloroplasts, polyphenoxidase in Beta vulgaris. Plant Physiol. 1949, 24, 1–15. [Google Scholar] [CrossRef] [PubMed]
  14. Chen, Z.H.; Wu, F.B.; Wang, X.D.; Zhang, G.P. Heterosis in CMS Hybrids of Cotton for Photosynthetic and Chlorophyll Fluorescence Parameters. Euphytica 2005, 144, 353–361. [Google Scholar] [CrossRef]
  15. Berova, M.; Zlatko, Z. Physiological Response and Yield of Paclobutrazol Treated Tomato Plants (Lycopersicon esculentum Mill.). Plant Growth Regul. 2000, 30, 117–123. [Google Scholar] [CrossRef]
  16. Nivedithadevi, D.; Somasundaram, R.; Pannerselvam, R. Effect of Abscisic Acid, Paclobutrazol and Salicylic Acid on the Growth and Pigment Variation in Solanum Trilobatum (l). Int. J. Drug Dev. Res. 2015, 4, 236–246. [Google Scholar]
  17. Fletcher, F.A.; Gilley, A.; Sankhla, N. Triazoles as Plant Growth Regulator and Stress Protectants. Hortic. Rev. 2000, 24, 55–138. [Google Scholar]
  18. Nouriyani, H.; Majidi, E.; Seyyednejad, S.M.; Siadat, S.A.; Naderi, A. Evaluation of Interaction of Paclobutrazol and Nitrogen on Correlation between Yield and Photosynthetic Pigments Contents in Two Wheat Cultivars (Triticum aestivum L.). Res. Crop. 2012, 13, 446–452. [Google Scholar]
  19. Kishorekumar, A.; Jaleel, C.A.; Manivannan, P. Differential Effects of Hexaconazole and Paclobutrazol on the Foliage Characteristics of Chinese Potato (Solenostemon rotundifolius Poir., J.K. Morton). Acta Biol. Szeged. 2006, 50, 127–129. [Google Scholar]
  20. Fletcher, R.A.; Kallidumbil, V.; Steele, P. An Improved Bioassay for Cytokinins Using Cucumber Cotyledons. Plant Physiol. 1982, 69, 675–677. [Google Scholar] [CrossRef] [PubMed]
  21. Bora, K.K.; Ganesh, R.; Mathur, S.R. Paclobutrazol Delayed Dark-induced Senescence of Mung Bean Leaves. Biologia 2007, 62, 185–188. [Google Scholar] [CrossRef]
  22. Costa, J.; Bosch, M.; Blanco, A. Growth and Cropping of Blanquilla Pear Trees Treated with Paclobutrazol. J. Hortic. Sci. 1995, 70, 433–443. [Google Scholar] [CrossRef]
  23. Yu, G.R. A Study on Modeling Stomatal Conductance of Maize (Zea mays L.) Leaves. Tech. Bull. Fac. Hort. Chiba Univ. 1999, 53, 145–239. [Google Scholar]
  24. Berova, M.; Zlatev, V. Physiological response of paclobutrazol-treated triticale plants to water stress. Biol. Plant. 2003, 46, 133–136. [Google Scholar] [CrossRef]
  25. Ma, B.L.; Morrison, M.J.; Voldeng, D.H. Leaf greenness and photosynthetic rates in soybean. Crop Sci. 1995, 35, 1411–1414. [Google Scholar] [CrossRef]
  26. Turner, F.T.; Jund, M.E. Assessing the Nitrogen Requirements of Rice Crops with a Chlorophyll Meter. Aust. J. Exp. Agric. 1994, 34, 1001–1005. [Google Scholar] [CrossRef]
  27. Messmer, R.; Fracheboud, Y.; Banziger, M.; Stamp, P.; Ribaut, J.M. Drought Stress and Tropical Maize: QTL-by-environment Interactions and Stability of QTLs across Environments for Yield Components and Secondary Traits. Theor. Appl. Genet. 2009, 119, 913–930. [Google Scholar] [CrossRef] [PubMed]
  28. Giunta, F.; Motzo, R.; Deidda, M. SPAD Readings and Associated Leaf Traits in Durum Wheat, Barley and Triticale Cultivars. Euphytica 2002, 125, 197–205. [Google Scholar] [CrossRef]
  29. Kim, D.S.; Kin, J.K.; Kim, S.D. Varietal Difference in Relationship between SPAD Value and Chlorophyll and Nitrogon Concentration in Rice Leaf. Korean J. Crop Sci. 2002, 47, 263–267. [Google Scholar]
  30. Fu, X.Y.; Zhou, L.Y.; Huang, J.B.; Mo, W.P.; Zhang, J.Y.; Li, J.G.; Wang, H.C.; Huang, X.M. Relating Photosynthetic Performance to Leaf Greenness in Litchi: A Comparison among Genotypes. Sci. Hortic. 2013, 152, 16–25. [Google Scholar] [CrossRef]
  31. Jalikop, S.H. Inheritance of Foliage Characteristics in (Annona cherimola Mill. x A. squamosa L.) x A. reticulata L. Hybrids. Euphytica 2010, 171, 175–180. [Google Scholar] [CrossRef]
  32. Boardman, N.K. Comparative Photosynthesis of Sun and Shade Plants. Annu. Rev. Plant Physiol. 1977, 28, 355–377. [Google Scholar] [CrossRef]
  33. Jiang, C.D.; Wang, X.; Gao, H.Y.; Wang, x.; Gao, H.Y.; Shi, L.; Chow, W.S. Systemic Regulation of Leaf Anatomical Structure, Photosynthetic Performance, and High-Light Tolerance in Sorghum. Plant Physiol. 2011, 155, 1416–1424. [Google Scholar] [CrossRef] [PubMed]
  34. Pantin, F.; Simonneau, T.; Rolland, G.; Dauzat, M.; Muller, B. Control of Leaf Expansion: A Developmental Switch from Metabolics to Hydraulics. Plant Physiol. 2011, 156, 803–815. [Google Scholar] [CrossRef] [PubMed]
  35. Bondada, B.R.; Syvertsen, J.P. Leaf Chlorophyll, Net Gas Exchange and Chloroplast Ultrastructure in Citrus Leaves of Different Nitrogen Status. Tree Physiol. 2003, 23, 553–559. [Google Scholar] [CrossRef] [PubMed]
  36. Wang, Z.X.; Cao, J.R.; Qin, H.Y.; Zhao, Y.; Chen, L.; Ai, J.; Liu, T. The Pigment Content and Structure of the Color Leaves of Kiwi (Actinidia kolomikta) Affect the Leaf Color. Plant Physiol. J. 2016, 52, 1921–1926. (In Chinese) [Google Scholar]
  37. Banon, S.; Ochoa, J.; Gonzalez, A. Manipulation of Oleander Growth, Development and Foliage Colour by Paclobutrazol and Ethephon. Gartenbauwissenschaft 2001, 66, 123–132. [Google Scholar]
  38. Anderson, J.M.; Goodchild, D.J.; Boardman, N.K. Composition of the Photosystems and Chloroplast Structure in Extreme Shade Plants. Biochim. Biophys. Acta 1973, 325, 573–585. [Google Scholar] [CrossRef]
  39. Wan, L.Q.; Shi, Y.H.; Li, X.L.; He, F.; Jia, Y.X. Alterations in leaf cellular ultra-structure of three varieties of Lolium perenne subjected to high temperature and soil drought stress. Acta Pratacult. Sin. 2009, 18, 25–31. (In Chinese) [Google Scholar]
  40. Hang, J.S.; Wang, L.R.; Yu, X.S. The Ultrastructure of Chloroplasts of Virusinfected Barley Leaves. J. Integr. Plant Biol. 1986, 28, 444–445. (In Chinese) [Google Scholar]
  41. Wang, X.J.; Yuan, X.F.; Lou, C.R.; Dong, H.; He, Z.G. Effects of Different Nitrogen and Potassium Levels on Tomato Growth and Leaf Ultrastructure. Soil Fert. Sci. China 2014, 3, 44–48. (In Chinese) [Google Scholar]
Figure 1. Visual comparison of leaf greenness and morphology of peony plants treated with PBZ and the untreated control.
Horticulturae 04 00005 g001
Figure 2. Comparison of net photosynthetic rate (Pn), intercellular CO2 levels (Ci), stomatal conductance (gs), transpiration rate (Tr) and water use efficiency (WUE) values at four consecutive weekly stages (S1–S4) from bolting to bud development of peony plants treated with PBZ and control plants (without PBZ). Stages correspond to 4 consecutive weeks as S1 (Stage 1), S2 (Stages 2), S3 (Stages 3) and S4 (Stages 4) from bolting to bud development of peony plants. Bars are mean ± standard error. Different letters above bars indicate significant differences from the untreated control (one-way ANOVA, p < 0.05).
Horticulturae 04 00005 g002
Figure 3. The ultrastructure of leaf mesophyll cells of peony plants treated with PBZ and controls. (A) Control leaf tissues show intact cells and well-defined organelles. Scale bar = 5 μm. (B) Oval chloroplasts with distinct grana lamellae and plastoglobulis show heavy aggregation in control peony plants in S1. Scale bar = 1 μm. (C) Chloroplasts close to the cell wall with starch grains in PBZ-treated plants in S2. Scale bar = 5 μm. (D) Well-organized chloroplasts with many plastoglobuli, starch grains and vague grana lamellae in control peony plants in S2. Scale bar = 1 μm. (E) PBZ-treated leaf tissues show intact cells and well-defined organelles, in which the chloroplasts have swollen and become round. Scale bar = 5 μm. (F) Oval chloroplasts close to the cell wall, showing heavy aggregation, with distinct grana lamellae and visible plastoglobuli in PBZ-treated plants in S1. Scale bar = 1 μm. (G) More chloroplasts close to the cell wall and filled with many starch grains in PBZ-treated plants in S2. Scale bar = 5 μm. (H) More larger chloroplasts with some plastoglobuli, and more starch grains and distinct grana lamellae in PBZ-treated plants in S2. Scale bar = 5 μm. CH: chloroplast; CW: cell wall; M: mitochondrion; PG: plastoglobule; SG: starch grain; V: vacuole.
Horticulturae 04 00005 g003
Figure 4. The microstructure of mesophyll cells of PBZ-treated and control peony plants. (A,B) Photographs of the peony leaf of a control plant magnified to show the stomata and leaf hairs in S1. (C,D) Photographs of the peony leaf of a PBZ-treated plant magnified to show the stomata and stellar hairs in S4. (A,C), scale bar = 100 μm; (B,D), scale bar = 200 μm.
Horticulturae 04 00005 g004
Table 1. Comparison of morphological parameters of peony plants treated with PBZ and the untreated control at the end of the final week.
PH z (cm)USW (mm)MSW (mm)LSW (mm)
Control102.3 ± 8.51 y a3.41 ± 0.44 a6.82 ± 0.43 a9.16 ± 0.82 a
PBZ86.22 ± 3.43 b2.99 ± 0.47 b6.11 ± 0.49 b9.25 ± 0.71 a
z Plant height (PH); Upper stem width (USW); Middle stem width (MSW); Lower stem width (LSW); y Mean ± standard error. Different letters indicate significant differences (one-way ANOVA, p < 0.05).
Table 2. Effect of paclobutrozol (PBZ) on physiological characteristics and color coefficients at four consecutive weekly stages from bolting to bud development of peony leaves.
Leaf Trait
Stage zTmt yChla xChlbChlSPADL *a *b *c *
S1Control6.94 ± 0.05 w e2.11 ± 0.07 f9.03 ± 0.12 h37.10 ± 2.51 h45.08 ± 1.55 a−12.40 ± 0.82 h20.90 ± 1.67 a24.20 ± 0.94 a114.50 ± 1.15 g
PBZ8.09 ± 0.31 c2.43 ± 0.11 f10.51 ± 0.25 g50.30 ± 4.13 d39.57 ± 1.43 e−9.20 ± 0.50 b13.20 ± 0.80 e16.90 ± 0.94 e123.70 ± 1.40 c
S2Control7.99 ± 0.08 c2.76 ± 0.05 e10.74 ± 0.03 e40.65 ± 3.22 g44.65 ± 2.72 b−10.04 ± 2.09 e20.52 ± 4.70 c22.97 ± 4.57 c116.66 ± 6.08 f
PBZ8.59 ± 0.22 b2.71 ± 0.04 e11.29 ± 0.26 d54.80 ± 1.73 c38.31 ± 1.98 f−8.74 ± 1.42 a12.86 ± 2.39 g15.60 ± 2.43 g124.44 ± 4.91 b
S3Control7.99 ± 0.23 c2.61 ± 0.10 d10.59 ± 0.07 f42.70 ± 2.46 f42.67 ± 2.82 c −11.76 ± 1.43 g20.83 ± 6.07 b24.03 ± 5.70 b120.64 ± 5.99 d
PBZ9.81 ± 0.44 a3.85 ± 0.18 b13.65 ± 0.33 a55.90 ± 5.38 b37.58 ± 1.20 g−9.72 ± 0.70 d12.95 ± 2.48 f16.25 ± 2.23 f127.41 ± 4.71 a
S4Control7.46 ± 0.07 d4.30 ± 0.20 a11.74 ± 0.17 c45.50 ± 3.19 e42.48± 2.52 d−10.34 ± 1.41 f19.26 ± 5.50 d22.01 ± 5.14 d119.29 ± 6.01 e
PBZ8.53 ± 0.19 b3.52 ± 0.13 c12.04 ± 0.32 b58.40 ± 3.66 a37.09 ± 1.69 h−9.29 ± 0.96 c12.14 ± 1.64 h15.32 ± 1.69 h127.57 ± 3.16 a
z Stages correspond to 4 consecutive weeks as S1 (week 1), S2 (week 2), S3 (week 3) and S4 (week 4) from bolting to bud development of peony plants; z Treatment; y Leaf traits were chlorophyll a (Chla), chlorophyll b (Chlb), total chlorophyll (Chl), SPAD value (SPAD), and color coefficients:: L *: luminosity; a *: red and green properties; b *: yellow and blue properties; c *: chroma; h°: hue angle; x Mean ± standard error. Different letters indicate significant differences (two-way ANOVA, p < 0.05).
Table 3. Correlation between physiological characteristics and color coefficients at four consecutive weekly stages from bolting to bud development of peony leaves.
Leaf Trait zChlaChlbChlSPADL *a *b *c *
Chlb 10.815 * y0.459−0.3870.327−0.246−0.2790.423
Chl 10.757*−0.714 *0.575−0.591−0.6150.770 *
SPAD 1−0.989 **0.790 *−0.949 **−0.959 **0.971 **
z Leaf traits were chlorophyll a (Chla), chlorophyll b (Chlb), total chlorophyll (Chl), SPAD value (SPAD), and color coefficients:: L *: luminosity; a *: red and green properties; b *: yellow and blue properties; c *: chroma; h°: hue angle; y Correlation is significant at 95% probability (*) or at 99% probability (**).
Table 4. Effect of paclobutrozol (PBZ) on chlorophyll fluorescence parameters at four consecutive weekly stages from bolting to bud development of peony plants.
Stage zTmt yChlorophyll Fluorescence Parameter
Fv/FmqPqNΦPSIINPQ
S1CK0.770 ± 0.009 w b,c0.883 ± 0.054 c,d0.094 ± 0.004 c,d0.673 ± 0.048 c,d0.084 ± 0.004 c,d
PBZ0.790 ± 0.008 a,b0.906 ± 0.008 b,c0.085 ± 0.013 d,e0.705 ± 0.011 a,b,c0.077 ± 0.011 d,e
S2CK0.759 ± 0.037 c0.873 ± 0.047 d0.116 ± 0.008 a0.666 ± 0.056 d0.107 ± 0.008 a
PBZ0.793 ± 0.003 a,b0.915 ± 0.008 a,b0.106 ± 0.010 b-d0.714 ± 0.008 a,b0.090 ± 0.022 b−d
S3CK0.783 ± 0.009 a-c0.906 ± 0.023 b,c0.095 ± 0.012 c,d0.696 ± 0.035 b−d0.086 ± 0.011 c,d
PBZ0.805 ± 0.004 a0.934 ± 0.006 a,b0.075 ± 0.013 e0.735 ± 0.007 a0.067 ± 0.012 e
S4CK0.791 ± 0.011 a,b0.925 ± 0.010 a,b0.112 ± 0.013 a,b0.719 ± 0.024 a,b0.102 ± 0.011 a,b
PBZ0.806 ± 0.006 a0.941 ± 0.003 a0.106 ± 0.007 a-c0.738 ± 0.006 a0.099 ± 0.008 a-c
z Stages correspond to 4 consecutive weeks as S1 (Stage 1), S2 (Stages 2), S3 (Stages 3) and S4 (Stages 4) from bolting to bud development of peony plants; y Treatment; x Chlorophyll fluorescence parameters were the maximum quantum yield of PSII photochemistry (Fv/Fm), coefficient of photochemical quenching (qP), coefficient of non-photochemical quenching (qN), intrinsic PSII efficiency (ΦPSII) and non-photochemical quenching (NPQ); w Mean ± standard error. Different letters indicate significant differences (two-way ANOVA, p < 0.05).
Table 5. Correlation between chlorophyll fluorescence parameters and chlorophyll content at four stages from bolting to bud development of peony plants.
Trait zFv/FmqPqNΦPSIINPQChl
Fv/Fm1
qP0.972 **,y1
qN−0.386−0.2251
ΦPSII0.985 **0.991 **−0.2711
NPQ−0.387−0.2090.980 **−0.2631
Chl0.739 *0.783 *−0.2270.811 *−0.2011
z Chlorophyll traits were total chlorophyll (Chl) and the chlorophyll fluorescence parameters of maximum quantum yield of PSII photochemistry (Fv/Fm), coefficient of photochemical quenching (qP), coefficient of non-photochemical quenching (qN), intrinsic PSII efficiency (ΦPSII) and non-photochemical quenching (NPQ); y Correlation is significant at 95% probability (*) or at 99% probability (**).

