Impact of Water Deficit during Fruit Development on Quality and Yield of Young Table Grape Cultivars


1
Institute of Crop Science, University of Hohenheim, Fruwirthstr. 23, 70599 Stuttgart, Germany
2
Institute of Crop Science, Quality of Plant Products, University of Hohenheim, Emil-Wolff-Str. 25, 70599 Stuttgart, Germany
*
Author to whom correspondence should be addressed.
Horticulturae 2018, 4(4), 45; https://doi.org/10.3390/horticulturae4040045
Submission received: 28 September 2018
/
Revised: 28 October 2018
/
Accepted: 19 November 2018
/
Published: 23 November 2018
(This article belongs to the Special Issue Water Management of Horticultural Crops)
Abstract
:Water limitation has a major effect on agricultural crop production, influencing yield as well as external and internal quality parameters of table grapes. Due to their high yield potential, table grapes have a particularly high risk for yield and quality losses when water is limited, but grapevines are known for high heterogeneity within cultivars. Therefore, we investigated the effect of prolonged water deficits (control, moderate, and severe deficit) during fruit development on yield and quality parameters of four different table grape cultivars (Vitis L.). Furthermore, we ranked their suitability for cultivation in areas suffering from water limitation. Up to 31% of irrigation water could be saved in comparison to the control, without significant negative effects on plant yield, berry size, or internal quality parameters, such as total soluble solids and total phenolic content. However, single bunch yield was highest at a moderate deficit and number of seeds in berries increased with the severity of deficit. Cultivar selection had the greatest influence on water consumption and mainly defined yield and quality parameters. The cultivar ‘Fanny’ produced the highest yields (195.17 g per plant), most bunches per plant (2.04), and biggest berries while cv. ‘Nero’ had the highest total soluble solids content (26.33 °Brix) and the highest total phenolic content (67.53 mg gallic acid equivalents per 100 g fresh weight). Overall, ‘Fanny’ was the most promising cultivar for cultivation under water-limited conditions during fruit development, without significant effects on yield and quality parameters.
1. Introduction
Climate change and its effects have a major influence on agriculture. According to the Food and Agriculture Organization (FAO) [1], water shortage is currently the most significant factor limiting crop production in the world. Climate change scenarios predict that Central Europe, including Germany, will be affected by water limitations, changing precipitation patterns especially in Southern Europe, and will suffer from summer droughts [2].
Grapevines are considered to be drought tolerant plants [3], but most current cultivation areas are located in regions with decreasing water availability and a potential risk of high drought stress during the growing season [4]. In general, table grapes achieve high annual yields and indicate a high productivity for the water used [5,6,7,8]. However, they are exposed to high risks of quality and yield losses, when water is limited during growing seasons [9]. Timing, intensity, and duration of water limitation during the growing period are known to affect growth, yield, and quality of grapes differently [10]. Early season water limitation will reduce vegetative growth, while withholding water after bud break results in lower yields and reduced fruit quality [11]. During fruit development, early stage water deficits after flowering and before veraison result in smaller berries and reduced bunch yields [12,13,14]. Furthermore, deterioration of quality in terms of visual appearance of the bunch, berry color, and uniformity have been reported [15]. Contrasting behavior was determined for late season limitations, as the sensitivity of grapevines to water limitations after veraison is low [16].
In addition, quality parameters such as firmness, crisp texture, total soluble solids (TSS), phenolic content, and acidity content are essential, as they determine consumer acceptance and preference [15,17]. Several studies investigating the effects of water deficits on table grapes observed the highest yields and berry weights with the treatment receiving the highest irrigation volume [11], while quality parameters such as firmness decreased, titratable acidity (TA) remained constant and TSS increased [18], ultimately affecting overall consumer acceptance. Besides environmental factors such as soil water availability, cultivar selection has a major influence on yield and quality [19,20], and cultivars differ in their response to water limitation. Comparative studies of the grape cultivars ‘Moscatel’ (syn. Muscat of Alexandria) and ‘Castelão’ determined differences in yield and quality when subjected to a moderate deficit irrigation during the growing season [21]. Furthermore, cultivar dependent responses to post-veraison moderate deficit irrigation in ‘Autumn Royal’ and ‘Crimson Seedless’ were observed as they differed in grape production capacity, berry size, and sweetness [22]. Therefore, comparative studies with several cultivars are necessary to screen a wide range of table grape cultivars concerning the response of fruit quality and yield to water deficit, as they are important for optimal cultivar selection with regard to a changing climate. However, to our knowledge, no research has been done in the field on water deficits and plant responses of the most popular table grape cultivars in Germany.
Therefore, this work aimed to evaluate the effect of water deficits during fruit development on fruit yield and quality parameters of four common German table grape cultivars. Furthermore, the suitability of their cultivation under water limitations as a consequence of climate change will be considered.
2. Materials and Methods
2.1. Experimental Setup
A greenhouse experiment was conducted in 2016 at the University of Hohenheim, Germany, with four 3-year-old, own-rooted table grape cultivars, namely ‘Nero’, ’Fanny’, ’Palatina’, and ’Muscat Bleu’. The objective was to evaluate the impact of water deficits between fruit set and harvest on yield and quality parameters of these four cultivars. Plant material of the four cultivars originated from Rebveredlung Kühner, Germany.
Twenty-four plants per cultivar were grown in 7-L pots, filled with 40% loam, 50% sand, and 10% peat by volume, having a maximum water holding capacity of 37.8%. Since the first year, all table grapes were maintained with one shoot, which was attached to a bamboo stick and cut to an annual shoot length of 140 cm. Within the first two years, plants were defruited and water was limited during vegetative growth (2014: 6 weeks; 2015: 10 weeks). Table grapes were kept well hydrated and supplemented with 50 mL liquefied mineral fertilizers (1 g Hakapos® Blue (N 15% + P 10% + K 15% + Mg 2%) (CAMPO EXPERT, Münster, Germany) and 0.1 g micronutrient fertilizer Fetrilon®1 Combi (BASF, Ludwigshafen, Germany)) biweekly. Eight plants per cultivar were randomly assigned to a control, moderate, or severe water deficit treatment. Each day, control plants were irrigated to the calculated weight of 75% available water content (AWC), moderate deficit treatments to 50% AWC, and severe deficit treatments to 25% AWC. Before starting the treatment, AWC was determined for each pot/plant individually by flooding the pots after sunset to avoid transpiration losses. The excess water was able to drain overnight. Before sunrise, pots were weighed to get the maximum pot weight/field capacity. Wilting point was considered as the minimum weight of the pots where all pots were dried out until a constant weight was reached and plants started wilting. Plants were re-watered and adjusted to the plant-pot specific weight on a daily basis. The following formula was used to calculate the individual pot weight for every plant in each treatment:
In order to determine the total amount of applied water, daily water loss (evaporation and transpiration) was measured gravimetrically in the morning from fruit set until harvest using a platform scale (FKB 36K0.1, KERN, KERN & SOHN GmbH, Balingen, Germany) with a maximum range of 36 kg and 0.1 g accuracy. During the experiment, the pot weight was modified to account for the additional bunch weight at veraison. Pots were not covered and therefore evaporation was not prevented.
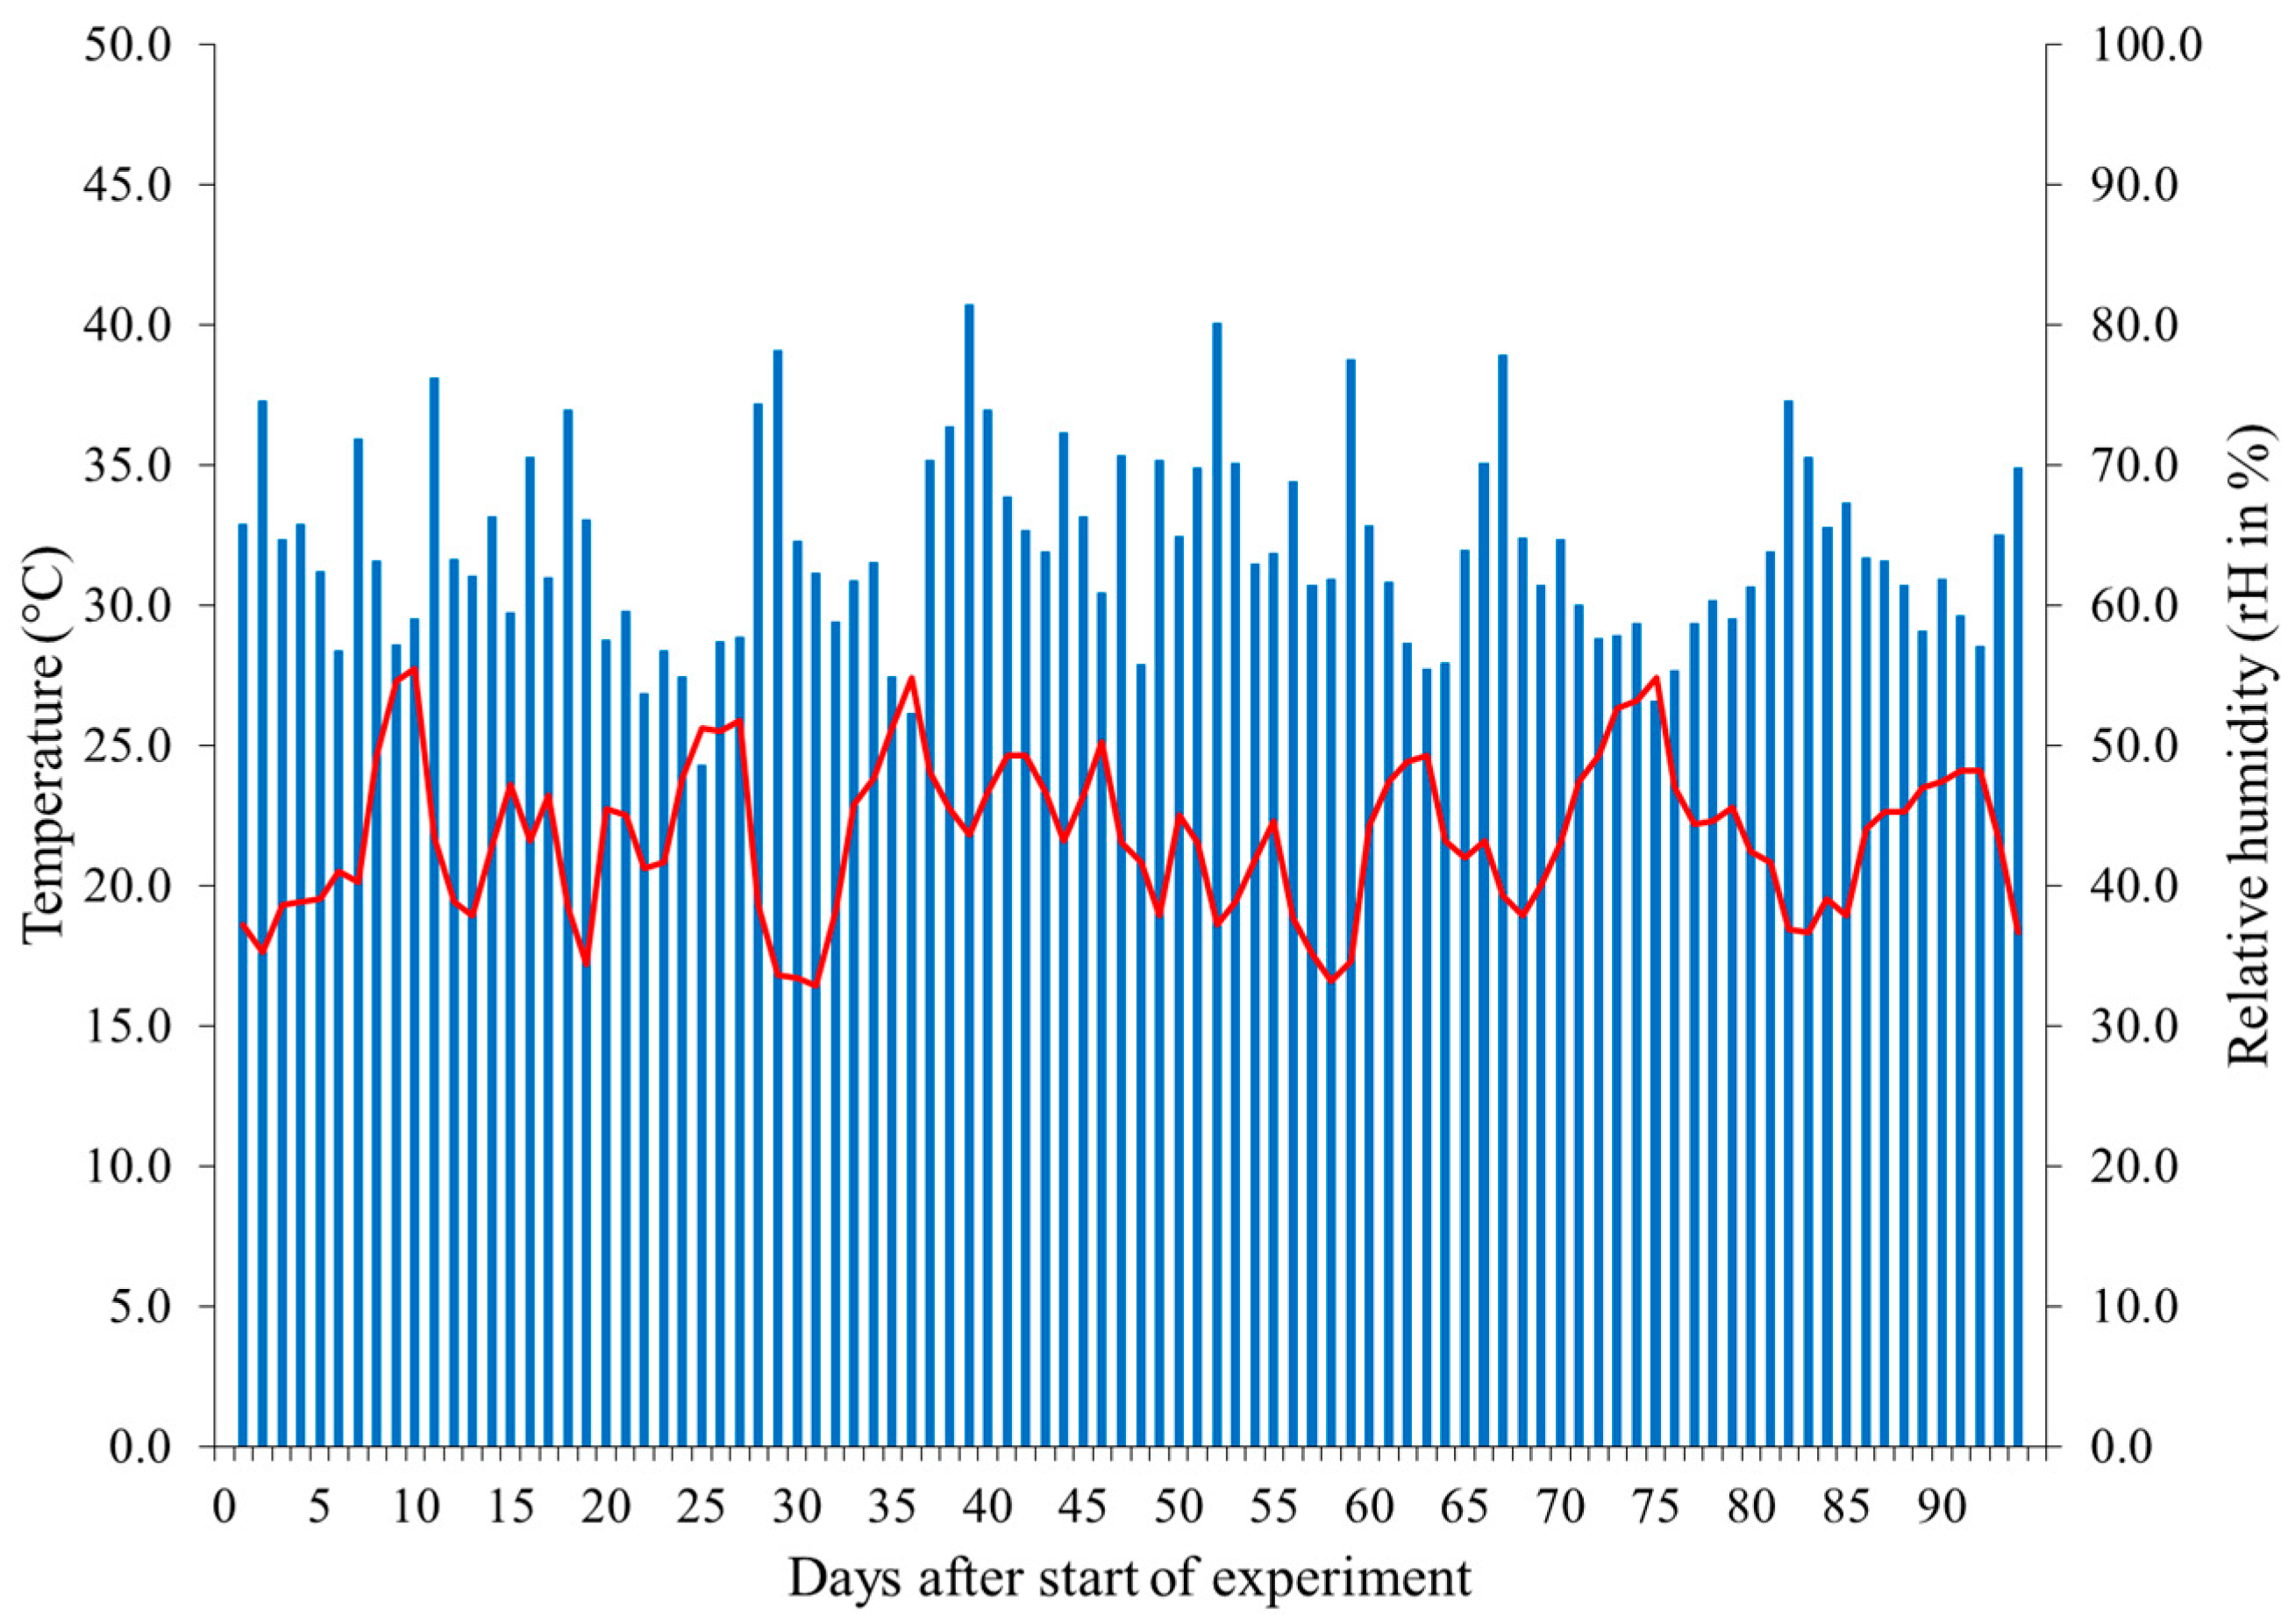
Temperature and relative humidity in the greenhouse were measured on a daily basis at five-minute intervals and stored using a datalogger (TGP-4500, Gemini Data Loggers, Chichester, UK). During the experiment mean temperature was 21.8 °C and relative humidity was 63.9% (Appendix A: Figure A1).
Volumetric water content (VWC) was measured using a soil moisture device (FieldScout TDR 100, MMM Tech, Germany). VWC was determined two weeks before the start of water deficit treatment at soil saturation. Soil moisture was measured every 28 days until final harvest of berries.
2.2. Yield and Quality Measurements
Harvest started on 12 September, 90 days after the induction of drought stress at the beginning of fruit set, and each vine was picked individually. Number of bunches, weight per bunch and total amount of fruit yield per plant were determined for each individual vine. Per bunch, berries were sorted into marketable and non-marketable (shot berries, shriveled berries), as well as counted and weighed. A sample of ten berries per bunch was selected randomly and their fresh weight was measured to determine the mean berry weight. Diameter and height of each berry were measured with a Vernier caliper and berry firmness was determined non-destructively using a firmness tester (Exacta-Härteprüfer HP-DRS, Bareiss). Twenty randomly-selected berries per vine were manually divided into skin, pulp and seeds, weighed, frozen with liquid nitrogen and stored at −20 °C, freeze-dried and weighed again. All the remaining berries per vine were crushed and must total soluble solids (°Brix) was measured using a digital refractometer (DR101-60, Krüss, Germany). Titratable acidity was measured by automatic titration (TitroLine easy, SCHOTT, Mainz, Germany) with 0.33 M NaOH to a pH 7.0 endpoint and was expressed as gram of tartaric acid L−1.Total phenolic content was determined using freeze-dried skin samples, ground to a final firmness of <300 µm (Knife Mill, GRINDOMIX GM 200, Retsch, Germany) using the Folin–Ciocalteu reaction [23]. Ground skin samples were analyzed as described by Sahamishirazi et al. [24] with minor modifications to duration of centrifugation (20 min), volume of skin extract (0.3 µL), and to the standard curve consisting of six standard solutions (0.06 g·L−1 to 2.1 g·L−1). Total phenols were measured two times per sample at 760 nm by spectrophotometry (Ultraspec 3100 pro, Amersham Biosciences, Piscataway, NJ, USA) and calculated based on the calibration curve. The results are expressed as milligram of gallic acid equivalents per 100 g of fresh weight (mg GAE 100 g−1 FW). For determination of plant and leaf water content, fresh weight (FW) of aboveground biomass and of leaves was determined at harvest, dried at 60 °C until reaching constant weight and weighed again for dry weight (DW). Plant and leaf water content were calculated using following formula:
2.3. Statistical Analysis
Yield and quality of the plant, bunch and berry level of four table grape cultivars (c = 4) on three water deficit levels (t = 3) were analyzed using PROC MIXED (SAS version 9.2., SAS Institute Inc., Cary, NC, USA) with the following model:
where is the general effect, and are random block effects for the kth table and the lth block on the kth table, respectively. , and corresponds to fixed main effects of the ith cultivar and jth water deficit treatment and its interaction effects, respectively. is the error effect of observation . To analyze average berry height, diameter, and firmness, seeds per berry, and single berry weight, data was weighted by number of berries measured per bunch. Total plant yield, yield per bunch, marketable and non-marketable yield per bunch needed to be weighted by the inverse of number of bunches per plant. Furthermore, the model was extended to allow for separate variances of table effects for each number of grapes if this decreased the model fit criteria AIC [25]. The counted number of berries and marketable berries were analyzed with PROC GLIMMIX using (3) as linear predictor with a log link for poisson-distributed data. Residuals were checked graphically for normality and homogeneity of variances. Data of skin weight, TSS, marketable yield, and weight per berry were square-root transformed prior to analysis. Data of TA, number and yield of non-marketable berries, and total phenolic content were logarithm transformed. Percentage values of volumetric water content, and plant and leaf water content, were transformed by logit transformation. For the evaluation of the parameter number of non-marketable berries per bunch, zero values had to be changed to 0.01 prior to logarithmic transformation. In case of a significant F-test, multiple comparisons for levels of the corresponding factor were performed based on Fisher’s Least Significant Difference (LSD) (P < 0.05). A letter display was created by using the SAS macro [26].
3. Results
3.1. Yield and Quality of Table Grapes
3.1.1. Plant-Level
Significant differences among cultivars occurred for the number of bunches per plant, bunch yield per plant, TSS, total phenolic content, and TA (Table 1). Furthermore, TA was significantly influenced by water deficit. ‘Fanny’ was the cultivar with the greatest number of bunches per plant (2.04), highest yield (195.17 g per plant), and lowest TSS (16.41 °Brix), and TA values (5.3 g·L−1). ‘Palatina’ had the fewest number of bunches per plant, producing an average of 0.85 bunches over all treatments in the first year of fruit production, as only 13 out of 24 vines produced bunches. The lowest amounts of average yield of the fruit producing vines were determined for ‘Muscat Bleu’ (44.22 g) and ‘Palatina’ (54.05 g) per plant. The highest content of TSS was measured for ‘Nero’ (26.33 °Brix), followed by ‘Palatina’ (24.78 °Brix), and ‘Muscat Bleu’ (22.56 °Brix). The highest TA was determined for ‘Nero’ with an average of 7.31 g·L−1 and the control treatment (6.51 g·L−1). Within the treatments, the severe water deficit treatment (5.67 g·L−1) differed significantly from the control and the moderate water deficit treatment (6.26 g·L−1 and 6.51 g·L−1, respectively). For total phenolic content, no differences among the treatments were observed. Within the cultivars, ‘Nero’ had the highest total phenolic content (67.53 mg GAE 100 g−1 FM), followed by ‘Muscat Bleu’ (46.36 mg GAE 100 g−1 FM) and ‘Palatina’ (13.22 mg GAE 100 g−1 FM) and lastly ‘Fanny’ with the lowest amount (7.39 mg GAE 100 g−1 FM).
3.1.2. Bunch-Level
When comparing table grape parameters at the bunch level, significant differences between the cultivars occurred for yield per bunch, marketable and non-marketable bunch yield, and the number of non-marketable berries (Table 2). Yield per bunch of all cultivars was also affected by the treatment. Number of berries and number of marketable berries per bunch showed significant interactions between treatments and cultivars. Over all cultivars, ‘Fanny’ was the cultivar with the highest bunch yields (103.23 g). The smallest yields were found with ‘Muscat Bleu’ (35.25 g) and ‘Palatina’ (39.95 g). Within the treatments, the moderate water deficit resulted in the highest average bunch yields (65.83 g), followed by the control (56.70 g) and lowest yields with the severe water deficit (51.88 g). For marketable yield, maximum values were observed for ‘Fanny’ (98.34 g), while ‘Muscat Bleu’ had the lowest yields (29.86 g). The highest values for non-marketable yields were found for ‘Nero’ with approximately 8.83 g. The lowest values for yield losses were measured for ’Muscat Bleu’ (0.57 g), and ‘Palatina’ (0.90 g). Regarding numbers of berries, we found similar results for total number of berries and number of marketable berries per bunch. In the control irrigation treatment, ‘Nero’ was the cultivar with highest number of berries (42.32) and marketable berries (32.70) along with ‘Fanny (33.89). When moderately stressed, ‘Palatina’ had the highest total number of berries (55.33) and marketable berries (39.05). ‘Fanny’ formed the most berries in total when severely stressed (32.97). ‘Muscat Bleu’ was the cultivar with the lowest number of berries and marketable berries within all treatments. The number of non-marketable berries was highest in ‘Palatina’ (6.66), followed by ‘Nero’ (1.83). ‘Fanny’ and ‘Muscat Bleu’ were the cultivars with the lowest amount of non-marketable berries per bunch (0.06 and 0.08, respectively).
3.1.3. Berry-Level
The quality and yield parameters of berries showed a significant impact of cultivar on all measured parameters including single berry weight, skin, pulp, and seed weight, the number of seeds as well as diameter, height and firmness (Table 3). Furthermore, water deficit treatment affected the number of seeds per berry. Overall, ’Fanny’ was the cultivar with highest weight of a single berry (3.76 g), skin (0.51 g) and pulp (2.33 g). For seed weight and number of seeds per berry, ‘Muscat Bleu’ was the cultivar with the highest seed weight of 0.17 g per seed and approximately 2.7 seeds per berry. Furthermore, the biggest berries were observed for ‘Fanny’ with an average of 17.67 mm in diameter and a height of 18.38 mm. In contrast, ‘Palatina’ was the cultivar with the lowest single berry weight (1.17 g), weight of skin (0.31 g), pulp (0.71 g), seed (0.06 g), and lowest number of seeds (1.5). For all cultivars, number of seeds was affected by the treatment and severe water deficit resulted in higher numbers of seeds per berry (2.4) in contrast to the control (2.1). ‘Palatina’ was determined as the cultivar with the smallest berries (diameter: 12.45 mm, height: 13.55 mm), which were 30% smaller than ‘Fanny’. Even if differences in berry size occurred for ‘Palatina’ and ‘Fanny’, both cultivars had the highest firmness (13.67 N and 14.73 N, respectively) and ‘Muscat Bleu’ had the softest berries (11.45 N).
3.2. Water Use and Water Contents of Soil, Plant and Leaves
In 2016, the water deficit treatments were applied daily from fruit set to harvest (June to September). Maximum water volumes were applied for the control treatment (Table 4). The cultivars differed in the volume of water that was applied, which was based on daily measurements. The highest values for irrigation volumes were observed for ‘Nero’ (891 mm) and the lowest volumes of water were applied to ‘Muscat Bleu’ (761 mm). Moderately stressed plants received 0.2 to 82 mm less water as compared to the control, which saved 0% water in ‘Muscat Bleu’ and 9% in ‘Nero’. The highest reduction in applied water was achieved in the severe stress treatment with 164 mm to a maximum of 263 mm in ‘Fanny’. This stands for a reduction of 22 to 31% of irrigation water.
Measurements of soil volumetric water content (VWC) before and during the experiment differed significantly among cultivars (Table 5). Overall, ‘Palatina’ had the highest VWC in all measurements, ranging between 34.73% at saturation and 17.74% VWC at harvest. Lowest values of soil moisture content were measured for ‘Fanny’ at harvest with 12.24% VWC. In June, when pots were saturated, no differences between the water deficit treatments were observed. Significant differences were found for the irrigation treatments, having the lowest VWC values for severe water deficit treatment (July (14.02%), August (13.08%), and September (12.37%)) and highest in the control treatment (July (20.26%), August (20.66%), and September (20.08%)).
For plant and leaf water content, significant differences among cultivars were found (Table 6). ‘Palatina’ was the cultivar having the highest water content in both plant (63.53%) and leaf (69.34%) tissues. The cultivar ‘Nero’ had the lowest water content (plant (60.64%) and leaf (66.01%). Within treatments, water deficit did not affect plant water content, but affected leaf water content. Moderate (67.75%) and severe water deficits (67.71%) showed no differences, while they differed significantly from the control (69.11%).
4. Discussion
Only a few studies have focused on the comparison of yield and quality of different table grape cultivars exposed to water deficits [22], especially on young vines. Most studies have investigated the performance of a single cultivar [9,10,27,28] most of which to our knowledge are not cultivated in Germany currently. Therefore, the aim of our experiment was to evaluate the effect of water deficit treatment on quality and yield of four 3-year old, own rooted and potted table grape cultivars already grown in Germany and to evaluate their suitability for a potential cultivation under foreseen water limiting conditions due to climate change.
Overall, the different water deficit levels had only a minor effect on yield and quality of the table grape cultivars in our study. Vines did not reduce total plant yield or berry size even if AWC was lowered by 50% in the severe treatment, which resulted in a water saving of up to 31% irrigation water. However, at the bunch level, cultivars responded to the deficit by decreasing bunch yield and produced highest yields when vines were moderately stressed. This indicated that a moderate water deficit and stress treatment may have a beneficial effect on bunch weights in comparison to the control and the severe water deficit treatments, which achieved lower yields. Most grapevine studies have reported that drought stress and limited water supply led to decreasing bunch yields as well as berry sizes and weight [9,15,22]. Differences between the results of these studies and our study can be explained by variations in plant age, timing, duration, and intensity of water deficits during the growing season. In general, water limitation in the early season is known to reduce berry size more than late season deficits [22]. Tarricone et al. [27] reported a negative effect on bunch weight, berry weight, and berry size during the early fruit growth stages of ‘Sublima Seedless’, when mild or severe drought stress was applied at the beginning of berry set. In our study, the total number of berries and number of marketable berries showed a cultivar specific reaction to the deficit. ‘Nero’ decreased the total number of berries as well as the number of marketable berries per bunch and a moderate deficit resulted in the highest number of berries in ‘Palatina’. The remaining cultivars reacted to the water limitation in the same manner as reported by Conesa et al. [16], where the number of berries of ‘Crimson Seedless’ was not influenced by different deficit treatments. Further, the firmness of berries is an important quality parameter of table grapes, as it determines the acceptance of consumers along with post-harvest quality [12,29]. Decreasing fruit firmness was described by several authors, when vines were treated with increasing water limitation and drought stress levels [12,18]. However, Zunñiga et al. [9,30] did not find decreasing fruit firmness when screening the response of quality and yield parameters of ‘Flame Seedless’ and ‘Thompson Seedless’ to different irrigation amounts. Overall, firmness is known to be highly dependent on the maturity stage of the berries, turgor pressure, water content [31], epidermal deterioration, and increasing cell wall elasticity [32]. Therefore, our results indicated an adequate water supply to maintain fruit firmness when water limitation occurred.
TSS, an important quality factor, did not increase or decrease when water deficit increased. Faci et al. [22] observed similar results when irrigation was limited, while the TSS values in a study of El-Ansary et al. [18] increased when drought stress intensified. Increased TSS contents are most likely caused by a concentration effect, due to smaller berries and/or reduced shoot growth combined with the reallocation of carbohydrates [14]. Therefore, since berry size and weight did not decrease with the severity of water deficit in our study, no concentrating of sugar within the berries occurred. Furthermore, total phenolic content was neither positively nor negatively affected when water deficit became more severe. This indicated that the plants most likely did not activate the phenolic biosynthesis pathways as a defense mechanism [16]. The only internal quality parameter in our study that decreased when water deficit increased was TA. Williams and Matthews [33] and Dos Santos et al. [34] reported higher TA in the control group or fully irrigated treatments as TA is known to be influenced by and respond to irrigation [33].
In contrast to the water deficit treatments, cultivar was the primary factor affecting yield and quality in our study regardless of the deficit treatment implemented. ‘Fanny’ was the cultivar that produced the highest number of bunches per plant in the first year of fruit production. The other cultivars differed in the number of fruit-producing plants, where at least four vines produced a minimum of one bunch per plant. Differences between the number of fruit-yielding plants per cultivar resulted in major yield differences. As vines were only three years old and in their first year of fruit production, this fact might have contributed to the large differences between cultivars. Furthermore, variations in the ability of buds to produce flowering bunches (fruitfulness) in grapevine cultivars were found by Somkuwar [35] in India, where ‘Thompson Seedless’ showed high variation, while ‘Muscat Hamburg’ and ‘Arkavati’, which are known for consistently high fruitfulness, did not. In a study by Lisek [36], twenty table grape cultivars were compared regarding yield and healthiness. Overall, differences between the cultivars were found by Lisek [36], where ‘Muscat Bleu’ was the cultivar producing the highest marketable yields within the six-year study, ranging between 0.65–2.52 kg per vine and year. ‘Fanny’ produced lower yields (0.68–2.51 kg per vine and year) compared to ‘Muscat Bleu’, but had higher bunch and berry weights. In our study, ‘Fanny’ was the cultivar with the highest yield per vine, bunch yield, and marketable yield. Compared to field studies of Lisek [36], Zulini et al. [37] and Kadir et al. [38] (Table 7), lower yields per plant were determined in our study. According to Lisek [36], differences in the yield of grapevine depend mainly on genetic factors, plant age, climatic conditions, fruitfulness, and fertilization. At harvest, all screened cultivars reached maturity (based on OIV maturity standards for table grapes [39]) having an equal or higher TSS degree of 16 °Brix or higher and a TSS:TA ratio higher than 20:1. Within the selected table grapes, high variations in TSS were found. Overall, the highest TSS values and softest berries of ‘Nero’ occurred most likely as a consequence of a delayed harvest time for this cultivar, as Kadir et al. [38] described ‘Nero’, in a comparison of 24 wine and table grape cultivars, as a European cultivar with an early harvest time. In our study, over-ripening and dehydration of the berries, due to a late harvest date, could have led to the decrease in quality such as the higher amount of shriveled, non-marketable berries in ‘Nero’. Lisek [36] reported lower TSS values for ‘Fanny’ and ‘Muscat Bleu’ (14.3% and 15.8% respectively). These values are lower than our results as the grapes in the study of Lisek [36] were harvested at individual harvest dates and climatic differences between Poland and Germany may result in lower TSS values. The highest amounts of bioactive compounds (total phenolic content) were found in the cultivar ‘Nero’, classified as a blue, black grape [38] followed by the blue cultivar ‘Muscat Bleu’. Within the green table grapes, the highest total phenolic contents were measured in the skin of ‘Palatina’ berries, while ‘Fanny’ had the lowest content of all four cultivars. Kanner et al. [40] and Katalinić et al. [41] also found variations in wine grapes and table grapes ranging from 260 to 930 mg·kg−1 and 435 to 3486 mg·kg−1, respectively. Values of most of our cultivars were in the same range, with total phenolic contents between 73.9 to 675.3 mg·kg−1 FW. In most cases, red/blue grape skins have a higher total phenolic content than white/green grapes. However, cultivar differences are reported as main reason for higher or lower phenolic contents in grape berries, not the skin color of the berries [41,42,43].
5. Conclusions
Yield and quality parameters of four young table grape cultivars grown under controlled conditions in Germany were affected only to a minor extent by water deficits during fruit development. Severe and prolonged limitation of irrigation water saved up 31% of irrigation water compared to the control, without having a major influence on important fruit quality parameters. Highest bunch yields were produced when a moderate water deficit (9% saved water) was implemented. Based on our results, the tested cultivars could be suitable for cultivation under water deficit due to climate change. ‘Fanny’, the cultivar having the highest fruitfulness, yields, and biggest berries regardless of water deficit level, was the most promising cultivar and should be further investigated. Moreover, since the taste of table grape cultivars is one of the most important quality parameters for consumers, sensory panels should be conducted to check the acceptance of the most promising cultivars.
Author Contributions
Conceptualization, C.S.W., N.M. and S.G.H.; Data curation, C.S.W.; Formal analysis, C.S.W.; Funding acquisition, C.S.W. and S.G.H.; Investigation, C.S.W.; Methodology, C.S.W. and S.G.H.; Project administration, C.S.W. and S.G.H.; Resources, C.S.W., N.M. and S.G.H.; Supervision, N.M. and S.G.H.; Validation, C.S.W. and S.G.H.; Visualization, C.S.W.; Writing—original draft, C.S.W.; Writing—review and editing, C.S.W., N.M. and S.G.H.
Funding
This research was funded by the Anton & Petra Ehrmann-Stiftung Research Training Group “Water People Agriculture”.
Acknowledgments
This study was conducted within the framework of the Anton & Petra Ehrmann-Stiftung Research Training Group “Water People Agriculture” at the University of Hohenheim.
Conflicts of Interest
The authors declare no conflict of interest. The founding sponsors had no role in the design of the study; in the collection, analyses, or interpretation of data; in the writing of the manuscript, and in the decision to publish the results.
Appendix A
Figure A1.
Daily mean values of air temperature and air humidity in the open greenhouse during the experimental period from fruit set until harvest in 2016.
Figure A1.
Daily mean values of air temperature and air humidity in the open greenhouse during the experimental period from fruit set until harvest in 2016.

References
- FAO. The State of the World’s Land and Water Resources for Food and Agriculture (SOLAW)—Managing Systems at Risk; Food and Agriculture Organization of the United Nations: Rome, Italy; Earthscan: London, UK, 2011. [Google Scholar]
- IPCC. Climate Change 2001: Impacts, Adaptation, and Vulnerability; Cambridge University Press: New York, NY, USA, 2001. [Google Scholar]
- Serra, I.; Strever, A.; Myburgh, P.; Deloire, A. Review: The interaction between rootstocks and cultivars (Vitis vinifera L.) to enhance drought tolerance in grapevine. Aust. J. Grape Wine Res. 2014, 20, 1–14. [Google Scholar] [CrossRef]
- Costa, J.M.; Ortuño, M.F.; Chaves, M.M. Deficit irrigation as a strategy to save water: Physiology and potential application to horticulture. J. Integr. Plant Biol. 2007, 49, 1421–1434. [Google Scholar] [CrossRef]
- Permanhani, M.; Costa, J.M.; Conceição, M.A.F.; de Souza, R.T.; Vasconcellos, M.A.S.; Chaves, M.M. Deficit irrigation in table grape: Eco-physiological basis and potential use to save water and improve quality. Theor. Exp. Plant Physiol. 2016, 28, 85–108. [Google Scholar] [CrossRef]
- Teixeira, A.H.D.C.; Bastiaanssen, W.G.M.; Ahmad, M.D.; Bos, M.G. Reviewing SEBAL input parameters for assessing evapotranspiration and water productivity for the Low-Middle São Francisco River basin, Brazil. Part B: Application to the regional scale. Agric. Forest Meteorol. 2009, 149, 477–490. [Google Scholar] [CrossRef]
- Molden, D.; Oweis, T.; Steduto, P.; Bindraban, P.; Hanjra, M.A.; Kijne, J. Improving agricultural water productivity: Between optimism and caution. Agric. Water Manag. 2010, 97, 528–535. [Google Scholar] [CrossRef]
- Pereira, L.S.; Cordery, I.; Iacovides, I. Improved indicators of water use performance and productivity for sustainable water conservation and saving. Agric. Water Manag. 2012, 108, 39–51. [Google Scholar] [CrossRef]
- Zúñiga-Espinoza, C.; Aspillaga, C.; Ferreyra, R.; Selles, G. Response of Table Grape to Irrigation Water in the Aconcagua Valley, Chile. Agronomy 2015, 5, 405–417. [Google Scholar] [CrossRef] [Green Version]
- Blanco, O.; Faci, J.M.; Negueroles, J. Response of table grape cultivar ‘Autumn Royal’ to regulated deficit irrigation applied in post-veraison period. Spanish J. Agric. Res. 2010, 8, 76–85. [Google Scholar] [CrossRef]
- Ezzahouani, A.; Williams, L.E. Effect of irrigation amount and preharvest cutoff date on vine water status and productivity of Danlas grapevines. Am. J. Enol. Viticul. 2007, 58, 333–340. [Google Scholar]
- Conesa, M.R.; de la Rosa, J.M.; Artés-Hernández, F.; Dodd, I.C.; Domingo, R.; Pérez-Pastor, A. Long-term impact of deficit irrigation on the physical quality of berries in “Crimson Seedless” table grapes. J. Sci. Food Agric. 2015, 95, 2510–2520. [Google Scholar] [CrossRef] [PubMed]
- Matthews, M.A.; Cheng, G.; Weinbaum, S.A. Changes in water potential and dermal extensibility during grape berry development. J. Am. Soc. Hortic. Sci. 1987, 112, 314–319. [Google Scholar]
- Reynolds, A.G.; Naylor, A.P. ‘Pinot noir’ and ‘Riesling’ Grapevines Respond to Water Stress Duration and Soil Water-holding Capacity. HortScience 1994, 29, 1505–1510. [Google Scholar]
- Perniola, R.; Crupi, P.; Genghi, R.; Antonacci, D. Cultivar and rootstock interaction affects the physiology and fruit quality of table grape with different water management—Preliminary results. Acta Hortic. 2016, 1136, 129–136. [Google Scholar] [CrossRef]
- Conesa, M.R.; Falagán, N.; de la Rosa, J.M.; Aguayo, E.; Domingo, R.; Pérez Pastor, A. Post-veraison deficit irrigation regimes enhance berry coloration and health-promoting bioactive compounds in “Crimson Seedless” table grapes. Agric. Water Manag. 2016, 163, 9–18. [Google Scholar] [CrossRef]
- Jayasena, V.; Cameron, I. Brix/Acid ratio as a predictor of consumer acceptability of Crimson Seedless table grapes. J. Food Qual. 2008, 31, 736–750. [Google Scholar] [CrossRef]
- El-Ansary, D.O.; Nakayama, S.; Hirano, K.; Okamoto, G. Response of Muscat of Alexandria table grapes to post-veraison regulated deficit irrigation in Japan. Vitis J. Grapevine Res. 2005, 44, 5–9. [Google Scholar]
- Santesteban, L.G.; Miranda, C.; Royo, J.B. Effect of water deficit and rewatering on leaf gas exchange and transpiration decline of excised leaves of four grapevine (Vitis vinifera L.) cultivars. Sci. Hortic. 2009, 121, 434–439. [Google Scholar] [CrossRef]
- Kamiloglu, O.; Sivritepe, N.; Önder, S.; Daghan, H. Effects of water stress on plant growth and physiological characteristics of some grape varieties. Fresenius Environ. Bull. 2014, 23, 2155–2163. [Google Scholar]
- Chaves, M.M.; Santos, T.P.; Souza, C.R.; Ortuño, M.F.; Rodrigues, M.L.; Lopes, C.M.; Maroco, J.P.; Pereira, J.S. Deficit irrigation in grapevine improves water-use efficiency while controlling vigour and production quality. Ann. Appl. Biol. 2007, 150, 237–252. [Google Scholar] [CrossRef] [Green Version]
- Faci, J.M.; Blanco, O.; Medina, E.T.; Martínez-Cob, A. Effect of post veraison regulated deficit irrigation in production and berry quality of Autumn Royal and Crimson table grape cultivars. Agric. Water Manag. 2014, 134, 73–83. [Google Scholar] [CrossRef] [Green Version]
- Singleton, V.L.; Orthofer, R.; Lamuela-Raventos, R.M. Analysis of total phenols and other oxidation substrate and antioxidants by means of Folin-Ciocalteu reagent. Methods Enzymol. 1999, 299, 152–178. [Google Scholar]
- Sahamishirazi, S.; Moehring, J.; Claupein, W.; Graeff-Hoenninger, S. Quality assessment of 178 cultivars of plum regarding phenolic, anthocyanin and sugar content. Food Chem. 2017, 214, 694–701. [Google Scholar] [CrossRef] [PubMed]
- Wolfinger, R. Covariance structure selection in general mixed models. Commun. Stat. Simul. Comput. 1993, 22, 1079–1106. [Google Scholar] [CrossRef]
- Piepho, H.P. A SAS macro for generating letter displays of pairwise mean comparisons. Commun. Biom. Crop Sci. 2012, 7, 4–13. [Google Scholar]
- Tarricone, L.; Di Gennaro, D.; Amendolagine, A.M.; Notarangelo, L.; Vox, G.; Schettini, E.; De Palma, L. Effects of water regimes on vine performance and quality of “Sublima” seedless table grape covered with plastic film to advance grape ripening. Acta Hortic. 2014, 1038, 593–6000. [Google Scholar] [CrossRef]
- El-Ansary, D.O.; Okamoto, G. Vine water relations and quality of “Muscat of Alexandria” table grapes subjected to partial root-zone drying and regulated deficit irrigation. J. Jpn. Soc. Hortic. Sci. 2007, 76, 13–19. [Google Scholar] [CrossRef]
- Mahajan, B.V.C.; Arora, N.K.; Gil, M.I.S.; Ghuman, B.S. Studies on extending storage life of ‘Flame Seedless’ grapes. J. Hortic. Sci. Ornamental Plants 2010, 2, 88–92. [Google Scholar]
- Zuñiga, C.; Aspillaga, C.; Ferreyra, R.; Selles, G. Response of “Flame Seedless” vines to different levels of irrigation water in the Aconcagua Valley, Chile. Acta Hortic. 2017, 1150, 295–302. [Google Scholar] [CrossRef]
- Bernstein, Z.; Lustig, I. A new method of firmness measurement of grape berries and other juicy fruits. Vitis 1981, 20, 15–21. [Google Scholar]
- Matthews, M.A.; Thomas, T.R.; Shackel, K.A. Fruit ripening in Vitis vinifera L.: Possible relation of veraison to turgor and berry softening. Aust. J. Grape Wine Res. 2009, 15, 278–283. [Google Scholar] [CrossRef]
- Williams, L.E.; Matthews, M.A. Grapevine. In Irrigation of Agricultural Crops; Stewart, B.A., Nielsen, D.R., Eds.; ASA-CSSA-SSSA: Madison, WI, USA, 1990; pp. 1019–1055. [Google Scholar]
- Dos Santos, T.P.; Lopes, C.M.; Rodrigues, M.L.; de Souza, C.R.; Ricardo-da-Silva, J.M.; Maroco, J.P.; Pereira, J.S.; Chaves, M.M. Effects of deficit irrigation strategies on cluster microclimate for improving fruit composition of Moscatel field-grown grapevines. Sci. Hortic. 2007, 112, 321–330. [Google Scholar] [CrossRef]
- Somkuwar, R.G. Fruitfulness in Grapes; National Research Centre for Grapes: Pune, India, 2005. [Google Scholar]
- Lisek, J. Evaluation of yield and healthiness of twenty table grapevine cultivars grown in central poland. J. Hortic. Res. 2014, 22, 101–107. [Google Scholar] [CrossRef]
- Zulini, L.; Vecchione, A.; Antonelli, L.; Stefanini, M. Characteristics of wine and table grapevine hybrids tested for cultivation in Trentino (northern Italy). IOBS/wprs Bull. 2008, 36, 215–219. [Google Scholar]
- Kadir, S.; Ennahli, S.; Griffin, J.; Ryer, R.; Shelton, M. Growth, Yield, Fruit Composition of 24 Wine and Table Grape Cultivars and Selections. Int. J. Fruit Sci. 2007, 7, 17–30. [Google Scholar] [CrossRef]
- OIV. OIV Standard on Minimum Maturity Requirements for Table Grapes; OIV: Paris, France, 2008. [Google Scholar]
- Kanner, J.; Frankel, E.; Granit, R.; German, B.; Kinsella, J.E. Natural antioxidants in grapes and wines. J. Agric. Food Chem. 1994, 42, 64–69. [Google Scholar] [CrossRef]
- Katalinić, V.; Možina, S.S.; Skroza, D.; Generalić, I.; Abramovič, H.; Miloš, M.; Ljubenkov, I.; Piskernik, S.; Pezo, I.; Terpinc, P.; et al. Polyphenolic profile, antioxidant properties and antimicrobial activity of grape skin extracts of 14 Vitis vinifera varieties grown in Dalmatia (Croatia). Food Chem. 2010, 119, 715–723. [Google Scholar] [CrossRef]
- Baiano, A.; Terracone, C. Varietal differences among the phenolic profiles and antioxidant activities of seven table grape cultivars grown in the south of Italy based on chemometrics. J. Agric. Food Chem. 2011, 59, 9815–9826. [Google Scholar] [CrossRef] [PubMed]
- Yang, J.; Martinson, T.E.; Liu, R.H. Phytochemical profiles and antioxidant activities of wine grapes. Food Chem. 2009, 116, 332–339. [Google Scholar] [CrossRef]

Table 1.
Table grape parameters at the plant level: Number of bunches per plant, yield per plant, TSS, TA, and total phenolic content of four three-year-old table grape cultivars under three water deficit treatments in 2016.
Table 1.
Table grape parameters at the plant level: Number of bunches per plant, yield per plant, TSS, TA, and total phenolic content of four three-year-old table grape cultivars under three water deficit treatments in 2016.
| Parameter | Cultivar | Muscat Bleu | Fanny | Nero | Palatina | |||||||||
|---|---|---|---|---|---|---|---|---|---|---|---|---|---|---|
| Treatment | ||||||||||||||
| Grapes per plant | Control | 1.13 | 2.13 | 1.38 | 0.63 | |||||||||
| Moderate | 1.13 | B z | 2.00 | A | 1.25 | B | 0.88 | B | ||||||
| Severe | 1.63 | 2.00 | 1.25 | 1.13 | ||||||||||
| Yield per plant (g) | Control | 44.17 | 189.76 | 96.44 | 36.20 | |||||||||
| Moderate | 46.17 | B | 216.10 | A | 57.49 | B | 73.72 | B | ||||||
| Severe | 42.31 | 179.65 | 54.54 | 52.23 | ||||||||||
| TSS (°Brix) | Control | 21.26 | 16.80 | 26.39 | 24.77 | |||||||||
| Moderate | 24.13 | C | 16.15 | D | 26.49 | A | 25.16 | B | ||||||
| Severe | 22.32 | 16.29 | 26.10 | 24.41 | ||||||||||
| TA (g·L−1) | Control | 7.04 | a | 5.43 | a | 7.90 | a | 6.86 | a | |||||
| Moderate | 6.27 | a | B | 5.55 | a | C | 6.73 | a | A | 5.81 | a | BC | ||
| Severe | 5.55 | b | 4.91 | b | 7.30 | b | n.a. | |||||||
| Total phenolic content (mg GAE 100 g−1 FW) | Control | 42.22 | 7.64 | 73.90 | 19.91 | |||||||||
| Moderate | 53.80 | B | 7.90 | D | 64.87 | A | 11.23 | C | ||||||
| Severe | 43.86 | 6.68 | 64.25 | 10.33 | ||||||||||
| ANOVA | Grapes per plant | Yield per plant | TSS | TTA | Total phenolic content | |||||||||
| Cultivar (C) | <0.0098 | ** | <0.0001 | *** | <0.0001 | *** | <0.0001 | *** | <0.0001 | *** | ||||
| Treatment (T) | 0.6363 | n.s. | 0.4115 | n.s. | 0.413 | n.s. | 0.0215 | * | 0.0837 | n.s. | ||||
| C*T | 0.9445 | n.s. | 0.4016 | n.s. | 0.525 | n.s. | 0.3225 | n.s. | 0.2279 | n.s. | ||||
The data represents mean values (yield per plant) and mean values of back transformed data (bunches per plant, TSS, TA, and total phenolic content). Treatments included: Control: daily irrigation to 75% of available water capacity; Moderate: daily irrigation to 50% of available water capacity; and Severe: daily irrigation to 25% of available water capacity. Total soluble solids (TSS); titratable acidity (TA); Gallic acid equivalents (GAE); fresh weight (FW); gram (g); liter (L); milligram (mg); not available (n.a.).
z Different letters indicate significant differences for cultivar (capital letters) and treatment (lower case) for P < 0.05; No letters indicate no differences for cultivar and/or treatment. ANOVA: ***: P < 0.001; **: P < 0.01; *: P < 0.05; not significant (n.s.).
Table 2.
Table grape parameters on the bunch level: Yield, marketable and non-marketable yield, number of berries, and number of marketable and non-marketable berries of four three-year-old table grape cultivars under three water deficit treatments in 2016.
Table 2.
Table grape parameters on the bunch level: Yield, marketable and non-marketable yield, number of berries, and number of marketable and non-marketable berries of four three-year-old table grape cultivars under three water deficit treatments in 2016.
| Parameter | Cultivar | Muscat Bleu | Fanny | Nero | Palatina | ||||||||||
|---|---|---|---|---|---|---|---|---|---|---|---|---|---|---|---|
| Treatment | |||||||||||||||
| Yield (g per bunch) | Control | 33.51 | Abz | C | 96.15 | ab | A | 63.00 | ab | B | 34.13 | ab | C | ||
| Moderate | 38.19 | a | 117.76 | a | 55.43 | a | 51.91 | a | |||||||
| Severe | 34.05 | b | 95.77 | b | 43.88 | b | 33.81 | b | |||||||
| Marketable yield (g per bunch) | Control | 28.82 | 90.80 | 43.83 | 30.70 | ||||||||||
| Moderate | 32.10 | C | 110.74 | A | 39.96 | B | 44.64 | BC | |||||||
| Severe | 28.73 | 94.03 | 34.13 | 29.39 | |||||||||||
| Non-marketable yield (g per bunch) | Control | 0.26 | 1.26 | 11.43 | 0.64 | ||||||||||
| Moderate | 0.00 | B | 3.89 | B | 8.90 | A | 1.24 | B | |||||||
| Severe | 0.84 | 0.33 | 6.77 | 0.87 | |||||||||||
| Number of berries (per bunch) | Control | 21.08 | a | C | 33.54 | a | B | 42.32 | a | A | 40.92 | b | AB | ||
| Moderate | 16.78 | a | C | 33.74 | a | B | 31.18 | b | B | 55.33 | a | A | |||
| Severe | 16.16 | a | C | 34.58 | a | A | 22.08 | c | B | 35.84 | b | A | |||
| Number of marketable berries (per bunch) | Control | 18.58 | a | B | 33.89 | a | A | 32.70 | a | A | 24.82 | b | B | ||
| Moderate | 17.17 | a | C | 34.90 | a | A | 22.71 | b | B | 39.05 | a | A | |||
| Severe | 15.94 | a | B | 32.97 | a | A | 19.27 | b | B | 26.74 | b | A | |||
| Number of non-marketable berries (per bunch) | Control | 0.80 | 0.06 | 2.86 | 3.12 | ||||||||||
| Moderate | 0.01 | B | 0.11 | B | 2.76 | A | 12.03 | A | |||||||
| Severe | 0.07 | 0.03 | 0.78 | 7.85 | |||||||||||
| ANOVA | Yield | Marketable yield | Non-marketable yield | Number of berries | Number of marketable berries | Number of non-marketable berries | |||||||||
| Cultivar (C) | <0.0001 | *** | <0.0001 | *** | <0.0001 | *** | <0.0001 | *** | <0.0001 | *** | <0.0001 | *** | |||
| Treatment (T) | 0.0204 | * | 0.0628 | n.s. | 0.1421 | n.s. | <0.0001 | *** | 0.0196 | * | 0.4825 | n.s. | |||
| C*T | 0.2721 | n.s. | 0.6606 | n.s. | 0.2635 | n.s. | <0.0001 | *** | 0.0019 | ** | 0.2167 | n.s. | |||
The data represents mean values (yield per bunch, total number of berries per bunch, and the number of marketable berries per bunch) and mean values of back transformed data (marketable and non-marketable yield and number of non-marketable berries). Treatments included: Control: daily irrigation to 75% of available water capacity; Moderate: daily irrigation to 50% of available water capacity; and Severe: daily irrigation to 25% of available water capacity. Gram (g).
z Different letters indicate significant differences for cultivar (capital letters) and treatment (lower case) for P < 0.05; No letters indicate no differences for cultivar and/or treatment. ANOVA: ***: P < 0.001; **: P < 0.01; *: P < 0.05; not significant (n.s.).
Table 3.
Table grape yield and quality parameters on the berry level: Single berry weight, weights of skin, pulp and seeds, diameter, height, and firmness of four three-year-old table grape cultivars under three water deficit treatments in 2016.
Table 3.
Table grape yield and quality parameters on the berry level: Single berry weight, weights of skin, pulp and seeds, diameter, height, and firmness of four three-year-old table grape cultivars under three water deficit treatments in 2016.
| Parameter | Cultivar | Muscat Bleu | Fanny | Nero | Palatina | |||||||||
|---|---|---|---|---|---|---|---|---|---|---|---|---|---|---|
| Treatment | ||||||||||||||
| Weight (g per berry) | Control | 2.01 | 3.52 | 1.77 | 1.08 | |||||||||
| Moderate | 2.79 | B z | 3.98 | A | 1.94 | C | 1.24 | D | ||||||
| Severe | 2.36 | 3.79 | 2.00 | 1.20 | ||||||||||
| Skin weight (g FM per berry) | Control | 0.37 | 0.48 | 0.40 | 0.20 | |||||||||
| Moderate | 0.33 | BC | 0.57 | A | 0.37 | B | 0.34 | C | ||||||
| Severe | 0.39 | 0.49 | 0.46 | 0.42 | ||||||||||
| Pulp weight (g FM per berry) | Control | 1.13 | 2.30 | 0.56 | 0.84 | |||||||||
| Moderate | 1.24 | B | 2.37 | A | 0.79 | C | 0.84 | C | ||||||
| Severe | 1.34 | 2.33 | 0.84 | 0.47 | ||||||||||
| Seed weight (g FM per berry) | Control | 0.16 | 0.12 | 0.09 | 0.06 | |||||||||
| Moderate | 0.21 | A | 0.15 | B | 0.09 | C | 0.06 | D | ||||||
| Severe | 0.16 | 0.16 | 0.14 | 0.06 | ||||||||||
| Number of seeds (per berry) | Control | 2.51 | b | 2.30 | b | 1.98 | b | 1.47 | b | |||||
| Moderate | 2.52 | ab | A | 2.69 | ab | A | 2.11 | ab | B | 1.44 | ab | C | ||
| Severe | 3.07 | a | 2.76 | a | 2.44 | a | 1.66 | a | ||||||
| Diameter (mm) | Control | 13.94 | 17.35 | 12.37 | 12.61 | |||||||||
| Moderate | 14.40 | B | 17.71 | A | 12.60 | C | 12.57 | C | ||||||
| Severe | 14.80 | 17.95 | 13.17 | 12.17 | ||||||||||
| Height (mm) | Control | 15.54 | 18.09 | 15.15 | 13.76 | |||||||||
| Moderate | 16.64 | B | 18.46 | A | 15.32 | C | 13.75 | D | ||||||
| Severe | 16.84 | 18.62 | 15.59 | 13.12 | ||||||||||
| Firmness (N) | Control | 11.26 | 14.87 | 10.88 | 14.58 | |||||||||
| Moderate | 11.75 | B | 15.11 | A | 10.74 | B | 12.82 | A | ||||||
| Severe | 11.33 | 14.23 | 10.74 | 13.59 | ||||||||||
| ANOVA | Weight | Skin weight | Pulp weight | Seed weight | ||||||||||
| Cultivar (C) | <0.0001 | *** | 0.0002 | *** | <0.0001 | *** | <0.0001 | *** | ||||||
| Treatment (T) | 0.0933 | n.s. | 0.0911 | n.s. | 0.4900 | n.s. | 0.0864 | n.s. | ||||||
| C*T | 0.9237 | n.s. | 0.2491 | n.s. | 0.1736 | n.s. | 0.1061 | n.s. | ||||||
| Number of Seeds | Diameter | Height | Firmness | |||||||||||
| Cultivar (C) | <0.0001 | *** | <0.0001 | *** | <0.0001 | *** | <0.0001 | *** | ||||||
| Treatment (T) | 0.0239 | * | 0.3277 | n.s. | 0.4132 | n.s. | 0.6837 | n.s. | ||||||
| C*T | 0.9263 | n.s. | 0.8211 | n.s. | 0.7352 | n.s. | 0.8105 | n.s. | ||||||
The data represents mean values (pulp weight, seed weight, number of seeds per berry, diameter, height, and firmness) and mean values of back transformed data (weight per single berry and skin weight). Treatments included: Control: daily irrigation to 75% of available water capacity; Moderate: daily irrigation to 50% of available water capacity; and Severe: daily irrigation to 25% of available water capacity. Fresh mass (FM); gram (g); millimeter (mm); Newton (N).
z Different letters indicate significant differences for cultivar (capital letters) and treatment (lower case) for P < 0.05; No letters indicate no differences for cultivar and/or treatment. ANOVA: ***: P < 0.001; **: P < 0.01; *: P < 0.05; not significant (n.s.).
Table 4.
Amounts of applied water (mm), differences in amount of applied water (mm) and water savings (%) from fruit set to harvest under different water deficit treatments in 2016 in table grape cultivars ‘Muscat Bleu’, ‘Fanny’, ‘Nero’, and ‘Palatina’.
Table 4.
Amounts of applied water (mm), differences in amount of applied water (mm) and water savings (%) from fruit set to harvest under different water deficit treatments in 2016 in table grape cultivars ‘Muscat Bleu’, ‘Fanny’, ‘Nero’, and ‘Palatina’.
| Parameter | Cultivar | Muscat Bleu | Fanny | Nero | Palatina |
|---|---|---|---|---|---|
| Treatment | |||||
| Irrigation amounts (mm) fruit set to harvest | Control | 761.2 | 859.7 | 891.0 | 832.0 |
| Moderate | 760.9 | 787.1 | 809.1 | 784.2 | |
| Severe | 596.9 | 597.0 | 637.4 | 598.0 | |
| Differences of irrigation amounts (mm) | Control—Moderate | 0.2 | 72.6 | 81.9 | 47.8 |
| Moderate—Severe | 164.1 | 190.1 | 171.7 | 186.2 | |
| Control—Severe | 164.3 | 262.7 | 253.6 | 234.0 | |
| Saved water (%) | Control—Moderate | 0.0 | 8.4 | 9.2 | 5.7 |
| Moderate—Severe | 21.6 | 24.2 | 21.2 | 23.7 | |
| Control—Severe | 21.6 | 30.6 | 28.5 | 28.1 | |
Table 5.
Soil volumetric water content (in %) at soil saturation and during the experiment of four three-year-old table grape cultivars under three water deficit treatments in 2016.
Table 5.
Soil volumetric water content (in %) at soil saturation and during the experiment of four three-year-old table grape cultivars under three water deficit treatments in 2016.
| Volumetric Water Contentz (in %) | Cultivar | Muscat Bleu | Fanny | Nero | Palatina | |||||||||
|---|---|---|---|---|---|---|---|---|---|---|---|---|---|---|
| Treatment | ||||||||||||||
| June | Control | 31.41 | Cy | 32.15 | B | 33.27 | AB | 35.49 | A | |||||
| Moderate | 30.06 | 31.95 | 33.21 | 34.00 | ||||||||||
| Severe | 29.83 | 33.82 | 33.89 | 34.71 | ||||||||||
| July | Control | 20.11 | a | B | 19.69 | a | B | 18.28 | a | B | 23.18 | a | A | |
| Moderate | 14.10 | b | 15.05 | b | 15.69 | b | 18.89 | b | ||||||
| Severe | 13.72 | c | 13.00 | c | 13.59 | c | 15.93 | c | ||||||
| August | Control | 20.80 | a | B | 19.28 | a | BC | 18.59 | a | C | 24.27 | a | A | |
| Moderate | 14.99 | b | 13.79 | b | 13.82 | b | 18.88 | b | ||||||
| Severe | 13.32 | c | 12.87 | c | 11.95 | c | 14.28 | c | ||||||
| September | Control | 21.77 | a | B | 16.00 | a | C | 20.95 | a | AB | 22.11 | a | A | |
| Moderate | 15.80 | b | 11.56 | b | 17.20 | b | 18.51 | b | ||||||
| Severe | 12.40 | c | 9.82 | c | 14.21 | c | 13.46 | c | ||||||
| ANOVA | June | July | August | September | ||||||||||
| Cultivar (C) | <0.0001 | *** | <0.0001 | *** | <0.0001 | *** | <0.0001 | *** | ||||||
| Treatment (T) | 0.4600 | n.s. | <0.0001 | *** | <0.0001 | *** | <0.0001 | *** | ||||||
| C*T | 0.7557 | n.s. | 0.3728 | n.s. | 0.3740 | n.s. | 0.3591 | n.s. | ||||||
zJune: Volumetric Water Content was measured two weeks before water deficit treatment at soil saturation. July: Volumetric Water Content was measured two weeks after start of water deficit treatment before irrigation. September: Volumetric Water Content was measured before harvest. The data represents mean values of back transformed data of Volumetric Water Content. Treatments included: Control: daily irrigation to 75% of available water capacity; Moderate: daily irrigation to 50% of available water capacity; and Severe: daily irrigation to 25% of available water capacity.
yDifferent letters indicate significant differences for cultivar (capital letters) and treatment (lower case) for P < 0.05; No letters indicate no differences for cultivar and/or treatment. ANOVA: ***: P < 0.001; **: P < 0.01; *: P < 0.05; not significant (n.s.).
Table 6.
Plant and leaf water content (absolute values) of four three-year-old table grape cultivars under three water deficit treatments at harvest in 2016.
Table 6.
Plant and leaf water content (absolute values) of four three-year-old table grape cultivars under three water deficit treatments at harvest in 2016.
| Parameter | Cultivar | Muscat Bleu | Fanny | Nero | Palatina | ||||||||||
|---|---|---|---|---|---|---|---|---|---|---|---|---|---|---|---|
| Treatment | |||||||||||||||
| Plant water content | Control | 62.13 | BCz | 63.21 | AB | 60.84 | C | 63.04 | A | ||||||
| Moderate | 60.20 | 63.12 | 60.14 | 64.94 | |||||||||||
| Severe | 61.76 | 62.49 | 60.94 | 62.59 | |||||||||||
| Leaf water content | Control | 69.59 | a | A | 69.41 | a | A | 67.50 | a | B | 69.92 | a | A | ||
| Moderate | 66.20 | b | 69.36 | b | 66.24 | b | 69.12 | b | |||||||
| Severe | 68.70 | b | 68.81 | b | 64.25 | b | 68.98 | b | |||||||
| ANOVA | Plant water content | Leaf water content | |||||||||||||
| Cultivar (C) | 0.0020 | *** | <0.0001 | *** | |||||||||||
| Treatment (T) | 0.8797 | n.s. | 0.0295 | * | |||||||||||
| C*T | 0.4909 | n.s. | 0.1592 | n.s. | |||||||||||
The data represents mean values of back transformed data of plant and leaf water content. Treatments included: Control: daily irrigation to 75% of available water capacity; Moderate: daily irrigation to 50% of available water capacity; and Severe: daily irrigation to 25% of available water capacity.
zDifferent letters indicate significant differences for cultivar (capital letters) and treatment (lower case) for P < 0.05; No letters indicate no differences for cultivar and/or treatment. ANOVA: ***: P < 0.001; **: P < 0.01; *: P < 0.05; not significant (n.s.).
Table 7.
Yield and maturity characteristics of field grown table grape cultivars ‘Muscat Bleu’, ‘Fanny’, ‘Nero’ and ‘Fanny’ based on literature.
Table 7.
Yield and maturity characteristics of field grown table grape cultivars ‘Muscat Bleu’, ‘Fanny’, ‘Nero’ and ‘Fanny’ based on literature.
| Cultivar | Muscat Bleu | Fanny | Nero | Palatina | ||||
|---|---|---|---|---|---|---|---|---|
| Parameter | ||||||||
| Yield (kg·plant−1) | 0.65–2.52 1 | [36] | 0.68–2.51 1 | [36] | 1.5–6.5 | [37,38] | 3.2 | [37] |
| Bunch weight (g) | 93–181 | [36] | 239–281 | [36,37] | 46–138 | [38] | 152 | [37] |
| Total soluble solids (°Brix) | 15.8–18.4 | [36,37] | 14.3–15.4 | [36,37] | 17.3–19.8 | [38] | 19.0 | [37] |
| Titratable acidity (g·L−1) | 5.20 | [37] | 4.49 | [37] | 6.2–8.7 | [37,38] | 7.64 | [37] |
| TSS:TA ratio | 35.38 2 | [37] | 34.3 2 | [37] | 21.49 2 | [37] | 24.87 2 | [37] |
1 Marketable fruit yield; 2 Calculated based on TSS and TA values given by Zulini et al. [37]. Gram (g); kilogram (kg); liter (L); Total soluble solids (TSS); Titratable acidity (TA).
© 2018 by the authors. Licensee MDPI, Basel, Switzerland. This article is an open access article distributed under the terms and conditions of the Creative Commons Attribution (CC BY) license (http://creativecommons.org/licenses/by/4.0/).
Share and Cite
MDPI and ACS Style
Weiler, C.S.; Merkt, N.; Graeff-Hönninger, S. Impact of Water Deficit during Fruit Development on Quality and Yield of Young Table Grape Cultivars. Horticulturae 2018, 4, 45. https://doi.org/10.3390/horticulturae4040045
AMA Style
Weiler CS, Merkt N, Graeff-Hönninger S. Impact of Water Deficit during Fruit Development on Quality and Yield of Young Table Grape Cultivars. Horticulturae. 2018; 4(4):45. https://doi.org/10.3390/horticulturae4040045
Chicago/Turabian StyleWeiler, Carolin Susanne, Nikolaus Merkt, and Simone Graeff-Hönninger. 2018. "Impact of Water Deficit during Fruit Development on Quality and Yield of Young Table Grape Cultivars" Horticulturae 4, no. 4: 45. https://doi.org/10.3390/horticulturae4040045
Note that from the first issue of 2016, this journal uses article numbers instead of page numbers. See further details here.