Article

Role of RcTINY2 in the Regulation of Drought and Salt Stress Response in Arabidopsis and Rose

1
College of Landscape Architecture and Forestry, Qingdao Agricultural University, Qingdao 266000, China
2
Shandong Provincial Forestry Protection and Development Service Center, Jinan 250014, China
3
College of Horticultural, Qingdao Agricultural University, Qingdao 266000, China
*
Authors to whom correspondence should be addressed.
Horticulturae 2022, 8(8), 747; https://doi.org/10.3390/horticulturae8080747
Submission received: 1 August 2022 / Revised: 16 August 2022 / Accepted: 16 August 2022 / Published: 18 August 2022
(This article belongs to the Section Biotic and Abiotic Stress)

Abstract

:
In plants, transcription factors (TFs) belonging to the APETALA2/ethylene responsive factor (AP2/ERF) superfamily regulate a variety of life processes, including germination, maturation, and stress response. In the present study, RcTINY2, a novel dehydration response element binding protein (DREB) belonging to the A-4 group, was identified and characterized in rose (Rosa chinensis). RcTINY2 shares high homology with AtTINY2 of Arabidopsis (Arabidopsis thaliana), with several abiotic stress-responsive cis-regulatory elements. Transcript levels of RcTINY2 were induced by exposure to abscisic acid (ABA) in rose leaves and repressed by exposure to ABA, polyethylene glycol (PEG), and NaCl in rose roots. RcTINY2 is localized in the nucleus and showed transcriptional activation in yeast cells. Further analysis of transgenic Arabidopsis demonstrated that plants overexpressing RcTINY2 displayed increased ABA, PEG, and NaCl sensitivity in both germinating seeds and seedlings with reduced root growth and lateral root number. RcTINY2-silenced rose plants were found to be increasingly intolerant of both drought and salt stress. Furthermore, the transcript levels of several ABA- and abiotic stress-related genes were suppressed in RcTINY2-silenced rose plants. The results suggested that RcTINY2 may serve as a candidate gene for genetic improvement of abiotic stress tolerance in rose and other plant species.

1. Introduction

Plants experience abiotic stress when exposed to potentially injurious environmental conditions, such as extreme temperature, high salinity, and drought. As a response mechanism, plants have evolved intricate and effective means of both surviving and adapting to such adverse conditions. The primary role of plant stress response involves the ability to perceive the relevant environmental stimuli, accurately transmit these signals to other cells, and adequately modulate gene expression to organize an efficient and effective response [1]. Transcription factors (TFs), biomolecules that control the rate of transcription from DNA to RNA, are key regulators in a variety of essential life processes, including germination, maturation, and response to stress [2]. Plants can quickly respond to exposure to adverse conditions through the action of certain families of TFs, including MYBs, WRKYs, and NACs, which act to regulate the downstream expression of an array of genes related to abiotic stress tolerance [3]. One such TF, the APETALA2/ethylene responsive factor (AP2/ERF), is found widely among plant species [4]. The AP2/ERF TFs can be split into four major subfamilies based on the difference in sequence structure and other characteristics, namely AP2, ERF, RAV, and DREB [5].
Dehydration response element binding proteins (DREBs) are the most widely distributed and evolutionarily conserved AP2/ERF TFs and consist of six different group members, namely A-1, A-2, A-3, A-4, A-5, and A-6 [6]. Most well-characterized DREB family members belong to the A-1, A-2, A-5, and A-6 groups, but the information is still lacking on the function of members of the A-4 group. The DREB TFs are known to regulate plant abiotic stress response and have been characterized in a broad array of plants, including Populus [7], rice [8], and Arabidopsis [9]. In Arabidopsis, the DREB/CBF family gene DEAR4 responds to multiple abiotic stress conditions [9]. Additionally, the overexpression of either soybean (Glycine max) GmDREB2 or rice (Oryza sativa) OsDREB1A in transgenic Arabidopsis improved resistance to both salt and drought stress [8,10]. In apple (Malus domestica), MdDREB2 was found to activate the expression of MdNCED6/9, thereby positively regulating the process of abscisic acid (ABA) biosynthesis [11]. Exposure to low temperatures, water limitation, and salinity stress was found to induce the expression of DvDREB2A in chrysanthemum (Dendranthema vestitum) [12], TaDREB in wheat (Triticum aestivum) [13], and GhDBP33 in cotton (Gossypium herbaceum) [14].
Rose (Rosa spp.) is an important horticultural plant and is widely planted in China and across the world. Because of its wide geographical distribution, the rose plant is subjected to both changing and extreme environmental conditions, including exposure to drought, salt, and chilling, which can have negative consequences on both the quality and yield of rose plants. While the AP2/ERF TFs have long been understood as essential regulators of plant abiotic stress response, their specific role in the rose plant remains obscure. In this study, RcTINY2, an A-4 member of the DREB subfamily TFs, was isolated from the rose plant. RcTINY2 transcripts were induced by ABA treatment in rose leaves, while they were suppressed by ABA, NaCl, and polyethylene glycol (PEG) treatment in rose roots. Transgenic overexpression of RcTINY2 in Arabidopsis resulted in increased sensitivity to ABA, NaCl, and PEG exposure. Furthermore, silencing of RcTINY2 in rose did not improve the drought and salinity tolerance. The results of our investigation add to our understanding of the mechanism of DREB A-4 TFs in plant abiotic stress tolerance as well as of RcTINY2 in rose plants specifically.

2. Materials and Methods

2.1. Rose Cultivation and Abiotic Stress Treatment

Rose (Rosa chinensis ‘Old Blush’) plants were grown in a trial garden at Qingdao Agricultural University, Qingdao, China. Rose plants were produced in vitro using young compound leaves as explants. The explants were rinsed with tap water for 30 min, disinfected with 75% alcohol for 30 s, 0.1% mercuric chloride for 8 min and rinsed 3–4 times with Milli-Q water under ultra-clean bench conditions. Clean filter paper was used to dry the surface liquid. The sterilized explants were placed on a proliferation medium (4.4 g/L Murashige and Skoog (MS) + 30 g/L sucrose + 0.1 mg/L GA3 + 0.5 mg/L 6-BA + 0.004 mg/L NAA + 7 g/L agar; pH = 5.85) at 22 ± 1 °C under an 8 h dark/16 h light period. Two-month-old plants having eight compound leaves were transplanted into either MS medium (control) or MS medium containing either 200 mM NaCl, 10% PEG 6000 or 50 μM ABA. Transplanted plants were subsequently grown for five days, and both control and treated materials were used for analyses.

2.2. Bioinformatic Analysis of RcTINY2

Amplification of RcTINY2 was accomplished using specific primers listed in Table S1, and the Rosaceae database (https://www.rosaceae.org/, accessed on 10 March 2020) was used to verify the primers. The PLACE database (http://bioinformatics.psb.ugent.be/webtools/plantcare/html/, accessed on 6 May 2020) was used to predict any cis-acting elements located within approximately 2000 bp of the upstream sequence of the RcTINY2 translation initiation codon. CLUSTALW (https://www.genome.jp/tools-bin/clustalw, accessed on 6 May 2020) was used to construct multiple sequence alignments and MEGA 7.0 [15] to perform phylogenetic analysis using the neighbor-joining method with 1000 replicates. Results were visualized using the Evolview software [16].

2.3. Determination of Transcriptional Activation and Subcellular Localization

Transcriptional activation assay was performed using a yeast system. Yeast strain ‘Y2HGold’ (WeiDi Biotechnology, Shanghai, China) was cultured for three days in an incubator at a constant temperature of 28 °C. pGBKT7 and open reading frame (ORF) of RcTINY2 were digested with NdeI and BamHI and ligated to construct pGBKT7-RcTINY2 (Supplementary Figure S1). The pGBKT7-RcTINY2, pGAL4 (positive-control) and pGBKT7 (negative-control) plasmids were transferred into separate yeast cultures. Yeasts were selected on either a synthetic defined (SD) medium without tryptophan (SD/-Trp) or an SD medium without tryptophan, histidine, adenine, and 5-bromo-4-chloro-3-indolyl-α-d-galactoside (SD/-Trp-His-Ade, X-α-gal). Primer sequences are listed in Table S1.
Subcellular localization assay was performed as follows. Briefly, the RcTINY2 coding region was amplified by PCR, digested with HindIII and SalI, and finally subcloned into a modified pCAMBIA 1300 vector with a GFP reporter gene driven by a constitutive Super promoter [17] to generate RcTINY2-GFP (Supplementary Figure S2). Inflorescence dip was used to transform Arabidopsis using Agrobacterium GV3101 [18]. Three independent T3 generation RcTINY2-overexpressing (RcTINY2-OE) lines (OE#1, 2 and 3) were selected using a 25 mg/L hygromycin-containing medium. Only the primary roots of RcTINY2-OE plants were used to monitor subcellular localization and a TCSSP5II confocal laser microscope (Leica, Wetzlar, Germany) was used to observe GFP fluorescence.

2.4. Extraction and Quantification of RNA

Detached leaves of three-week-old control (VC) and transgenic RcTINY2-OE (OE#1, OE#2, and OE#3) plants, and the leaves and roots of rose plants with eight compound leaves treated with ABA, PEG, and NaCl samples were used for RNA extraction, respectively. Total RNA was extracted using the RNAprep Pure Plant Kit (Tiangen, Beijing, China) and quantified using spectrophotometry. HiScript II 1st Strand cDNA synthesis kit (Vazyme Biotech, Nanjing, China) was used to synthesize cDNA with 1 μg of total RNA. StepONE Plus system (Applied Biosystems, MA, USA) was used to carry out quantitative real-time PCR (RT-qPCR) with SYBR qPCR Master Mix (Vazyme Biotech, Nanjing, China). The PCR reaction mixture (20 μL) was made up of 7.2 μL of ddH2O, 10 μL of 2× ChamQ Universal SYBR qPCR Master mix, 2 μL of cDNA and 0.4 μL of each primer (0.5 mM). The PCR reaction was performed as follows: 95 °C for 30 s; 40 cycles at 95 °C for 10 s and at 60 °C for 20 s. To normalize mRNA expression levels, the internal control gene RcUBI2 (GenBank accession number: JK618216) was used for rose and AtACTIN2 (GenBank accession number: AT3G18780) for Arabidopsis. Gene expression levels were analyzed using the 2−ΔΔCT method [19]. All experimental treatments consisted of at least three replicates. The PCR primers used are found in Table S1.

2.5. Detection of Abiotic Stress Response in Arabidopsis

Germination and seedling growth assays were performed using three biological replicates of 16 seeds each from both VC and RcTINY2-OE plants grown in identical environmental conditions. Briefly, the seeds were placed on an MS medium containing either ABA (0, 0.5, or 1.0 μM ABA), NaCl (0, 100, 150 or 200 mM), or PEG 6000 (0, 4, 8, 12 or 16%). Plates were first incubated in the dark at 4 °C for three days, after which they were incubated under standard growing conditions (24 ± 2 °C; 8 h dark/16 h light). Cotyledon greening is defined as the sprouting of seeds with seed coat and green cotyledons. Data were collected seven days after planting and three independent experiments were conducted for each treatment.
To determine whether RcTINY2 influences root growth under abiotic stress, ten-day-old VC and RcTINY2-OE seedlings of similar size were moved to MS plates containing either 0 or 100 μM ABA or 100, and 150 mM NaCl. The initial position of the primary roots was recorded, and the seedlings were vertically cultivated under identical growth conditions for ten days and subsequently photographed. Increase in root growth and lateral root numbers was measured using ImageJ (https://imagej.nih.gov/ij/, accessed on 13 June 2021). Whole plants were weighed and defined as fresh weight. All experiments consisted of three biological replicates of five plants each.
To quantify the levels of accumulated reactive oxygen species (ROS) between VC and RcTINY2-OE plants, ten-day-old seedlings were vacuumed at 0.7 Mpa and immersed in either 20% PEG 6000 solution or distilled water (control) for 30 min. All plants were stained with 3,3′-diaminobenzidine (DAB, 1 mg/mL) or nitro blue tetrazolium (NBT, 1 mg/mL) for 12 h, and subsequently photographed under a Stemi DV4 stereomicroscope (Carl Zeiss Microscopy, Munchen, Germany). The concentration of hydrogen peroxide (H2O2) was quantified according to the potassium iodide (KI) method [20].

2.6. Examination of the Effects of RcTINY2 Silencing

To ascertain the effects of RcTINY2 silencing in rose, virus-induced gene silencing (VIGS) was carried out. Briefly, the 321 bp region at the RcTINY2 N-terminus was cloned and ligated to the pTRV2 vector to obtain pTRV2-RcTINY2 [17]. Before infiltration, tender detached single leaves from the tips of the rose (Rosa hybrida ‘Kui’) plants were collected and divided into two groups. To perform infiltration, Agrobacterium strain GV3101 containing either pTRV1 and pTRV2 (TRV), or pTRV1 and pTRV2-RcTINY2 (TRV-RcTINY2) were mixed at a 1:1 ratio (final OD600 of 0.5) and placed in the dark for 4 h. After incubating for 4 h, the leaves were immersed in the bacterial solution and placed under vacuum at 0.7 Mpa for 15 min with the process being repeated. The leaves were incubated in distilled water for three days in a dark incubator at 8 °C. After removal, the leaves were immersed in water with or without 300 mM NaCl for five days [21] or dehydrated for 0, 6, 12 or 24 h, and then rehydrated for 6 h under controlled conditions (24 ± 2 °C, 50–70% humidity, and 8 h dark/16 h light). At each of the previously-mentioned time points, the leaves of TRV and TRV-RcTINY2 were stained with DAB, NBT, and trypan blue for 12 h, respectively, and the fresh weight of the leaf, total chlorophyll content, and electrolytic leakage were determined [22]. All experimental treatments consisted of three biological replicates of five plants each.

2.7. Statistical Analyses

Statistical analyses were conducted using IBM SPSS v25.0 (SPSS Inc., Chicago, IL, USA). To compare the statistical validity of data, the Least Significant Difference (LSD) test was performed. Significance was set at p < 0.05.

3. Results

3.1. Phylogenetic Relationship and Sequence Analysis of RcTINY2

In our previous transcriptomic analysis of rose plants subjected to drought stress [5], the AP2/ERF TF family was found to play an integral role in enabling rose plants to adapt to drought conditions. Based on [5], a differentially expressed DREB subgroup member, RcHm_v2.0_Chr6g0306191, was selected for further analyses. Phylogenetic analysis indicated that RcHm_v2.0_Chr6g0306191 and four other proteins (MnDREB4D, ZmDBF2, AtTINY, and AtTINY2) belong to the A-4 group of the DREB subfamily (Figure 1A). Due to its high homology with Arabidopsis AtTINY2, RcHm_v2.0_Chr6g0306191 was named as RcTINY2 (GenBank accession MH152410). Gene structure analysis showed that RcTINY2 is 750 bp in length, encodes 249 amino acids, and has no introns. Its isoelectric point (pI) and molecular weight (Mw) were estimated as 5.33 and 27.03 kDa, respectively.
Sequence alignments of RcTINY2, MnDREB4D, ZmDBF2, AtTINY, and AtTINY2 indicated that each of these proteins has a conserved N-terminal AP2/ERF DNA-binding domain consisting of ~61 amino acid residues (62–123) (Figure 1B). The typical AP2 domain was also found to consist of a nuclear localization site (NLS) with one α-helix and three β-sheets forming its three-dimensional structure. Analysis of the 2000-bp RcTINY2 promoter region indicated that this region contains a variety of cis-regulatory elements (CREs) (Table S2, Figure 1C). Five kinds of abiotic stress-related CREs, namely ARE, ABRE, MYB, MYC, and STRE, were found to exhibit uneven distribution, especially in the 1500–2000 bp region. Specifically, the RcTINY2 promoter region was observed to contain a total of five STRE, four MYC, three MYB, two ARE, and one ABRE CRE.

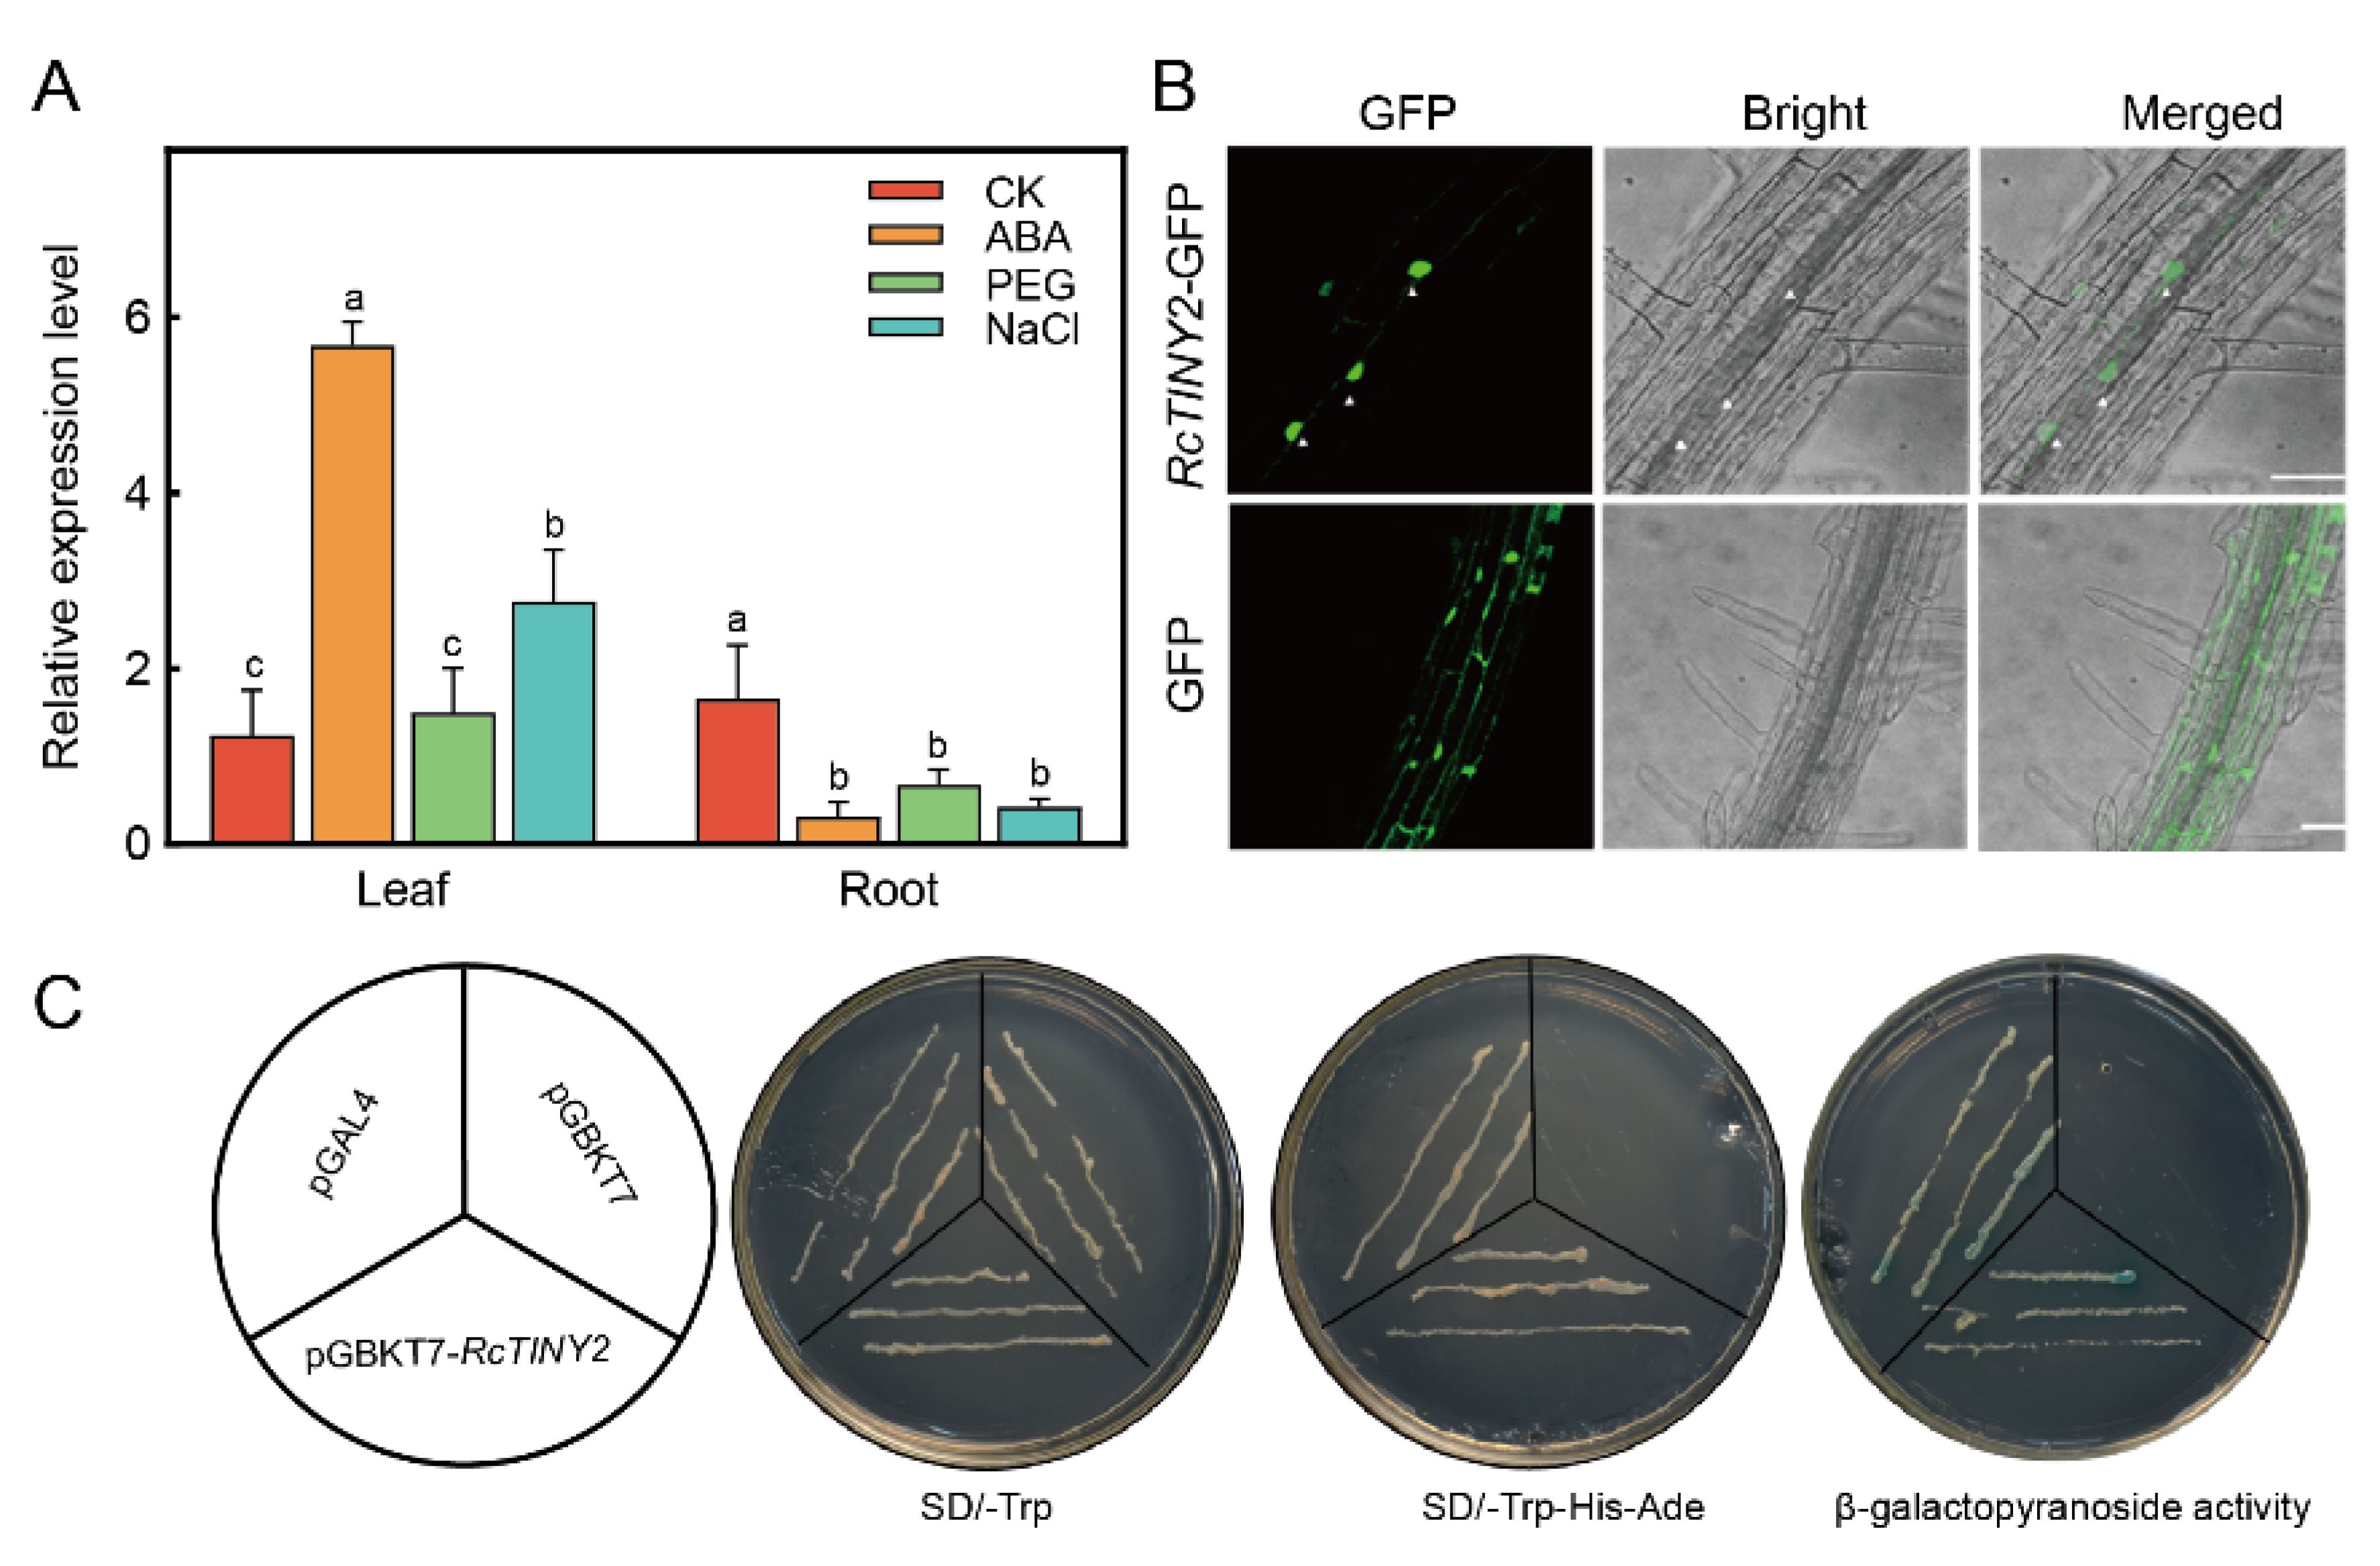
3.2. Expression Characteristics, Subcellular Localization and Transcription Activation Analysis

RT-qPCR was used to find the expression pattern of RcTINY2 in response to abiotic stress in both leaves and roots of rose plants. In rose leaves, the transcript levels of RcTINY2 were enhanced 5-fold under ABA and 2.5-fold under NaCl treatment (Figure 2A). However, in rose roots, RcTINY2 exhibited a 70–90% reduction in expression levels in response to ABA, NaCl, and PEG treatment (Figure 2A). As RcTINY2 contains NLS in its N-terminal region (Figure 1B), subcellular localization of RcTINY2 was examined in the root cells of Arabidopsis. Specifically, the fluorescence of VC and RcTINY2-overexpressing Arabidopsis was examined under 488 nm excitation. In VC plants, GFP fluorescence was detected in both the nucleus and cytoplasm, while in RcTINY2-GFP plants, GFP was observed only in the nucleus (Figure 2B). Next, the transcriptional activity of RcTINY2 was examined. The entire RcTINY2 coding region was fused to the pGBKT7 vector’s GAL4 DNA-binding domain, and then the entire construct was transformed into yeast cells. LacZ reporter gene was found duly expressed in both pGAL4- and pGBKT7-RcTINY2-transformed yeast cells as detected by the colony lift filter assay (Figure 2C). The combined results showed that RcTINY2 acts as a nuclear-localized activator of transcription.

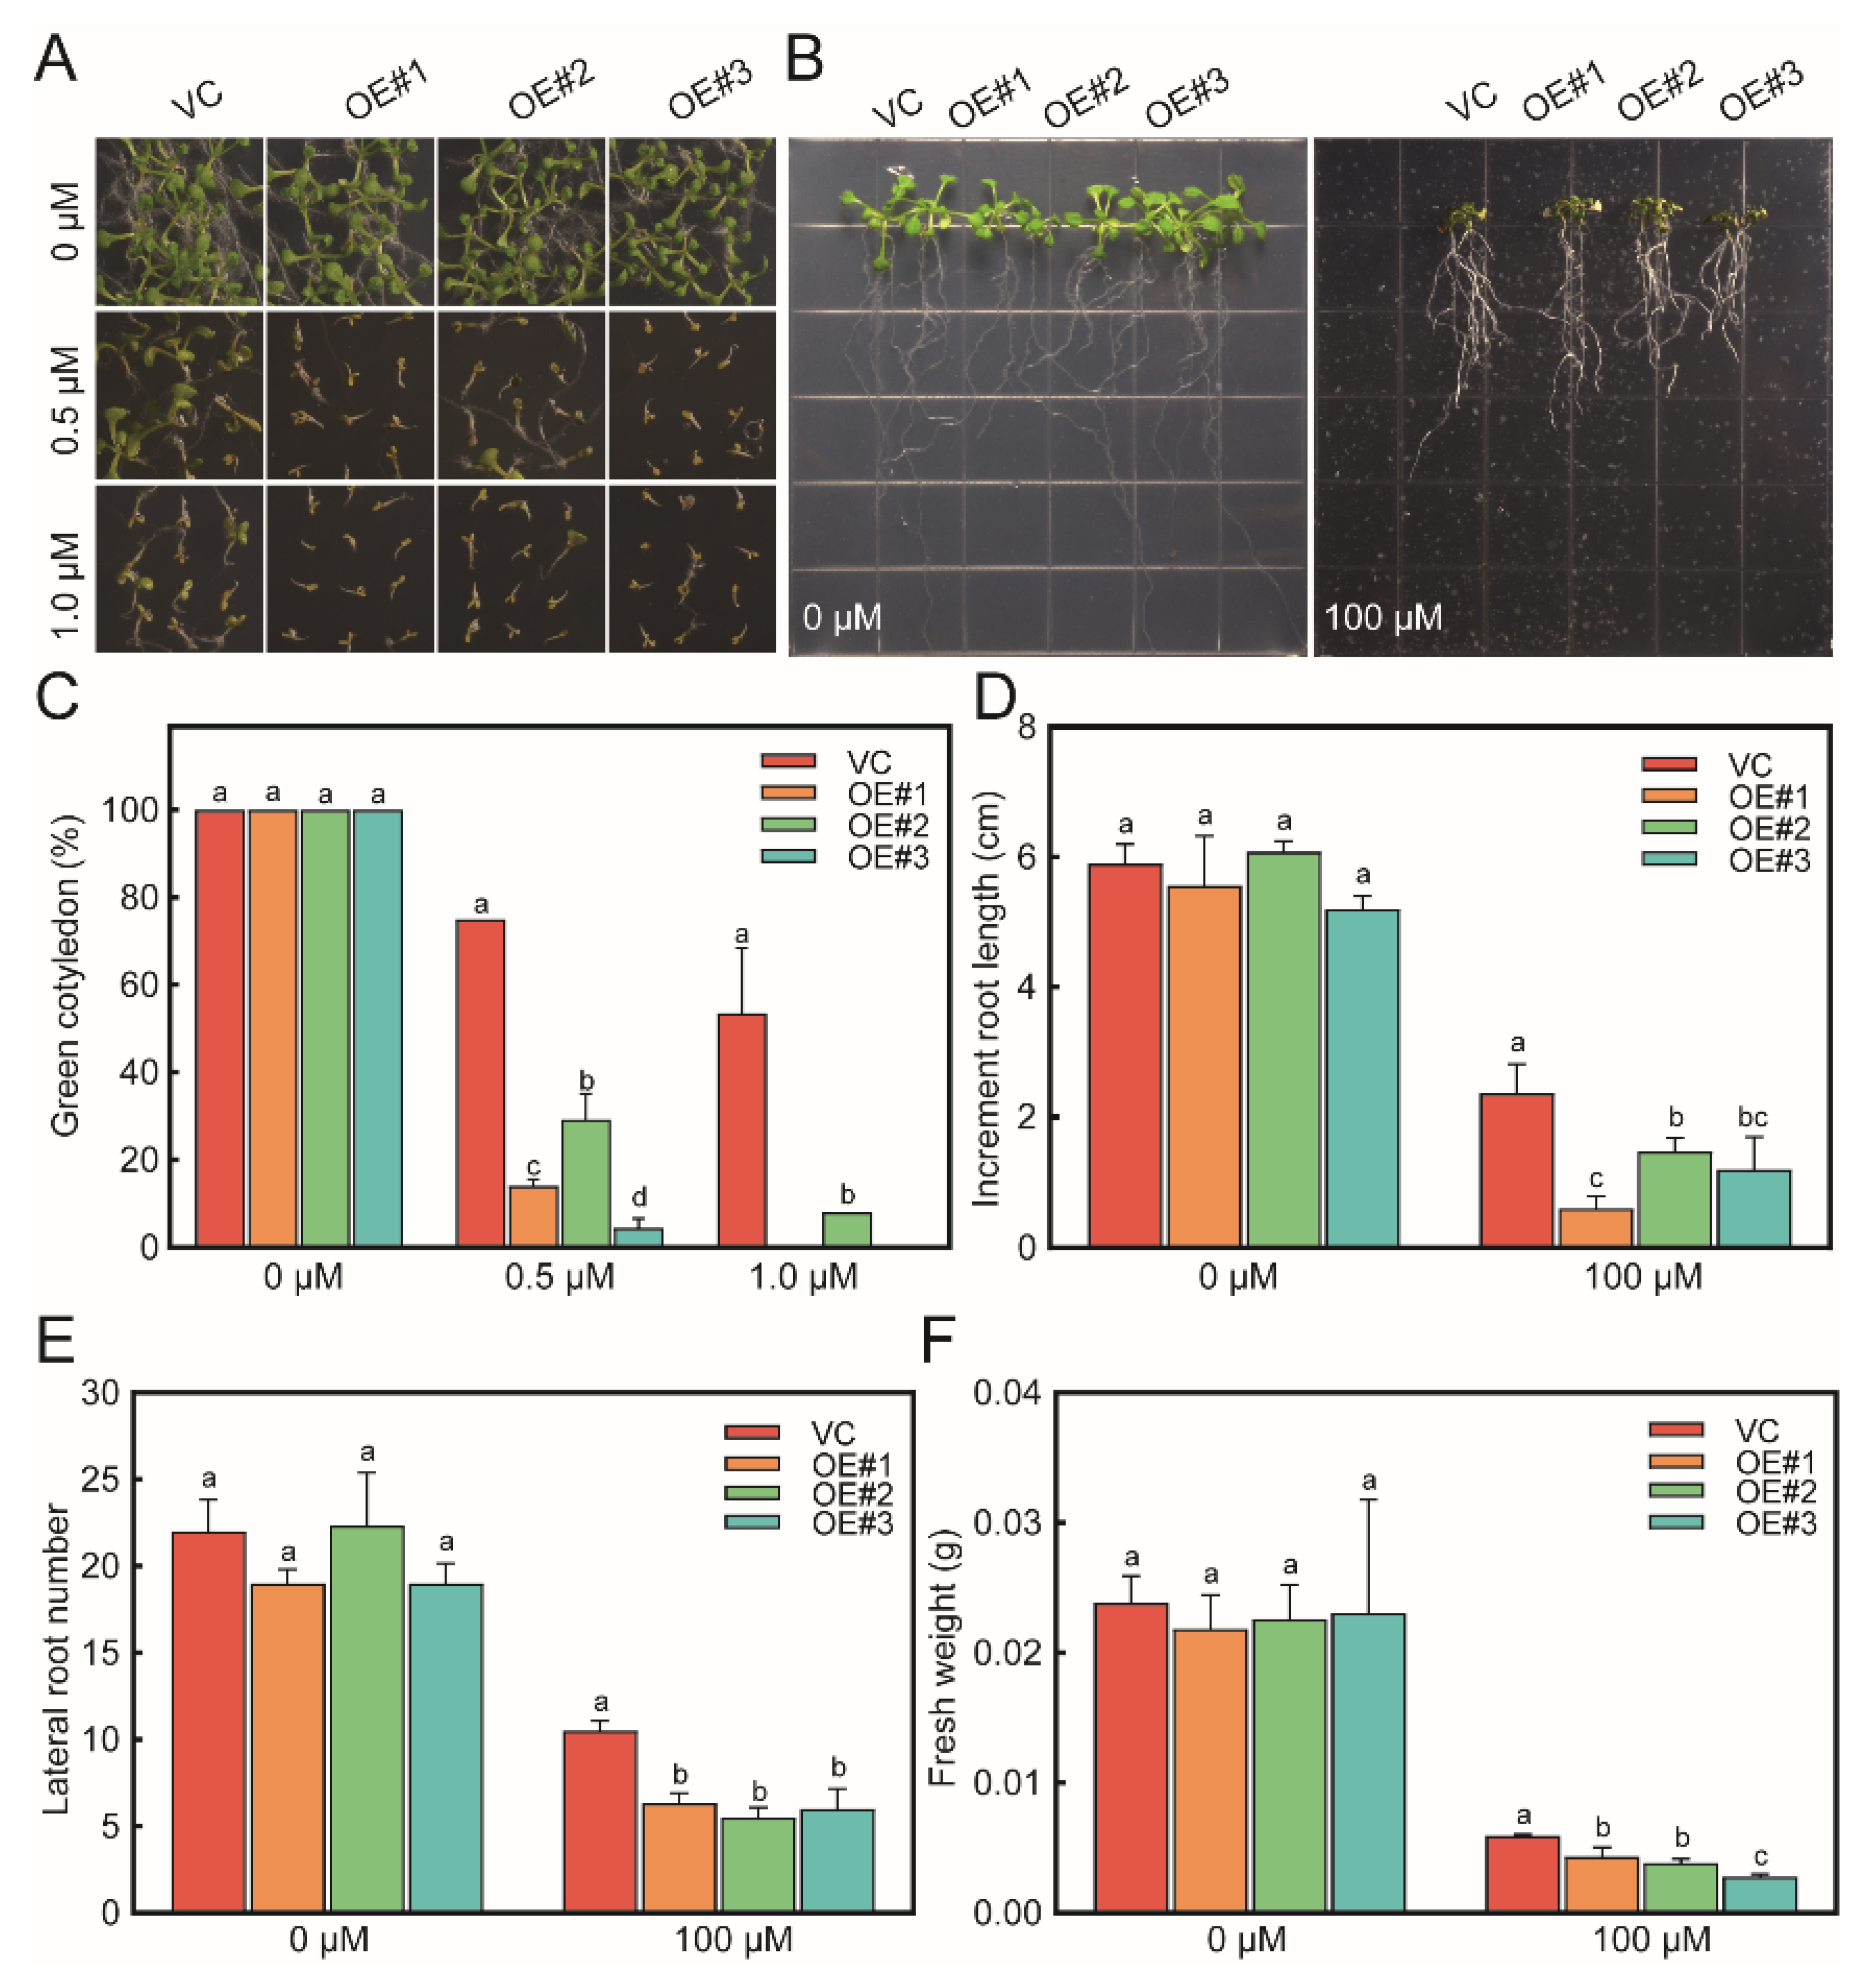
3.3. Sensitivity of RcTINY2-OE Plants to ABA Exposure

A constitutive super promoter was used to overexpress RcTINY2 in Arabidopsis. Three transgenic homozygous T3 lines (OE#1, OE#2 and OE#3) with strong expression of RcTINY2 were obtained to be used for functional analyses (Supplementary Figure S3). Both VC and RcTINY2-OE seeds were germinated on MS plates treated with either ABA (0.5 or 1.0 µM) or without ABA. In the absence of ABA, both VC and RcTINY2-OE plants displayed similar germination, increased root length, and lateral root numbers with no significant difference (Figure 3A,B). However, at ABA concentrations of 0.5 and 1.0 µM, the green cotyledon rates of RcTINY2-OE plants were lower compared to the VC plants (Figure 3C). At an ABA concentration of 100 µM, the number of lateral roots was reduced by 20%, root length increased by ~30%, and fresh weight by ~10–20% in RcTINY2-OE plants compared to the VC plants (Figure 3D–F). The combined results showed that overexpression of RcTINY2 leads to increased ABA sensitivity.

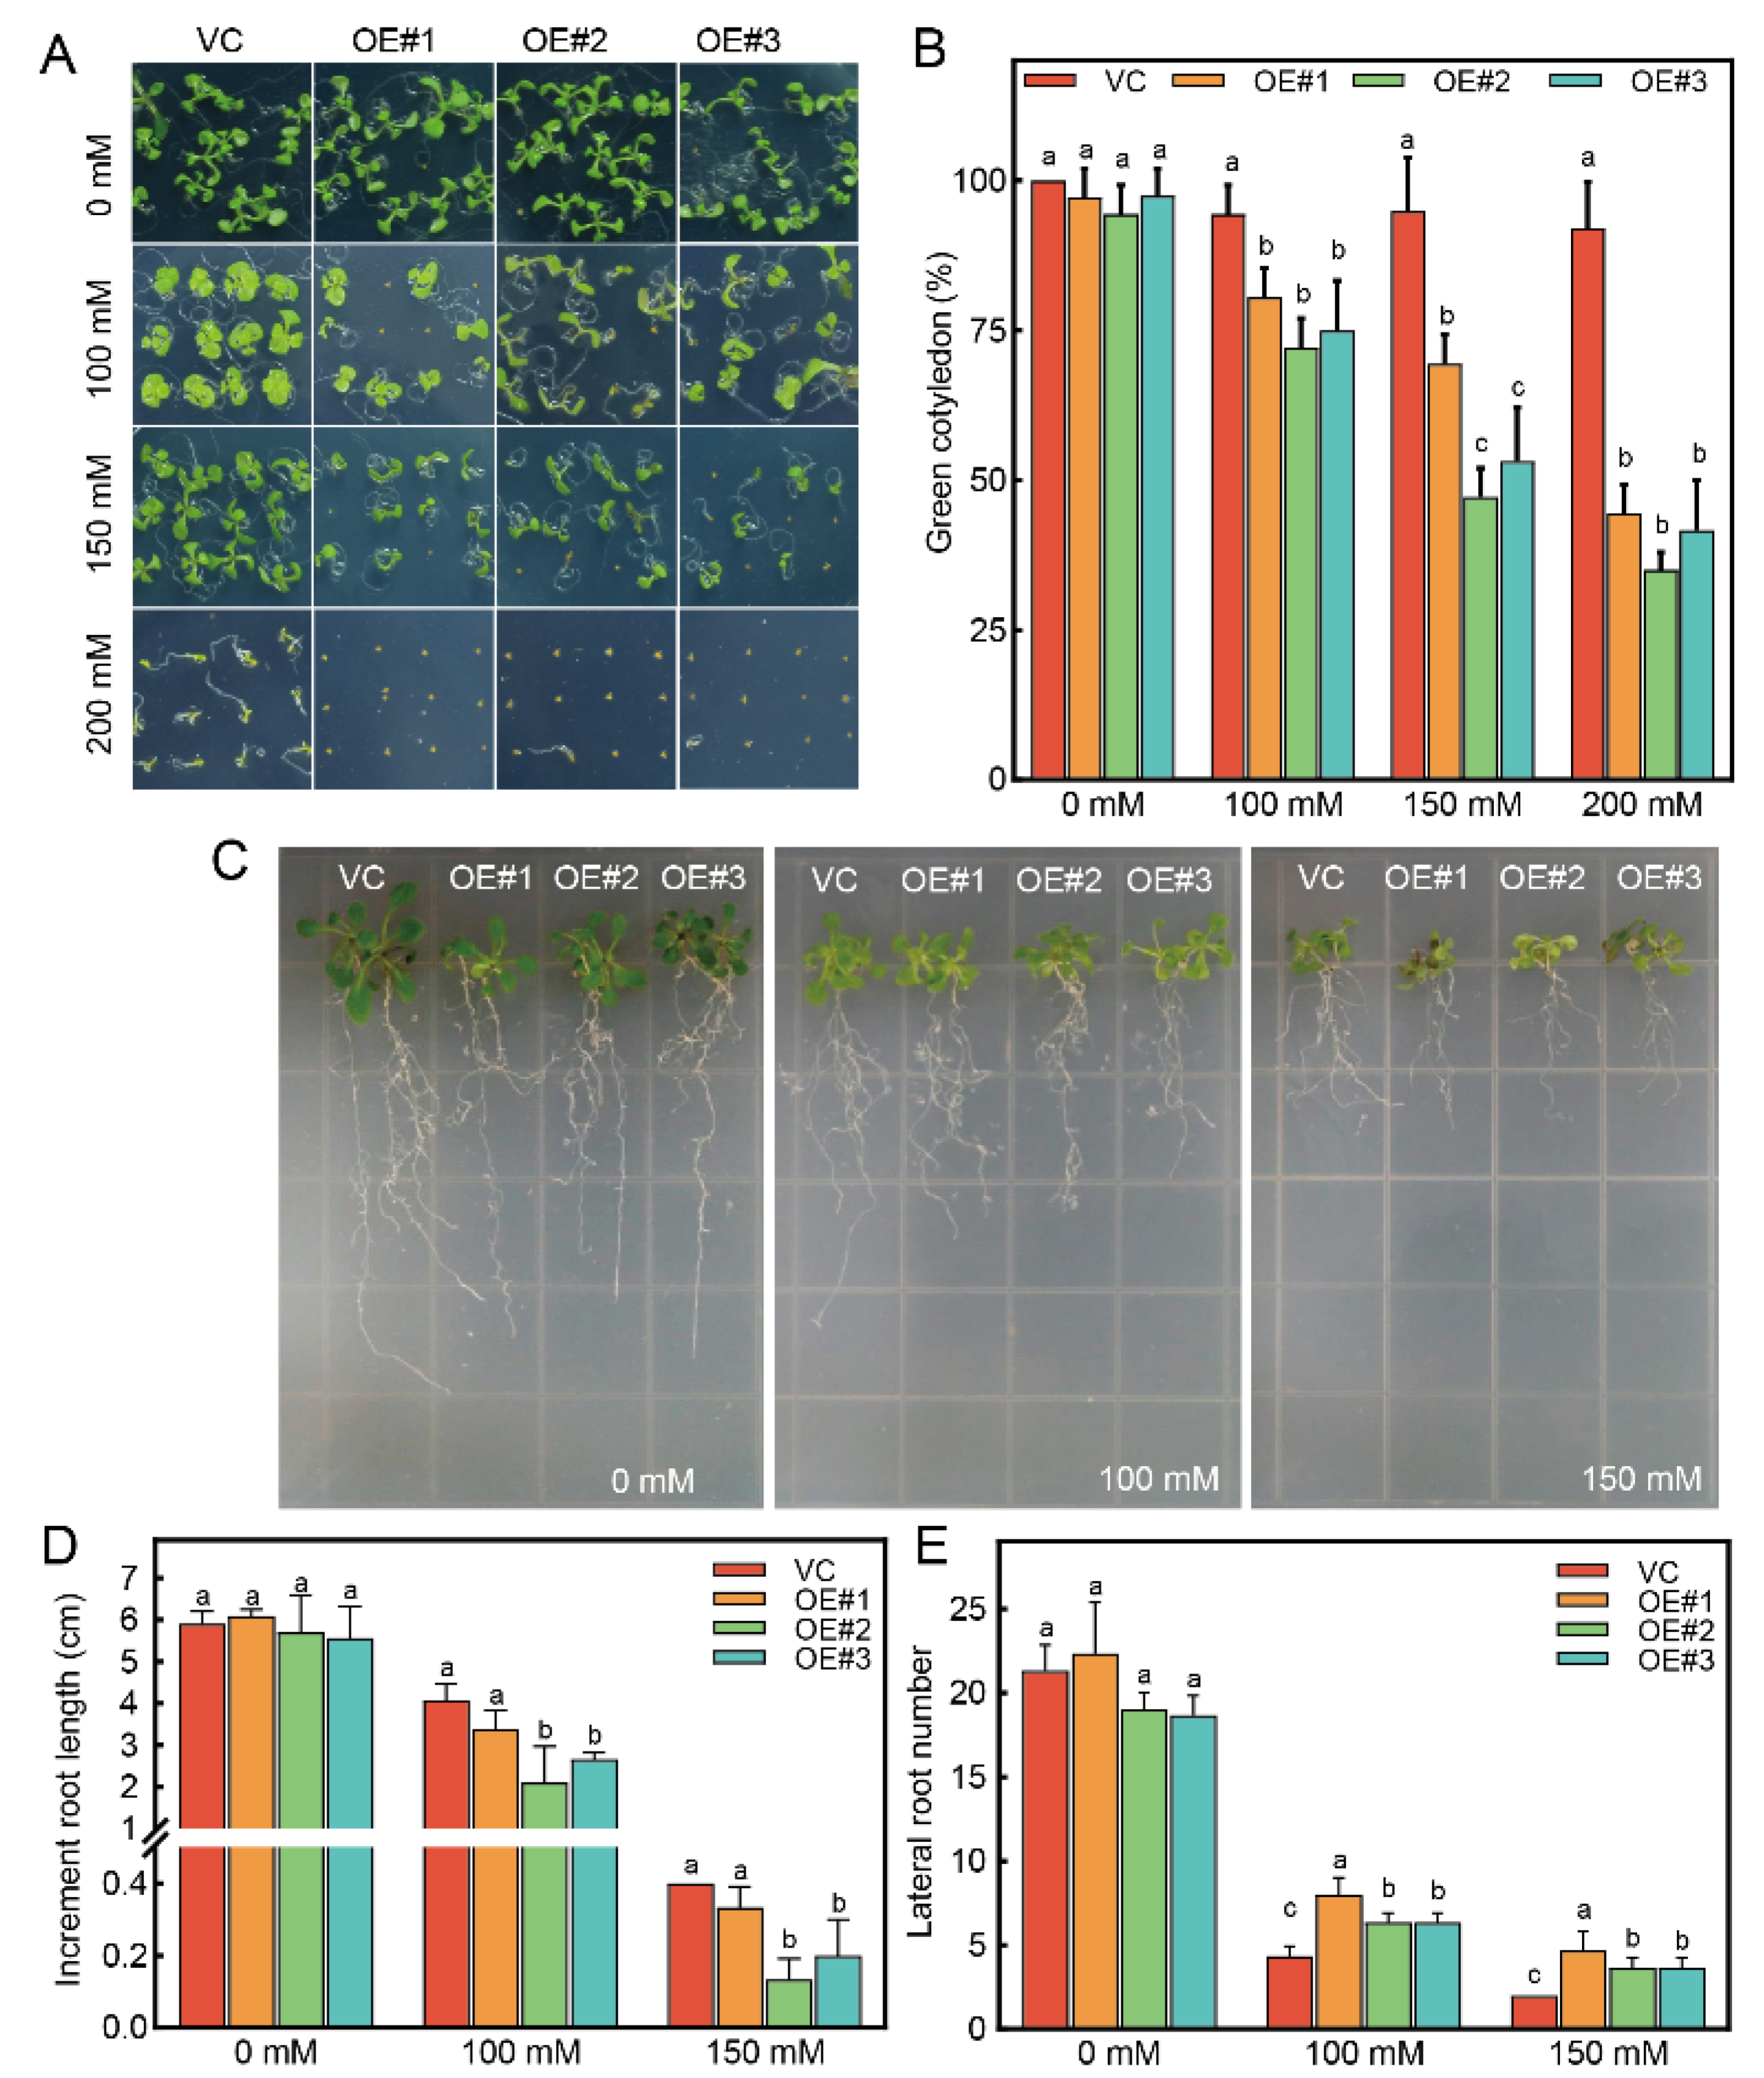
3.4. Sensitivity of RcTINY2-OE Plants to Salinity Stress

Both VC and RcTINY2-OE plants were seeded on MS medium supplemented with 0, 100, 150 and 200 mM NaCl. Clear phenotypic differences between VC and RcTINY2-OE plants were observed after ten days of growth (Figure 4A). At NaCl concentrations of 100, 150, or 200 mM, RcTINY2-OE plants displayed diminished growth performance. At a NaCl concentration of 100 mM, the green cotyledon rates of RcTINY2-OE1, RcTINY2-OE2, and RcTINY2-OE3 were 77.3, 75.9 and 79.8%, respectively, while the VC plants displayed a green cotyledon rate of 95.7%, which was significantly higher compared to RcTINY2-OEs. At NaCl concentrations of 150 or 200 mM, the VC plants continued to display significantly higher green cotyledon rates compared to RcTINY2-OEs (Figure 4B).
To assess the consequences of salt stress challenge on root growth, ten-day-old seedlings were transferred to NaCl-treated (0, 100 or 150 mM) MS media for ten days (Figure 4C). In media lacking NaCl, no significant difference was observed in either the number of lateral roots or root length increment between the VC and RcTINY2-OE plants. In media containing 100 mM NaCl, the length of VC roots increased by ~4 cm, while in RcTINY2-OE plants, it increased by ~2.1, ~2.8 and ~3.6 cm, respectively (Figure 4D). At NaCl concentrations of 100 or 150 mM, RcTINY2-OE plants showed significantly more lateral roots compared to the VC plants (Figure 4E). The results suggested that overexpression of RcTINY2 leads to increased salt sensitivity in both germinating seeds and seedlings.

3.5. Sensitivity of RcTINY2-OE Plants to Water Stress and Accumulation of ROS

Both VC and RcTINY2-OE plants were grown in MS agar plates containing a gradient of PEG concentrations (0, 4%, 8%, 12% and 16%). At PEG concentrations of 0 and 4%, no significant differences were observed in either germination or growth between the VC and RcTINY2-OE plants (Figure 5A). However, at PEG concentrations of 8, 12 and 16%, the green cotyledon rates of RcTINY2-OE seeds decreased faster compared to the VC plants after ten days of growth. For example, at 12% PEG, the green cotyledon rates of RcTINY2-OE and VC seeds were 65–73% and 94%, respectively. At 16% PEG, the green cotyledon rates of RcTINY2-OE and VC seeds were 47–59% and 97% (Figure 5B), respectively.
Both NBT and DAB staining techniques were used to examine the accumulation of ROS under drought stress. In control treatments without PEG, no significant difference was observed between VC and RcTINY2-OE plants in neither qualitatively measured ROS accumulation nor hydrogen peroxide content. However, at 20% PEG, RcTINY2-OE plants displayed more saturated blue and brown staining, suggesting high ROS accumulation compared to the VC plants (Figure 5C). Additionally, at 20% PEG, VC plants contained 0.036 µmol/g H2O2, while the H2O2; content of RcTINY2-OE1, OE2, and OE3 plants increased to 0.115, 0.130 and 0.112 µmol/g (Figure 5D), respectively. The results demonstrated that overexpression of RcTINY2 can influence plant water status in both germinating seeds and seedlings when exposed to drought stress.

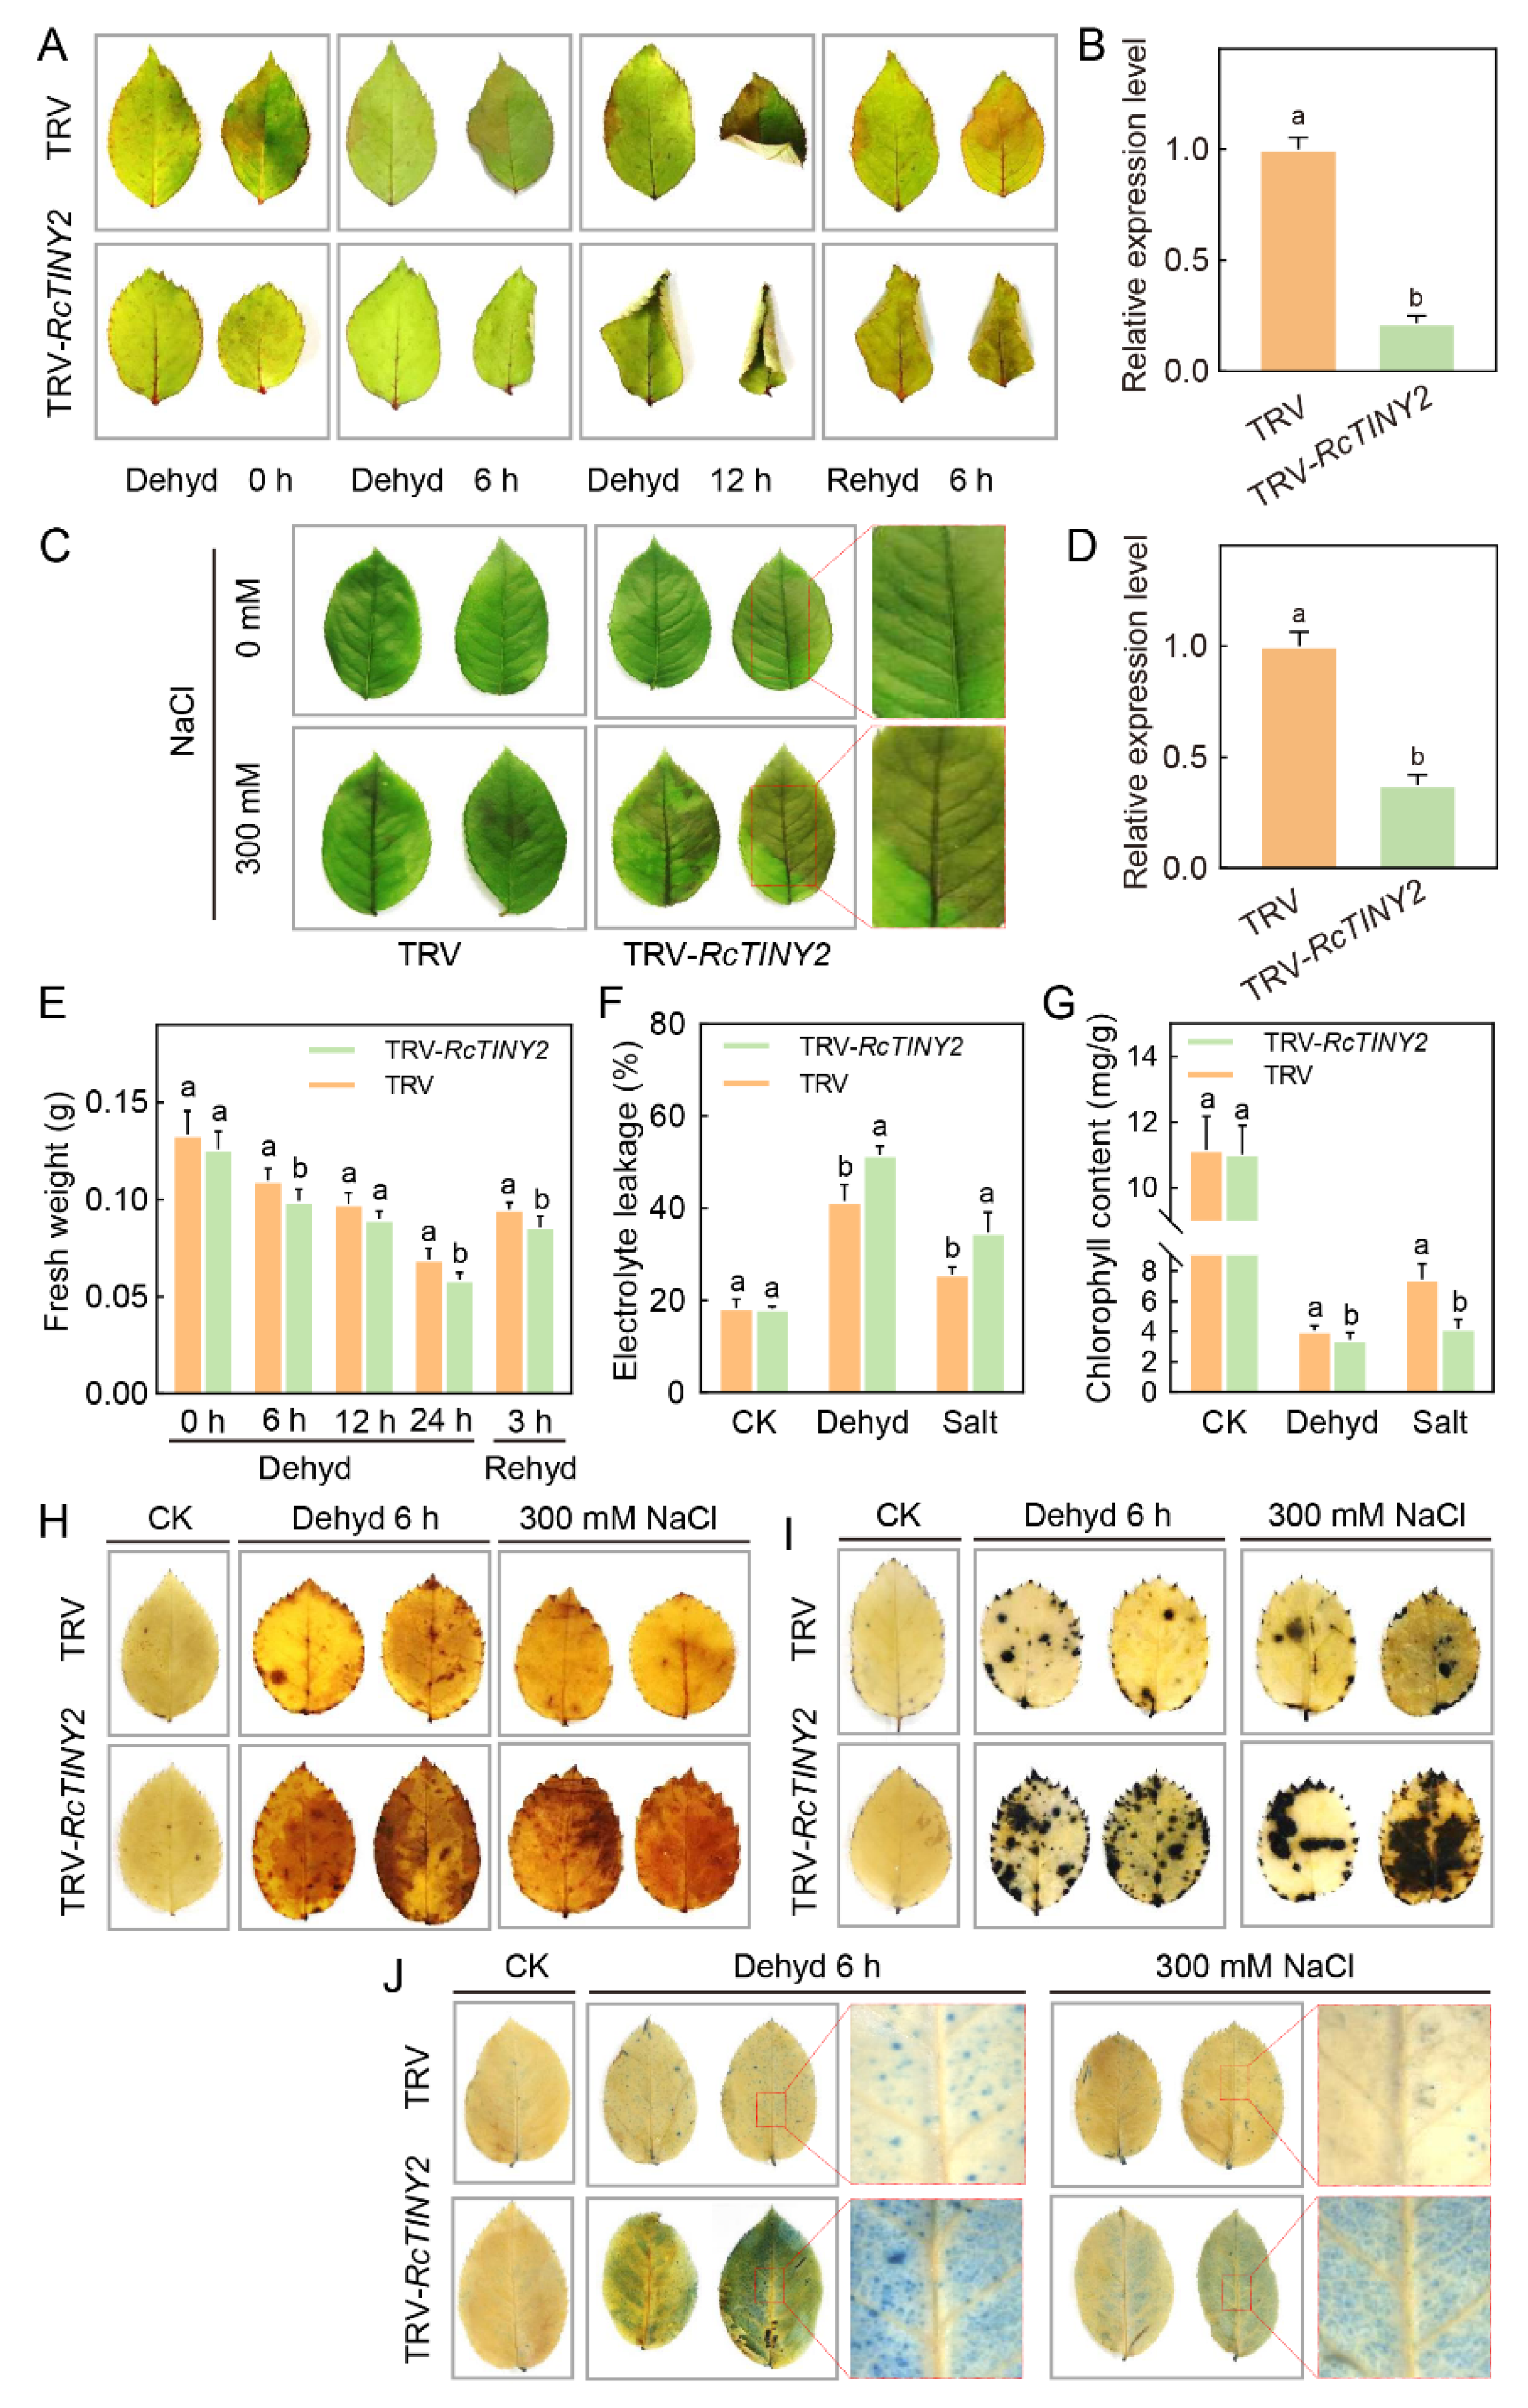
3.6. Silencing of RcTINY2 Increases Salt and Drought Sensitivity in Rose Plants

The VIGS system was used to examine the effect of RcTINY2 on both salinity and drought stress regulation in rose leaves. Under both salt- and water-stressed conditions, the expression of RcTINY2 was ~21% and ~37%, respectively, lower in TRV-RcTINY2 leaves than in TRV controls (Figure 6B,D). After either 6 or 12 h of dehydration, RcTINY2-silenced leaves exhibited severe shrinkage compared to the TRV controls (Figure 6A). Treatment with 300 mM NaCl resulted in more injury to TRV-RcTINY2 leaves than to the TRV controls (Figure 6C). In addition, the fresh weight of TRV-RcTINY2 leaves was lower compared to the TRV controls after both dehydration and rehydration (Figure 6E). TRV-RcTINY2 leaves showed more electrolytic leakage and a lower chlorophyll content compared to the TRV controls under both drought and salt stress conditions (Figure 6F,G). Both NBT and DAB staining techniques were used to examine the accumulation of ROS in rose leaves under drought and salt stress. TRV-RcTINY2 leaves displayed more saturated blue and brown staining, suggesting high ROS accumulation in the leaves compared to the TRV controls (Figure 6H,I). Trypan blue staining was performed to detect cell viability in both TRV and TRV-RcTINY2 leaves (Figure 6J). Overall, RcTINY2-silenced leaves were found to accumulate significantly higher ROS and displayed lower cell viability compared to the control.

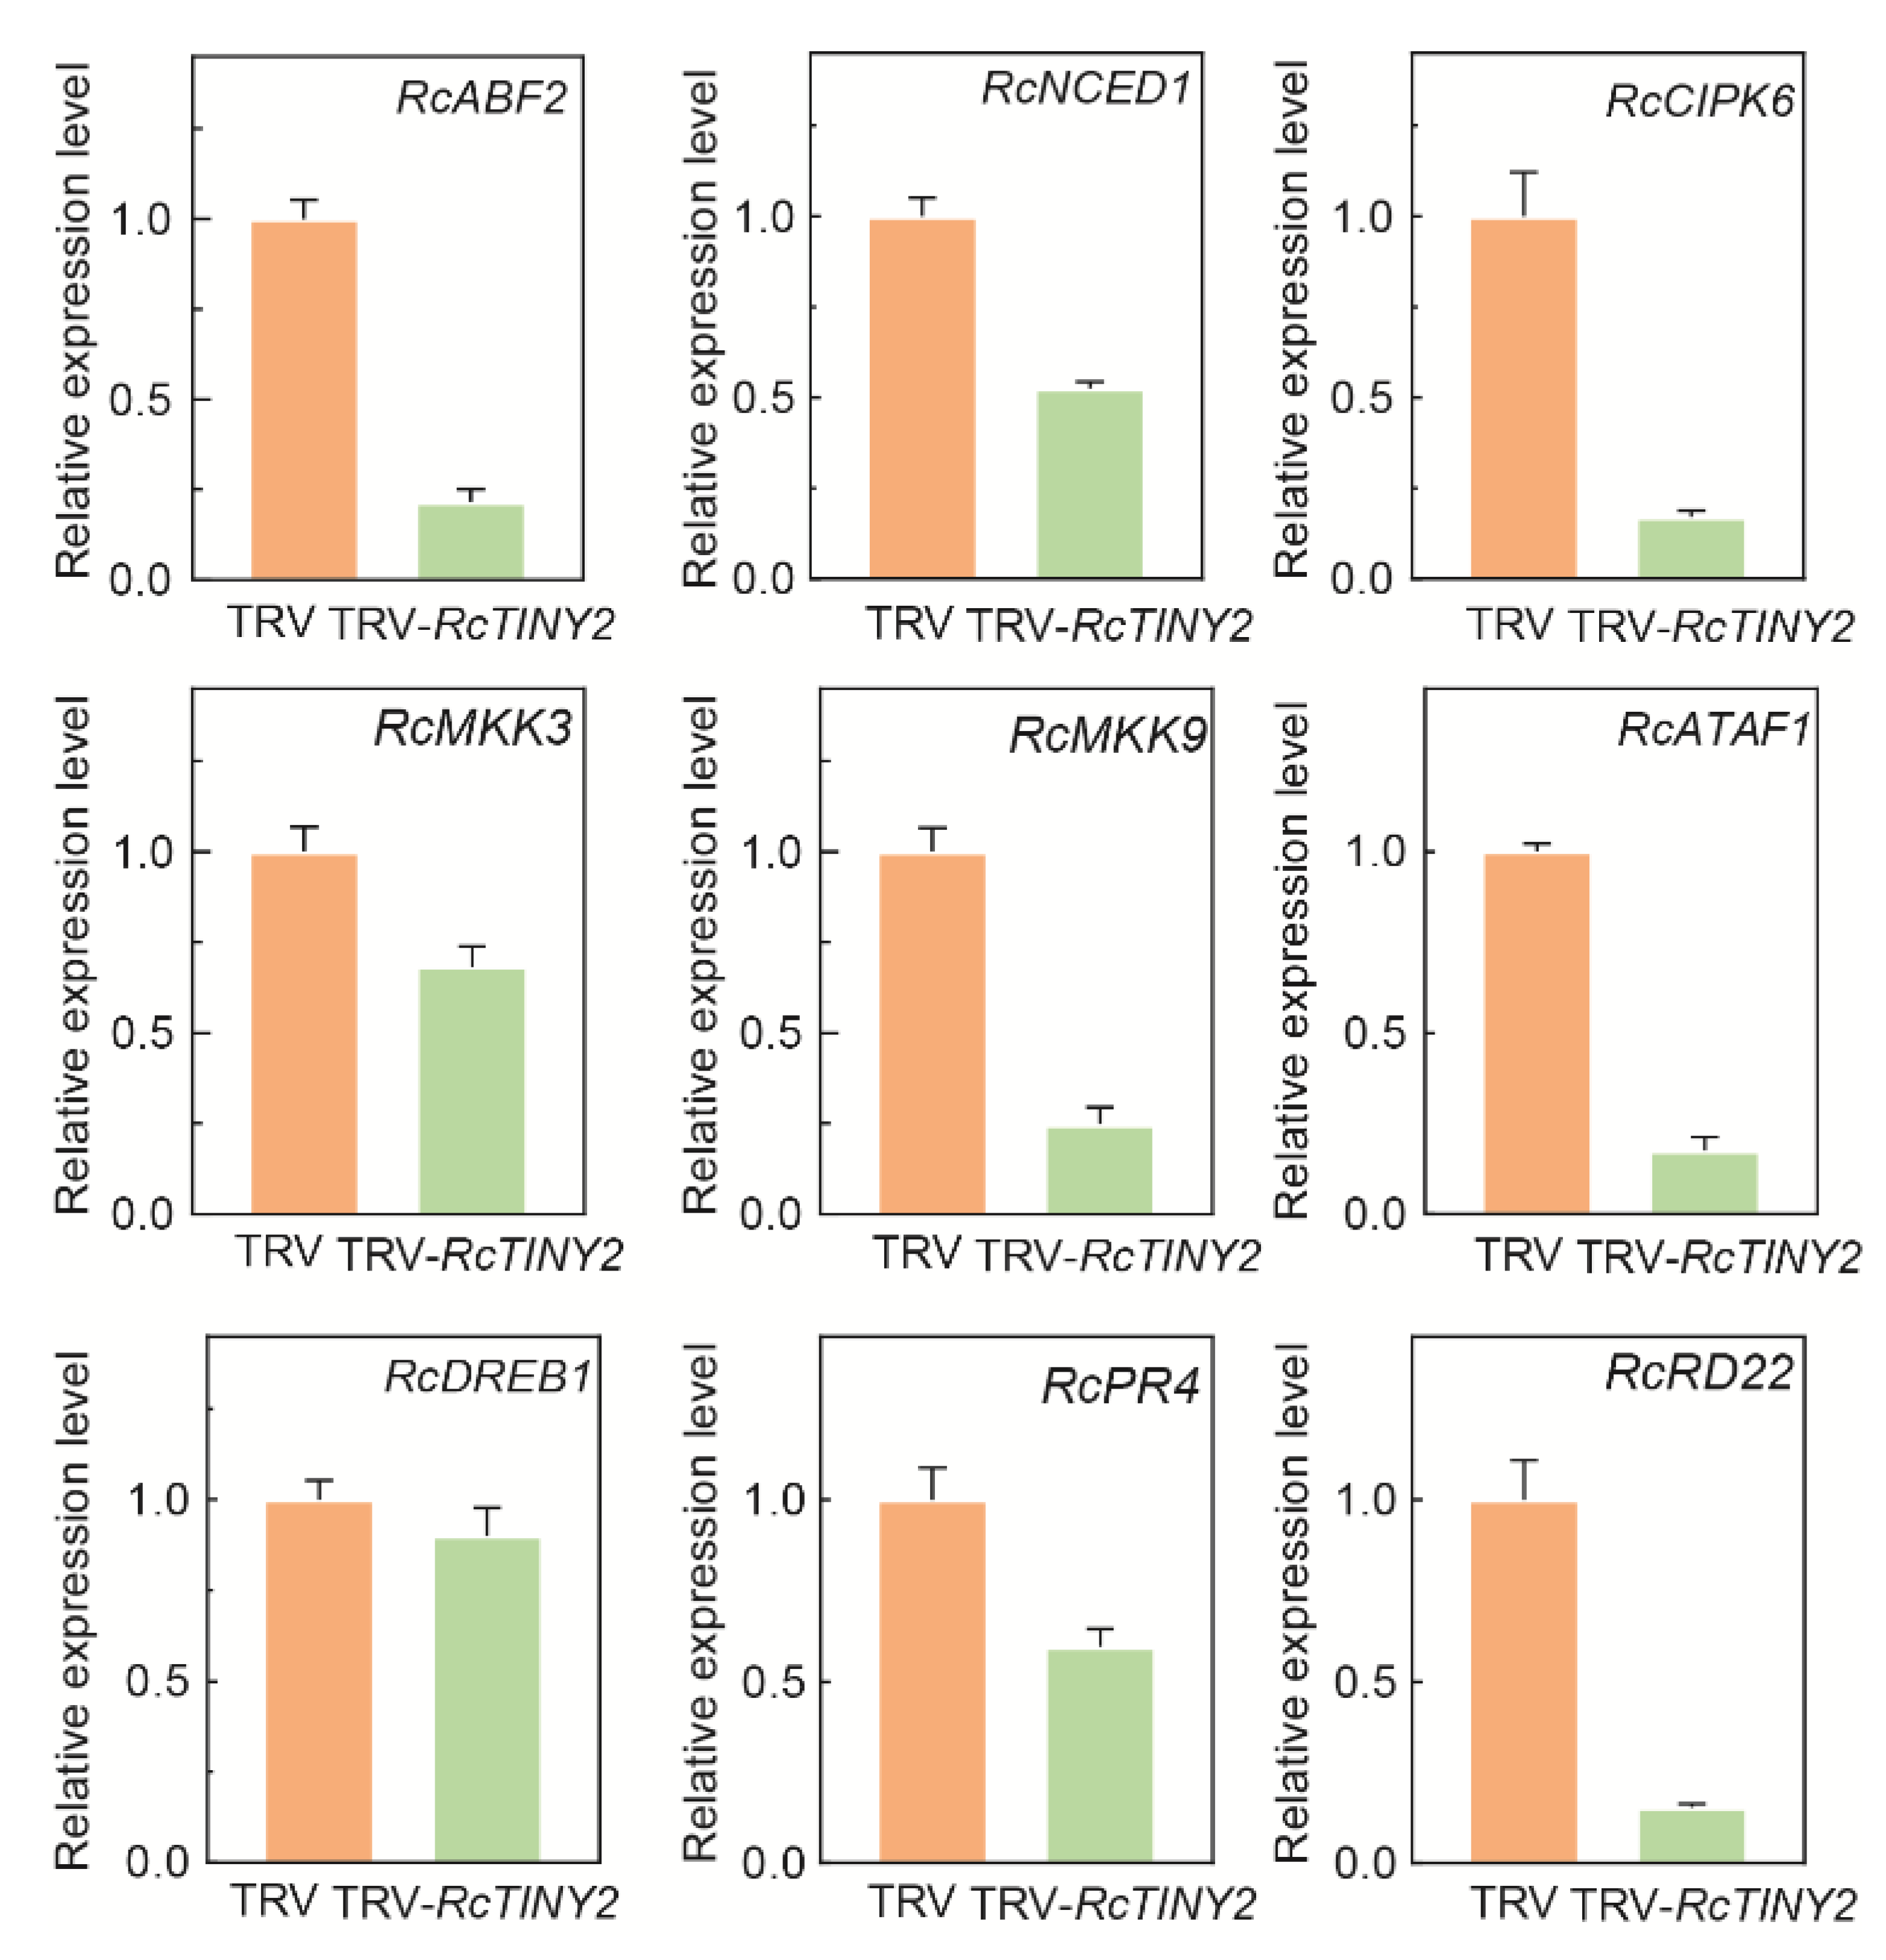
3.7. Effect of RcTINY2 on Stress-Responsive and ABA-Related Gene Expression in Rose

To determine the mechanism of the influence of RcTINY2 on abiotic stress tolerance in rose plants, the modulation of nine key genes in RcTINY2-silenced rose plants was investigated (Supplementary Table S3). The nine genes were composed of two ABA-responsive genes (RcABF2 and RcNCED1), and seven stress-responsive genes (RcCIPK6, RcMKK3, RcMKK9, RcATAF1, RcDREB1, RcPR4 and RcRD22). As shown in Figure 7, the transcript levels of the tested genes were differentially altered in TRV-RcTINY2 plants. The two ABA-responsive genes (RcABF2 and RcNCED1) showed lower transcript levels in TRV-RcTINY2 plants compared to the TRV controls. In addition to RcABF2 and RcNCED1, all genes except RcDREB1 [23] showed a similar response. The expression levels of RcRD22 [24], RcATAF1 [25] and RcCIPK6 were slightly lower in TRV-RcTINY2 plants compared to the TRV controls. Overall, RcTINY2 was found as a positive regulator of both ABA- and stress-responsive genes, resulting in reduced abiotic stress tolerance upon silencing in rose plants.

4. Discussion

In plants, the AP2/ERF regulatory network forms one of the biggest and most influential families of TFs, mainly due to its DREB subfamily which regulates a broad range of stress tolerances [26]. However, the role of DREB family members in non-model plants remains poorly understood. The present study demonstrates that RcTINY2 has a high similarity to both Arabidopsis AtTINY2 and apple MnDREB4D (Figure 1A,B). Both AtTINY2 and MnDREB4D were found responsive to salinity and drought stress [27,28], indicating that they might have similar biological functions. In addition, the RcTINY2 promoter region was found to contain multiple CREs related to stress response, especially the ABRE CRE (Figure 1C). This indicated that RcTINY2 not only plays a role in plant stress response but also participates via an ABA-responsive pathway. As expected, overexpression of RcTINY2 conferred increased sensitivity to ABA exposure, thus impairing the expression of the ABA-responsive genes (Figure 7). It was concluded that the protein RcTINY2 is involved in the ABA-dependent regulatory system to contribute to abiotic stress tolerance.
Previous studies have shown the enhancement of abiotic stress tolerance in transgenic plants when DREB subfamily members, particularly its A-2 group members, were overexpressed. For example, MbDREB1-transgenic Arabidopsis plants showed increased tolerance to drought, low temperature, and high salt conditions [29]. Also, drought tolerance in Arabidopsis was improved by using rice OsDREB1A which induced the expression of AtDREB1A [30]. Abiotic tolerance was improved through the use of wheat TaDREB2 and TaDREB3 [31], soybean GmDREB2 [10], corn (Zea mays) ZmDREB2.7 [32], and tomato (Lycopersicon esculentum) SlDREB2 [33]. Additionally, abiotic tolerance was improved through the use of DREB A-4 group members such as Arabidopsis AtTINY [34], corn ZmDBF3 [35], and potato (Solanum tuberosum) StDREB1 [36]. The results of this study demonstrated that silencing RcTINY2, a DREB A-4 group member in rose, is intolerant to dehydration and salt tolerance which were consistent with the results of previous studies. However, JcDREB2 from physic nut (Jatropha curcas) [37] caused decreased tolerance to salinity in transgenic plants, leading to leaf aging. This highlights the functional diversity of DREB A-4 group members across different plant species.
Changes in the number of lateral roots and the length of primary roots are two key indices reflective of a plant’s responses to abiotic stress [38,39]. In our study, overexpression of RcTINY2 in Arabidopsis affected root growth under abiotic stress conditions, suggesting the participation of RcTINY2 in biological processes associated with root growth. In addition, previous studies have reported that most DREB members are positive regulators of plant abiotic stress response, including GmDREB2 in soybean [10], ZmDREB2.7 in corn [32], etc. In the present study, the RcTINY2-silenced rose leaves were intolerant to dehydration stress (Figure 6), which was consistent with the results previously published on soybean GmDREB2 [10] and rice OsDREB1A [8]. On the contrary, these results are not in agreement with our analysis of overexpression of RcTINY2 in Arabidopsis, which displayed enhanced sensitivity to PEG, ABA, and NaCl exposure in both germinating seeds and seedlings. Results appear to be confusing when compared between overexpression of RcTINY2 in Arabidopsis and its transient suppression by VIGS in rose, which may be due to the different genetic backgrounds between the annual herbaceous plant Arabidopsis and perennial wooden plant rose. Furthermore, variations in results can be explained due to the different insertion sites in heterogenous RcTINY2 of Arabidopsis or the presence of a negative regulatory domain in the protein sequence of RcTINY2 which resulted in different biological functions. AtDREB2A, a homolog of RcTINY2, exhibited decreased drought tolerance, while deletion of its central negative regulatory domain produced enhanced drought tolerance [40]. RcTINY2 may also participates in the ubiquitin-proteasome system and is ubiquitinated by E3 ubiquitin ligases, which degrade the protein to give intolerance to abiotic stress. Moreover, drought or salinity stress is a multigene trait that is usually influenced by environmental stimuli, and different indicators sometimes are inconsistent in detecting drought or salinity stress. The present study leads us to hypothesize that multi-functional genes exist in heterogeneous or homologous expression in different plant systems. The function of RcTINY2 requires further investigation.
Previous studies have found that, under abiotic stress, both ABF2 and NCED1 perform as key regulators of the ABA signaling cascade and ABA biosynthesis (Figure 7). In this study, the transcript levels of two ABA-related genes (RcABF2 and RcNCED1) were found lower in TRV-RcTINY2 plants compared to the control plants, suggesting that RcTINY2 may affect ABA signal transduction. The Ca2+-indued CIPK (Calcineurin B-like calcium sensor interacting Protein Kinase) cascade is particularly important for effective response to abiotic stress challenges in plants [41] and CIPK proteins as a key protein family in Ca2+-mediated signaling. Furthermore, ROS, produced in large quantities under abiotic stress, act as signal transmitters in the CIPK cascade [42]. RcCIPK6 transcript levels were found lower in RcTINY2-silenced leaves, demonstrating that RcTINY2 is involved in the CIPK signaling system. The MAPK (Mitogen-Activated Protein Kinase) cascade and its components such as MKK (MAP Kinase Kinase) are also heavily linked to plant responsiveness to abiotic stress, by transmitting stress signals and activating downstream signaling pathways and gene expression [43]. In cotton, MKK3 was found as a positive regulator of the abiotic stress response, being induced by both ABA exposure and water stress [44]. In Arabidopsis, MKK4 overexpression conferred increased salinity tolerance [45]. In our study, the expression levels of RcCIPK6 and two MKK genes (RcMKK3 and RcMKK9) in rose were found suppressed to a certain extent after silencing RcTINY2, suggesting that RcTINY2 may be involved in the regulation of the CIPK or MAPK cascade pathways. These findings indicated that RcTINY2 may be involved in the regulation of stress and ABA-related gene expression. However, further investigation is required to find whether RcTINY2 can bind directly to its target genes.

5. Conclusions

A novel AP2/ERF DREB A-4 group TF, RcTINY2, was identified and characterized in rose. The outcomes of this study suggested that RcTINY2 may mediate multiple functions and confers abiotic stresses through the ABA pathway. To fully understand RcTINY2-mediated transduction, the direct upstream or downstream target genes of RcTINY2 and their interplay in signaling pathways require to be investigated further. The current study improves available knowledge in both general function and the specific mechanism of AP2/ERF DREB family members and, more specifically, the A-4 group member RcTINY2, in plant abiotic stress tolerance.

Supplementary Materials

The following supporting information can be downloaded at: https://www.mdpi.com/article/10.3390/horticulturae8080747/s1, Supplementary Figure S1. Schematic representation of constructs used in yeast transactivation system. Supplementary Figure S2. Schematic representation of constructs used in overexpression in Arabidopsis. Supplementary Figure S3. RT-qPCR was used to detect the overexpression efficiency of RcTINY2 transgenic lines. Supplemental Table S1. Primer sequence used in this study. Supplemental Table S2. Cis-regulatory element prediction of RcTINY2. Supplemental Table S3. ABA and stress-related genes information. Reference [46] is cited in the supplementary materials.

Author Contributions

Conceptualization, X.J. and Z.G.; methodology, L.G.; software, L.F.; validation, Y.Z., formal analysis, Y.W.; investigation, L.G.; resources, X.J.; data curation, L.S., S.L. and S.Y.; writing—original draft preparation, L.G.; writing—review and editing, X.J. and C.C.; visualization, L.F.; supervision, C.C.; project administration, Q.L., X.J. and C.C.; funding acquisition, X.J. and C.C. All authors have read and agreed to the published version of the manuscript.

Funding

This research was funded by the National Key Research and Development Program of China (No. 2018YFD1000400) and National Natural Science Foundation of China (Grant No. 31902056).

Institutional Review Board Statement

Not applicable.

Informed Consent Statement

Not applicable.

Data Availability Statement

Data are contained within the article.

Conflicts of Interest

The authors declare no conflict of interest.

References

  1. Shomali, A.; Aliniaeifard, S. Salt and Drought Stress Tolerance in Plants; Springer: Cham, Switzerland, 2020; pp. 231–258. [Google Scholar]
  2. Hang, Q.; Chen, J.; Li, L.; Zhao, M.; Zhang, M.; Wang, Y. Research progress on plant AP2/ERF transcription factor family. Biotechnol. Bull. 2018, 34, 7–13. [Google Scholar]
  3. Xiong, H.; Li, J.; Liu, P.; Duan, J.; Zhao, Y.; Guo, X.; Li, Y.; Zhang, H.; Ali, J.; Li, Z. Overexpression of OsMYB48-1, a novel MYB-related transcription factor, enhances drought and salinity tolerance in rice. PLoS ONE 2014, 9, e92913. [Google Scholar] [CrossRef] [PubMed]
  4. Guo, Y.; Huang, R.; Duan, L.; Wang, J. The APETALA2/ethylene-responsive factor transcription factor OsDERF2 negatively modulates drought stress in rice by repressing abscisic acid responsive genes. J. Agric. Sci. 2017, 155, 966–977. [Google Scholar] [CrossRef]
  5. Li, W.; Geng, Z.; Zhang, C.; Wang, K.; Jiang, X. Whole-genome characterization of Rosa chinensis AP2/ERF transcription factors and analysis of negative regulator RcDREB2B in Arabidopsis. BMC Genom. 2021, 22, 90. [Google Scholar] [CrossRef]
  6. Sakuma, Y.; Liu, Q.; Dubouzet, J.G.; Abea, H.; Shinozaki, K.; Yamaguchi-Shinozaki, K. DNA-binding specificity of the ERF/AP2 domain of Arabidopsis DREBs, transcription factors involved in dehydration- and cold-inducible gene expression. Biochem. Bioph. Res. Commun. 2002, 290, 998–1009. [Google Scholar] [CrossRef] [PubMed]
  7. Chen, J.; Xia, X.; Yin, W. Expression profiling and functional characterization of a DREB2-type gene from Populus euphratica. Biochem. Biophys. Res. Commun. 2009, 378, 483–487. [Google Scholar] [CrossRef]
  8. Dubouzet, J.G.; Sakuma, Y.; Ito, Y.; Kasuga, M.; Dubouzet, E.G.; Miura, S.; Seki, M.; Shinozaki, K.; Yamaguchi-Shinozaki, K. OsDREB genes in rice, Oryza sativa L., encode transcription activators that function in drought-, high-salt- and cold-responsive gene expression. Plant J. 2003, 33, 751–763. [Google Scholar] [CrossRef]
  9. Zhang, Z.; Li, W.; Gao, X.; Xu, M.; Guo, Y. DEAR4, a member of DREB/CBF family, positively regulates leaf senescence and response to multiple stressors in Arabidopsis thaliana. Front. Plant Sci. 2020, 11, 367. [Google Scholar] [CrossRef]
  10. Chen, M.; Wang, Q.-Y.; Cheng, X.-G.; Xu, Z.-S.; Li, L.-C.; Ye, X.-G.; Xia, L.-Q.; Ma, Y.-Z. GmDREB2, a soybean dre-binding transcription factor, conferred drought and high-salt tolerance in transgenic plants. Biochem. Bioph. Res. Commun. 2007, 353, 299–305. [Google Scholar] [CrossRef]
  11. Sun, X.; Wen, C.; Xu, J.; Wang, Y.; Zhu, J.; Zhang, Y. The apple columnar gene candidate MdCoL and the AP2/ERF factor MdDREB2 positively regulate aba biosynthesis by activating the expression of MdNCED6/9. Tree Physiol. 2020, 41, 1065–1076. [Google Scholar] [CrossRef] [PubMed]
  12. Liu, L.; Zhu, K.; Yang, Y.; Wu, J.; Chen, F.; Yu, D. Molecular cloning, expression profiling and trans-activation property studies of a DREB2-like gene from chrysanthemum (Dendranthema vestitum). J. Plant Res. 2008, 121, 215–226. [Google Scholar] [CrossRef] [PubMed]
  13. Shen, Y.; Zhang, W.; He, S.; Zhang, J.; Liu, Q.; Chen, S. An EREPB/AP2-type protein in Triticum aestivum was a dre-binding transcription factor induced by cold, dehydration and ABA stress. Theor. Appl. Genet. 2003, 106, 923–930. [Google Scholar] [CrossRef] [PubMed]
  14. Huang, B.; Liu, J. Cloning and functional analysis of the novel gene GhDBP3 encoding a DRE-binding transcription factor from Gossypium hirsutum. BBA-Gene Struct. Expr. 2006, 1759, 263–269. [Google Scholar] [CrossRef]
  15. Kumar, S.; Stecher, G.; Tamura, K. MEGA7: Molecular Evolutionary Genetics Analysis Version 7.0 for Bigger Datasets. Mol. Bio. Evol. 2016, 33, 1870–1874. [Google Scholar] [CrossRef]
  16. Subramanian, B.; Gao, S.; Lercher, M.J.; Hu, S.; Chen, W.H. Evolview v3: A webserver for visualization, annotation, and management of phylogenetic trees. Nucleic Acids Res. 2019, 47, W270–W275. [Google Scholar] [CrossRef] [PubMed]
  17. Jiang, X.; Zhang, C.; Lü, P.; Jiang, G.; Liu, X.; Dai, F.; Gao, J. RhNAC3, a stress-associated NAC transcription factor, has a role in dehydration tolerance through regulating osmotic stress-related genes in rose petals. Plant Biotechnol. J. 2014, 12, 38–48. [Google Scholar] [CrossRef]
  18. Zhang, X.; Henriques, R.; Lin, S.-S.; Niu, Q.-W.; Chua, N.-H. Agrobacterium-mediated transformation of Arabidopsis thaliana using the floral dip method. Nat. Protoc. 2006, 1, 641–646. [Google Scholar] [CrossRef] [PubMed]
  19. Livak, K.J.; Schmittgen, D.T. Analysis of relative gene expression data using real-time quantitative PCR and the 2 −ΔΔCT method. Methods 2001, 25, 402–408. [Google Scholar] [CrossRef]
  20. Shi, J.; Fu, X.; Peng, T.; Huang, X.; Fan, Q.; Liu, J. Spermine pretreatment confers dehydration tolerance of citrus in vitro plants via modulation of antioxidative capacity and stomatal response. Tree Physiol. 2010, 7, 914–922. [Google Scholar] [CrossRef]
  21. Su, L.; Zhao, X.; Geng, L.; Fu, L.; Lu, Y.; Liu, Q.; Jiang, X. Analysis of the thaumatin-like genes of Rosa chinensis and functional analysis of the role of RcTLP6 in salt stress tolerance. Planta 2021, 254, 118. [Google Scholar] [CrossRef]
  22. Li, H.S. Experimental principles and techniques of plant physiology and biochemistry. High. Educ. Press 2000, 2000, 105–108. [Google Scholar]
  23. Wang, T.; Zheng, T.; Nan, M. Isolation and expression analysis of Rh-DREB1s gene in cut roses (Rosa hybrida) under ethylene treatment and water deficit stress. Acta Hortic. Sin. 2009, 36, 65–72. [Google Scholar]
  24. Fu, L.; Zhang, Z.; Wang, H.; Zhao, X.; Su, L.; Geng, L.; Lu, Y.; Tong, B.; Liu, Q.; Jiang, X. Genome-wide analysis of BURP genes and identification of a BURP-V gene RcBURP4 in Rosa chienesis. Plant Cell Rep. 2021, 41, 395–413. [Google Scholar] [CrossRef]
  25. Geng, L.; Su, L.; Fu, L.; Lin, S.; Zhang, J.; Liu, Q.; Jiang, X. Genome-wide analysis of the rose (Rosa chinensis) NAC family and characterization of RcNAC091. Plant Mol. Biol. 2022, 108, 605–619. [Google Scholar] [CrossRef]
  26. Hu, Y.; Chen, X.; Shen, X. Regulatory network established by transcription factors transmits drought stress signals in plant. Stress Biol. 2022, 2, 26. [Google Scholar] [CrossRef]
  27. Wei, G.; Pan, Y.; Lei, J.; Zhu, Y.X. Molecular cloning, phylogenetic analysis, expressional profiling and in vitro studies of TINY2 from Arabidopsis thaliana. J. Biochem. Mol. Biol. 2005, 38, 440–446. [Google Scholar] [CrossRef]
  28. Liu, X.Q.; Zhu, J.J.; Wei, C.J.; Guo, Q.; Bian, C.K.; Xiang, Z.K.; Zhao, A.C. Genome-wide identification and characterization of the DREB transcription factor gene family in mulberry. Biol. Plant 2015, 59, 253–265. [Google Scholar] [CrossRef]
  29. Yang, W.; Liu, X.-D.; Chi, X.-J.; Wu, C.; Li, Y.-Z.; Song, L.-L.; Liu, X.-M.; Wang, Y.-F.; Wang, F.-W.; Zhang, C.; et al. Dwarf apple MbDREB1 enhances plant tolerance to low temperature, drought, and salt stress via both ABA-dependent and ABA-independent pathways. Planta 2011, 233, 219–229. [Google Scholar] [CrossRef]
  30. Herath, V. Small family, big impact: In silico analysis of DREB2 transcription factor family in rice. Computat. Biol. Chem. 2016, 65, 128–139. [Google Scholar] [CrossRef] [PubMed]
  31. Morran, S.; Eini, O.; Pyvovarenko, T.; Parent, B.; Singh, R.; Ismagul, A.; Eliby, S.; Shirley, N.; Langridge, P.; Lopato, S. Improvement of stress tolerance of wheat and barley by modulation of expression of DREB/CBF factors. Plant Biotechnol. J. 2011, 9, 230–249. [Google Scholar] [CrossRef]
  32. Liu, S.; Wang, X.; Wang, H.; Xin, H.; Yang, X.; Yan, J.; Li, J.; Tran, L.S.; Shinozaki, K.; Yamaguchi-Shinozaki, K.; et al. Genome-wide analysis of ZmDREB genes and their association with natural variation in drought tolerance at seedling stage of Zea mays L. PLoS Genet. 2013, 9, e1003790. [Google Scholar] [CrossRef] [PubMed]
  33. Hichri, I.; Muhovski, Y.; Clippe, A.; Žižková, E.; I. Dobrev, P.; Motyka, V.; Lutts, S. SlDREB2, a tomato dehydration-responsive element-binding 2 transcription factor, mediates salt stress tolerance in tomato and Arabidopsis. Plant Cell Environ. 2015, 39, 62–79. [Google Scholar] [CrossRef]
  34. Sun, S.; Yu, J.P.; Chen, F.; Zhao, T.J.; Fang, X.H.; Li, Y.Q.; Sui, S.F. TINY, a dehydration-responsive element (DRE)-binding protein-like transcription factor connecting the DRE- and ethylene-responsive element-mediated signaling pathways in Arabidopsis. J. Biol. Chem. 2008, 283, 6261–6271. [Google Scholar] [CrossRef]
  35. Zhou, W.; Jia, C.G.; Wu, X.; Hu, R.X.; Yu, G.; Zhang, X.H.; Liu, J.L.; Pan, H.Y. ZmDBF3, a novel transcription factor from maize (Zea mays L.), is involved in multiple abiotic stress tolerance. Plant Mol. Biol. Rep. 2016, 34, 353–364. [Google Scholar] [CrossRef]
  36. Bouaziz, D.; Jbir, R.; Charfeddine, S.; Saidi, M.N.; Gargouri, R. The StDREB1 transcription factor is involved in oxidative stress response and enhances tolerance to salt stress. Plant Cell Tiss. Org. 2015, 121, 237–248. [Google Scholar] [CrossRef]
  37. Tang, Y.; Liu, K.; Zhang, J.; Li, X.; Xu, K.; Zhang, Y.; Qi, J.; Yu, D.; Wang, J.; Li, C. JcDREB2, a physic nut AP2/ERF gene, alters plant growth and salinity stress responses in transgenic rice. Front. Plant Sci. 2017, 8, e0131599. [Google Scholar] [CrossRef]
  38. Qin, F.; Sakuma, Y.; Li, J.; Liu, Q.; Li, Y.Q.; Shinozaki, K.; Yamaguchi-Shinozaki, K. Cloning and functional analysis of a novel DREB1/CBF transcription factor involved in cold-responsive gene expression in Zea mays L. Plant Cell Physiol. 2004, 45, 1042–1052. [Google Scholar] [CrossRef]
  39. Yang, Y.Q.; Dong, C.; Li, X.; Du, J.C.; Qian, M.; Sun, X.D.; Yang, Y.P. A novel Ap2/ERF transcription factor from Stipa purpurea leads to enhanced drought tolerance in Arabidopsis thaliana. Plant Cell Rep. 2016, 35, 2227–2239. [Google Scholar] [CrossRef]
  40. Sakuma, Y.; Maruyama, K.; Qin, F.; Osakabe, Y.; Shinozaki., K.; Yamaguchi-Shinozaki., K. Dual function of an Arabidopsis transcription factor DREB2A in water-stress-responsive and heat-stress-responsive gene expression. Proc. Natl. Acad. Sci. USA 2006, 103, 18822–18827. [Google Scholar] [CrossRef]
  41. Mittler, R.; Zandalinas, S.I.; Fichman, Y.; Van Breusegem, F. Reactive oxygen species signaling in plant stress responses. Nat. Rev. Mol. Cell Biol. 2022. [Google Scholar] [CrossRef]
  42. Li, R.; Zhang, G.; Wei, G. Functions and mechanisms of the CBL-CIPK signaling system in plant response to abiotic stress. Prog. Nat. Sci. 2009, 19, 667–676. [Google Scholar] [CrossRef]
  43. Lin, L.; Wu, J.; Jiang, M.; Wang, Y. Plant mitogen-activated protein kinase cascades in environmental stresses. Int. J. Mol. Sci. 2021, 3, 1543. [Google Scholar] [CrossRef]
  44. Wang, M.; Yue, H.; Feng, K.; Deng, P.; Song, W.; Nie, X. Genome-wide identification, phylogeny and expressional profiles of mitogen activated protein kinase kinase kinase (MAPKKK) gene family in bread wheat (Triticum aestivum L.). BMC Genom. 2016, 17, 668. [Google Scholar] [CrossRef]
  45. Kim, S.-H.; Woo, D.-H.; Kim, J.-M.; Lee, S.-Y.; Chung, W.S.; Moon, Y.-H. Arabidopsis MKK4 mediates osmotic-stress response via its regulation of MPK3 activity. Biochem. Bioph. Res. Commun. 2011, 412, 150–154. [Google Scholar] [CrossRef] [PubMed]
  46. Raymond, O.; Gouzy, J.; Just, J.; Badouin, H.; Verdenaud, M.; Lemainque, A.; Vergne, P.; Moja, S.; Choisne, N.; Pont, C. The Rosa genome provides new insights into the domestication of modern roses. Nat. Genet. 2018, 50, 772–777. [Google Scholar] [CrossRef]
Figure 1. Sequence and phylogenetic relationship analysis of RcTINY2. (A) Analysis of phylogenetic relationships between RcTINY2 and other plant DREB proteins. CLUSTALW, with default parameters, was used to make alignments. MEGA 7.0 software was used to perform neighbor-joining using 1000 replicates. Accession numbers used were as follows: RcTINY2, MH152410; LlDREB1G, MK574677; ZjICE2, MH746734; MdDREB2A, MD01G1158600; ScCBF1, AF370730; TaCBF1, AF376136; OsDREB1A, AF300970; ZmDREB1A, AF450481; BnCBF17, AF499034; AtDREB1C, AB007789; AtDREB1B, AB007788; AtDREB2A, AB007790; AtDREB2B, NM_111939.2; ZmDREB2A, NP_001105876; HvDRF1, AY223807; TaDREB1, DQ195068; OsDREB2A, AF300971; ZmABI4, AY125490; AtABI4, A0MES8; AtRAP2.9, NM_179009; MnDREB4D, KF678391.1; ZmDBF2, AF493799; AtRAP2.1, Q8LC30; AtTINY, Q39127; AtTINY2, AY940160.1; GhDBP1, AY174160; GmDREB2, ABB36645; AtRAP2, GAAP04063.1; GmDREBb, AAQ57226; OsDREB3, NP_001048142; ZmDBF1, AAM80486; and GhDBP2, AAT39542; (B) Sequence alignment of RcTINY2 showing the N-terminal nuclear localization site: one α-helix and three β-sheets; (C) Distribution of cis-regulatory elements (CREs) related to abiotic stress tolerance in the RcTINY2 upstream 2000 bp region. ABRE: ABA responsiveness. ARE: anaerobic acclimation. MYB and MYC: both ABA responsiveness and drought stress response. STRE: responsiveness to multiple environmental stressors.
Horticulturae 08 00747 g001
Figure 2. Gene expression, transcriptional activation, and subcellular localization of RcTINY2. (A) Level of expression of RcTINY2 in rose leaves and roots under different treatments. The gene RcUBI2 was used to normalize relative expression levels (n = 3). Statistically significant differences compared to the control are indicated by lettered columns (LSD test, p < 0.05); (B) In Arabidopsis root cells, RcTINY2 showed nuclear localization. High-resolution laser confocal microscopy set at 488 nm excitation was used to visualize GFP. Bar = 20 µm. The white triangle indicates the position of the nucleus; (C) RcTINY2 transcriptional activation assay using pGBKT7-RcTINY2-transformed yeast cells. Negative control consisted of cells containing only the pGBKT7 vector. As each panel shows, the α-galactosidase activity assay was performed on yeasts transformed with the noted constructs and grown on either selective (SD/-Trp/-His/-Ade + X-a-Gal) or nonselective (SD/-Trp) medium.
Horticulturae 08 00747 g002
Figure 3. Enhanced ABA sensitivity in RcTINY2-OE Arabidopsis. (A) Differential seed germination responses between RcTINY2-OE and VC plants grown on ABA-treated (0, 0.5 or 1.0 µM) MS agar plates. All photographs were taken ten days after transplantation onto plates; (B) Phenotypic differences in root growth between RcTINY2-OE and VC plants under ABA treatment. Ten-day-old VC and RcTINY2-OE plants were transformed to ABA-treated (0 or 100 µM) MS media and grown vertically for ten days and photographed; (C) Green cotyledon rates between RcTINY2-OE and VC seeds in response to ABA seven days after treatment; (D) Increased root length, (E) Lateral root number, and (F) Fresh weights of ten-day-old RcTINY2-OE and VC plants subjected to ABA treatment (0 or 100 µM). All data are the mean ± SD for three biological replicates (n = 5). LSD tests were used to determine statistically significant differences (p < 0.05) which are indicated by different letters.
Horticulturae 08 00747 g003
Figure 4. Salt stress response of RcTINY2-OE Arabidopsis plants. (A) Differential seed germination responses between RcTINY2-OE and VC plants on NaCl-treated (0, 100, 150 and 200 mM) MS agar plates; (B) Green cotyledon rates of VC and RcTINY2-OE seeds seven days after NaCl treatment; (C) Phenotypic difference in root growth between RcTINY2-OE and VC plants in response to NaCl; (D) Root growth increment and (E) Number of lateral roots in RcTINY2-OEs and VC plants under salinity stress. Ten-day-old VC and RcTINY2-OE seedlings were transferred to NaCl-treated (0, 100 or 150 mM) MS media and grown for ten days. All data are the mean ± standard deviation (SD) for three biological replicates. LSD tests were used to determine statistically significant differences (p < 0.05) which are indicated by different letters.
Horticulturae 08 00747 g004
Figure 5. Response of RcTINY2-OE Arabidopsis plants to drought stress. (A) Differential seed germination response between RcTINY2-OE and VC plants on PEG-treated (0, 4%, 8%, 12% and 16%) MS agar plates. All photographs were taken ten days after germination; (B) Green cotyledon rates of VC and RcTINY2-OEs in response to PEG treatment. All data are the mean ± SD from five independently conducted experiments (n = 16–20); (C) Ten-day-old VC and RcTINY2-OE seedlings were stained with DAB (1 mg/mL) and NBT (1 mg/mL) for 12 h after PEG treatment for 30 min; (D) Accumulation of H2O2; in VC and RcTINY2-OE plants after 30 min of PEG treatment. All data are the mean ± SD for three biological replicates. LSD tests were used to determine statistically significant differences (p < 0.05) which are indicated by different letters.
Horticulturae 08 00747 g005
Figure 6. Decreased dehydration and salt stress in RcTINY2-silenced rose leaves. (A) Phenotypes of TRV and TRV-RcTINY2 leaves after dehydration and rehydration; (B) Relative expression levels of RcTINY2 in TRV and TRV-RcTINY2 under dehydration stress; (C) Phenotypes of TRV and TRV-RcTINY2 leaves under salinity stress; (D) Relative expression levels of RcTINY2 in TRV and TRV-RcTINY2 under salinity stress; (E) Fresh weight of TRV and TRV-RcTINY2 leaves after dehydration and rehydration; (F) Electrolytic leakage and (G) chlorophyll content of TRV and TRV-RcTINY2 leaves under dehydration and salt stress; All data are the mean ± SD for three biological replicates. LSD tests were used to determine statistically significant differences (p < 0.05) which are indicated by different letters. (H) DAB, (I) NBT, and (J) trypan blue staining of TRV and TRV-RcTINY2 leaves under dehydration and salt stress.
Horticulturae 08 00747 g006
Figure 7. RT-qPCR analysis of genes in the leaves of TRV and TRV-RcTINY2 rose plants. RT-qPCR was used to investigate the transcriptional expression of nine genes (RcABF2, RcNCED1, RcCIPK6, RcMKK3, RcMKK9, RcATAF1, RcDREB1, RcPR4 and RcRD22) in TRV and TRV-RcTINY2 rose plants. An internal control gene, RcUBI2, was used to normalize the relative expression of each gene of interest. All data are the mean ± SD for three independent experiments.
Horticulturae 08 00747 g007
Publisher’s Note: MDPI stays neutral with regard to jurisdictional claims in published maps and institutional affiliations.

