Article

Identification of Genes of Molecular Marker TGS0892 on Chromosome 6 and Its Mechanism of Soluble Solids Metabolism in Tomato

1
State Key Laboratory of Genetics and Germplasm Enhancement, Ministry of Agriculture and Rural Affairs Key Laboratory of Biology and Germplasm Enhancement of Horticultural Crops in East China, College of Horticulture, Nanjing Agricultural University, Nanjing 210095, China
2
Jiangsu Key Laboratory for Horticultural Crop Genetic Improvement, Institute of Vegetable Crops, Jiangsu Academy of Agricultural Sciences, Nanjing 210014, China
3
Horticulture Research Institute, Shanghai Academy Agricultural Sciences, Shanghai 201403, China
*
Authors to whom correspondence should be addressed.
Horticulturae 2023, 9(1), 52; https://doi.org/10.3390/horticulturae9010052
Submission received: 7 November 2022 / Revised: 13 December 2022 / Accepted: 28 December 2022 / Published: 3 January 2023
(This article belongs to the Special Issue Omics Technologies and Their Applications in Vegetable Plant Research)

Abstract

:
Tomato (Solanum lycopersicum L.) is one of the vegetables widely cultivated in the world, whose fruits are rich in nutrients. Soluble solids content (SSC) is one of the important factors affecting tomato fruit flavor and plays a decisive role in improving tomato quality. Molecular markers are genetic markers that reveal plant genetic polymorphism at the DNA level, which have the advantages of improving breeding purposes, increasing selection efficiency, and shortening breeding years. The molecular marker TGS0892 is located on chromosome 6 of the tomato genome and is closely related to soluble solids. In the present work, five different tomato cultivars were used as experimental materials. The results showed that ‘TD-10’ had the lightest single fruit weight and the highest soluble solids content, while ‘TD-8’ and ‘TD-9’ had heavier single fruit weight and lowered soluble solids content. Seventeen genes within 50 kb upstream and downstream of the molecular marker TGS0892 were identified using bioinformatics methods, and their structural analysis and functional annotation were performed. Quantitative reverse transcription PCR (RT-qPCR) showed that the expression levels of the 17 genes in different tomato cultivars were classified into two major categories, with the highest expression in ‘TD-7’ and other cultivars, respectively. Soly065970 and Soly066010 were significantly more expressed in high soluble solids tomato cultivars (‘TD-7’ and ‘TD-10’) and less expressed in the low soluble solids tomato cultivar (‘TD-9’). The results suggested that Soly065970 and Soly066010 may be involved in regulating the soluble solids metabolic process, which provides a reference for studying the formation mechanism of highly soluble solids in tomatoes.

1. Introduction

Tomato (Solanum lycopersicum L.) is an annual or perennial herb of the Lycopersicon. Tomatoes are widely grown around the world and have become one of the world’s most productive vegetables due to their unique flavor, rich nutrition, and vibrant colors [1]. Tomato fruits are rich in many nutrients, such as vitamins, flavonoids, phenolics, and carotenoids, particularly lycopene [2]. Soluble solids content (SSC) is one of the important factors affecting the flavor of tomato fruit and plays a decisive role in improving tomato quality [3]. SSC of tomato refers to the percentage of solutes in tomato juice and is mainly composed of soluble sugars, organic acids, and volatile aromatic substances. Among them, sugars mainly consist of glucose and fructose, with less sucrose; organic acids mainly consist of citric acid and malic acid, etc. [4,5]. Usually, the SSC of tomatoes can be expressed in terms of soluble sugar content [6]. Tomato SSC is a complex quantitative trait that is regulated by several genes together with additive effects, and any mutation related to the glycolic acid metabolic pathway can cause changes in its content [7]. Studies have shown that SSC is an important basis for setting quality standards for processed tomato pulp, jam, and juice and that high SSC is beneficial for increasing the yield of processed tomatoes, reducing energy consumption during processing, and increasing the flavor of fresh tomatoes [8]. Therefore, it is of great scientific importance to study the molecular regulation mechanisms of tomato SSC transport and accumulation during fruit development.
Previous studies have identified many quantitative trait locus (QTL) loci controlling SSC. However, most of the QTLs have low phenotypic variability and mostly overlap or link to loci for undesirable traits, such as light fruit weight and low yield [9]. Combining modern biotechnology, such as marker-assisted selection (MAS) breeding, with conventional breeding can overcome adverse factors, shorten breeding years, improve breeding efficiency and improve crop quality to a certain extent [10]. Molecular markers are genetic markers based on inter-individual nucleotide variation and can reveal genetic variation in plants at the DNA level [11]. SSR molecular markers are widely used in tomato breeding because of their rich polymorphism, high reproducibility, and co-dominance [12].
With the continuous improvement of tomato genome information, QTL and molecular markers related to SSC in tomato fruits have been studied more extensively. For example, Wang localized nine soluble solids QTL loci in the progeny population of wild tomato (LA0317) and common cultivated tomato (9706) as parents [13]. Using 174 tomato germplasm as materials, Zhao conducted genome-wide association analysis of the major glycolic acid components contained in the fruit and identified 139 significantly associated loci, including 38 loci significantly associated with citric acid, 5 loci significantly associated with malic acid, 4 loci significantly associated with proline, only 1 locus significantly associated with gluconic acid, and 20 loci significantly associated with succinic acid, which has important reference values for quality breeding of tomato [14]. Brix9-2-5 is an important QTL locus controlling SSC in tomato fruit and is located in tomato chromosome 9. Brix9-2-5 was subsequently localized between the molecular markers CT283A and TG10 on tomato chromosome 9, in a range of approximately 9 cM, and the locus was found not to affect the yield of tomato [15,16]. Lu analyzed BC2S6, a progeny population of Solanum cheesmaniae (LA0317) and common cultivated tomato (9706) as parents, detected three soluble solids-related QTL loci on chromosome 6, where qSS6b was positioned near the molecular marker TGS0892 [17]. Molecular markers developed based on the tomato genome provide identification methods for a large number of germplasm resources that have not been effectively identified and also provide a material basis for the effective utilization of excellent germplasm resources and the creation of new cultivars and new materials. However, studies on QTL and molecular markers related to SSC in tomato fruits are mainly focused on processed tomatoes, while fewer studies have been conducted on fresh tomatoes, mostly using wild and semi-wild species as experimental materials.
In order to further investigate the molecular markers related to SSC in tomato fruits, this study was conducted to analyze the physiological quality indicators of mature fresh tomato fruits of five different cultivars and to analyze the structure and functional annotation of the 50 kb upstream and downstream genes of the molecular marker TGS0892 by using bioinformatics. Quantitative reverse transcription PCR (RT-qPCR) was used to compare the expression levels of the above genes in different tomato cultivars, and the gene interaction network was constructed, which laid the foundation for further research on the molecular mechanism of the key gene of the molecular marker TGS0892 regulating SSC accumulation in tomato.

2. Materials and Methods

2.1. Plant Materials and Growth Conditions

Five tomato cultivars were selected as experimental materials: ‘TD-7’, ‘TD-8’, ‘TD-9’, ‘TD-10’ and ‘TD-17’. All five tomato materials were stable genetic lines bred by the Institute of Vegetable Crops, Jiangsu Academy of Agricultural Sciences, and cultivated in the artificial climate laboratory of Tomato Innovation Laboratory. The temperature was set at 25 °C (day) and 18 °C (night). The relative humidity was 60~70%, the photoperiod was light of 12 h, and the light intensity was 320 μmol·m−2·s−1. Tomato seeds were germinated with filter paper for 3 d and then sown into cavity trays. Tomato seedlings were transplanted into pots when they reached two leaves, with a nutrient soil ratio of organic substrate:vermiculite = 1:1. Good growing, intact fruits free of diseases and pests at full ripening period were selected for subsequent index determination and gene expression analysis. The collected samples were rapidly frozen in liquid nitrogen and stored at −80 °C. Three biological replicates were set up for each sampling.

2.2. Determination of Physiological and Quality Indicators

The transverse and longitudinal diameters of tomato fruit were measured by an automatic reading vernier caliper (MNT, Shanghai, China); the tomato pulp was homogenized into drops on a hand-held Abbe refractometer (ATAGO, Tokyo, Japan), and the soluble solids content was measured; measurement of single fruit weight by hand-held Abbe refractometer (ATAGO, Tokyo, Japan) with its own electronic balance; fruit hardness was measured by durometer (Aidebao, Hangzhou, China) every 120° in the middle of the fruit and repeated three times. Three biological replicates were set for each of the above index measurements.

2.3. Identification and Bioinformatics Analysis of Genes within 50 kb Upstream and Downstream of TGS0892

According to the information of the TGS0892 molecular marker (forward primer: 5′-GGTCCGTACCTCTTTTTCCC-3′; reverse primer: 5′-AGGCATAGCGGCTGAGATAGA-3′), genes within 50 kb upstream and downstream of TGS0892 were obtained at the tomato genome database Sol Genomics Network (SGN) (https://solgenomics.net/, accessed on 4 April 2022). Molecular marker TGS0892 chromosome location mapping was performed using MapChart software [18]; gene structure was determined by Gene Structure Display Server (GSDS) online website (http://gsds.cbi.pku.edu.cn/, accessed on 6 April 2022) [19]; motif analysis was performed using MEME (http://meme-suite.org/tools/meme, accessed on 6 April 2022) [20]; amino acid properties were analyzed by ExPasy online tool (https://web.expasy.org/protparam/, accessed on 1 October 2022) [20]; gene functional GO annotation was conducted on Protein Analysis Through Evolutionary Relationships (PANTHER) (http://www.pantherdb.org/, accessed on 1 October 2022) [21].

2.4. Extraction of Total RNA and Synthesis of cDNA

The total RNA of tomato was extracted according to the instructions of the polysaccharide polyphenol plant total RNA extraction kit (Proteinssci, Shanghai, China). The concentration was measured using a micro UV detector Nano-Drop. The extracted RNA samples were reverse transcribed into cDNA using HiScript II Q RT SuperMix for qPCR (+gDNA wiper) kit (Vazyme, Nanjing, China). The cDNA was diluted with sterilized ddH2O and stored at −20 °C for subsequent experiments.

2.5. Gene Expression Analysis

RT-qPCR experiments were performed according to the operating instructions of Hieff qPCR SYBR Green Master Mix (Yeason, Shanghai, China) to determine the expression levels of genes within 50 kb upstream and downstream of the molecular marker TGS0892 in tomato. Using the Tubulin (Solyc04g077020.2) gene as a reference gene [22]. The fluorescent quantitative detection primers were designed and detected by Primer Premier 5.0 software and the NCBI website, as shown in Table 1. The total RT-qPCR reaction system was 20 μL, including SYBR Premix Ex Taq enzyme 10 μL, cDNA template 2 μL, ddH2O 7.2 μL and 0.4 μL of each forward and reverse primer. The reaction procedure was: 95 °C pre-denaturation for 5 min, 95 °C denaturation for 10 s, and 60 °C annealing for 30 s, for a total of 40 cycles. Fluorescence was measured continuously during the gradual warming from 65 °C to 95 °C, and the melting curves were plotted. The relative expression of genes was calculated using the 2−ΔΔCT method [23]. Three biological replicates were set for each treatment sample. IBM SPSS Statistic 20 and WPS Excel 2019 were used to analyze the different significance levels of the obtained values. A heat map was drawn in log2 transformed expression values using TBtools software.

2.6. Gene Co-Expression Network Analysis

Pearson correlation coefficient analyses were calculated with the RT-qPCR data of tomato fruit’s full ripening period. Cytoscape software was used to complete the gene co-expression network diagrams.

3. Results

3.1. Growth Status of Different Cultivars of Mature Tomato Fruits

The phenotypes of mature fruits of five different tomato cultivars are shown in Figure 1A. The color of tomato fruits varied among the five cultivars, with ‘TD-7’ and ‘TD-10’ being yellow, ‘TD-8’ being orange-red, ‘TD-17’ being red, and ‘TD-9’ being brown. The shape of tomato fruits is slightly among the five cultivars, with ‘TD-9’ being round and the remaining four cultivars being oval. The mature fruits of ‘TD-8’ were the largest, and ‘TD-10’ was the smallest.

3.2. Physiological and Quality Indicators of Mature Tomato Fruits

The physiological and quality indicators of mature tomato fruits were measured (Figure 1B). The analysis results show that the single fruit weight of the five tomato cultivars varied greatly, with ‘TD-8’ having the heaviest fruit (21.54 g) and ‘TD-10’ having the lightest fruit (7.64 g). The fruits of five tomato cultivars were cut horizontally and longitudinally, and the transverse diameter and longitudinal diameter of ‘TD-9’ were 32.77 mm and 30.37 mm, respectively. In contrast, ‘TD-8’ had the largest differences in transverse and longitudinal diameters, which were 27.97 mm and 45.87 mm, respectively. Among the five tomato cultivars, ‘TD-9’ has the largest fruit transverse diameter, while ‘TD-10’ has the smallest. In addition, the largest longitudinal diameter was ‘TD-8’, while ‘TD-9’ and ‘TD-10’ were smaller.
A comparison of the soluble solids content of mature tomato fruits shows that the soluble solids content of ‘TD-10’ was significantly higher than other cultivars, ‘TD-7’ had higher soluble solids content, ‘TD-9’ had the lowest soluble solids content, ‘TD-8’ and ‘TD-17’ had an intermediate soluble solids content. In addition, among the five tomato cultivars, ‘TD-17’ was the hardest, ‘TD-8’ was the least, and the remaining three cultivars had similar fruit firmness.

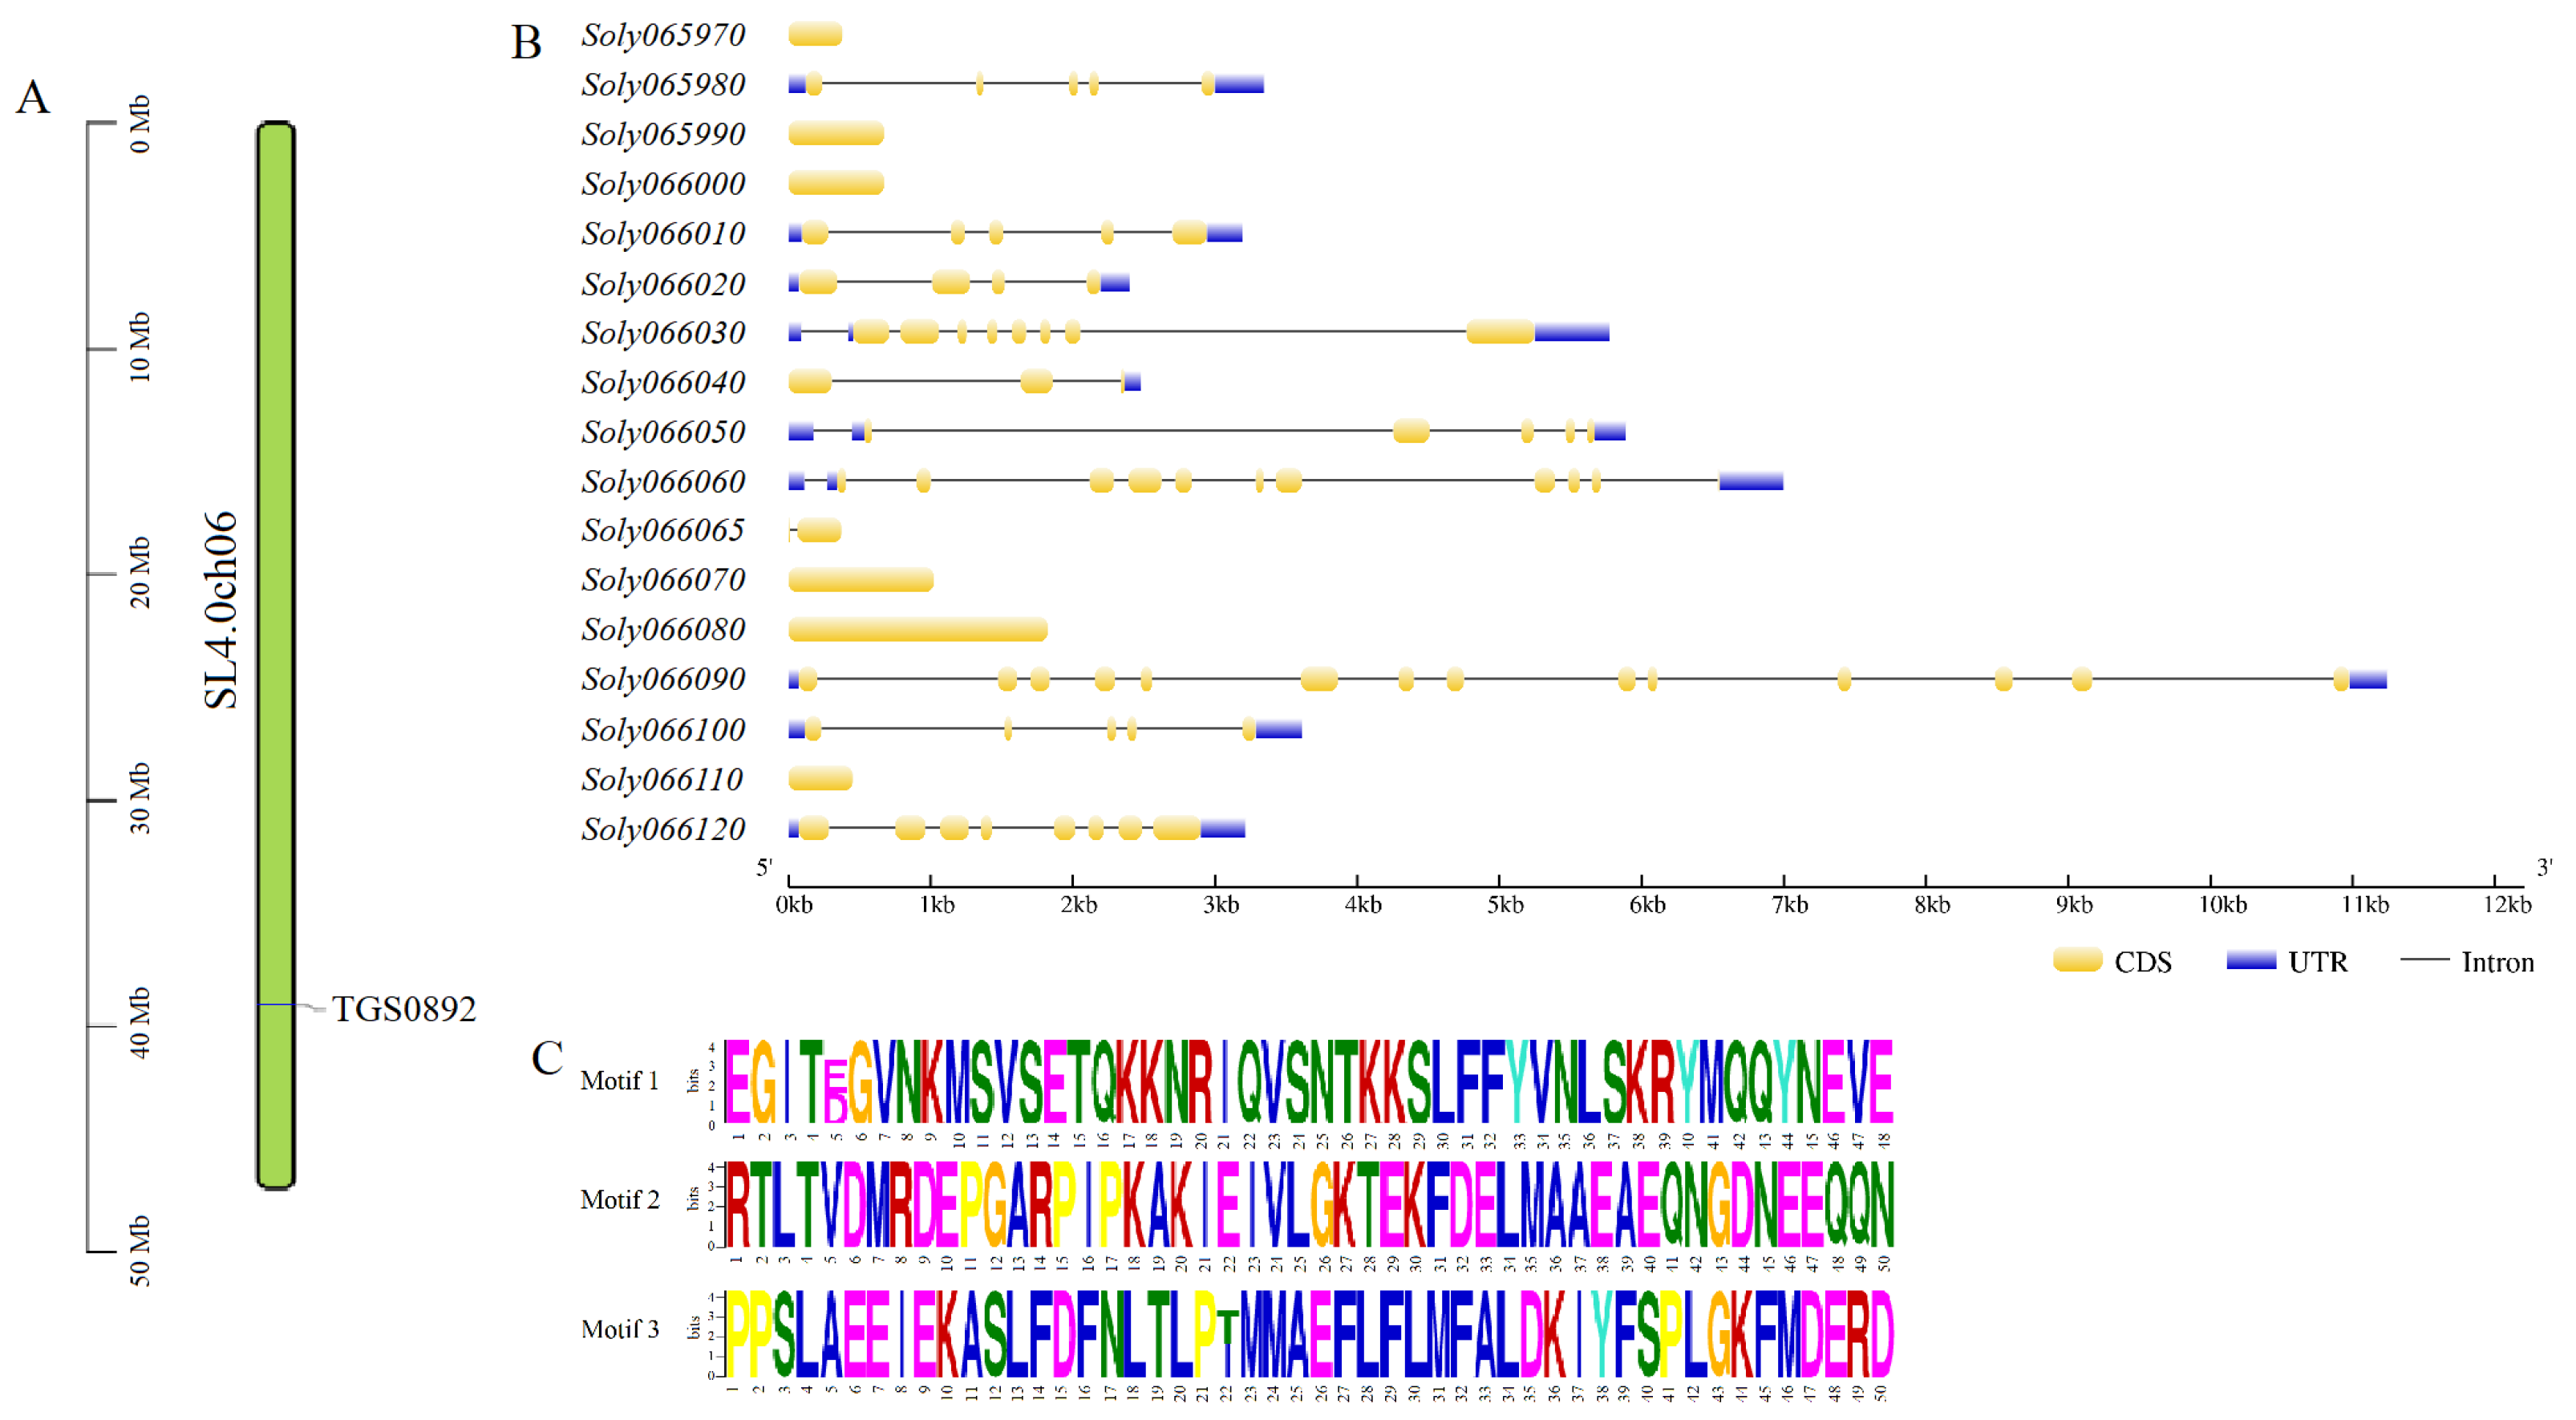
3.3. Identification and Sequence Analysis of Genes within 50 kb Upstream and Downstream of TGS0892

The molecular marker TGS0892 was localized on tomato chromosome 6. Figure 2A shows the location mapping obtained. Based on the SL 4.0 genome, 17 genes within 50 kb upstream and downstream of the molecular marker TGS0892 were identified. The structures of the 17 genes were analyzed (Figure 2B); 11 genes contained introns and exons except for Soly065970, Soly065990, Soly066000, Soly066070, Soly066080, and Soly066110. Among them, the Soly066090 gene contains the most exon and intron structures, with 14 and 13, respectively. The Soly066040 gene and the Soly066065 gene had a low number of exon and intron structures. Figure 2C shows the results of motif analysis. The gene structures of Soly065980 and Soly066100 both contained motif 1 and motif 2, while Soly065990 and Soly066000 contained motif 3.
Naming of 17 genes according to the annotated functions in PANTHER database and the direct homologs of the model species (Arabidopsis thaliana) in the SGN database. As shown in Table 2, all 17 genes identified were located on tomato chromosome 6; gDNA lengths varied widely, ranging from 374 bp to 11,244 bp; Soly066065 had the shortest amino acid length (106 aa), Soly066080 had the longest amino acid length (607 aa); molecular masses varied widely, with the largest being 68.49 kDa and about 5.65 times of the smallest; the theoretical isoelectric points ranged from 5.21 to 9.37; a grand average of hydropathicity ranged from −0.943 to 0.770, all were hydrophilic proteins except Soly065970, Soly066065, and Soly066070. It is worth mentioning that Soly065990 and Soly066000 had the same gDNA length, amino acid length, and theoretical isoelectric point.

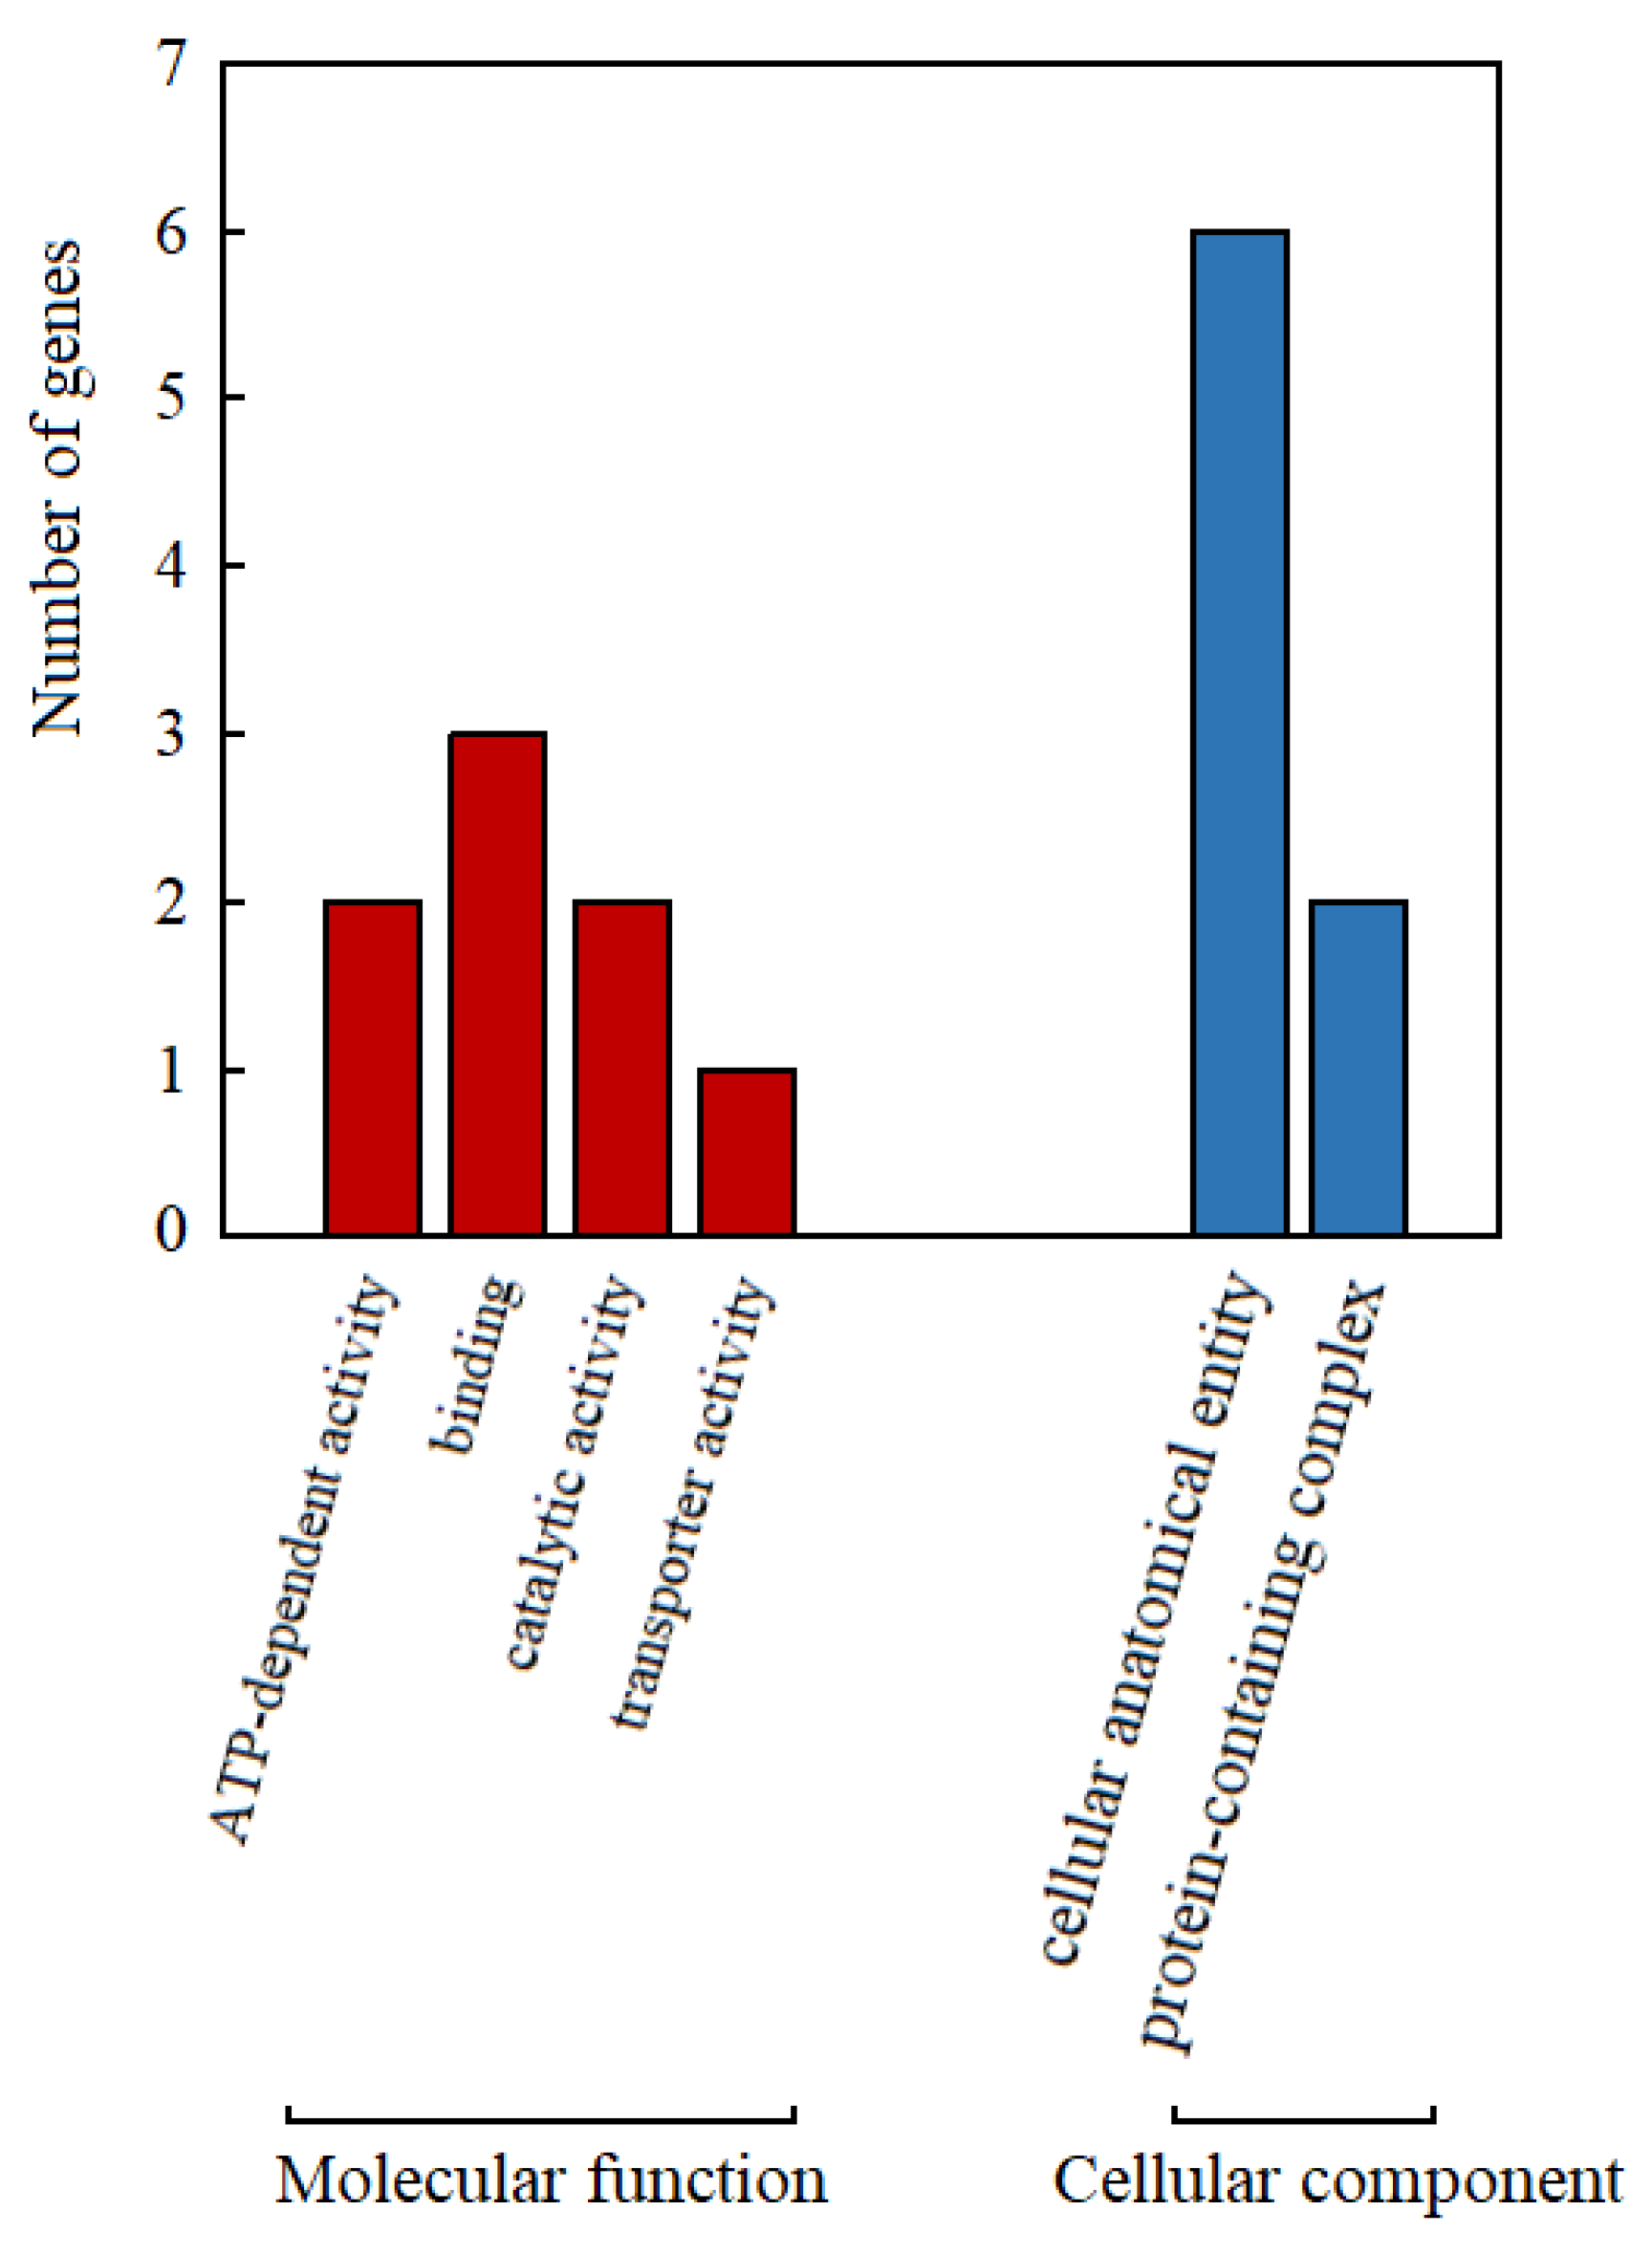
3.4. GO Functional Annotation of Genes within 50 kb Upstream and Downstream of TGS0892

Using SL 4.0 as the reference genome, 17 genes within 50 kb upstream and downstream of the molecular marker TGS0892 were functionally annotated. Referring to the GO annotation information (Figure 3), gene functions were annotated into two categories: molecular function and cellular component. The annotation results show that the genes with cellular anatomical entity function were the most abundant, while only one gene with the function of transporter activity. The number of genes with functions of ATP-dependent activity, catalytic activity, and protein-containing complex was both 2.

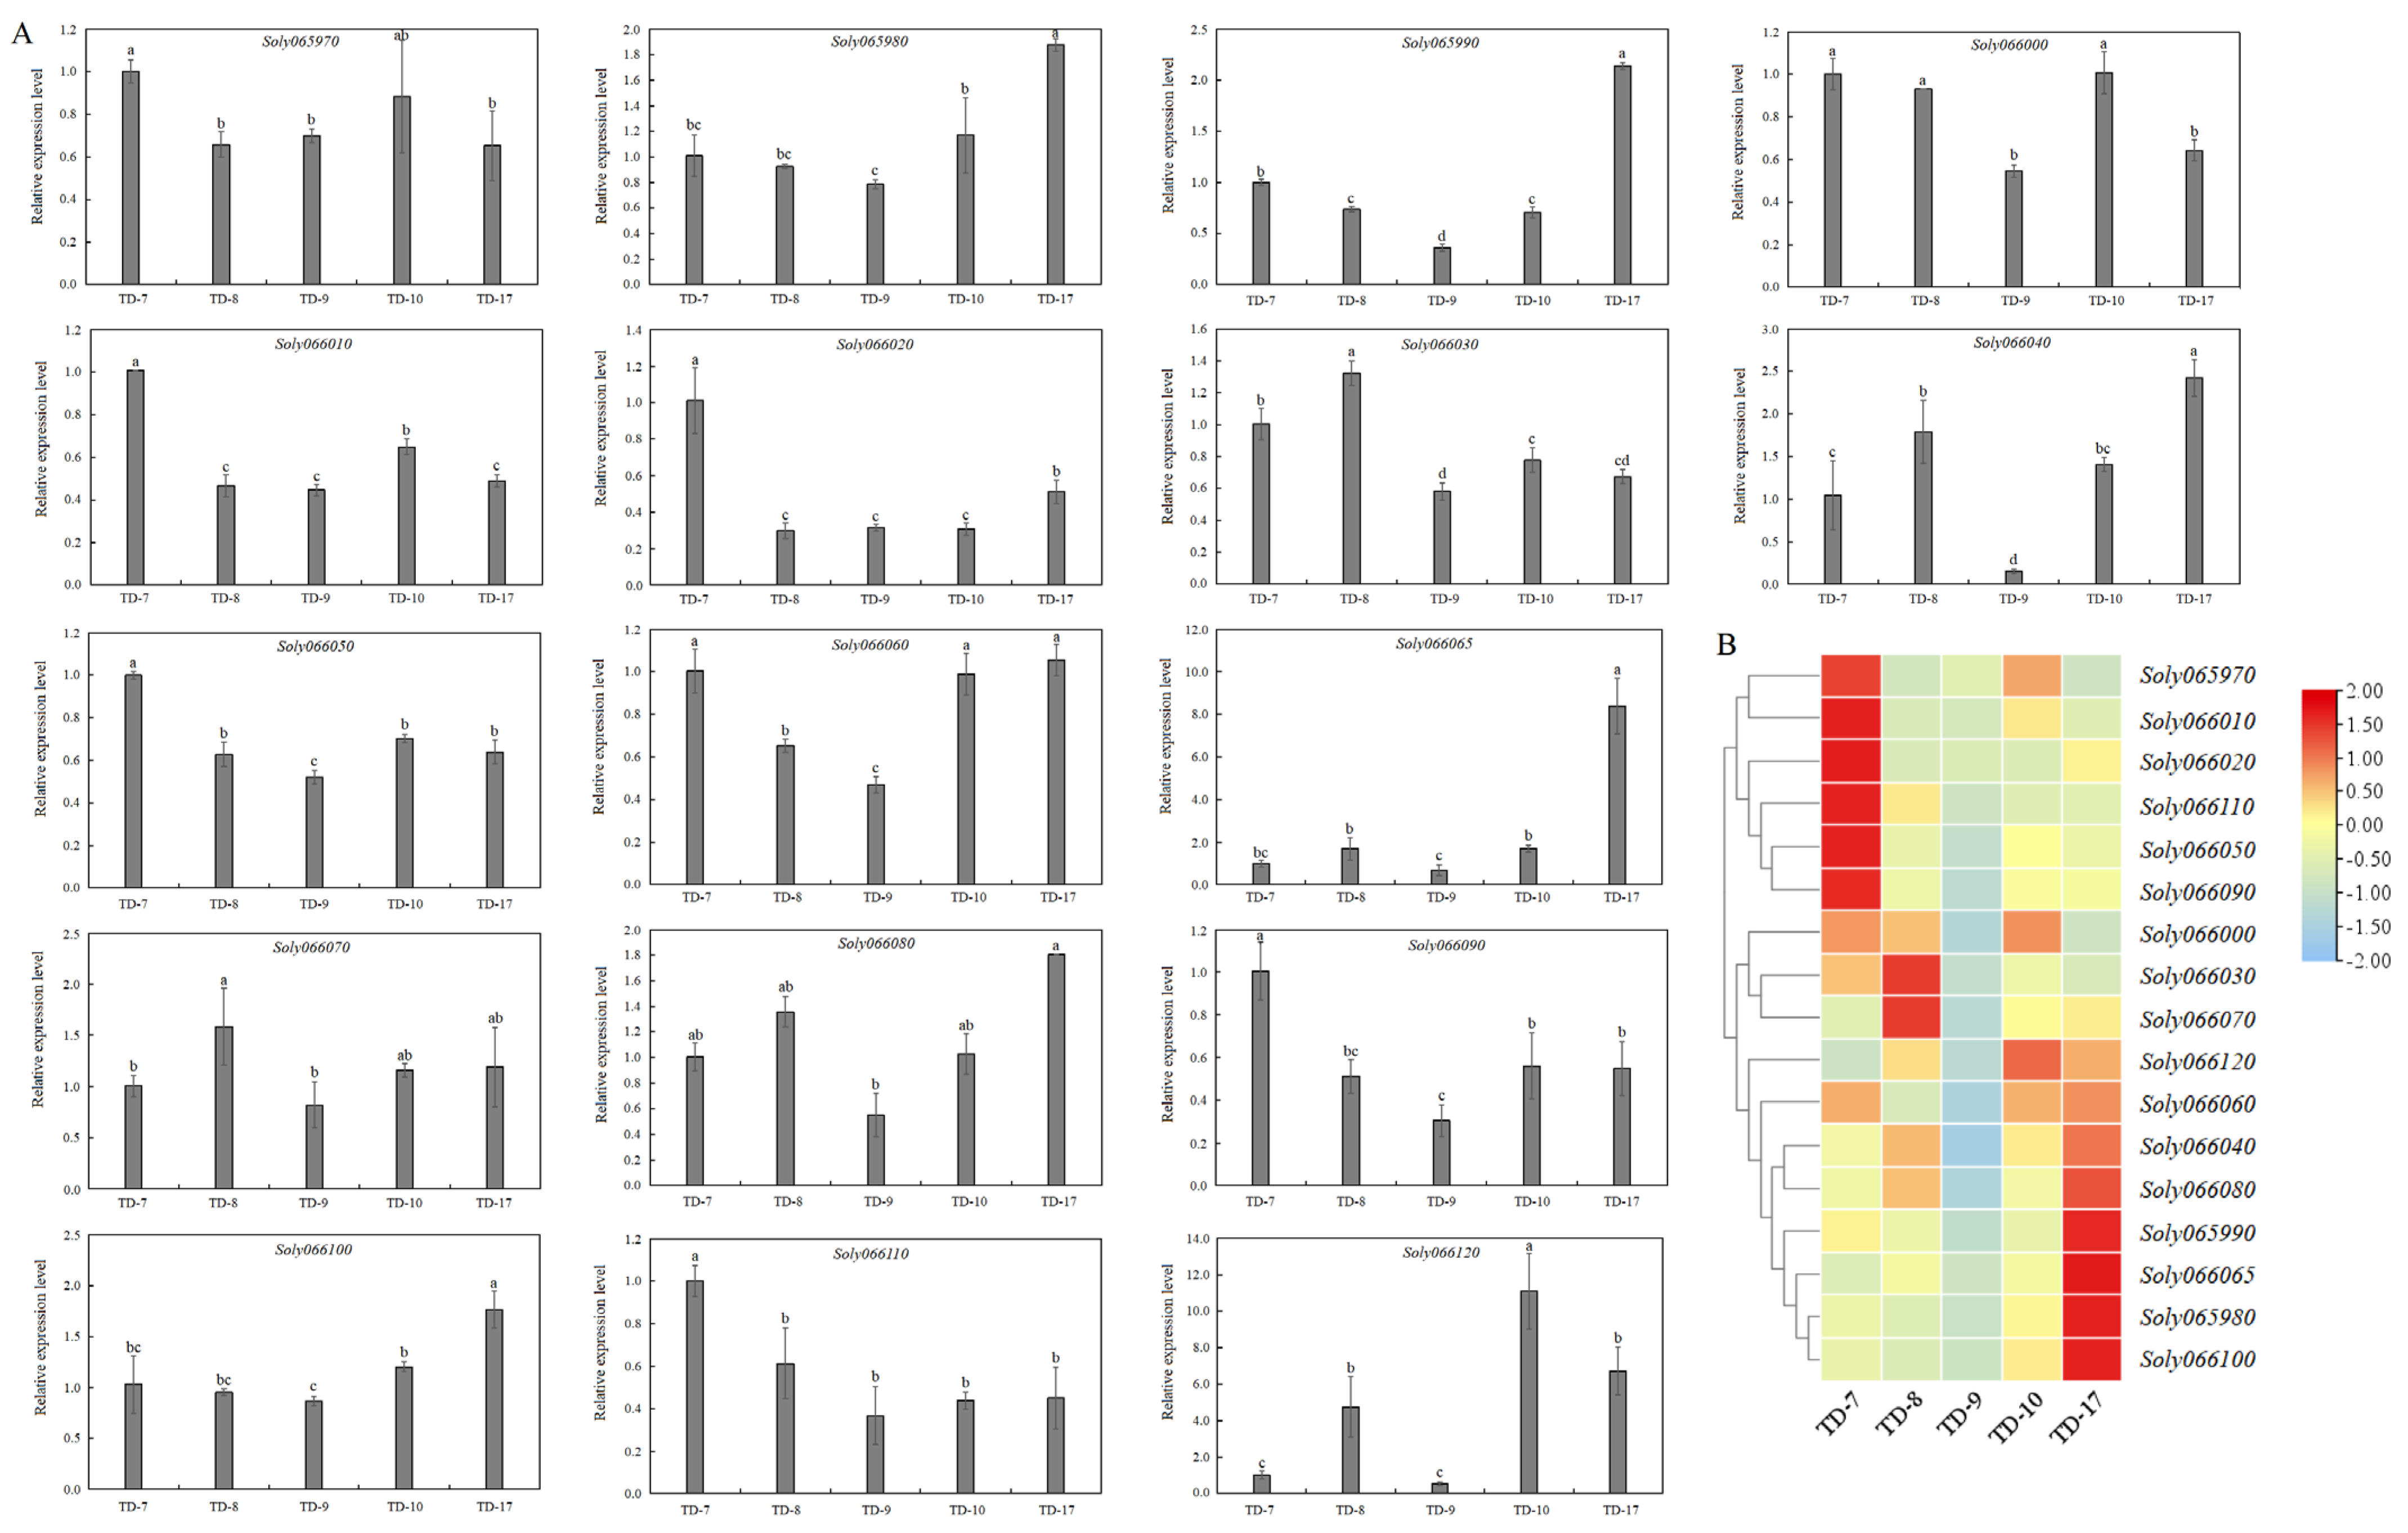
3.5. Expression Profiles of Genes within 50 kb Upstream and Downstream of TGS0892 in Different Tomato Cultivars

The expression levels of 17 genes in five tomato cultivars are shown in Figure 4. All 17 genes were classified into two major categories. Among them, Soly065970, Soly066010, Soly066020, Soly066050, Soly066090 and Soly066110 had the highest expression levels in ‘TD-7’, while Soly065980, Soly065990, Soly066040, Soly066060, Soly066065, Soly066080 and Soly066100 had the highest expression levels in ‘TD-17’. Except for Soly065970 and Soly066020, the expression levels of the remaining 15 genes were the lowest in ‘TD-9’. Soly065970 and Soly066010 were significantly more expressed in high soluble solids tomato cultivars (‘TD-7’ and ‘TD-10’) than that in other cultivars. Soly066030 and Soly066070 had the highest expression levels in ‘TD-8’, which were 2.28 and 1.94 times higher than the lowest, respectively. Soly066120 has the highest expression level in ‘TD-10’, which were 20.56 times higher than the lowest.

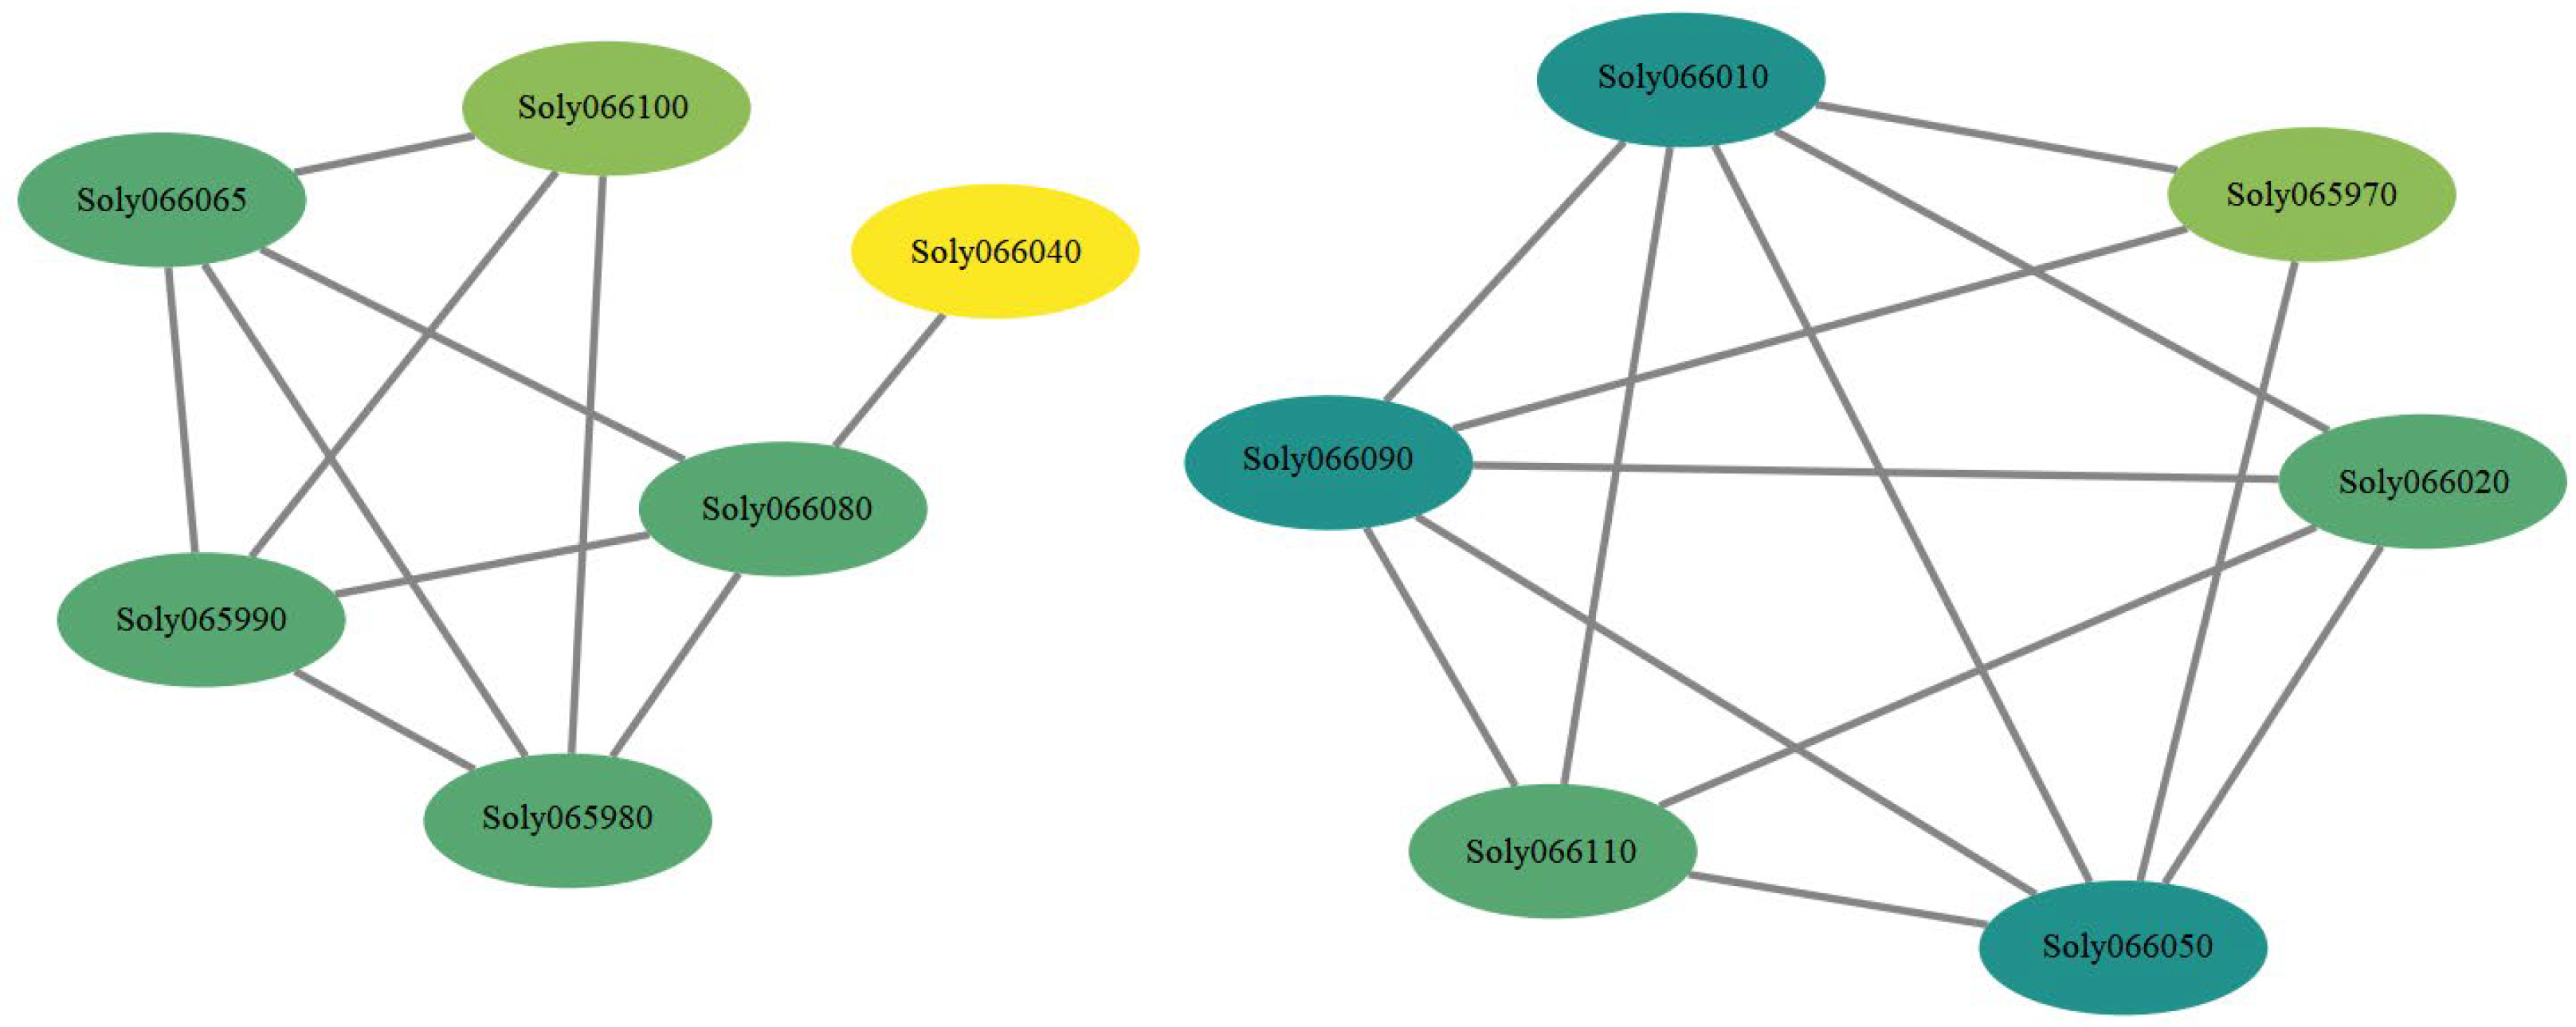
3.6. Interaction Network of Genes within 50 kb Upstream and Downstream of TGS0892

The 17 genes within 50 kb upstream and downstream of the molecular marker TGS0892 were analyzed for the interaction network. As shown in Figure 5, the interaction network of genes was divided into two categories: Soly066065, Soly065990, Soly065980, Soly066080, Soly066100, and Soly066040 had interactions; Soly066010, Soly066090, Soly066110, Soly066050, Soly066020, and Soly065970 had interactions. It is worth mentioning that the largest number (5) of genes interacted with Soly066010, Soly066090, and Soly066050; only one gene (Soly066080) interacted with Soly066040, while there were three genes that interacted with Soly066080.

4. Discussion

Tomatoes are one of the vegetables widely cultivated in the world and occupy an important position in the world agricultural economy. With its unique flavor, rich nutrition, bright color, and certain medical value, tomato is favored by more consumers, and its annual total output is increasing year by year [24]. Tomato is a highly self-pollinated crop that has undergone a long period of evolution and artificial selection compared to wild counterparts, and despite the low genetic diversity of cultivated tomatoes, they are extremely rich in phenotypic variation, especially for quality-related traits [25,26,27]. Both soluble solids content and firmness of tomato fruit are very important agronomic traits, the former being directly related to the taste and flavor, while the latter determining the storage and transport resistance [3,28,29]. Tomato single-fruit weight is positively correlated with the fruit’s transverse diameter, and sugar content is significantly negatively correlated with the single fruit’s weight and the fruit’s transverse diameter [30,31]. In the present study, tomato fruits of five different cultivars at maturity were selected, and their single fruit weight, transverse diameter, longitudinal diameter, firmness, and soluble solids content were determined. The results showed that ‘TD-10’ had the lightest single fruit weight, the smallest transverse diameter, and the highest soluble solids content; ‘TD-8’ and ‘TD-9’ had heavier single fruit weight and lowered soluble solids content. The above results are consistent with the findings of previous studies [30,31]. It is extremely difficult to improve the two traits simultaneously, and further study on their regulation mechanism may help to solve this problem. Correlation analysis of molecular markers and genes associated with these two traits may allow screening for key regulatory factors.
In recent years, with the development of a large number of molecular markers, people have gradually shifted their research to cultivars, and the use of cultivated tomato populations for genetic mapping to obtain QTL can be more effectively applied to breeding practices. Soluble solids content, an important trait in tomatoes, determines the flavor and the processing quality of tomatoes [28]. The previous researchers compared QTLs obtained from six different tomato populations and found that a total of 39 QTLs distributed on 12 chromosomes affected SSC, indicating the genetic complexity and quantitative characteristics of SSC in the genus Tomato. They also found by comparison that the QTL affecting SSC in tomato fruit were not species-specific but essentially identical, except that their expression was influenced by different genetic backgrounds and environments [29,32]). Chetelat et al. identified a gene sucr that enhances sucrose content in a progeny population using a cross grouping between the wild species Solanum chmielewskii (LA1028) and the common cultivar tomato UC204C, located on chromosome 3 and co-segregated with the molecular marker TG102 [33]. The fructose glucose ratio (FGR) indicates the ratio of fructose to glucose in fruits, which can reflect the sweetness of tomato fruits to some extent. Levin et al. used tomato material with high FGR from the cross progeny of Solanum habrochaites (LA1777) and common cultivated tomato material to cross with 1415. A QTL locus, named Fgr, was identified on chromosome 4 of tomato that regulates the control of fructose-to-glucose ratio in tomato fruits. Fgr was able to increase FGR, although it did not increase soluble solids content in fruits [34]. Bernacchi et al. used a high-generation backcross population (AB-QTL) constructed from tomato LA1777 and tomato E6203 to locate five soluble solids-associated QTLs [35]. Fulton et al. studied the relationship between isozyme markers, RFLP, and genes controlling soluble solids in tomatoes by using 132 molecular markers of known chromosomal positions and found that three fragments were related to soluble solids in tomatoes [3]. In this study, 17 genes within 50 kb upstream and downstream of the tomato molecular marker TGS0892 were identified, structurally analyzed, and functionally annotated. The results showed that 11 genes had intronic and exonic structures, and genes with cellular anatomical entity function were the most abundant. From the gene function annotation information, it can be seen that most of the genes were annotated as ATP synthase subunits. It was presumed that these genes are related to ATP synthesis and transport. Solyc06g066020.3 was annotated as a growth hormone response protein, which may be involved in the process of growth hormone regulation of plant growth. Solyc06g066120.3 was annotated as endoglucanase, a type of cellulase, and it was hypothesized that this gene is involved in regulating the sugar transport process in tomatoes, which in turn affects fruit quality. The expression levels of 17 genes in different tomato cultivars were divided into two major categories. Among them, Soly065970, Soly066010, Soly066020, Soly066050, Soly066090, and Soly066110 were expressed at the highest level in ‘TD-7’, while Soly065980, Soly065990, Soly066040, Soly066060, Soly066065, Soly066080, and Soly066100 were expressed at the highest level in ‘TD-17’, it was hypothesized that ‘TD-7’ and ‘TD-17’ are more suitable as germplasm resources for further study of the molecular mechanism of soluble solids accumulation in tomato. Soly065970 gene and Soly066010 gene were significantly more expressed in high soluble solids tomato cultivars (‘TD-7’ and ‘TD-10’) and less expressed in low soluble solids tomato cultivars (‘TD-9’). It was hypothesized that the Soly065970 gene and the Soly066010 gene were involved in regulating the process of soluble solids metabolism in tomatoes. The results of the gene interaction network showed that some of the genes had interactions, and most genes interacted with Soly066010, Soly066090, and Soly066050. It was speculated that these three genes might play greater roles in the regulation of soluble solids accumulation in tomatoes [3]. Further functional validation of the above-hypothesized genes related to soluble solids accumulation, such as transgenic and crispr/cas9 technologies, combined with histological correlation analysis, will help to investigate the mechanism of soluble solids accumulation and thus to produce tomatoes with high soluble solids content.
The traditional selection method is to identify phenotypic traits in order to achieve the selection of genotypes. The selection of some specific traits is inevitably limited by experience, time, and other conditions. Molecular markers offer the possibility to accelerate direct selection for genotypes by constructing genetic maps to locate target traits and find molecular markers closely linked to them. Molecular markers have the advantages of improving the purposefulness of breeding, reducing the size of population planting, improving selection efficiency, and shortening the breeding years [10]. Most of the target quality traits for crop breeding are quantitative traits, and the ability to genetically control quantitative traits affects the efficiency of crop breeding [32,36,37]. With the rapid development of modern molecular marker technology, a lot of basic work has been conducted in tomatoes, a large number of effective QTLs have been localized, and studies have identified master QTLs that can be stably inherited under different environments. However, extensive studies are still needed to use molecular markers for varietal improvement in tomatoes. In the present study, genes related to molecular markers of tomato SSC were identified, and their functional analysis, expression level analysis, and gene interaction analysis were carried out, providing a basis for an in-depth study on the formation mechanism of high soluble solids in tomato and further improvement of tomato quality.

Author Contributions

Conceptualization, A.-S.X., T.-M.Z. and R.-R.Z.; methodology, R.-R.Z. and J.-P.T.; investigation, R.-R.Z., J.-P.T. and L.-X.S.; formal analysis, R.-R.Z., J.-Q.Z. and H.L.; resources, A.-S.X. and T.-M.Z.; writing—original draft preparation, R.-R.Z.; writing—review and editing, A.-S.X.; visualization, R.-R.Z.; supervision, A.-S.X., T.-M.Z. and W.-M.Z.; project administration, R.-R.Z.; funding acquisition, A.-S.X., T.-M.Z. and W.-M.Z. All authors have read and agreed to the published version of the manuscript.

Funding

The research was supported by the Key Research and Development Program of Jiangsu (BE2021377), Natural Science Foundation of Jiangsu (BK20180306; BK20221009), Jiangsu Agricultural Science and Technology Innovation Fund [CX (21) 3025], China Postdoctoral Science Foundation (2021M701742), and Priority Academic Program Development of Jiangsu Higher Education Institutions Project (PAPD).

Data Availability Statement

In this section, all the other data sets supporting the conclusions of this article are included within the article.

Conflicts of Interest

The authors declare that there are no competing interests.

References

  1. Choudhary, P.; Rai, G.K.; Bagati, S.; Jamwal, D.; Kumar, P. Evaluation of genetic variability in tomato (Solanum lycopersicum L. Mill) genotypes using microsatellite markers. Int. J. Curr. Microbiol. Appl. Sci. 2018, 7, 2117–2124. [Google Scholar] [CrossRef]
  2. Ilahy, R.; Riahi, A.; Hdider, C.; Tlili, I.; Dalessandro, G.; Lenucci, M.S. Carotenoids content in intact plastids isolated from ordinary and high-lycopene tomato (Solatium lycopersicum L.) cultivars. Acta Hortic. 2015, 1081, 135–140. [Google Scholar] [CrossRef]
  3. Fulton, T.M.; Bucheli, P.; Voirol, E.; Tanksley, S.D. Quantitative trait loci (QTL) affecting sugars, organic acids and other biochemical properties possibly contributing to flavor, identified in four advanced backcross populations of tomato. Euphytica 2002, 127, 163–177. [Google Scholar] [CrossRef]
  4. Karadeniz, F.; Ekşi, A. A research on chemical composition of tomato pulpe. Turk. J. Agric. For. 1996, 20, 445–448. [Google Scholar] [CrossRef]
  5. Islam, M.S. Variability in different physical and biochemical characteristics of six tomato genotypes according to stages of ripeness. Bangladesh J. Bot. 1997, 26, 137–147. [Google Scholar]
  6. Beckles, D.M. Factors affecting the postharvest soluble solids and sugar content of tomato (Solanum lycopersicum L.) fruit-ScienceDirect. Postharvest Biol. Technol. 2012, 63, 129–140. [Google Scholar] [CrossRef]
  7. Fridman, E.; Liu, Y.S.; Carmel-Goren, L.; Gur, A.; Shoresh, M.; Pleban, T.; Eshed, Y.; Zamir, D. Two tightly linked QTLs modify tomato sugar content via different physiological pathways. Mol. Genet Genom. 2002, 266, 821–826. [Google Scholar] [CrossRef] [PubMed]
  8. Causse, M.; Chaïb, J.; Lecomte, L.; Buret, M.; Hospital, F. Both additivity and epistasis control. the genetic variation for fruit quality traits in tomato. Theor. Appl. Genet. 2007, 115, 429–442. [Google Scholar] [CrossRef] [PubMed]
  9. Foolad, M.R. Genome mapping and molecular breeding of tomato. Int. J. Plant Genom. 2007, 2007, 64358. [Google Scholar] [CrossRef] [Green Version]
  10. Causse, M.; Duffe, P.; Gomez, M.C.; Buret, M.; Damidaux, R.; Zamir, D.; Gur, A.; Chevalier, C.; Lemaire-Chamley, M.; Rothan, C. A genetic map of candidate genes and QTLs involved in tomato fruit size and composition. J. Exp. Bot. 2004, 55, 1671–1685. [Google Scholar] [CrossRef]
  11. Foolad, M.R.; Panthee, D.R. Marker-assisted selection in tomato breeding. Crit. Rev. Plant Sci. 2012, 31, 93–123. [Google Scholar] [CrossRef]
  12. Gonias, E.D.; Ganopoulos, I.; Mellidou, I.; Bibi, A.C.; Kalivas, A.; Mylona, P.V.; Osanthanunkul, M.; Tsaftaris, A.; Madesis, P.; Doulis, A.G. Exploring genetic diversity of tomato (Solanum lycopersicum L.) germplasm of Genebank collection employing SSR and SCAR markers. Genet. Resour. Crop Evol. 2019, 66, 1295–1309. [Google Scholar] [CrossRef]
  13. Wang, S.H. QTLs Mapping for Tomato Fruit Weight, Shape and Solube Solid Content in Solanum lycopersicon × Solanum galapagense Recombinant Inbred Line. Master’s Thesis, Chinese Academy of Agricultural Sciences, Beijing, China, April 2015. [Google Scholar]
  14. Zhao, J.T. Genome-Wide Association Study for Main Sugars and Organic Acids in Tomato Fruit. Master’s Thesis, Northwest A&F University, Yangling, China, November 2016. [Google Scholar]
  15. Eshed, Y.; Zamir, D. An introgression line population of Lycopersicon pennellii in the cultivated tomato enables the identification and fine mapping of yield-associated QTL. Genetics 1995, 141, 1147–1162. [Google Scholar] [CrossRef] [PubMed]
  16. Eshed, Y.; Zamir, D. Less-than-additive epistatic interactions of quantitative trait loci in tomato. Genetics 1996, 143, 1807–1817. [Google Scholar] [CrossRef] [PubMed]
  17. Lu, Y.H. QTLs Mapping of Soluble Solid Content and Beta-Carotene Content in Solanum cheesmanii. Master’s Thesis, Chinese Academy of Agricultural Sciences, Beijing, China, June 2012. [Google Scholar]
  18. Voorrips, R.E. MapChart: Software for the graphical presentation of linkage maps and QTLs. J. Hered. 2002, 93, 77–78. [Google Scholar] [CrossRef] [PubMed] [Green Version]
  19. Hu, B.; Jin, J.; Guo, A.Y.; Zhang, H.; Luo, J.; Gao, G. GSDS 2.0: An upgraded gene feature visualization server. Bioinformatics 2015, 31, 1296–1297. [Google Scholar] [CrossRef] [Green Version]
  20. Wang, X.R.; Wang, Y.H.; Jia, M.; Zhang, R.R.; Liu, H.; Xu, Z.S.; Xiong, A.S. The phytochrome-interacting factor DcPIF3 of carrot plays a positive role in drought stress by increasing endogenous ABA level in Arabidopsis. Plant Sci. 2022, 322, 111367. [Google Scholar] [CrossRef]
  21. Mi, H.; Muruganujan, A.; Casagrande, J.T.; Thomas, P.D. Large-scale gene function analysis with the PANTHER classification system. Nat. Protoc. 2013, 8, 1551–1566. [Google Scholar] [CrossRef]
  22. Huang, Y.; Li, M.Y.; Wu, P.; Xu, Z.S.; Que, F.; Wang, F.; Xiong, A.S. Members of WRKY Group III transcription factors are important in TYLCV defense signaling pathway in tomato (Solanum lycopersicum). BMC Genom. 2016, 17, 788. [Google Scholar] [CrossRef] [Green Version]
  23. Pfaffl, M.W. A new mathematical model for relative quantification in realtime RT-PCR. Nucleic Acids Res. 2001, 29, e45. [Google Scholar] [CrossRef]
  24. Szabo, K.; Dulf, F.V.; Diaconeasa, Z.; Dan, C.V. Antimicrobial and antioxidant properties of tomato processing byproducts and their correlation with the biochemical composition. LWT-Food Sci. Technol. 2019, 116, 108558. [Google Scholar] [CrossRef]
  25. Miller, J.C.; Tanksley, S.D. RFLP analysis of phylogenetic relationships and genetic variation in the genus Lycopersicon. Theor. Appl. Genet. 1990, 80, 437–448. [Google Scholar] [CrossRef]
  26. Zhang, J.; Zhao, J.; Liang, Y.; Zou, Z. Genome-wide association-mapping for fruit quality traits in tomato. Euphytica 2016, 207, 439–451. [Google Scholar] [CrossRef]
  27. Schouten, H.J.; Tikunov, Y.; Verkerke, W.; Finkers, R.; Bovy, A.; Bai, Y.; Visser, R.G.F. Breeding has increased the diversity of cultivated tomato in the Netherlands. Front. Plant Sci. 2019, 10, 1606. [Google Scholar] [CrossRef] [PubMed] [Green Version]
  28. Giovannoni, J.J.; Noensie, E.N.; Ruezinsky, D.M.; Lu, X.; Tracy, S.L.; Ganal, M.W.; Martin, G.B.; Pillen, K.; Albert, K.; Tankslev, S.D. Molecular genetic analysis of the ripening-inhibitor and non-ripening loci of tomato: A first step in genetic map-based cloning of fruit ripening genes. Mol. Gen. Genet. 1995, 248, 195–206. [Google Scholar] [CrossRef]
  29. Chen, F.Q.; Foolad, M.R.; Hyman, J.; Clair, D.A.S.; Beelaman, R.B. Mapping of QTLs for lycopene and other fruit traits in a Lycopersicon esculentum × L. pimpinellifolium cross and comparison of QTLs across tomato species. Mol. Breed. 1999, 5, 283–299. [Google Scholar] [CrossRef]
  30. Stevens, M.A. Inheritance of tomato fruit quality components. Plant Breed. Rev. 1986, 4, 273–311. [Google Scholar]
  31. Xu, J.; Ranc, N.; Muños, S.; Rolland, S.; Bouchet, J.P.; Desplat, N.; Le Paslier, M.C.; Liang, Y.; Brunel, D.; Causse, M. Phenotypic diversity and association mapping for fruit quality traits in cultivated tomato and related species. Theor. Appl. Genet. 2013, 126, 567–581. [Google Scholar] [CrossRef]
  32. Fulton, T.M.; Grandillo, S.; Beck-Bunn, T.; Fridman, E.; Frampton, A.; Lopez, J.; Petiard, V.; Uhlig, J.; Zamir, D.; Tanksley, S.D. Advanced backcross QTL analysis of a Lycopersicon esculentum × Lycopersicon parviflorum cross. Theor. Appl. Genet. 2000, 100, 1025–1042. [Google Scholar] [CrossRef]
  33. Chetelat, R.T.; Klann, E.; DeVerna, J.W.; Yelle, S.; Bennett, A.B. Inheritance and genetic mapping of fruit sucrose accumulation in Lycopersicon chmielewskii. Plant J. 1993, 4, 643–650. [Google Scholar] [CrossRef]
  34. Levin, I.; Gilboa, N.; Yeselson, E.; Shen, S.; Schaffer, A. Fgr, a major locus that modulates the fructose to glucose ratio in mature tomato fruits. Theor. Appl. Genet. 2000, 100, 256–262. [Google Scholar] [CrossRef]
  35. Bernacchi, D.; Beck-Bunn, T.; Eshed, Y.; Lopez, J.; Petiard, V.; Uhlig, J.; Zamir, D.; Tanksley, S. Advanced backcross QTL analysis in tomato. I. Identification of QTLs for traits ofagronomic importance from Lycopersicon hirsutum. Theor. Appl. Genet. 1998, 97, 381–397. [Google Scholar] [CrossRef]
  36. Frary, A.; Fulton, T.M.; Zamir, D.; Tanksley, S.D. Advanced backcross QTL analysis of a Lycopersicon esculentum × L. pennellii cross and identification of possible orthologs in the Solanaceae. Theor. Appl. Genet. 2004, 108, 485–496. [Google Scholar] [CrossRef] [Green Version]
  37. Tanksley, S.D.; Fulton, T.M. Dissecting quantitative trait variation—Examples from the tomato. Euphytica 2007, 154, 365–370. [Google Scholar] [CrossRef]
Figure 1. Physiological and quality indicators of mature tomato fruits of different cultivars. (A) Growth status of different cultivars of mature tomato fruits. The white lines on the right in each image represent 2 cm; (B) Fruit single weight, transverse diameter, longitudinal diameter, soluble solids content, and firmness of mature tomato fruit of different cultivars. Different lower cases indicate a significant difference at 0.05 level.
Horticulturae 09 00052 g001
Figure 2. Chromosome position map of TGS0892 and analysis of upstream and downstream 50 kb gene structure in tomato. (A) Chromosome position map of TGS0892 molecular marker; (B) Gene structure analysis; (C) Motif analysis.
Horticulturae 09 00052 g002
Figure 3. GO function annotation distribution diagram of genes within 50 kb upstream and downstream of TGS0892 in tomato.
Horticulturae 09 00052 g003
Figure 4. Expression profiles of genes within 50 kb upstream and downstream of TGS0892 in different tomato cultivars. (A) Expression levels of genes within 50 kb upstream and downstream of TGS0892. Different lower cases indicate the significant difference at 0.05 level; (B) Heat map and cluster analysis. The heat map was drawn in log2 transformed expression values. Blue and orange represent low and high expressions, respectively.
Horticulturae 09 00052 g004
Figure 5. Interaction network of genes within 50 kb upstream and downstream of TGS0892 in tomato. The circles represent genes, the straight lines represent the regulatory relationship between genes. The color of the circles represents the degree value, that is, the number of relationships between a gene in the network and its surrounding genes.
Horticulturae 09 00052 g005
Table 1. Nucleotide sequences of primers used for RT-qPCR.
Gene IDGeneForward Primer (5’→3’)Reverse Primer (5’→3’)
Solyc06g065970.1Soly065970TGGTCCATGTGAGCCAAAGCGCAATGAGCAACAAGGGGTT
Solyc06g065980.3Soly065980CCCGACCGATACCAAAAGCACCTCATTGTCCCCGTTTTGC
Solyc06g065990.1Soly065990TCCCCAGATCACCCAAATCCGCCATCATGGTGGGAAGTGT
Solyc06g066000.3Soly066000AGACCAGGCTGCTGCAATTAAGGGCAGCAATCTGAGAATCAA
Solyc06g066010.3Soly066010CGATGGGCGGAAGCTACTTACCTCTCGTTCTCCTCTCCGT
Solyc06g066020.3Soly066020GGAGATTGGATGCTTGCTGGTTGTGCTTCCTCCACTCTTCC
Solyc06g066030.4Soly066030ATCAGATGCCAAACCTCGCATTGGCATGGGTGTCGCTTTA
Solyc06g066040.2Soly066040GGCAACCATGACTCAAGGGAATGCTTGATGACGGACCAGG
Solyc06g066050.3Soly066050GCACATCTAATCCGGCCCTTTTGGGTTCTCGAACTGAGGC
Solyc06g066060.3Soly066060GGTTGGTAGGGGCATTGACAGGCCTTTCGTCCCAAACCTA
Solyc06g066065.1Soly066065TGGTGCTATCTCTTGCTCGTGTTTCAGGCAACTTGGCGTT
Solyc06g066070.1Soly066070CTCTCCGGCACTGTCATTGTGGGCACCAATGGGTAAAACG
Solyc06g066080.1Soly066080ACTCACCAGCAAGAACCGAGTTTGTGAGCACAAGGGGGTT
Solyc06g066090.3Soly066090TGTGGAAGAAGGAGTCGGGAGCACCTCTCCTACGATCTGC
Solyc06g066100.3Soly066100GGACATGAGGGACGAACCAGCCTCATTGTCCCCGTTTTGC
Solyc06g066110.1Soly066110CTAAATCGGCAACGGCGAAGTCACCGCCGATATCAACTCG
Solyc06g066120.3Soly066120TGTCTCCAGGGGGTCTGATTAGTCCATCTGTTGCTTGGCA
Solyc04g077020.2TubulinTGACGAAGTCAGGACAGGAACTGCATCTTCTTTGCCACTG
“Name” column represents the abbreviation of gene name in the full text.
Table 2. Analysis of properties of the genes and encoding amino acid sequences within 50 kb upstream and downstream of TGS0892 in tomato.
Gene IDGene NameChromosome LocationgDNA Length (bp)Amino Acid Length (aa)Molecular Weight (kDa)Theoretical pIGrand Average of Hydropathicity
Solyc06g065970.1Solyc06g065970.1, bifunctional inhibitor/lipid-transfer protein, AT2G45180chr6: 38992750-3899313038112612.848.040.770
Solyc06g065980.3Solyc06g065980.3, DNA/RNA-binding Alba-related, AT1G29250chr6: 38992750-38993130334612814.425.61−0.548
Solyc06g065990.1Solyc06g065990.1, ATP synthase subunit, AT4G32260chr6: 38999236-3899990767222324.415.79−0.079
Solyc06g066000.3Solyc06g066000.3, ATP synthase subunit, AT4G32260chr6: 39002459-3900313067222324.445.79−0.056
Solyc06g066010.3Solyc06g066010.3, ATP synthase subunit, AT5G25340chr6: 39003882-39007076319523827.179.10−0.798
Solyc06g066020.3Solyc06g066020.3, auxin-responsive protein IAA, AT2G46990chr6: 39015202-39017603240224228.215.21−0.943
Solyc06g066030.4Solyc06g066030.4, targeting protein for Xklp2, AT3G23090chr6: 39024791-39030566577647651.469.37−0.936
Solyc06g066040.2Solyc06g066040.2, protein of unknown function, N/Achr6: 39035654-39038131247818520.636.18−0.064
Solyc06g066050.3Solyc06g066050.3, protein of unknown function, AT5G25360chr6: 39039140-39045029589017319.228.17−0.384
Solyc06g066060.3Solyc06g066060.3, ATP-dependent RNA helicase, AT5G11170chr6: 39049594-39056592699941046.506.41−0.159
Solyc06g066065.1Solyc06g066065.1, protein of unknown function, N/Achr6: 39056643-3905701637410612.126.370.513
Solyc06g066070.1Solyc06g066070.1, solute carrier family, AT2G25520chr6: 39058405-39059427102334038.009.310.631
Solyc06g066080.1Solyc06g066080.1, DYW family of nucleic acid deaminases, AT1G47580chr6: 39060931-39062754182460768.497.79−0.037
Solyc06g066090.3Solyc06g066090.3, ATPase family protein, AT2G25530chr6: 39064180-3907542311,24459468.437.35−0.487
Solyc06g066100.3Solyc06g066100.3, DNA/RNA-binding Alba-related, AT1G29250chr6: 39075900-39079511361212814.435.63−0.548
Solyc06g066110.1Solyc06g066110.1, protein of unknown function, AT1G72510chr6: 39082573-3908302545315016.668.67−0.426
Solyc06g066120.3Solyc06g066120.3, endoglucanase, AT3G43860chr6: 39087035-39090249321548654.128.59−0.401
Disclaimer/Publisher’s Note: The statements, opinions and data contained in all publications are solely those of the individual author(s) and contributor(s) and not of MDPI and/or the editor(s). MDPI and/or the editor(s) disclaim responsibility for any injury to people or property resulting from any ideas, methods, instructions or products referred to in the content.

