Article

Estimation of Genetic Diversity between and within Biparental Clones and Full-Sib Families of the Chinese Pine Using SSR Markers

1
College of Forestry, Inner Mongolia Agricultural University, Hohhot 010018, China
2
College of Science, Inner Mongolia Agricultural University, Hohhot 010018, China
3
Wanjiagou Management Station of Hohhot Branch, Inner Mongolia Daqingshan Nature Reserve, Management Bureau, Hohhot 010100, China
*
Author to whom correspondence should be addressed.
Horticulturae 2023, 9(11), 1205; https://doi.org/10.3390/horticulturae9111205
Submission received: 6 October 2023 / Revised: 29 October 2023 / Accepted: 3 November 2023 / Published: 6 November 2023
(This article belongs to the Section Genetics, Genomics, Breeding, and Biotechnology (G2B2))

Abstract

:
Quantifying the genetic diversity present in plant populations is crucial for the success of selection of elite plants and breeding programs. The population structure and partition of genetic variance within and between plant populations allows inferences about the distribution and extent of variation available in plant breeding populations. The Chinese pine (Pinus tabuliformis Carriere) is a native species that is ecologically and economically important to Northern China. Studying the genetic variation and partition of P. tabuliformis will be invaluable for its efficient utilization. In this study, we selected 21 pairs of SSR primers to estimate the genetic diversity of 35 clones from four populations and 216 progenies from 22 full-sib families of P. tabuliformis. Our results showed that P. tabuliformis was a typical outcrossing plant (FIS = −0.053/−0.165) containing moderately high genetic diversity (He = 0.542/0.605) both for the clone populations and the progenies produced by the clone crosses via controlled pollination. The genetic differentiation between the clones (FST = 0.076) was lower than that between the full-sib progenies (FST = 0.155). Such diverse FST may be promoted by different gene flows (Nm = 3.881/1.546) due to distinct pollination patterns. The clustering methods showed a lack of significant division of the clone populations, with a similar genetic admixture found for each of the clones. However, two groups were found between the full-sib families with genetic admixture between them. The analysis of molecular variance (AMOVA) showed that the most plentiful genetic variability exists between the cloned individuals (98%) as well as within the full-sib progenies (89%). Such distribution of genetic variation suggests rich internal variance and thus it is feasible to select the elite plants within each population or family. These results provide genetic materials and theoretical guidance for the selection and breeding of the Chinese pine.

1. Introduction

Biological diversity refers to the variation present within all the living organisms in the world and is presented at the diverse levels of genetic, species and ecosystem. Of the three levels at which biodiversity occurs, genetic diversity represents the amount of heritable variation within and among the populations of a species [1]. High genetic variation and diverse gene pools in a plant species are essential for its adaptation to novel pressures. For populations with a broad genetic base, recurrent selection will increase the frequency of favorable alleles and maintain the genetic variability of populations [2]. Thus, emphasizing the extent and distribution of heritable variation available in plant breeding populations will promote the efficient utilization and safe conservation of germplasm resource. Several factors, including the evolutionary history (such as past bottlenecks and expansions of population), breeding system, environment and human factors, can directly determine the distribution and extent of genetic diversity in the populations [3]. Previous studies showed that much of a species’ available genetic variation may be partitioned among individuals within individual populations [4,5,6,7] or found among different populations [8,9].
For tree breeding, genetic tests are widely used because of their simple performance and integration of recurrent selection. In the case of progeny tests, full-sibs, half-sibs and inbred progeny tests are the most commonly involved. Recurrent selection among progeny tests is widely applied in different allogamous tree species, such as Eucalyptus [10,11], Jatropha [5] and Pinus [12]. Greater genetic gain per selection cycle is expected within full-sib progenies than within half-sib progenies [13,14]. The genetic structure of progenies in plant breeding is also widely used as a training set for genomic selection [15]. For such genomic selection among perennial trees, elite individual plants or clones are widely used for biparental crosses [16,17]. It is therefore crucial to obtain comprehensive information of the genetic diversity and population structure of the elite plants used for biparental crosses for the selection of base populations and the definition of breeding plans [18,19].
Molecular markers based on the polymerase chain reaction (PCR) are among the most important and efficient techniques for producing available data in terms of the genetic diversity of populations of interest. Simple sequence repeat (SSR) sequences, in which a basic unit of 1–6 nucleotides tandemly repeats many times across the genome, have been more extensively used in many studies of genetic diversity than other types of PCR-based molecular markers, for example, RAPD (random amplified polymorphism DNA), DAF (DNA amplified fingerprints), SCAR (sequence-characterized amplified regions), AFLP (amplified fragment length polymorphism) and ISSR (inter-simple sequence repeat) [10,20,21]. The utilization of SSR markers does not require any prior knowledge of a species genome and can be amplified using relatively simple techniques with a small amount of DNA. Compared to other molecular markers, SSR markers also have the characteristics of co-dominance, extensive polymorphisms and a large number of highly reproducible and informative alleles [22,23]. The use of SSR markers to estimate the genetic diversity of forest tree species has been frequently reported, for example within Eucalyptus [10,11], Jatropha [5], Podocarpus elatus [24], Pinus koraiensis [12], masson pine [7], Pinus yunnanensis [25], Chinese pine [26], P. albicaulis [27], P. pinaster [28], Abies alba [29], Picea jezoensis [30] and others.
The Chinese pine (Pinus tabuliformis Carriere) is known as a conifer tree that serves as an important native species of boreal and temperature forest ecosystems [31,32]. It is continuously distributed across a natural range extending through Northeast, North and Northwest China (ranging between 31–44° N and 101–125° E) and grows at altitudes varying from 500 to 2000 m in areas with diverse environments [33]. Excellent traits, such as strong tolerance to harsh environments, fast growth and valuable timber and resin have made P. tabuliformis a popular afforestation tree [32]. The genomic assembly and evolutionary analyses have unveiled the genetic basis of such an adaptation [34]. The germplasm source of P. tabuliformis has been widely collected for the establishment of seed orchards. Several studies have been carried out to investigate the genetic diversity of its natural populations, elite clones and individual plants and progenies [26,35,36]. These works have reinforced the value of SSR molecular markers in studying the genetic diversity of P. tabuliformis. Among the applications of SSR markers, the identification of elite plants and the characterization of genetic diversity for the examined populations and/or crossed families are two predominant highlights. Therefore, taking into account the advantages of knowing the nature of the genetic variance to design plant breeding schemes, it is quite crucial for the success of selection and breeding via quantifying genetic diversity within and among populations and/or families. In this study, based on the SSR molecular markers, we specifically aimed to evaluate the extent and distribution of the genetic diversity of 35 clones from four geographic populations, as well as 216 full-sib progenies generated from clone crosses, and consequently provided theoretical and practical guidance for future breeding of the Chinese pine.

2. Materials and Methods

2.1. Plant Sampling for DNA Extraction

All samples used for DNA extraction were collected in the National Seed Orchard of P. tabuliformis of Wanjiagou, located on the southern foot of Daqing Mountain, Tumote Left Banner, Hohhot, Inner Mongolia Autonomous Region (110°09′ E, 40°41′ N). A total of 35 clones from four populations of P. tabuliformis were collected. Information about these clones is listed in Table 1. Among 35 clones, 22 combinations, with 18 clones as maternal plants and 20 clones as paternal plants, were used for biparental crosses to generate full-sib progenies. A total of 216 full-sib progenies were finally collected from these biparental crosses, with at least 5 samples contained for each family (Table S1). Fresh young shoots of individual samples were dried in silica gel for whole-DNA isolation.

2.2. DNA Extraction and SSR Genotyping

Whole genomic DNA of each sample was extracted from the dried leaves using a plant genomic DNA kit (ThermoFisher Scientific™, Shanghai, China). To obtain SSR markers with high allele polymorphisms within P. tabuliformis, 59 pairs of SSR markers, collected from previous reports (Table S2), were preliminarily used for polymorphism investigation among 26 individuals, with one individual for each of the four clonal populations and each of the 22 full-sib families. Polymerase chain reactions (PCRs) were conducted in 20 µL, containing 10 µL 2× MasterMix (Tsingke, Wuhan, China), 1.0 µL DNA (50 ng/µL), 1.0 µL of each primer (10 mMol), and 7 µL ddH2O. The PCRs were begun with initial denaturation at 98 °C for 2 min, followed by 35 cycles of 98 °C for 10 s, appropriate annealing temperature (Table S2) for 10 s, extension of 72 °C for 10 s, and a final-extension at 72 °C for 5 min. A negative control was carried out in each PCR run with no DNA contained in the reaction system. A total of 21 out of 59 pairs of SSR primers were obtained on the basis of these criteria: (1) SSR DNA fragments were easily PCR-amplified with strong signals to avoid non-specific amplification; (2) allele sizes of each SSR DNA fragments were discernible and differed among at least three individuals. Information about the screened primer pairs is listed in Table S2. PCR amplifications of the screened SSR markers were conducted among the remaining 225 individuals by running the above procedure with the corresponding annealing temperatures (Table S2).
SSR products were first detected in 3% agarose gels to ensure the successful amplification of SSR loci. To precisely genotype alleles in each SSR locus, SSR products were precipitated using 2.75 V of 100% ethanol and 0.1 V of 7.5 mol/L ammonium acetate, followed by centrifuging at 1200 rpm for 30 min. The pellets were collected by carefully removing all supernatant, followed by washing with 70% ethanol (v/v) before airdrying for 3 min and then resuspending in sterile distilled water. The purified products were pooled in triplex combinations according to fluorochrome-labelled forward primers, including three fluorochrome moieties of HEX (hexachloro-6-carboxyfluorescein), FAM (6-carboxyfluorescein), and NED (78-benzo-5’-fluoro-2.4.7-trichloro-5-carboxyfluore-scein). SSR genotyping was performed in ABI3730 capillary electrophoresis (3730xl, Applied Biosystems, Carlsbad, CA, USA) following the manual. The capillary electrophoresis volume of each triplex was 10 µL, containing 1.0 µL 10× diluted SSR products, 8.5 µL deionized formamide and 0.5 µL GeneScanTM 500 ROXTM dye size standards. Against the GeneScanTM 500 ROXTM size standards, allele sizes of SSR DNA fragments were scored and recorded automatically in base pairs as individual Gene Scan files using GENEMARKER Version2.2.0 (Soft genetics, State College, PA, USA).

2.3. Genetic Statistical Analyses for Clonal Populations and Full-Sib Families

The Hardy–Weinberg equilibrium (HWE) of each SSR locus was determined in GenALEx 6.503 [37] using Chi-Square (χ2) tests, with the degrees of freedom (df), probability and the significance P values statistically calculated. Genetic variations of the clonal populations and full-sib families were estimated using GenAlEx 6.503 (https://biology-assets.anu.edu.au/GenAlEx/Download.html, accessed on 14 July 2023) by calculating the parameters, including number of alleles (Na), number of effective alleles (Ne), observed heterozygosity (Ho), expected heterozygosity (He), polymorphism information contents (PIC), Shannon’s information index (I), gene flow (Nm) and F-statistical parameters of Wright’s inbreeding coefficient of an individual (I) relative to the total (T) (FIT), Wright’s inbreeding coefficient of an individual (I) relative to the subpopulation (S) (FIS) and Wright’s fixation index indicating the effect of subpopulations (S) compared to the total population (T) (FST). The analysis molecular variance (AMOVA) was also carried out in GenAIEx 6.503 to measure the partitioning of total genetic variability within and among populations/families. PowerMarkerV3.25 [38] was performed to calculate major allele frequency (MAF), gene diversity, Nei’s genetic distance and Nei’s genetic identity. According to the biparental genotypes at each SSR locus, the full-sib progenies having special genotypes inherited from both maternal and paternal plants were identified as true hybrids. The hybrid rate identified by each SSR locus was represented by P1, which was calculated by dividing the number of true hybrids identified at each SSR locus by the number of progenies. The hybrid rate of each family was indicated by P2, which was calculated by dividing the number of true hybrids of each family by the number of progenies. To identify whether the gene diversity of the full-sib progenies was affected by genetic differentiation between the clones, a mantel test between progeny gene diversity and biparental genetic distance was performed in the GenAlEx v.6.503.
To estimate the genetic relationships among the clones, as well as among the full-sib progenies, Nei’s genetic distances were used to reconstruct unrooted phylogenetic trees by neighbor-joining (NJ) in POWERMARKER V3.25 and the resulted NJ trees were visualized in MEGA V7.0 [39]. The principal coordinate analysis (PCoA) was carried out in GenAlEx 6.503 to divide the samples into different clusters. Furthermore, genetic groups for clone populations and full-sib families in all the SSR loci were determined using a Bayesian-model-based clustering approach in STRUCTURE v2.3.4 [40], with the admixture model and the independent allele frequencies assumed among populations/families. Ten independent runs were conducted for each K (=1–9) with 100,000 MCMC replications and 10,000 discarded as burn-in. To determine the optimal K values of the clone populations and full-sib progenies, plots of ad hoc posterior probability models of Delta K and the corresponding K values [41] were used to identify the optimal K value at the maximum Delta K. Alternatively, plots between the K values and mean logeP(D) values of the corresponding L (K) were also used to find the optimal K values at the maximum L(K) [42].

3. Results

3.1. Polymorphisms of the Selected SSR Markers

A set of SSR markers were used to screen the genetic variations and infer the population structures of the clones and full-sib progenies of P. tabulaeformis. In this study, the Chi-Square tests showed that all the SSR loci conformed to the HWE, except that the loci of 800, pt0119, pt0319 and pt0450 departed from the HWE within the full-sib progenies (Tables S3 and S4). The size of the amplified SSR DNA fragments varied from 127 to 279 bp in length among the selected 21 SSR loci (Table S2). A total of 84 alleles were scored over these SSR loci for the clones and 77 alleles for the full-sib progenies, respectively, with an average of 4.0 and 3.5 per locus for the clones and full-sib progenies, respectively (Tables S5 and S6). Accordingly, the Ne over all SSR loci were 59 and 53, with an average of 2.8 and 2.5 per locus (Tables S5 and S6). The allelic diversity was greatly variable over all the SSR loci. The Ho ranged from 0.269 to 0.898, and He from 0.389 to 0.806 (Tables S5 and S6). The mean He was lower than Ho both for the clones (Ho = 0.636, He = 0.605) and the full-sib progenies (Ho = 0.634, He = 0.542) across all the SSR loci (Tables S3 and S4). For all the examined samples of P. tabuliformis across all the loci, we found the I varying from 0.616 to 1.763, PIC from 0.380 to 0.782 and gene diversity from 0.485 to 0.835, respectively (Tables S5 and S6). Higher mean values of I, PIC and gene diversity (I = 1.102, PIC = 0.618 and gene diversity = 0.673) were observed within the clones than within the full-sib progenies (I = 0.959, PIC = 0.592 and gene diversity = 0.645) (Tables S5 and S6). The F-statistical parameters showed that FIS, FIT and FST varied from −0.408 to 0.479, from −0.279 to 0.500 and from 0.026 to 0.233, respectively (Tables S5 and S6), with mean values of −0.053, 0.028 and 0.076 for the clones, and −0.165, 0.013 and 0.155 for the full-sib progenies (Tables S7 and S8). The Nm varied from 0.822 to 9.434, with a higher gene flow found between the clones (Nm = 3.881) than between full-sib progenies (Nm = 1.546) (Tables S7 and S8).

3.2. Genetic Diversity

The genetic diversity of the clones and full-sib progenies of P. tabulaeformis has been investigated using the selected 21 SSR molecular markers. Among the four clone populations, we found Na varied from 3.048 to 5.238 with an average of 4.0 per population, and Ne ranged from 2.504 to 3.240 with an average of 2.8 per population. These values of Na and Ne were higher than those within the full-sib families, with Na varying from 2.905 to 4.048, and Ne from 2.185 to 2.649 (Table 2). The I, Ho and He varied among the four clone populations from 0.978 to 1.289, from 0.619 to 0.650 and from 0.569 to 0.662, respectively (Table 2). Similarly, these parameters of the full-sib progenies were lower than those of the clone populations, with the I from 0.845 to 1.068, the Ho from 0.571 to 0.724, and the He from 0.496 to 0.583 (Table 2). In summary, the clone populations showed a higher genetic diversity than the full-sib progenies did (Table 2). Of note, the clone population of Ningcheng showed the highest genetic diversity of the clone populations, and the full-sib progenies produced by N37 and W2 showed the highest genetic diversity of the progenies (Table 2). The full-sib family with the second-highest genetic diversity was the P84-N22 family, followed by the N17-Q85 family (Table 2).
Meanwhile, no significant correlation was found between the genetic distance between clone parents and the gene diversity of full-sib progenies (Figure S1). In addition, the average value of hybrid rate identified by each SSR locus P1 was 14.61% (Figure S2) and the average value of hybrid rate of each family P2 was 97.96% (Table S11).

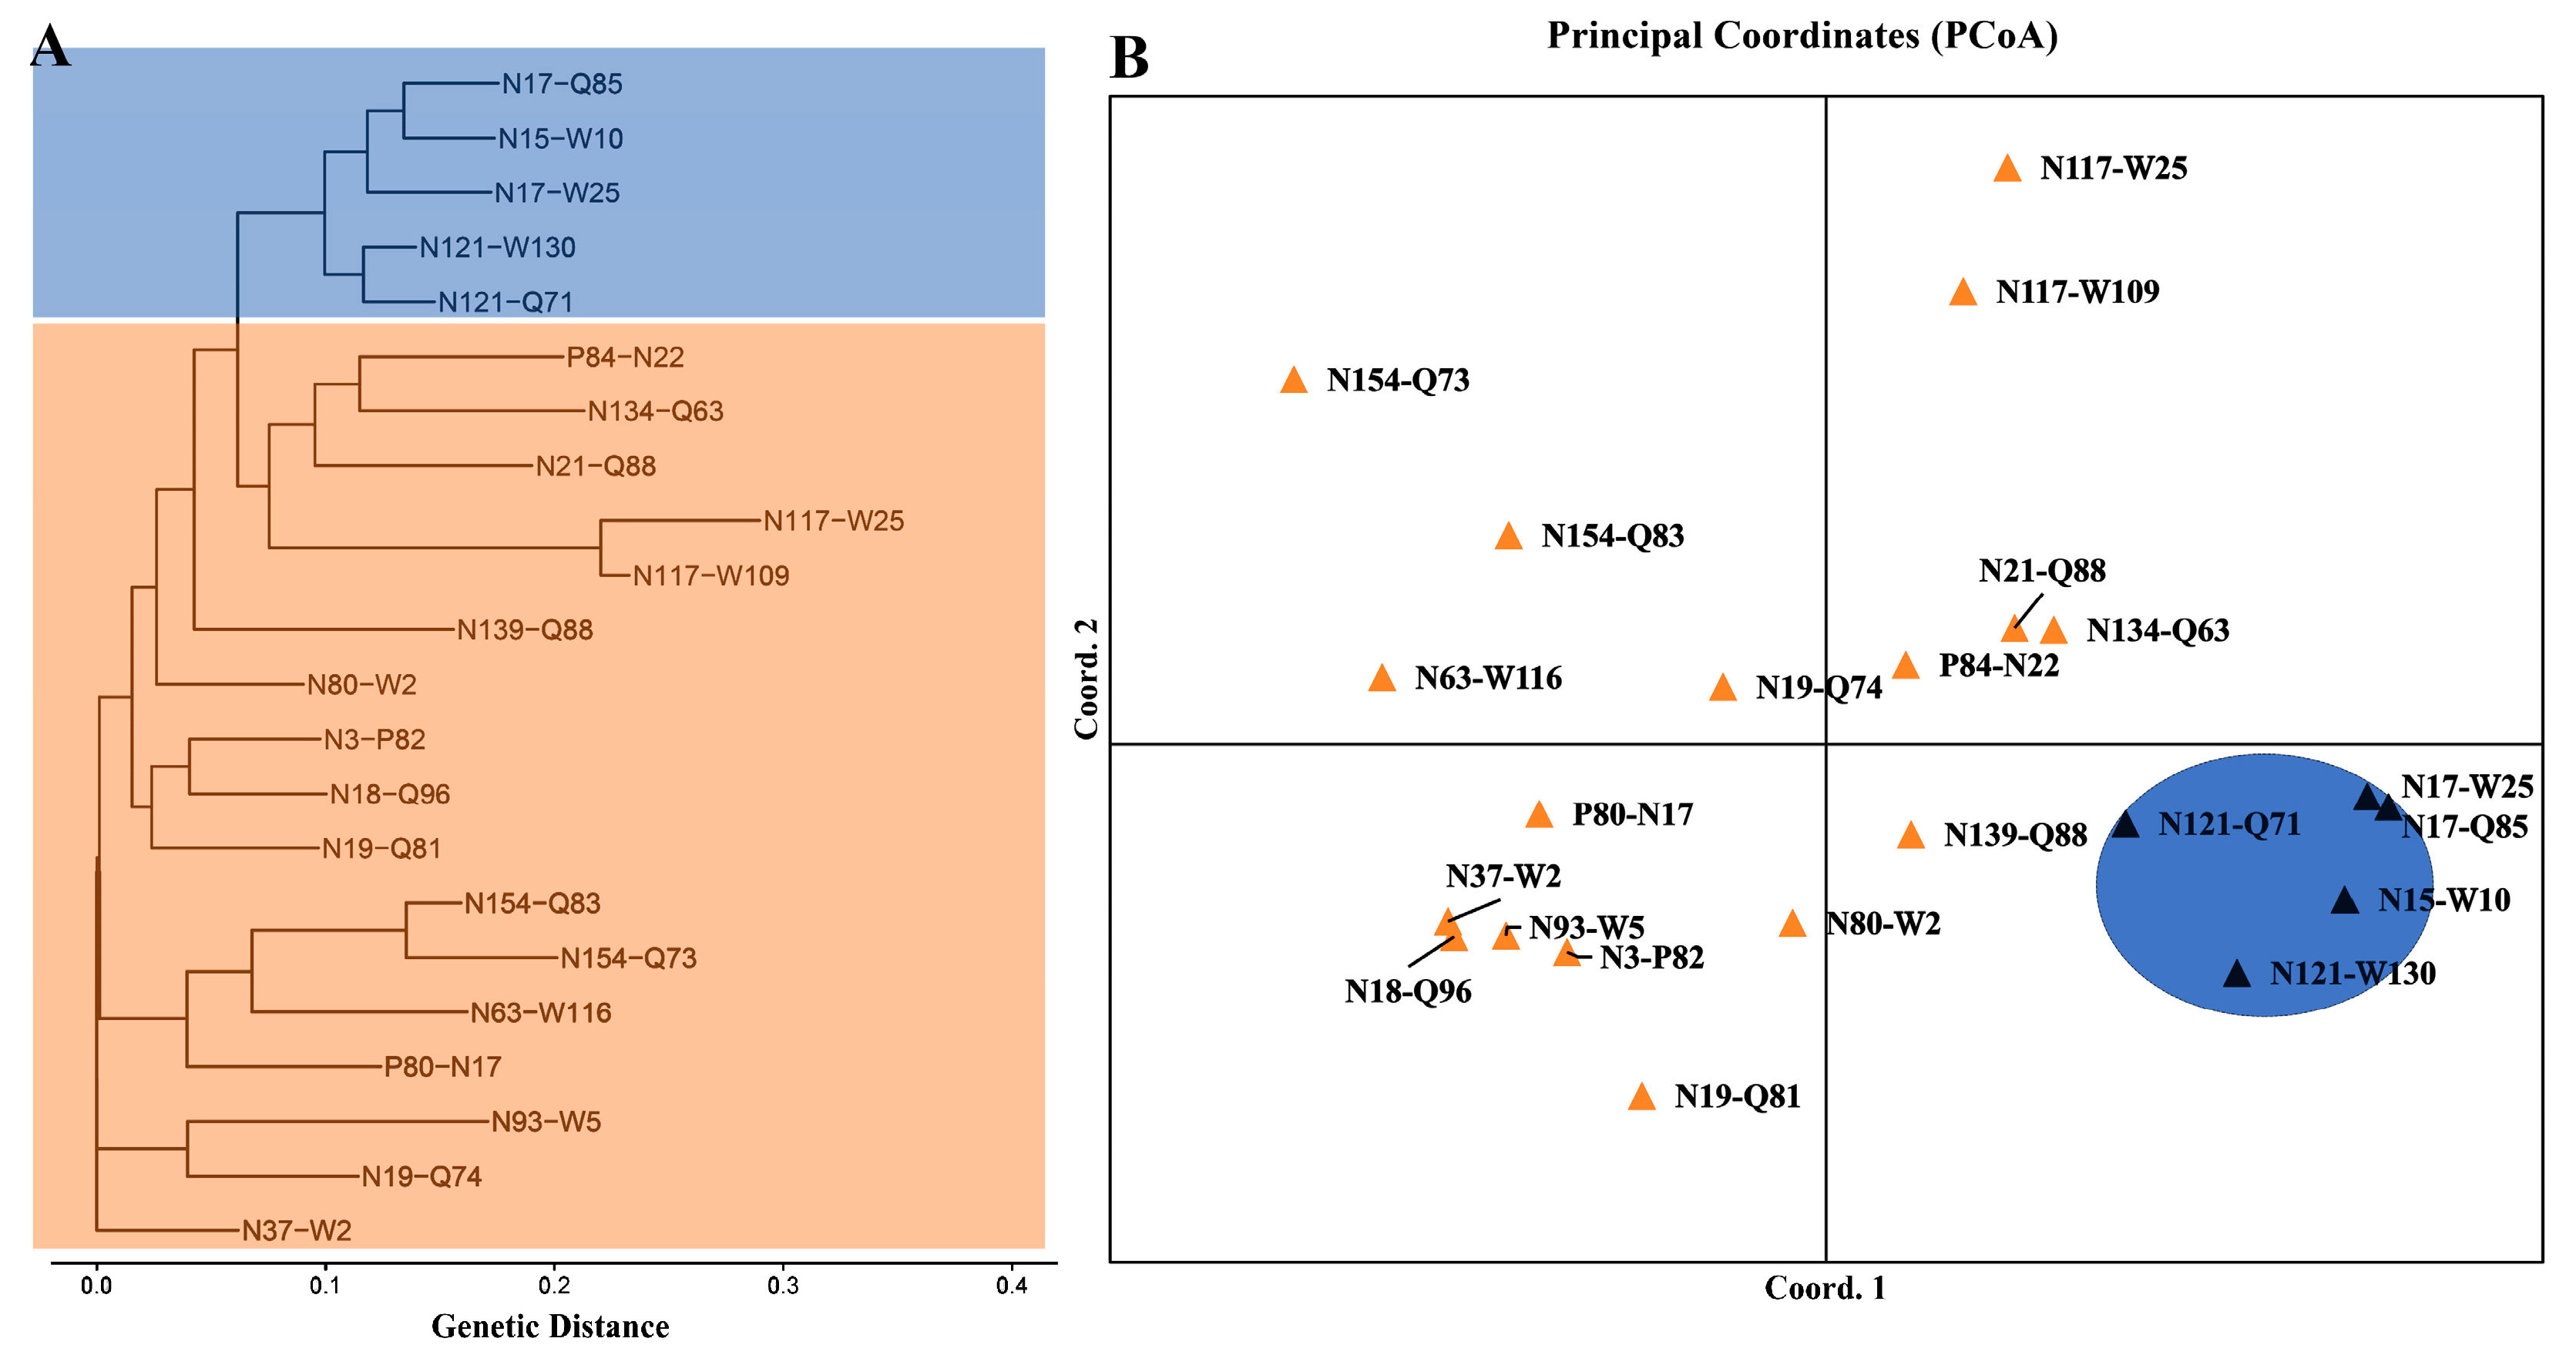
3.3. Genetic Differentiation and Structure

Three clustering methods, including NJ tree, PCoA and STRUCTURE assignment, were employed to categorize the clones and the full-sib progenies, respectively. The Nei’s genetic distance showed that Ningcheng and Qinyuan have the shortest genetic distance (0.087), the largest genetic identity (0.917) and the lowest FST (0.022) (Table S9), supporting their closest genetic relationship. The similar genetic divergence from Qinyuan to Pingquan and Weichang and the highest genetic divergence between Pingquan and Weichang (Table S9) both supported that Weichang and Pingquan were successively sisters to Ningcheng and Qinyuan. However, the NJ tree and PCoA analysis both indicated that no clear divisions or cluster groups were found among clones from these four populations (Figure 1). Nonetheless, the clones from Weichang and Pingquan were clustered in the earlier diverged clades and most clones of Ningcheng and Qinyuan were grouped together in the recently diverged clades (Figure 1). The STRUCTURE showed that all clone individuals can be clustered into two groups (K = 2) based on the maximum lnP(D) and delta K values (Figure 2). However, the genetic groups of the clones were not correlated with the geographic populations but rather with the genetic components. That is, all the clones contained two genetic groups despite their different proportions (Figure 2). The result of AMOVA showed that 2% of the total genetic variation was partitioned among clone populations and 98% of the total variation was explained by genetic variation within the clone population (Table 3).
For the full-sib progenies, the NJ tree showed that 22 full-sib families can be clustered into two clades. The first clade included the families of N121-Q71, N121-W130, N15-W10, N17-Q85 and N17-W24; the second clade comprised the remaining 17 families. The result of PCoA also supported the genetic relationships revealed by the NJ tree (Figure 3). These two genetic clades (K = 2) were also recovered in the population structure of the 22 full-sib families according to the peaks of lnP(D) and delta K values (Figure 4). Of note, a clear genetic mixture between these two clades was observed (Figure 4). The result of AMOVA indicated that 89% of the total genetic variation was partitioned within each of the full-sib families, and only 11% of the total variation was explained by the genetic variation among the full-sib families (Table 3).

4. Discussion

Comprehensive information about the genetic diversity and population structure are considered to be prerequisites for management and breeding programs, as their distribution and extent, measured by the variation in allelic frequencies and genetic composition within a population, is often integral to the capacity of adaptation, evolution and maintenance of populations [43,44]. In this study, the application of SSR markers proved to be efficient in evaluating the variability of the clone populations and full-sib families of P. tabuliformis. Although several reports have investigated the genetic diversity and population structure of clone populations and full-sib families of P. tabuliformis [26,36], the presented SSR data in terms of the genetic diversity of P. tabuliformis should also be considered as an important genetic source for future breeding plans. In addition, this is the first study to investigate the genetic diversity of both the clones and the full-sib progenies via biparental crosses. Our results showed that the selected SSR markers in this study were highly informative and polymorphic, with the number of effective alleles (Ne) varying from 2.404 to 2.795, lower than those of the natural populations of P. tabuliformis [26] but higher than those of the seed orchard of Pingquan [36]. Ne has been considered as an important parameter that evaluates the number of alleles displaying significant frequency in the population [45,46]. The Shannon diversity index (I) in this study ranged from 0.959 to 1.102, suggesting the existence of high genetic variability within and between the clone populations and the full-sib families. Although the I revealed in this study was much lower than that reported by Zhou et al. [26], high genetic diversity within the examined clone populations and full-sib families was also supported because of the smaller size of samples in this study than in those reported by Zhou et al. [26,47]. Furthermore, the polymorphism information contents (PIC) in this study varied from 0.618 to 0.592, supporting the capacity and efficiency of the selected SSR markers for genetic diversity identification in P. tabuliformis [48]. Of note, the PIC values in this study were higher than those of previously reported SSR markers [26,35,36], and thus the genetic diversity of P. tabuliformis will be overestimated in this study. It has been documented that the use of genomic data can accurately scan the genetic variation of target species populations (e.g., [49]). However, this is seemingly impossible for P. tabuliformis, due to its large genome size [34] and correspondingly huge sequencing costs. Alternatively, developing and using various molecular markers, for example RAPD and ISSR, to screen the genetic diversity for clonal identity and progeny test is also effective and powerful for forestry trees and crops [50,51,52,53].
The expected heterozygosity (He) is an important parameter in measuring gene diversity [54]. Moderately high genetic diversity was found for both the clones and the full-sib progenies of P. tabuliformis (mean Ho of 0.636/0.634; mean He of 0.605/0.542). Such genetic variability within accessions from P. tabuliformis was similar to that of the natural individuals from different geographic populations of P. tabuliformis [26] but higher than that of samples of P. tabuliformis from Pingquan [40]. Meanwhile, the genetic diversity of examined samples of P. tabuliformis was higher than that of some Pinus species, such as P. strobus (He of 0.531) [55], P. tabuliformis (He of 0.529) [56], P. koraiensi (He of 0.521) [12], or similar to that of some other Pinus species, such as P. echinata (mean He of 0.765) [57], P. cembra (mean He of 0.581) [58], and P. densiflora (mean He of 0.671) [59]. This moderately high genetic variability within and between the examined clone populations of P. tabuliformis may be a result of a wind outcrossing (FIS = −0.053) and the unique reproductive biology characteristics of P. tabuliformis [60]. As a typical wind-pollinated plant, the pollen of P. tabuliformis can spread over 85 m and promote gene flow within populations [61]. Meanwhile, the winged seeds of P. tabuliformis can travel longer distances than its pollen and promote gene flow within and between populations. This will further increase the genetic diversity of P. tabuliformis via genomic combination. Of note, higher gene flow (Nm = 3.881) and lower genetic differentiation (FST = 0.076) were found for clonal populations of P. tabuliformis. The three clustering methods supported no clear genetic isolation between the clone populations. The optimal K (=2) value indicated that all clones comprised two genetic clusters. We thus concluded that all clones were generated from the same progenitors. According to the bio-ecological characters of P. tabuliformis, we speculated that the wind dispersal pattern and long generation time might have lessened genetic divergence within and between clonal populations by homogenizing genetic variation that has accumulated along generation time despite little such accumulation. However, lower gene flow (Nm = 1.546) and higher genetic differentiation (FST = 0.155) were observed in the full-sib progenies. The controlled pollination between the known clones from different populations (with FIS = −0.165) to generate the F1 progenies of full-sib families might have limited pollen/seed flow between full-sib families. The clustering analyses of the 22 full-sib families showed that they formed two groups. This supported the capacity of SSR markers to efficiently categorize the families based on the existence of genetic homogeneity and heterogeneity. In this study, the full-sib families that were clustered together presented a greater level of genetic similarity, regardless of whether they shared one progenitor; for example, the families of N121-Q71, Q121-W130, N15-W10, N17-Q85 and N17-W24 were clustered together and showed similar genetic structure as well as a pattern similar to those of the remaining families. We thus speculated that the higher genetic differentiation between full-sib progenies may be due to the hybrid effects already described in biparental crosses, for example, nucleo-cytoplasmic interaction and maternal effect. That there is no significant correlation between the genetic diversity of the full-sib progenies and between-clone genetic distances also supports that genetic differentiation between biparental clones likely cannot directly determine the genetic diversity of hybrid progenies. Previous phylogeographical studies showed that natural populations of P. tabuliformis can be divided into three geographical clades and derived from different ancient lineages [62,63]. Compared to other forest trees, for example P. albicaulis [27], P. pinaster [28], Abies alba [29] and Picea jezoensis [30], natural populations of P. tabuliformis show lower total and mean genetic diversity [62,63]. These comparisons suggest that different geographical clades of P. tabuliformis should be protected to avoid habitat fragmentation, genetic diversity loss and population extinction. This also suggests that elite plants selected from different natural germplasm sources can be used for afforestation in the same region, as gene flow between them would increase the genetic diversity and promote the adaptation capacity of novel varieties of P. tabuliformis. In addition, considering the diverse genetic components of each of the progenies, biparental crosses between different clones are suggested in future breeding to provide a large amount of genetic diversity in the progenies [64].
The molecular variance analysis (AMOVA) measures the total variation of a species within and between populations. The AMOVA showed that the highest proportion of genetic variation was found within clone populations (98%), with a relatively lower variation between populations (2%). Such a genetic variation pattern has been frequently reported in tree species populations, such as in Jatropha curcas [5] and in other Pinus species [12,56], as well as in the natural populations and cultivated varieties of P. tabuliformis [26,32,52]. From these results, it was recommended that the internal variance of P. tabuliformis should be fully considered to avoid genetic narrowing and future gain compromise during the recurrent selection and recombination. Meanwhile, a similar genetic distribution pattern was detected within the full-sib families, with a significant increase of genetic differentiation between progenies (11% of the total variance portioned among families) compared to that of the clonal population (2%). The distribution and extent of genetic variation within and between the 22 full-sib families suggests plentiful genetic diversity within individual families, and such variation can be used in future breeding, although there is no consensus for how to consider the larger internal variance and the smaller variance among families during breeding [65,66]. A high-quality genome assembly of P. tabuliformis [30] has provided an opportunity to use genome-wide association study (GWAS) to combine phenotypes and genetic variation for the present accessions. Such an association will be useful for the selection of elite plants or the performance of new biparental crosses between more divergent samples to maximize heterotic effect and create more new varieties.
Pinus tabuliformis plays an important ecological and economic role in China and provides forest, wood and resin by-products. However, overlogging of natural forests over a sustained period has led to a dramatic reduction of natural forest cover and rapid decrease of genetic diversity among its remaining species populations. Plantation forests are a useful and effective avenue for restoring P. tabuliformis by selecting elite plants with some superior characteristics. However, afforestation often results in 100% monospecific forests, and consequently the planted forests are sensitive to disease and insect pest incidence. Thus, a better understanding of the extent and distribution of genetic diversity of the plants used for afforestation is essential for long-term strategies to maintain the health and sustainability of P. tabuliformis [66]. In this study, clone crosses created many diverse progenies, although little genetic differentiation was observed between clones. This provides a clue that biparental crosses may create new varieties to enrich the existing genetic pool of P. tabuliformis. In this way, more full-sib progenies can be created for afforestation through biparental crosses, especially those involving natural elite plants with higher genetic variability [62,63]. Given the long-distance dispersal ability and outcrossing of P. tabuliformis, ecological forests can be planted in areas close to natural forests to reinforce gene flow [3,49] and consequently the enriched genetic diversity will increase population evolutionary potential in novel environments, as well as adaptation to climate changes and habitat fragmentation.

5. Conclusions

The selected 21 polymorphic SSR markers in this study were useful and efficient, enabling the evaluation of moderately high genetic diversity, the identification of two distinct genetic groupings for both the clones and full-sib progenies, and the estimation of the distribution of genetic variation within and between the populations or families of P. tabuliformis. The same origin pattern of all the clones, long generation time and wind-dispersal traits of pollen, might have led to lessened genetic differentiation between the clones, while the genetic diversity and controlled pollination of biparental crosses have laid the foundation of genetic variation and differentiation between the full-sib progenies. Genetically diverse progenies have been generated via different biparental crosses in spite of the slight genetic differentiation between parents. This suggests that biparental crosses between the selected elite clones would generate novel varieties. A high proportion of the genetic variation of the examined clones and progenies was found to be partitioned within individual populations or families, suggesting plentiful internal variation. For breeding programs, it is feasible to consider both the larger internal variance and the smaller variation among populations or families, because even a little genetic variation between populations or families will lead to the formation of diverse genetic variation, such as biparental crosses between the clones with lower genetic differentiation and similar genetic components. This study provides genetic materials for future breeding by using a genome-wide association study to investigate the association between novel phenotypes and genetic variation among these accessions of P. tabuliformis.

Supplementary Materials

The following supporting information can be downloaded at: https://www.mdpi.com/article/10.3390/horticulturae9111205/s1. Table S1 Information about the clones and the full-sib progenies; Table S2 Information about SSR Primers; Table S3 Hardy–Weinberg equilibrium test at each SSR locus for clones; Table S4 Hardy–Weinberg equilibrium test at each SSR locus for full-sib progenies; Table S5 Genetic parameters of clones at each SSR locus; Table S6 Genetic parameters of full-sib progenies at each SSR locus; Table S7 Genetic divergence and variation of clones at each SSR locus; Table S8 Genetic divergence and variation of full-sib progenies at each SSR locus; Table S9 Genetic distance, genetic identity and genetic differentiation between pairwise populations of clones; Table S10 Genetic distance between clones used for crossing combinations; Table S11 Identification rate of hybrid progenies for each of the clone-crossing combinations; Figure S1 Colinear relationship test between gene diversity within full-sib progenies and between-clone genetic distances; Figure S2 Identification rate of hybrid progenies at each SSR locus.

Author Contributions

Conceptualization, S.G. and G.Z.; methodology, S.G.; software, P.J.; validation, P.J., J.W. and Y.Z.; formal analysis, P.J., Y.H. and J.W.; investigation, Y.H. and Y.Y.; resources, Y.Z. and F.Z.; data curation, J.W., Y.H. and Y.Y.; writing original draft preparation, S.G.; writing, review and editing, S.G.; visualization, Y.Z., F.Z. and Y.Y.; supervision, G.Z.; project administration, G.Z.; funding acquisition, G.Z. All authors have read and agreed to the published version of the manuscript.

Funding

This research was funded by the Young Teachers’ Research Ability Improvement Project of Inner Mongolia Agricultural University (grant number BR230161), the Key R&D and Achievement Transformation Plan of Inner Mongolia Autonomous Region (grant number 2023YFDZ0017) and the National Natural Science Foundation of China (grant number 31160167).

Data Availability Statement

All data generated or analyzed during this study are included in this published article [and its Supplementary Information Files]. In addition, the datasets used and/or analyzed during the current study are available from the corresponding author on reasonable request.

Conflicts of Interest

The authors declare no conflict of interest.

References

  1. Brown, W.L. Genetic diversity and genetic vulnerability—An appraisal. Econ. Bot. 1983, 37, 4–12. [Google Scholar] [CrossRef]
  2. Hallauer, A.L.; Carena, M.J. Recurrent selection methods to improve germplasm in maize. Maydica 2012, 57, 266–283. [Google Scholar]
  3. Rao, V.R.; Hodgkin, T. Genetic diversity and conservation and utilization of plant genetic resources. Plant Cell Tissue Organ Cult. 2002, 68, 1–19. [Google Scholar]
  4. Sun, W.; Yu, D.; Dong, M.; Zhao, J.; Wang, X.; Zhang, H.; Zhang, J. Genetic diversity of control-pollinated progenies in seed orchard of Larix gmelinii var. principis-rupprechtii Mayr. Acta Bot. Boreali-Occid. Sin. 2016, 36, 1662–1670. [Google Scholar]
  5. Duarte, A.B.; Gomes, W.S.; Nietsche, S.; Pereira, M.C.T.; Rodrigues, B.R.A.; Ferreira, L.B.; Paixão, P.T.M. Genetic diversity between and within full-sib families of Jatropha using ISSR markers. Ind. Crops Prod. 2018, 124, 899–905. [Google Scholar] [CrossRef]
  6. Wang, D.; Shen, B.; Gong, H. Genetic diversity of Simao pine in China revealed by SRAP markers. PeerJ 2019, 7, e6529. [Google Scholar] [CrossRef]
  7. Mei, L.; Wen, X.; Fan, F.; Yang, Z.; Xie, W.; Hong, Y. Genetic diversity and population structure of masson pine (Pinus massoniana Lamb.) superior clones in South China as revealed by EST-SSR markers. Genet. Resour. Crop Evol. 2021, 68, 1987–2002. [Google Scholar] [CrossRef]
  8. Ikeda, H.; Setoguchi, H. A multilocus sequencing approach reveals the cryptic phylogeographical history of Phyllodoce nipponica Makino (Ericaceae). Biol. J. Linn. Soc. 2013, 110, 214–226. [Google Scholar] [CrossRef]
  9. Li, M.; Xie, D.; Xie, C.; Deng, Y.; Zhong, Y.; Yu, Y.; He, X. A Phytogeographic Divide Along the 500 mm Isohyet in the Qinghai-Tibet Plateau: Insights From the Phylogeographic Evidence of Chinese Alliums (Amaryllidaceae). Front. Plant Sci. 2019, 10, 149. [Google Scholar] [CrossRef]
  10. Lv, J.; Li, C.; Zhou, C.; Chen, J.; Li, F.; Weng, Q.; Li, M.; Wang, Y.; Chen, S.; Chen, J.; et al. Genetic diversity analysis of a breeding population of Eucalyptus cloeziana F. Muell. (Myrtaceae) and extraction of a core germplasm collection using microsatellite markers. Ind. Crops Prod. 2020, 145, 112157. [Google Scholar] [CrossRef]
  11. de Lima, E.A.; da Silva, H.D.; Lavoranti, O.J. Dendroenergetical characterization of Eucalyptus benthamii trees. Pesq. Florest. Bras. 2011, 31, 9–17. [Google Scholar] [CrossRef]
  12. Li, S.; Li, J.; Pan, Y.; Hu, X.; Nan, X.; Liu, D.; Li, Y. Variation analyses of controlled pollinated families and parental combining ability of Pinus koraiensis. J. For. Res. 2021, 32, 1005–1011. [Google Scholar] [CrossRef]
  13. Hodge, G.R.; Volker, P.W.; Potts, B.M.; Owen, J.V. A comparison of genetic information from open-pollinated and control-pollinated progeny tests in two eucalypt species. Theor. Appl. Genet. 1996, 92, 53–63. [Google Scholar] [CrossRef] [PubMed]
  14. Singh, V.; Sastry, E.V.D.; Singhania, D.L. Comparison of full sib, half sib and S1 progenies in fennel (Foeniculum vulgare Mill.). J. Spices Aromat. Crops 2004, 13, 129–131. [Google Scholar]
  15. Brauner, P.C.; Müller, D.; Molenaar, W.S.; Melchinger, A.E. Genomic prediction with multiple biparental families. Theor. Appl. Genet. 2020, 133, 133–147. [Google Scholar] [CrossRef] [PubMed]
  16. Grattapaglia, D.; Silva-Junior, O.B.; Resende, R.T.; Cappa, E.P.; Müller, B.S.F.; Tan, B.; Isik, F.; Ratcliffe, B.; El-Kassaby, Y.A. Quantitative Genetics and Genomics Converge to Accelerate Forest Tree Breeding. Front. Plant Sci. 2018, 9, 1693. [Google Scholar] [CrossRef]
  17. Resende, R.T.; Resende, M.D.V.; Silva, F.F.; Azevedo, C.F.; Takahashi, E.K.; Silva-Junior, O.B.; Grattapaglia, D. Assessing the expected response to genomic selection of individuals and families in Eucalyptus breeding with an additive-dominant model. Heredity 2017, 119, 245–255. [Google Scholar] [CrossRef] [PubMed]
  18. Awata, L.A.O.; Tongoona, P.; Danquah, E.; Efie, B.E.; Marchelo-Dragga, P.W. Common mating designs in agricultural research and their reliability in estimation of genetic parameters. IOSR J. Agric. Vet. Sci. 2018, 11, 16–36. [Google Scholar]
  19. Vencovsky, R.; Ramalho, M.A.P.; Toledo, F.H.R.B. Contribution and perspectives of quantitative genetics to plant breeding in Brazil. Crop Breed. Appl. Biotechnol. 2012, 12, 07–14. [Google Scholar] [CrossRef]
  20. Zietkiewicz, E.; Rafalski, A.; Labuda, D. Genome fingerprinting by simple sequence repeat (SSR)-anchored polymerase chain reaction amplification. Genomics 1994, 20, 176–183. [Google Scholar] [CrossRef]
  21. Zhou, Q.; Mu, K.; Ni, Z.; Liu, X.; Li, Y.; Xu, L.-A. Analysis of genetic diversity of ancient Ginkgo populations using SSR markers. Ind. Crops Prod. 2020, 145, 111942. [Google Scholar] [CrossRef]
  22. Hassanpour, H.; Hamidoghli, Y.; Samizadeh, H. Estimation of genetic diversity in some Iranian cornelian cherries (Cornus mas L.) accessions using ISSR markers. Biochem. Syst. Ecol. 2013, 48, 257–262. [Google Scholar] [CrossRef]
  23. Ferreira, V.; Castro, I.; Rocha, J.; Crespí, A.L.; Pinto-Carnide, O.; Amich, F.; Almeida, R.; Carnide, V. Chloroplast and nuclear DNA studies in Iberian Peninsula endemic Silene scabriflora subspecies using cpSSR and ISSR markers: Genetic diversity and phylogenetic relationships. Biochem. Syst. Ecol. 2015, 61, 312–318. [Google Scholar] [CrossRef]
  24. Mellicka, R.; Rossettoa, M.; Allena, C.; Wilsond, P.D.; Hillc, R.S.; Loweb, A. Intraspecific Divergence Associated with a Biogeographic Barrier and Climatic Models Show Future Threats and Long-Term Decline of a Rainforest Conifer. Open Conserv. Biol. J. 2013, 7, 1–10. [Google Scholar] [CrossRef]
  25. Miao, Y.; Gao, C.; Li, J.; Liu, Z.; Cui, K. Genetic diversity, population structure and a core collection establishment of Pinus yunnanensis using microsatellite markers. Eur. J. For. Res. 2023, 142, 1439–1451. [Google Scholar] [CrossRef]
  26. Zhou, B.; Zhang, Z.; Li, Y.; Ma, Y.; Zhang, S.; Niu, S.; Li, Y. Genetic diversity, genetic structure, and germplasm source of Chinese pine in North China. Eur. J. For. Res. 2023, 142, 183–195. [Google Scholar] [CrossRef]
  27. Richardson, B.A.; Klopfenstein, N.B.; Brunsfeld, S.J. Assessing clark’s nutcracker seed-caching flights using maternally inherited mitochondrial DNAof whitebark pine. Can. J. Res. 2002, 32, 1103–1107. [Google Scholar] [CrossRef]
  28. Burban, C.; Petit, R.J. Phylogeography of maritime pine inferred with organelle markers having contrasted inheritance. Mol. Ecol. 2003, 12, 1487–1495. [Google Scholar] [CrossRef]
  29. Liepelt, S.; Bialozyt, R.; Ziegenhagen, B. Wind-dispersed pollen mediates postglacial gene flow among refugia. Proc. Natl. Acad. Sci. USA 2002, 99, 14590. [Google Scholar] [CrossRef]
  30. Aizawa, M.; Yoshimaru, H.; Saito, H.; Katsuki, T.; Kawahara, T.; Kitamura, K.; Shi, F.; Kaji, M. Phylogeography of a northeast Asian spruce, Picea jezoensis, inferred from genetic variation observed in organelle DNA markers. Mol. Ecol. 2007, 16, 3393–3405. [Google Scholar] [CrossRef]
  31. Sander, H.; Meikar, T. Exotic coniferous trees in Estonian forestry after 1918. Allg. Forst Jagdztg. 2009, 180, 158–169. [Google Scholar]
  32. Jin, W.T.; Gernandt, D.S.; Wehenkel, C.; Xia, X.M.; Wei, X.X.; Wang, X.Q. Phylogenomic and ecological analyses reveal the spatiotemporal evolution of global pines. Proc. Natl. Acad. Sci. USA 2021, 118, e2022302118. [Google Scholar] [CrossRef] [PubMed]
  33. Fu, L.; Li, N.; Elias, T.S.; Mill, R.R. Pinaceae Lindley. In Flora of China; Raven, P., Wu, Z., Hong, D., Eds.; Science Press: Beijing, China; Missouri Botanical Garden Press: St. Louis, MI, USA, 1999; Volume 4, pp. 11–52. [Google Scholar]
  34. Niu, S.; Li, J.; Bo, W.; Yang, W.; Zuccolo, A.; Giacomello, S.; Chen, X.; Han, F.; Yang, J.; Song, Y.; et al. The Chinese pine genome and methylome unveil key features of conifer evolution. Cell 2022, 185, 204–217.e14. [Google Scholar] [CrossRef] [PubMed]
  35. Wang, J.; Guo, S.; Zhang, Y.; Zhang, F.; Yun, Y.; Zhang, G. Transcriptome Analysis and Novel EST-SSR Marker Development for Pinus tabuliformis Seedlings from Four Provenances. Forests 2023, 14, 1810. [Google Scholar] [CrossRef]
  36. Dai, J.; Dang, L.; Jin, Y.; Zhou, X.; Jia, H.; Zhang, H. Genetic diversity analysis of Pinus tabulaeformis seed orchard based on EST-SSR marker. J. Hebei Agric. Univ. 2021, 44, 72–78. [Google Scholar]
  37. Smouse, P.E.; Banks, S.C.; Peakall, R. Converting quadratic entropy to diversity: Both animals and alleles are diverse, but some are more diverse than others. PLoS ONE 2017, 12, e0185499. [Google Scholar] [CrossRef]
  38. Liu, K.; Muse, S.V. PowerMarker: An integrated analysis environment for genetic marker analysis. Bioinformatics 2005, 21, 2128–2129. [Google Scholar] [CrossRef]
  39. Kumar, S.; Stecher, G.; Tamura, K. MEGA7: Molecular Evolutionary Genetics Analysis Version 7.0 for Bigger Datasets. Mol. Biol. Evol. 2016, 33, 1870–1874. [Google Scholar] [CrossRef]
  40. Pritchard, J.K.; Wen, X.Q.; Falush, D. Documentation for Structure Software, Version 2.3. Available online: http://web.stanford.edu/group/pritchardlab/structure.html (accessed on 4 October 2023).
  41. Evanno, G.; Regnaut, S.; Goudet, J. Detecting the number of clusters of individuals using the software STRUCTURE: A simulation study. Mol. Ecol. 2005, 14, 2611–2620. [Google Scholar] [CrossRef]
  42. Pritchard, J.K.; Stephens, M.; Donnelly, P. Inference of population structure using multilocus genotype data. Genetics 2000, 155, 945–959. [Google Scholar] [CrossRef]
  43. Jiang, M.; Yan, S.; Ren, W.; Xing, N.; Li, H.; Zhang, M.; Liu, M.; Liu, X.; Ma, W. Genetic diversity of the Chinese medicinal plant Astragali radix based on transcriptome-derived SSR markers. Electron. J. Biotechnol. 2023, 62, 13–20. [Google Scholar] [CrossRef]
  44. Wang, X.; Chen, W.; Luo, J.; Yao, Z.; Yu, Q.; Wang, Y.; Zhang, S.; Liu, Z.; Zhang, M.; Shen, Y. Development of EST-SSR markers and their application in an analysis of the genetic diversity of the endangered species Magnolia sinostellata. Mol. Genet. Genom. 2019, 294, 135–147. [Google Scholar] [CrossRef] [PubMed]
  45. Franco, M.C.; Cassini, S.T.A.; Oliveira, V.R.; Tsai, S.M. Caracterização da diversidade genética em feijão por meio de marcadores RAPD. Pesq. Agropec. Bras. 2001, 36, 381–385. [Google Scholar] [CrossRef]
  46. Gupta, S.; Srivastava, M.; Mishra, G.P.; Naik, P.K.; Chauhan, R.S.; Tiwari, S.K.; Kumar, M.; Singh, R. Analogy of ISSR and RAPD markers for comparative analysis of genetic diversity among different Jatropha curcas genotypes. Afr. J. Biotechnol. 2008, 7, 4230–4243. [Google Scholar]
  47. Nei, M. Analysis of gene diversity in subdivided populations. Proc. Natl. Acad. Sci. USA 1973, 70, 3321–3323. [Google Scholar] [CrossRef]
  48. Guo, Q.; Xue, X.; Hu, X.; He, Y.; Wei, S.; Liu, S.; Zhao, G.; Wang, Z.; Hou, X. Genetic Diversity and Population Structure Analysis of Tree Peony (Paeonia Section Moutan DC.) Germplasm Using Sixteen Functional SSR Markers. Forests 2023, 14, 1945. [Google Scholar] [CrossRef]
  49. Zhang, H.; Zhang, X.; Wu, G.L.; Dong, C.C.; Liu, J.Q.; Li, M.J. Genomic divergence and introgression among three Populus species. Mol. Phylogenet. Evol. 2023, 180, 107686. [Google Scholar] [CrossRef]
  50. Chavhan, R.L.; Sable, S.; Narwade, A.V.; Hinge, V.R.; Kalbande, B.B.; Mukherjee, A.K.; Chakrabarty, P.K.; Kadam, U.S. Multiplex molecular marker-assisted analysis of significant pathogens of cotton (Gossypium sp.). Biocatal. Agric. Biotechnol. 2023, 47, 102557. [Google Scholar] [CrossRef]
  51. Upadhyay, A.; Kadam, U.S.; Chacko, P.M.; Aher, L.; Karibasappa, G.S. Microsatellite analysis to differentiate clones of Thompson Seedless grapevine. Indian J. Hortic. 2010, 67, 260–263. [Google Scholar]
  52. Upadhyay, A.; Kadam, U.S.; Chacko, P.; Karibasappa, G.S. Microsatellite and RAPD analysis of grape (Vitis spp.) accessions and identification of duplicates/misnomers in germplasm collection. Indian J. Hortic. 2010, 67, 8–15. [Google Scholar]
  53. Hinge, V.R.; Shaikh, I.M.; Chavhan, R.L.; Deshmukh, A.S.; Shelake, R.M.; Ghuge, S.A.; Dethe, A.M.; Suprasanna, P.; Kadam, U.S. Assessment of genetic diversity and volatile content of commercially grown banana (Musa spp.) cultivars. Sci. Rep. 2022, 12, 7979. [Google Scholar] [CrossRef] [PubMed]
  54. Du, Q.; Wang, B.; Wei, Z.; Zhang, D.; Li, B. Genetic diversity and population structure of Chinese white poplar (Populus tomentosa) revealed by SSR markers. J. Hered. 2012, 103, 853–862. [Google Scholar] [CrossRef] [PubMed]
  55. Mandák, B.; Hadincová, V.; Mahelka, V.; Wildová, R. European invasion of North American Pinus strobus at large and fine scales: High genetic diversity and fine-scale genetic clustering over time in the adventive range. PLoS ONE 2013, 8, e68514. [Google Scholar] [CrossRef] [PubMed]
  56. Yang, B.; Niu, S.; El-Kassaby, Y.A.; Li, W. Monitoring genetic diversity across Pinus tabuliformis seed orchard generations using SSR markers. Can. J. For. Res. 2021, 51, 1534–1540. [Google Scholar] [CrossRef]
  57. Hendrickson, B. Genetic Diversity and Population Structure of Shortleaf Pine (Pinus echinata) in the Missouri Ozarks. Am. Midl. Nat. 2018, 180, 37–51. [Google Scholar] [CrossRef]
  58. Tóth, E.G.; Tremblay, F.; Housset, J.M.; Bergeron, Y.; Carcaillet, C. Geographic isolation and climatic variability contribute to genetic differentiation in fragmented populations of the long-lived subalpine conifer Pinus cembra L. in the western Alps. BMC Evol. Biol. 2019, 19, 190. [Google Scholar] [CrossRef]
  59. Ahn, J.-Y.; Lee, J.-W.; Hong, K.-N. Genetic diversity and structure of Pinus densiflora Siebold & Zucc. populations in Republic of Korea based on microsatellite markers. Forests 2021, 12, 750. [Google Scholar]
  60. Slatkin, M. Gene flow and selection in a cline. Genetics 1973, 75, 733–756. [Google Scholar] [CrossRef]
  61. Zhang, D.M.; Sun, P.G.; Shen, X.H.; Ru, G.X. Paternity analysis of open- and control-pollinated seeds Collected from a seed orchard of Pinus tabulaeformis. Chin. J. Plant Ecol. 2009, 33, 302–310. [Google Scholar]
  62. Chen, K.M.; Abbott, R.J.; Milne, R.I.; Tian, X.M.; Liu, J.Q. Phylogeography of Pinus tabulaeformis carr. (pinaceae), a domi nant species of coniferous forest in northern china. Mol. Ecol. 2008, 17, 4276–4288. [Google Scholar] [CrossRef]
  63. Xia, H.H. Landscape Genomics of Pinus tabuliformis Carr. and Its Evolutionary History; Beijing Forestry University: Beijing, China, 2019. [Google Scholar]
  64. Cruz, C.D.; Souza Carneiro, P.C. Modelos Biométricos Aplicados ao Melhoramiento Genético. Master’s Thesis, Universidad Federal de Viçosa, Viçosa, Brazil, 2006. [Google Scholar]
  65. Bhering, L.L.; Peixoto, L.d.A.; Ferreira Leite, N.L.S.; Laviola, B.G. Molecular analysis reveals new strategy for data collection in order to explore variability in Jatropha. Ind. Crops Prod. 2015, 74, 898–902. [Google Scholar] [CrossRef]
  66. Laviola, B.G.; Alves, A.A.; Rosado, T.B.; Bhering, L.L.; Formighieri, E.F.; Peixoto, L.d.A. Establishment of new strategies to quantify and increase the variability in the Brazilian Jatropha genotypes. Ind. Crops Prod. 2018, 117, 216–223. [Google Scholar] [CrossRef]
Figure 1. Principal coordinates analysis (A) and neighbor-joining tree (B) of the clones of P. tabulaeformis.
Horticulturae 09 01205 g001
Figure 2. Using the corresponding Delta K statistics (A) and the mean posterior probability (loge P(D) (±SD) values (B) of each K to identify the optimal STRUCTURE assignment (C) of the 35 clones from four populations of P. tabulaeformis (K = 2).
Horticulturae 09 01205 g002
Figure 3. Principal coordinates analysis (A) and neighbor-joining tree (B) of the full-sib progenies of P. tabulaeformis.
Horticulturae 09 01205 g003
Figure 4. Using the corresponding Delta K statistics (A) and the mean posterior probability (loge P(D) (±SD) values (B) of each K to identify the optimal STRUCTURE assignment (C) of the 216 progenies from 22 full-sib families of P. tabuliformis. (K = 2).
Horticulturae 09 01205 g004
Table 1. Information about the four populations of all the cloned individuals.
Orchard NameLocationLongitudeLatitudeNumber of Clones
Qigou Forest Farm National Pinus tabuliformis Seed OrchardPingquan city, Hebei Province118°40′ E41°22′ N3
Heilihe Forest Farm National Pinus tabuliformis Seed OrchardNingcheng County, Inner Mongolia Autonomous Region112°02′ E36°40′ N16
Weichang Longtou Mountain Forest FarmWeichang Manchu and Mongolian Autonomous County, Chengde City, Hebei Province117°12′ E42°18′ N7
Lingkong Mountain National Nature ReserveQinyuan County, Shanxi Province118°25′ E41°35′ N9
Table 2. Genetic diversity of the clone populations and full-sib families. Capital letters in parentheses represent each of the clone populations and correspond to those in the full-sib families.
Population♀-♂ClonesNaNeIHoHe
Clone populationsNingcheng (N)5.2383.2401.2890.6500.662
Pingquan (P)3.0482.6140.9780.6190.577
Qinyuan (Q)4.0482.8211.1240.6300.613
Weichang (W)3.6192.5041.0160.6460.569
Mean3.9882.7951.1020.6360.605
Hybrid progeniesN117-W1093.8572.4741.0310.5810.572
N117-W252.9052.2400.8450.5710.496
N121-Q713.2382.4410.9730.7240.572
N121-W1303.2862.3250.9390.6670.543
N134-Q633.1902.2480.8840.6070.515
N139-Q883.3812.4780.9730.6250.558
N15-W103.9522.4341.0080.6510.556
N154-Q733.4292.3250.9460.6520.537
N154-Q833.4762.5500.9950.5870.552
N17-Q854.0482.5311.0340.6550.569
N17-W253.2862.2360.8850.5970.506
N18-Q963.4762.1850.8910.6220.498
N19-Q743.5712.4860.9960.6400.562
N19-Q813.0952.2430.8880.5710.517
N21-Q883.1902.3510.9310.6290.535
N3-P823.4762.5780.9880.6240.555
N37-W24.0482.6491.0680.6630.583
N63-W1163.2382.2730.8910.6190.507
N80-W23.9522.5501.0480.6800.575
N93-W53.0952.2630.8910.6530.518
P80-N173.2862.4700.9450.6950.532
P84-N224.0482.5651.0510.6330.568
Mean3.4782.4040.9590.6340.542
Table 3. Analysis of Molecular Variance (AMOVA) for the clone populations and the full-sib families.
SamplesSourcedfSSMSEst. Var.%
Clone populationsAmong populations327.6409.2130.1432%
Within populations66458.9756.9546.95498%
Total69486.614 7.097100%
Full-sib familiesAmong families21441.39121.0190.76711%
Within families4102474.2626.0356.03589%
Total4312915.653 6.802100%
Disclaimer/Publisher’s Note: The statements, opinions and data contained in all publications are solely those of the individual author(s) and contributor(s) and not of MDPI and/or the editor(s). MDPI and/or the editor(s) disclaim responsibility for any injury to people or property resulting from any ideas, methods, instructions or products referred to in the content.

