Article

Targeted Metabolome and Transcriptome Analyses Reveal the Molecular Mechanism of Color Variation between Sepals and Petals in Fuchsia hybrida

1
College of Agriculture and Forestry Science, Linyi University, Linyi 276000, China
2
College of Landscape Architecture, Beijing Forestry University, Beijing 100083, China
*
Author to whom correspondence should be addressed.
Horticulturae 2023, 9(11), 1236; https://doi.org/10.3390/horticulturae9111236
Submission received: 21 October 2023 / Revised: 14 November 2023 / Accepted: 14 November 2023 / Published: 16 November 2023

Abstract

:
The sepal color of Fuchsia hybrida is colorful instead of green and usually varies from the petal colors, which greatly increases its ornamental value and attract customers’ preference. However, the potential molecular mechanism underlying the color variation between sepals and petals remains unclear. The present study collected F. hybrida with red sepals and purple petals to explore the key pigments and genes involved in color development using a targeted metabolome and transcriptome. A total of 43 metabolites with diverse hydroxylation, glycosylation, methylation and acylation patterns were isolated and identified by UPLC-MS/MS. The quantification analysis showed that peonidin-3,5-O-diglucoside and malvidin-3,5-O-diglucoside were the most abundant anthocyanins accumulating in the sepals and petals, respectively. Then, six libraries from the sepals and petals were constructed for the transcriptome and 70,135 unigenes were generated. The transcript level of FhF3′H was significantly higher in the sepals, while Fh3′5′H showed more abundant expression in the petals, which can account for the abundant peonidin and malvidin accumulation in the sepals and petals, respectively. The subsequent multiomics analysis showed that both the differentially accumulated anthocyanins and expressed unigenes were enriched in the anthocyanin biosynthesis pathway. Additionally, FhMYBs potentially regulating anthocyanin biosynthesis were screened out by correlation analysis and protein interaction prediction. These findings help to elucidate the molecular mechanisms underlying the color variation between the sepals and petals in F. hybrida.

1. Introduction

Flower color, one of the most attractive ornamental traits, commonly exhibits a wide range of variation among species, cultivars, different floral organs or different regions on the same petals, etc. Notably, higher plants usually possess green sepals, as seen in the famous cutting flowers, including carnations, roses and chrysanthemums, while few grow colorful sepals, such as red sepals in Fuchsia hybrida, Bougainvillea sp. and Anthurium andraeanum [1,2], as well as blue sepals in Hydrangea macrophylla and Delphinium grandiflorum [3,4]. From an evolutionary perspective, the vivid flower colors benefit plants by attracting insects to assist in pollination and fertilization, thus successfully achieving population reproduction [5,6,7,8].
Anthocyanins, a kind of water-soluble compound belonging to flavonoids, are the main pigments endowing vivid flower colors. Based on the different methods of hydroxylation and methylation in the B-ring, the anthocyanin aglycons can be divided into pelargonidin, cyanidin, delphinidin, peonidin, petunidin and malvidin, which can be further modified by abundant glycosylation and acylation, leading to the diverse exhibition of flower colors. Usually, the pelargonidin and cyanidin derivatives endow red colors of different degrees, such as chrysanthemums, petunias and Euphorbia pulcherrima [9,10,11]. Additionally, the hyperaccumulation of cyanidin derivatives often generates darker-red to black flowers, such as in the cases of cornflowers and dahlias [12,13]. The natural accumulation of delphinidin derivatives often develops blue flower colors, which leads to the blue color innovation in roses, carnations and chrysanthemums by genetic engineering [14,15,16]. Apart from endowing flower colors, the anthocyanin accumulation can also protect plants from abiotic and biotic stresses [17,18,19]. Moreover, the natural anthocyanins benefit human health for their antioxidant activities [20,21]. Therefore, anthocyanins have remained popular topics in the literature in recent years.
There are a series of enzymes involved in the anthocyanin biosynthesis, including phenylalanine ammonia lyase (PAL), cinnamate-4-hydroxylase (C4H), 4-coumarate: CoA ligase (4CL), chalcone synthase (CHS), chalcone isomerase (CHI), flavanone-3-hydroxylase (F3H), flavonoid 3′-hydroxylase (F3′H), flavonoid 3′5′-hydroxylase (F3′5′H), dihydroflavonol 4-reductase (DFR), anthocyanidin synthase (ANS), glycosyltransferase (GT), acyltransferase (AT) and methyltransferase (MT), in which F3H, F3′H and F3′5′H are the key enzymes catalyzing the pelargonidin, cyanidin and delphinidin flux, respectively [22,23]; the MT enzyme plays an important role in generating peonidin, petunidin and malvidin aglycons, which possess methyl modifications in their B-rings [24,25]. These structural genes are regulated by upstream transcription factors composed of MYB, bHLH and WD40 [22,26].
Fuchsia hybrida, a kind of subshrub belonging to the family Onagraceae, is native to South America and famous for its flowers hanging like inverted bells. Interestingly, its sepals and petals usually exhibit diverse and vivid colors. However, the molecular mechanism of its flower color formation remains to be deeply explored. In this study, the F. hybrida with red sepals and purple petals was used to explore the potential molecular mechanism underlying color variation in different floral organs. A total of six anthocyanin-targeted metabolomes were conducted to dig out different anthocyanins between the sepals and petals, followed by RNA sequencing to screen out key candidate genes involved in the color variation. Subsequently, integrative analyses of multiomics, correlation analysis and protein interaction prediction were together conducted to further obtain the key anthocyanins and candidate genes. This study will provide new knowledge on the color development of sepals and petals and assist the novel color innovation in F. hybrida.

2. Materials and Methods

2.1. Plant Material and Color Phenotype

The F. hybrida flowers possess red sepals and purple petals (Figure 1A). The flower bud with a length of about 1.5 cm was chosen, and its sepals and petals were variously collected for anthocyanin identification and transcriptome analysis (Figure 1B). In order to describe their color phenotypes both qualitatively and quantitatively, the Royal Horticultural Society color chart (RHSCC) (the Royal Horticultural Society 2001, Landon, England) and colorimeter (Avantes AvaSpec-2048 L, Amsterdam, The Netherlands) were used according to our previous method [12]. A total of eleven replicates for each floral organ were measured to obtain the L*, a*, b*, h and C* values.

2.2. Anthocyanin Extraction

The freeze-dried sepals and petals were ground into powder and stored at −80 °C before use. Then, 50 mg of powder was added with the extraction liquid (methanol: water: hydrochloric acid = 500:500:1, v:v:v) for ten minutes, followed by centrifugation at 12,000× g at 4 °C for 3 min. The residue was re-extracted using the same conditions. All the supernatant liquor was collected and filtered through a 0.22 μm membrane, then stored in sample bottles for the UPLC-MS/MS analysis.

2.3. UPLC-MS/MS Analysis

A UPLC-ESI-MS/MS system was used for anthocyanin isolation and identification. A 2 μL sample was injected into the WatersACQUITY BEH C18 column at a flow rate of 350 μL/min at 40 °C. The gradient elution, namely, 0.1% formic acid water (solvent A) and 0.1% formic acid methanol (solvent B), was used as the mobile phase according to the following gradient conditions: 95A:5B (v:v) at 0 min, 50A:50B (v:v) at 6 min, 5A:95B (v:v) at 12 min and 95A:5B (v:v) at 14 min. The ionization was achieved using an ESI source in the positive-ion mode with the parameters set as follows: ion spray voltage (IS), 5500 V; source temperature, 550 °C; curtain gas, 35 psi. The scheduled multiple reaction monitoring (MRM) was applied for the anthocyanin analysis.

2.4. Anthocyanin Identification and Quantification

Anthocyanins were identified according to the standards and MS fragmentation characteristics obtained in the positive-ion mode. Subsequently, the semiquantitative interpretation was conducted by MetWare (http://www.metware.cn/, accessed on 10 September 2023) based on the AB Sciex QTRAP 6500 LC-MS/MS platform, and the regression equations of the calibration curves from a series of standard dilutions are listed in Table S1.

2.5. RNA Isolation, Sequencing, Assembly and Annotation

The RNA of the sepals or the petals was extracted using our previous method with three replicates for each floral organ [27]. Then, 1% agarose gel electrophoresis, a Qubit 4.0 flurometer (Thermo Fisher Scientific, Woodlands, Singapore) and a QSEP400 high-throughput biofragment analyzer (BiOptic Inc., New Taipei City, Chinese Taiwan) were used for the RNA quantification and qualification. A total of 1 μg RNA was used to generate sequencing libraries similar to the previous publication [28]. Illumina Novaseq6000 System was conducted for sequencing, followed by the transcriptome assembly using Trinity and annotation based on the Nr, SwissProt, TrEMBL, KEGG, GO, KOG and Pfam databases.

2.6. Differential Gene Screening, Enrichment Analysis and qRT-PCR Verification

RSEM was firstly applied to estimate the gene expression levels, and then the FPKM (fragments per kilobase of transcript per million fragments mapped) was calculated based on the length. DESeq2 was performed to screen the differentially expressed genes between the two floral organs, followed by the enrichment analysis based on the hypergeometric test [29,30]. Moreover, the qRT-PCR analysis was conducted to verify the gene expression levels using actin for normalization; all the primers are listed in Table S2.

2.7. Correlation Analysis and Protein Interaction Prediction

Pearson’s correlation coefficient was calculated between the key anthocyanins and unigenes, followed by the correlation network visualized by the Cytoscape_v3.6.1 software. The interaction network of the key transcription factors was predicted by the online STRING12.0.

3. Results

3.1. Description of the Flower Color Phenotypes

The RHSCC and colorimeter were together used to describe the flower color phenotypes both qualitatively and quantitatively. By comparing to the RHSCC, the sepal and petal colors were assigned to the Red Group 53C and Purple Group N78A, respectively. The quantitative analysis results showed that the values of a*, b* and h in the sepals were higher than that in the petals, in which the b* value showed the most significant difference, almost thirteen times lower in the petals (Figure 1C).

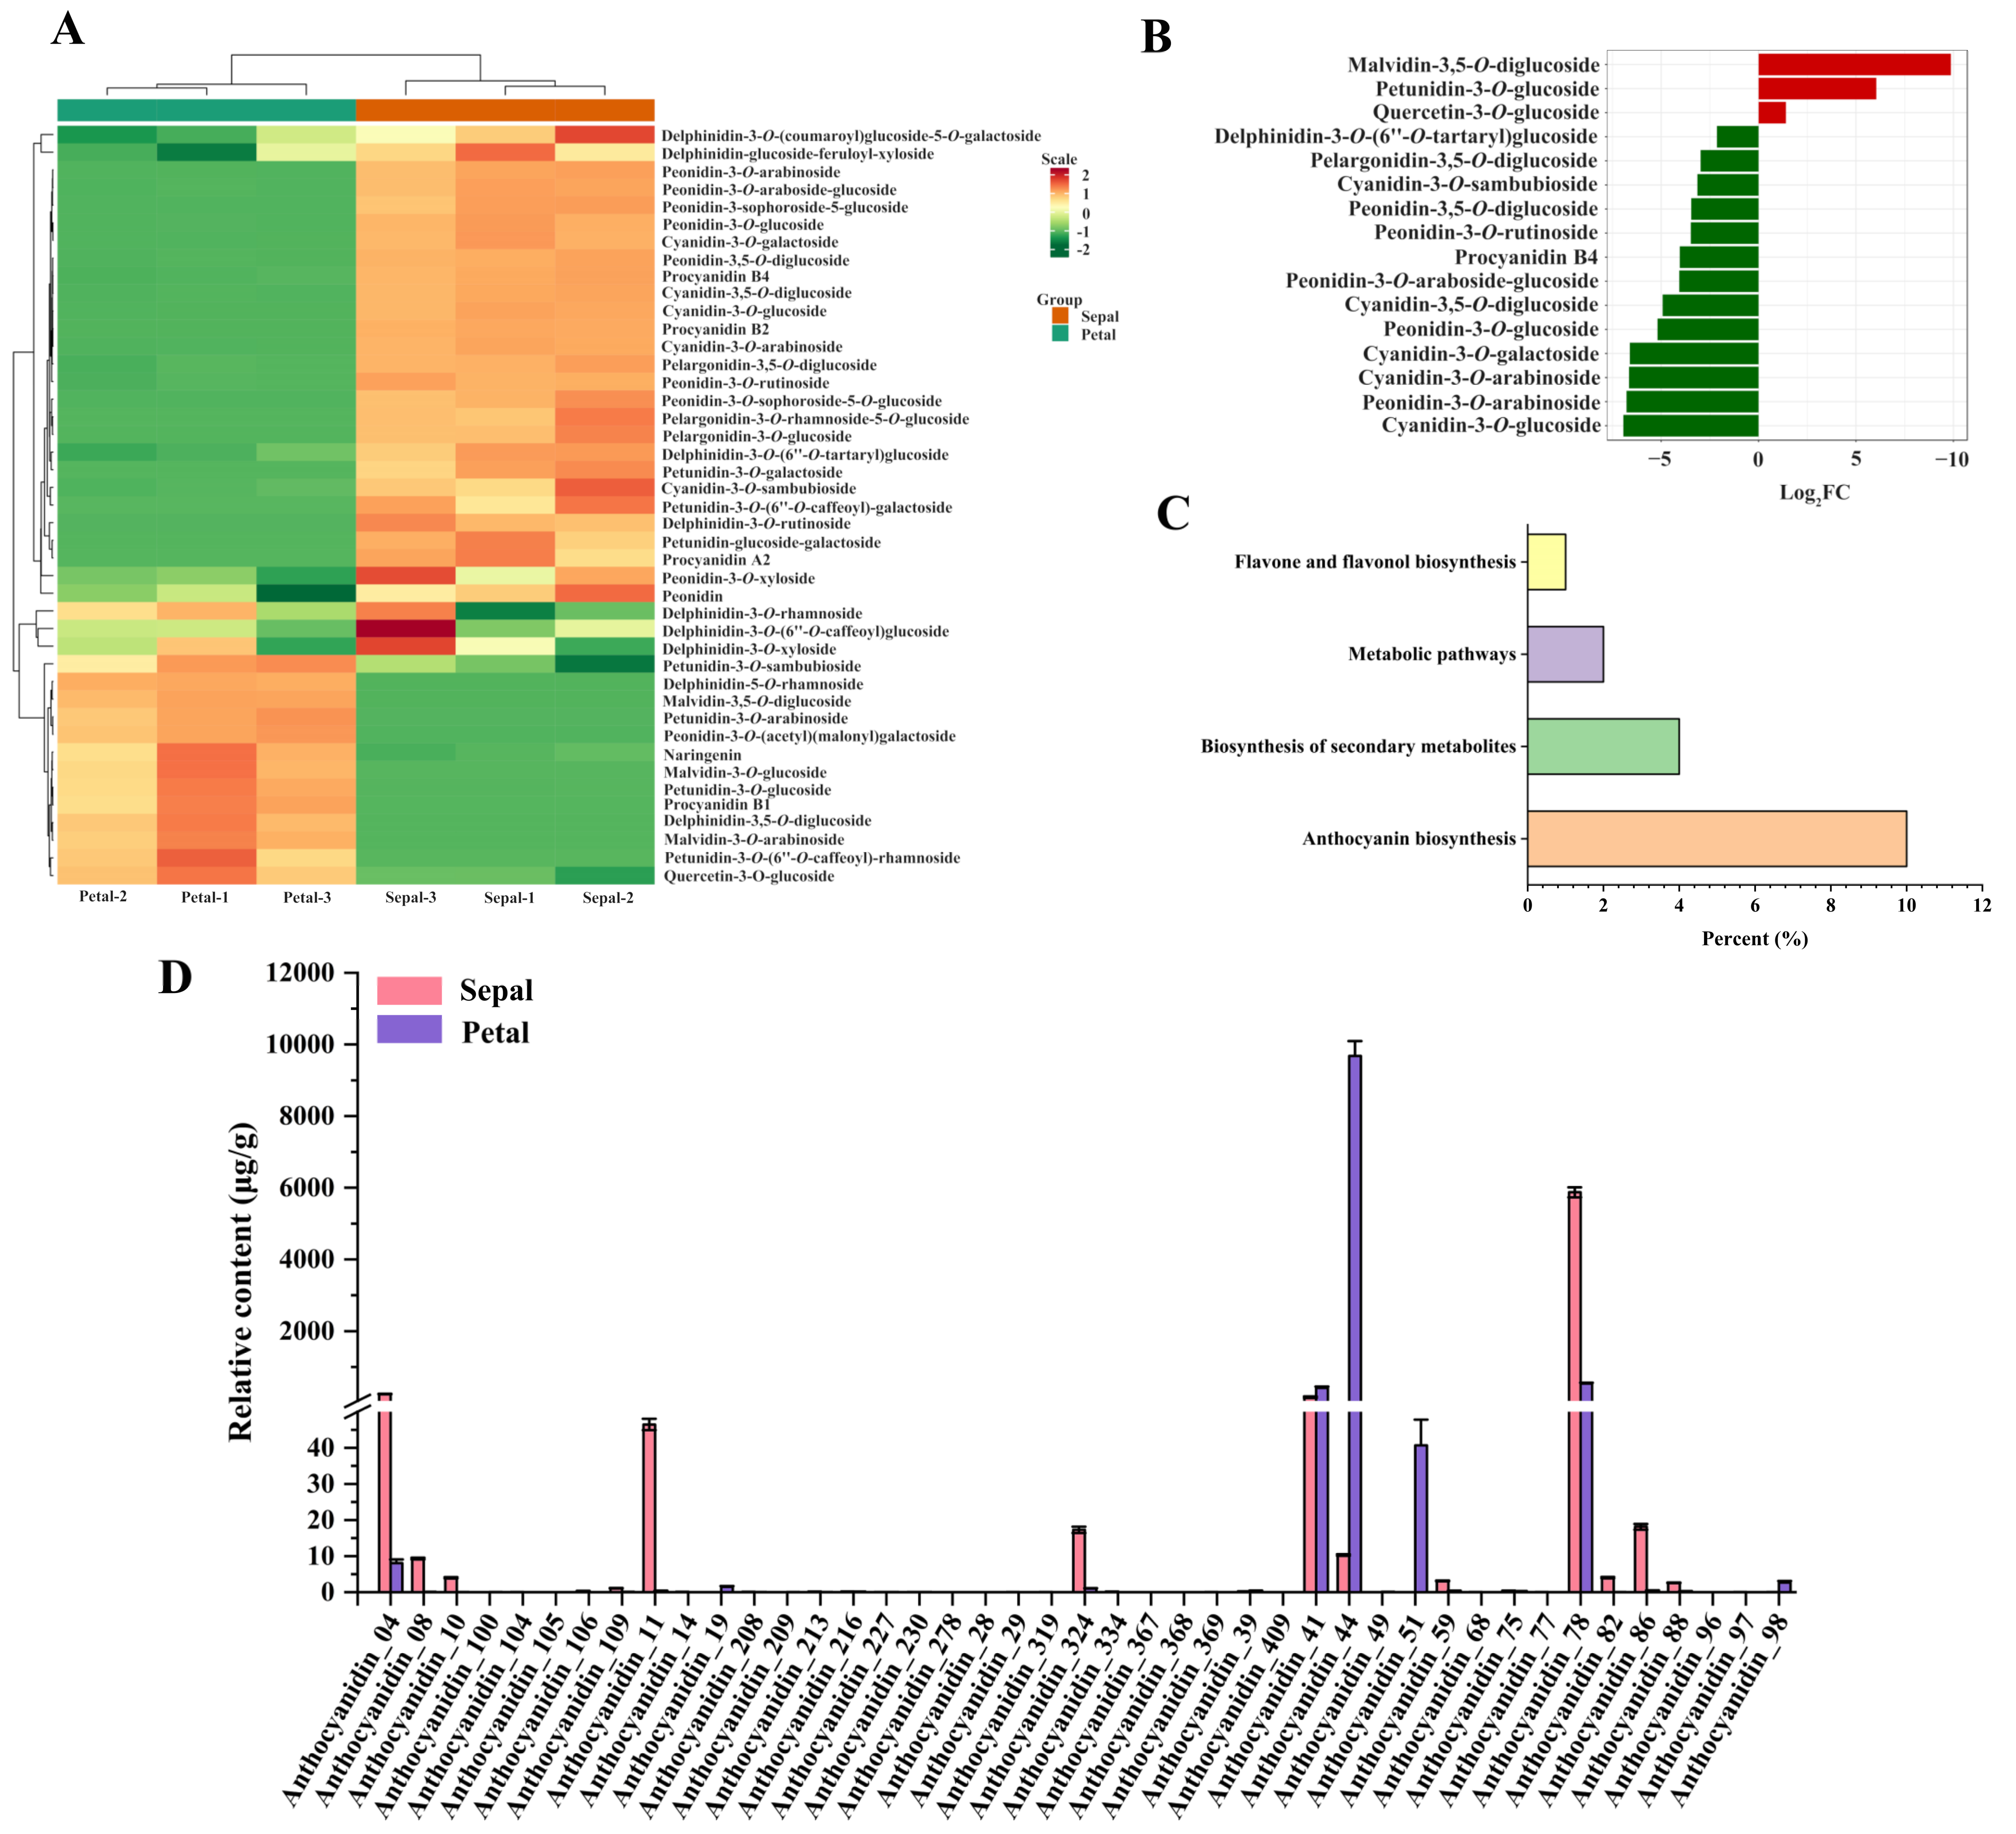
3.2. Identification of Anthocyanins in the Sepals and Petals

In order to explore the potential anthocyanin basis between the sepals and petals of F. hybrida, the targeted metabolome was performed. A total of six metabolomes were conducted to isolate and identify anthocyanins both quantitatively and qualitatively by use of UPLC-MS/MS. Firstly, the coefficient of variation (CV) was calculated to evaluate the stability of the obtained data. All the metabolites showed CV values smaller than 0.3 (Figure S1), suggesting that the obtained data were stable and reliable enough for further analysis. In total, the mass data provided 43 metabolites in the positive-ion mode, including 5 cyanidin derivatives, 3 pelargonidin derivatives, 9 delphinidin derivatives, 3 malvidin derivatives, 10 peonidin derivatives, 7 petunidin derivatives, 4 procyanidins and 2 precursors (Table S3). Interestingly, three methylated anthocyanins were detected, namely, petunidin, peonidin and malvidin, suggesting methylation occurred in the F. hybrida flowers. Moreover, the glycosylation was widely found at the 3-, 5- or 3,5-position in the anthocyanin aglycon, in which the 3-O-glycosylation occupied 58 percent of all the detected anthocyanins (Table S3). The sugar involved in this process included glucose, galactose, arabinose, rhamnose, sambubiose, rutinose, etc., in which glucose played predominant roles. Some anthocyanins were also acylated with caffeic acid, malonic acid, ferulic acid, coumaric acid, etc. These findings revealed that the anthocyanins were widely modified by hydroxylation, methylation, glycosylation and acylation, which may be the main cause of the color variation between the sepals and petals in F. hybrida.

3.3. Differentially Accumulated Anthocyanins between Sepals and Petals

The identified anthocyanins were further quantitatively analyzed using 23 standards. The R2 values of the obtained equations were all no less than 0.99, suggesting the equations were reliable for the quantification analysis (Table S1). Notably, all the detected anthocyanins were clearly clustered into two clades, indicating the anthocyanin accumulation in the sepals and petals was significantly different (Figure 2A). Furthermore, a total of 34 anthocyanins were screened out as differential accumulated anthocyanins (DAAs) between the sepals and petals, with the fold change set as ≥2 or ≤0.5. A total of 11 upregulated and 23 downregulated anthocyanins were screened out, and the fold change in the anthocyanin content was at least 2.6 folds in the petal vs. sepal comparison (Figure 2B). Additionally, the DAAs were mainly enriched in the anthocyanin biosynthesis (90.91%), the biosynthesis of secondary metabolites (36.36%), flavone and flavonol biosynthesis (9.09%) and metabolic pathways (18.18%) (Figure 2C). There were mainly three anthocyanins with contents higher than 50 μg/g, including cyanidin-3,5-O-diglucoside (Cy3G5G, Anthocyanidin_04), malvidin-3,5-O-diglucoside (Ma3G5G, Anthocyanidin_44) and peonidin-3,5-O-diglucoside (Pe3G5G, Anthocyanidin_78). The content of Pe3G5G in the sepals was 5872.3 μg/g, almost eleven times higher than that in the petals. In addition, Cy3G5G and Cyanidin-3-O-glucoside (Cy3G, Anthocyanidin_1) were also more abundant in the sepals. These results indicated that peonidin and cyanidin derivatives were the main cause for the red color development in the sepals. Comparatively, the Ma3G5G content was 9677.6 μg/g in the petals, significantly higher than that in the sepals (10.3 μg/g) (Figure 2D). These results indicated that the hydroxylation modification in the B-ring of the anthocyanidin aglycons from the sepals occurred twice, whereas that in the petals possessed three hydroxylation modifications, which might be the main reason accounting for the blue shift in the petal color.

3.4. RNA-Seq, Assembly, Annotation and Expression

To further explore the potential genetic mechanism underlying the color phenotype and anthocyanin accumulation differences between the sepals and petals in F. hybrida, six transcriptomes were conducted with three replicates in each floral organ. A total of 48.35 Gb clean bases were collected after the low-quality reads were removed, and the Q30 and GC contents were 94.07% and 49.34%, respectively (Table S4). Finally, 141,264 transcripts and 70,135 unigenes were obtained with an N50 of 1649 and 1804, respectively (Figure 3A, Table S4). The mean length of the unigenes was 1362 base pairs, longer than that of the transcripts (Table S4). Furtherly, the unigenes were successfully annotated using the KEGG, Nr, Swissprot, TrEMBL, KOG, GO and Pfam databases, in which 83.31% unigenes were annotated in at least one database (Figure 3B). About 49.24% of the unigenes were annotated into Punica granatum, suggesting the gene sequences in F. hybrida were much more homologous to P. granatum (Figure 3C). Furthermore, the FPKM was used to evaluate the expression levels of the unigenes. The principal component analysis of the unigene FPKM showed that PC1 and PC2 accounted for 46.73% and 13.97% of the variance, respectively. A total of two accessions were clearly separated and three replicates of each floral organ were brought together, suggesting the transcriptomic replicates were of high quality for further analysis (Figure 3D).

3.5. Global View of Transcriptomic Differences between Sepals and Petals

In order to gain more insights into the transcriptomic characters between the sepals and petals, as well as to identify potential candidate genes involved in the anthocyanin biosynthesis in F. hybrida, we focused on screening the differentially expressed genes (DEGs). The DESeq2 software was applied to search the DEGs with the screening condition of |log2Fold Change| ≥ 1 and FDR < 0.05 [29,30]. In total, 9313 DEGs were obtained in the petal vs. sepal comparison, including 4578 downregulated unigenes and 4735 upregulated unigenes (Figure 4A). The heatmap analysis showed that all the DEGs were clearly clustered between the sepals and petals. Two major clusters were observed in the heatmap; the top one being characterized by unigenes more highly expressed in the petals, and the lower one showing the converse trend (Figure 4B). Furthermore, the GO enrichment analysis indicated that the number of upregulated unigenes was higher than the downregulated unigene numbers in most of the GO terms (Figure 4C). In addition, the DEGs were significantly enriched in the pathways involved in environmental information processing, metabolism and organismal systems, and the metabolic pathways as well as the biosynthesis of the secondary metabolites occupied the largest proportion (Figure 4D). Notably, the DEGs involved in the anthocyanin biosynthesis were also enriched, which was consistent with the different accumulations of anthocyanins in the sepals and petals.

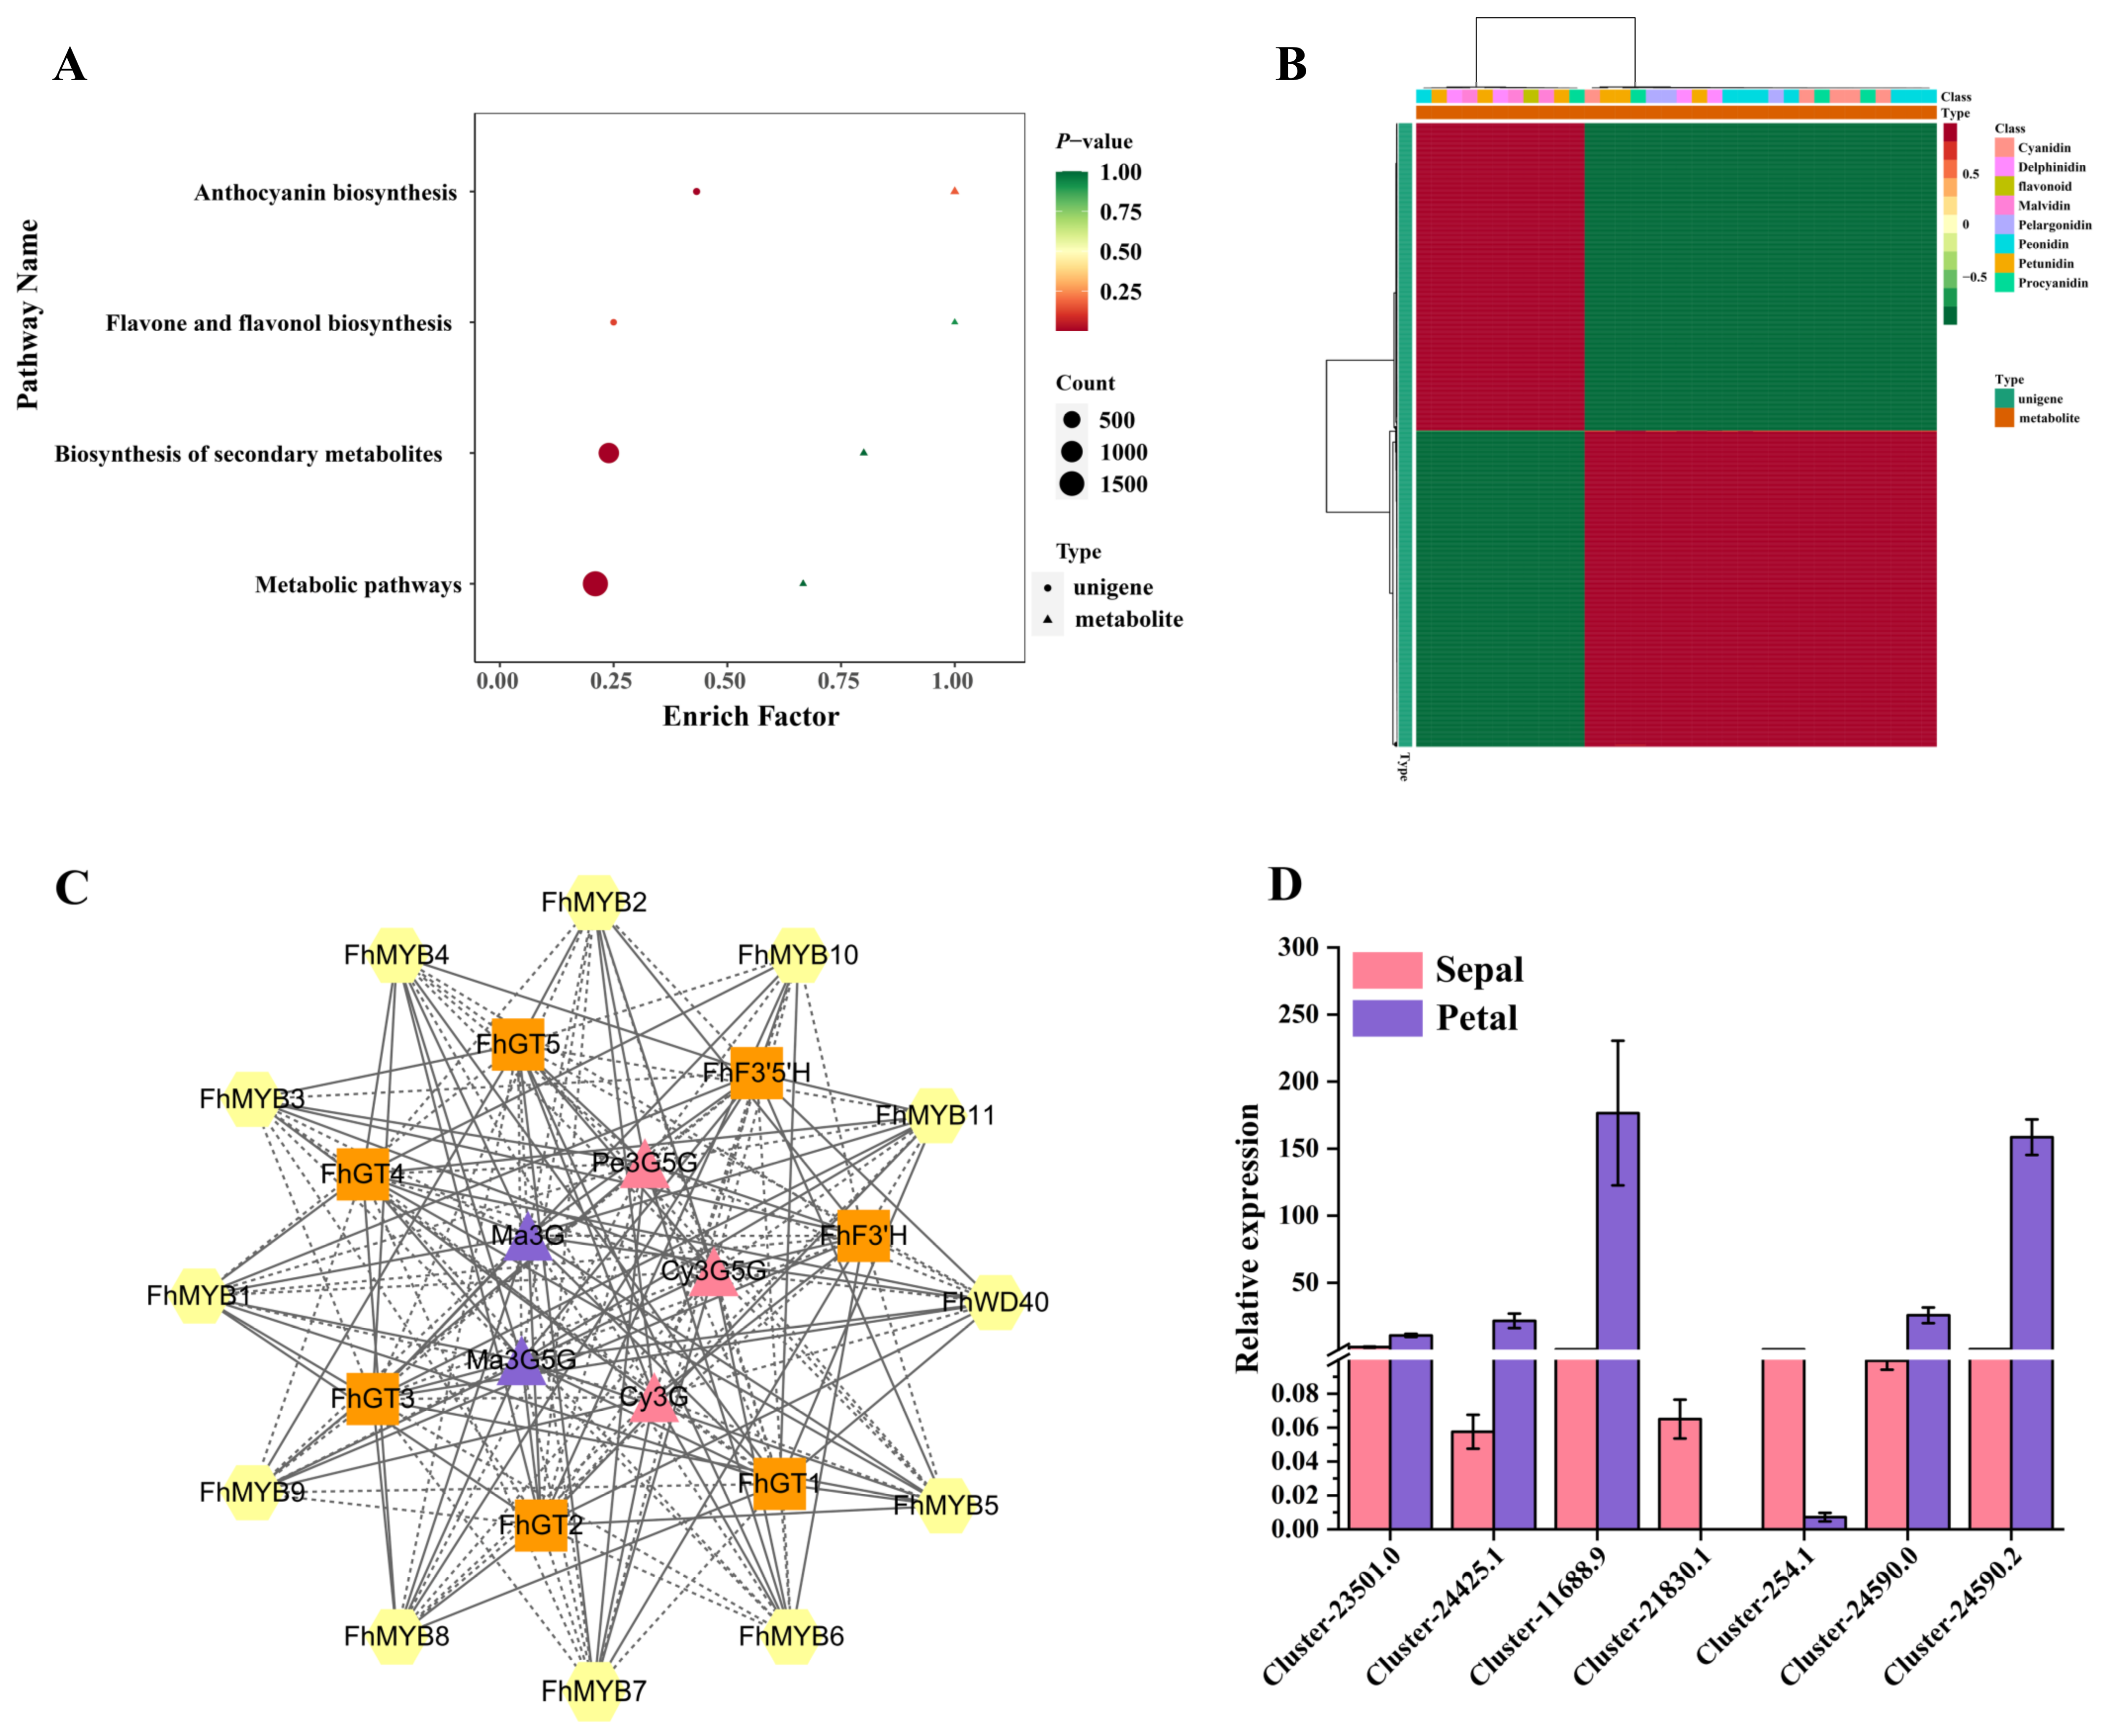
3.6. Integrative Analyses of the Metabolome and Transcriptome

We then focused on the multiomics analyses integrating both the metabolome and transcriptome to further dig out the key candidate metabolites and unigenes involved in the color variation between the sepals and petals in F. hybrida. The KEGG enrichment result showed that both the DAAs and DEGs were significantly enriched in the anthocyanin biosynthesis, the flavone and flavonol biosynthesis, the biosynthesis of secondary metabolites and the metabolic pathways (Figure 5A), and the DAAs were highly correlated with the DEGs (Figure 5B). In total, 33 structural unigenes involved in the anthocyanin biosynthesis showed significant differences between the sepals and petals, and 70 percent of the DEGs showed higher expression in the petals, which was consistent with their higher accumulation of anthocyanins (Table S5). Notably, the expression levels of FhF3′H and FhF3′5′H were higher in the sepals and petals, respectively. Considering the abundant glycosylation detected by the metabolome, ten differentially expressed glycosyltransferase genes were also screened out, which represented distinct expression patterns between the sepals and petals (Table S5). The above metabolome data revealed different anthocyanin accumulation patterns between the two floral organs; namely, a higher accumulation of cyanidin/peonidin derivatives in the sepals and a more abundant malvidin accumulation in the petals (Figure 2D). Therefore, the correlation between the key DAAs and DEGs was conducted. The FhF3′H transcripts were highly related with Cy3G, Cy3G5G and Pe3G5G accumulating in the sepals, while FhF3′5′H transcripts showed positive correlation with Ma3G and Ma3G5G (Figure 5C). FhGT1/2/3/4/8/10 were strongly related with the malvidin content, while FhGT5/6/7/9 were positively related to cyanidin/peonidin accumulation, suggesting FhGTs may play different roles in catalyzing sugar transport in F. hybrida. Moreover, the gene expression levels were verified by qRT-PCR (Figure 5D), suggesting the FPKM obtained in the transcriptome was reliable.

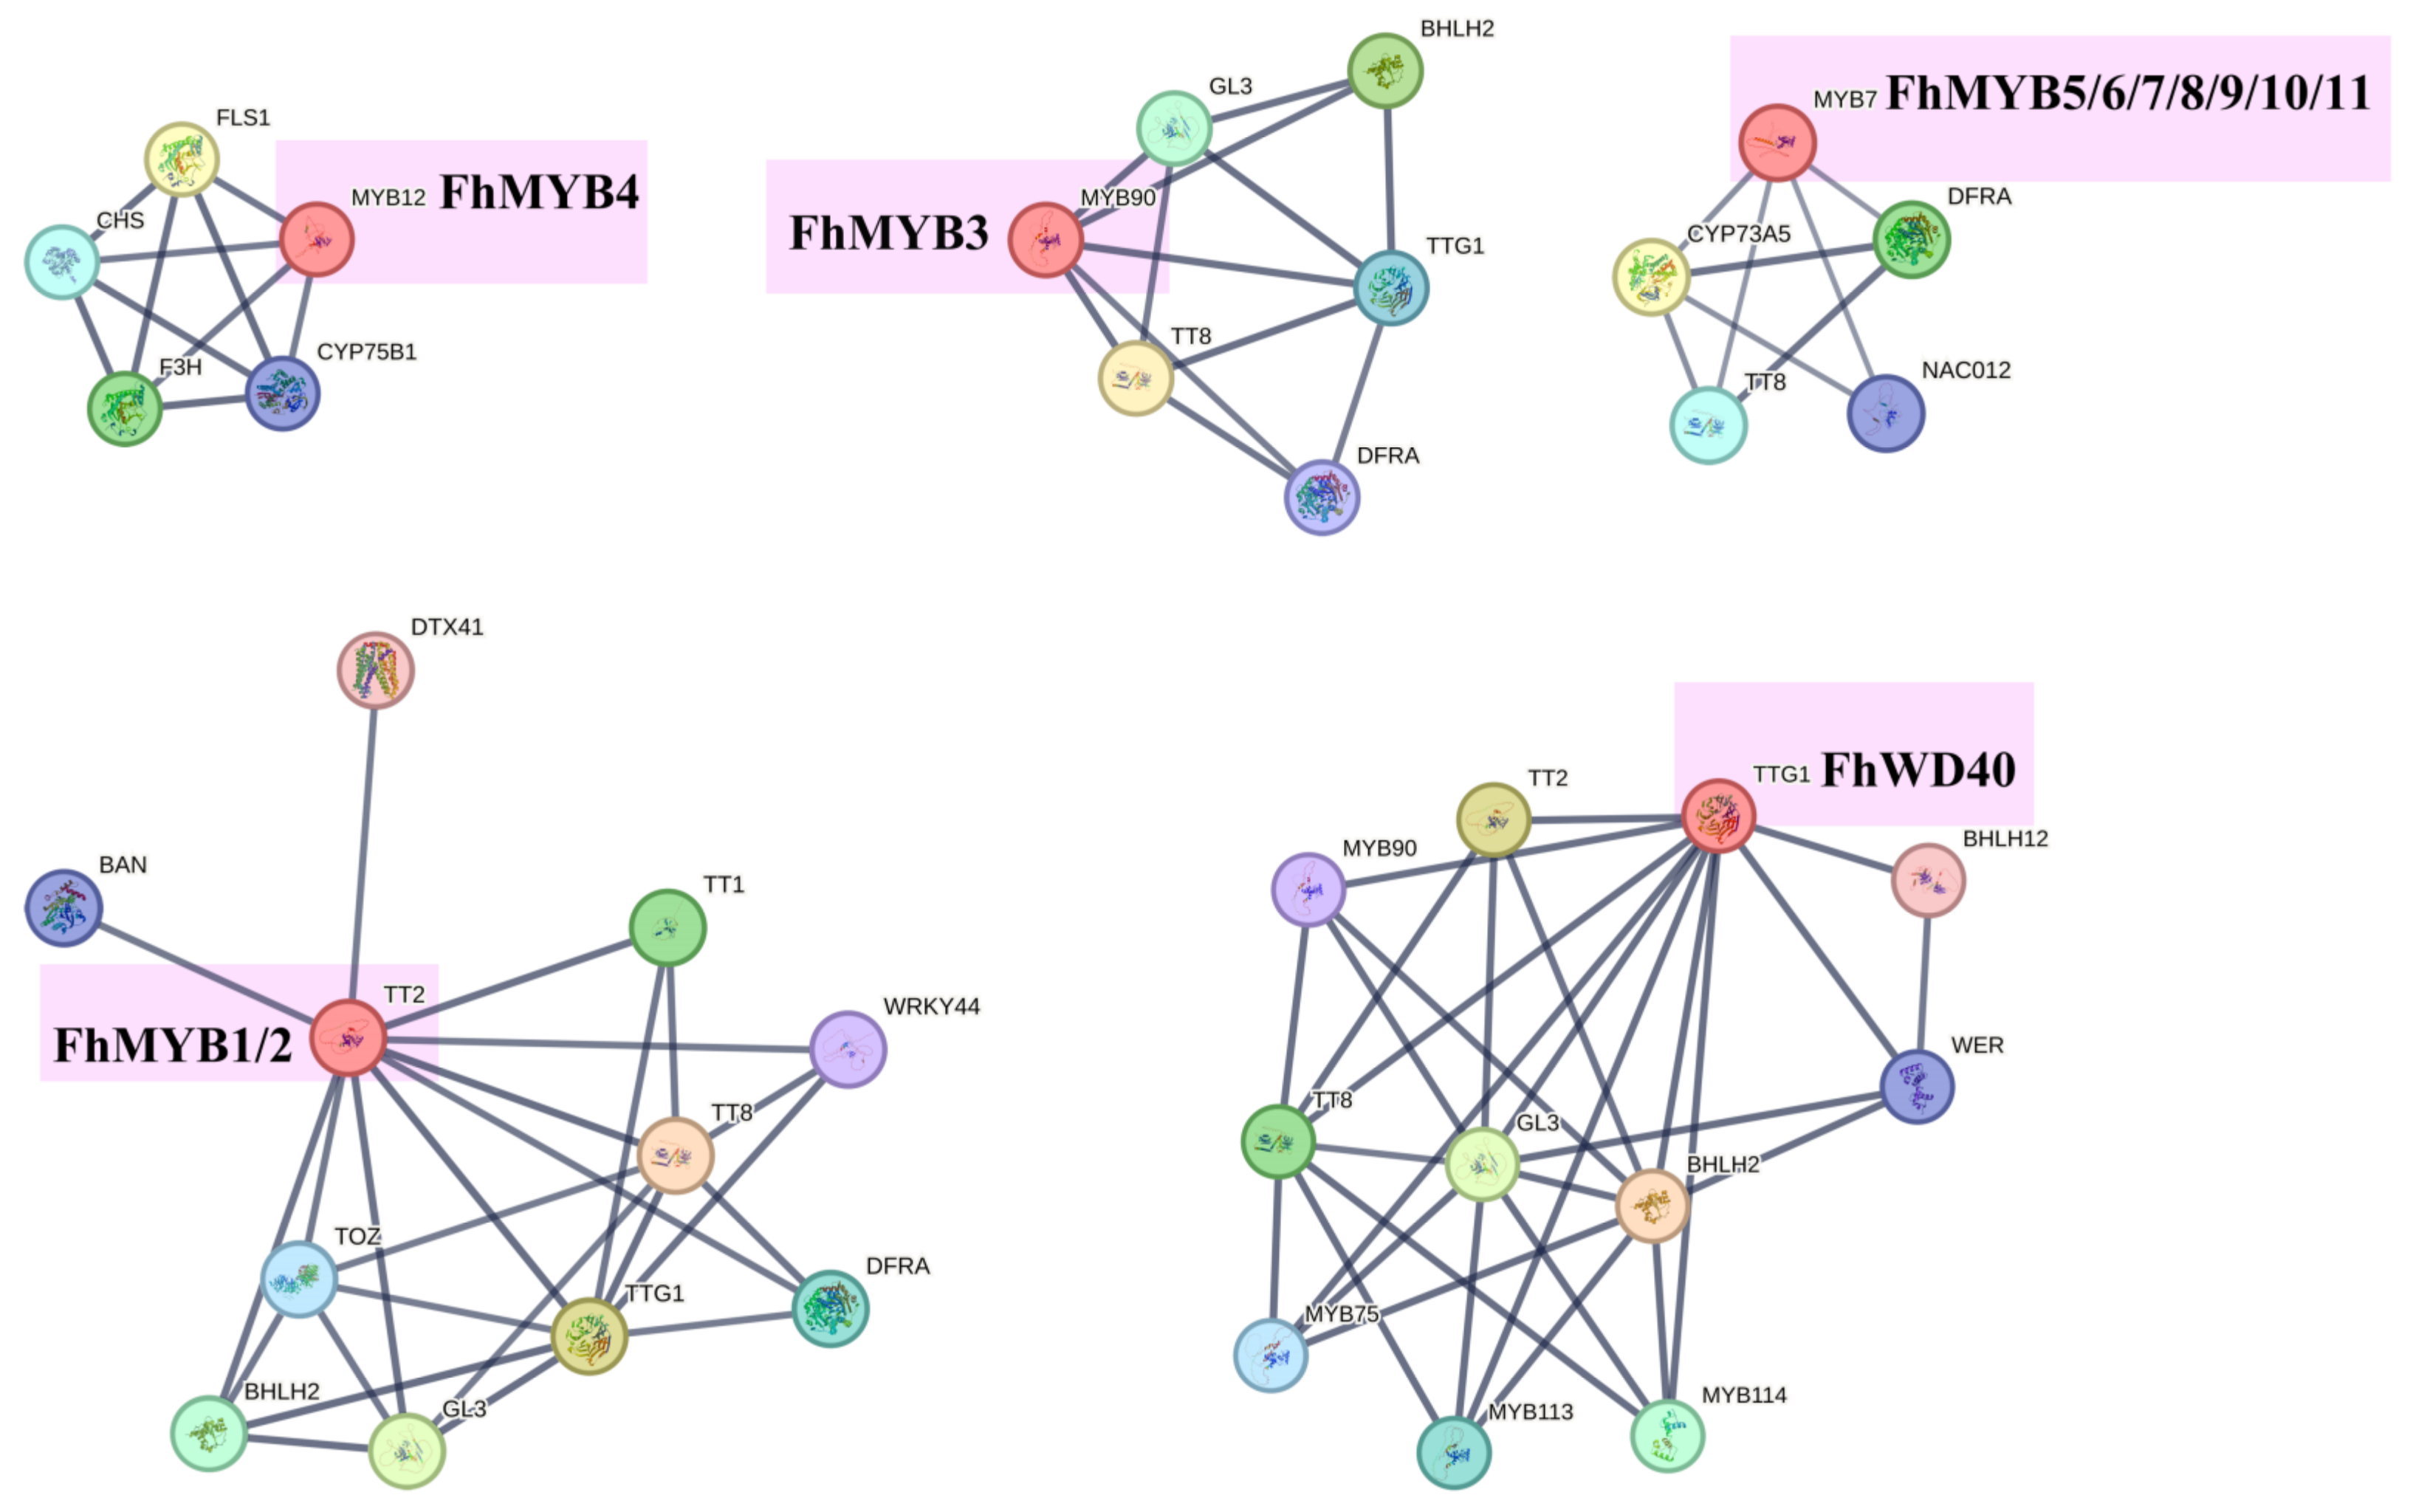
3.7. Screening of Transcription Factors Regulating the Anthocyanin Biosynthesis

The structural genes involved in the anthocyanin biosynthesis were regulated by upstream transcription factors (TFs). To gain more insights into the regulation mechanism underlying the peonidin and malvidin biosynthesis, we further attempted to excavate the key TFs using correlation analysis and protein interaction prediction in F. hybrida. A total of 820 unigenes were predicted as differentially expressed TFs. The top five TFs in terms of quantity were AP2/ERF, WRKY, bHLH, NAC and MYB, respectively (Figure S2). The correlation analysis was further conducted to predict the key TFs regulating the anthocyanin biosynthesis (Figure 5C). TFs FhMYB1, FhMYB4 and FhWD40 were positively correlated with malvidin accumulation, and FhMYB3 showed a positive correlation with cyanidin and peonidin accumulation, suggesting that they may function as activators in regulating the biosynthesis of different anthocyanins. Comparatively, FhMYB5, FhMYB8, FhMYB10 and FhMYB11 were negatively correlated with the cyanidin and peonidin biosynthesis, while FhMYB6, FhMYB7 and FhMYB9 were negatively correlated with the malvidin biosynthesis, possibly playing negative roles in regulating the anthocyanin biosynthesis. Furthermore, the protein association network of these candidate TFs was predicted by STRING 12.0 (Figure 6). The Arabidopsis activators TT2, MYB90, MYB12 and TTG1 were the homologues of FhMYB1/2, FhMYB3, FhMYB4 and FhWD40, respectively, suggesting that they may play positive roles in regulating the anthocyanin biosynthesis, while FhMYB5-11 was highly homologous with the Arabidopsis inhibitor MYB7, which implied that they may downregulate the anthocyanin biosynthesis, consistent with the above correlation analysis (Figure 6, Table S6).

4. Discussion

It is well known that the flower composed of sepals, petals, pistils and stamens is actually a kind of variation from the leaves. Usually, the sepals exhibit green colors because of the chlorophyll accumulation, while petals show a wider range of colors caused by the synthesis of abundant secondary metabolites, including flavonoids, carotenoids and betaines. However, the sepals of a few plants possess the ability to accumulate anthocyanins instead of chlorophylls, such as delphinidins in H. macrophylla [31,32], and cyanidins and pelargonidins in Heptacodium miconioides [33]. In this study, the anthocyanins in the red sepals of F. hybrida were mainly cyanidin and peonidin derivatives, different from the malvidin derivatives accumulating in its purple petals (Figure 2, Table S3). The glycosylation and methylation play important roles in enhancing anthocyanin stability and water solubility [34,35,36], as well as changing the flower color [16,37]. In F. hybrida, anthocyanins were widely modified by glycosylation at the 3 position or the 3,5 position (Table S3), and the Pe3G5G and Ma3G5G were the most abundant anthocyanins in the sepals and petals, respectively (Figure 2).
In order to further clarify the genetic mechanism underlying color variation and anthocyanin difference in F. hybrida, six libraries were sequenced and 33 DEGs involved in the anthocyanin biosynthesis were screened out. It is commonly known that F3′H and F3′5′H are the two key genes deciding two or three hydroxyls in the B-ring of the anthocyanin aglycon, respectively [22,23]. The expression level of FhF3′H was significantly higher in the sepals, and that of FhF3′5′H showed the opposite trend (Figure 5), which can account for the higher accumulation of cyanidin/peonidin derivatives in the sepals, as well as the higher accumulation of malvidin derivatives in the petals (Figure 2). The metabolome results suggested that peonidin and malvidin were the two predominant anthocyanins; namely, methylation occurred in both the sepals and petals of F. hybrida. However, we failed to find methyltransferases specifically modifying anthocyanins by a direct search in the unigene annotation. Previous studies suggested the substrate specificity of anthocyanin methyltransferase varies among species. For example, the VcOMT in blueberry only used delphinidin as a substrate [36], while CkmOMT2 in cyclamen could catalyze both the 3′ and 3′5′ O-methylation in the anthocyanin B-ring [38]. The methylated anthocyanins peonidin, petunidin and malvidin were widely accumulated in F. hybrida flowers; whether its methyltransferases possess substrate specificity remains to be explored in the following study.
The MYB–bHLH–WD40 complex is well known for regulating the anthocyanin biosynthesis in higher plants [39,40]. In this study, the STRING analysis as well as the correlation analysis between differentially expressed TFs, structural genes and DAAs were together performed to dig out key TFs potentially regulating the anthocyanin biosynthesis in F. hybrida. TFs FhMYB1/2, FhMYB3, FhMYB4 and FhWD40 were highly homologous to the anthocyanin activators TT2, MYB90, MYB12 and TTG1 in Arabidopsis thaliana [41,42], respectively (Figure 6). Notably, FhMYB1 and FhMYB4 were positively correlated with malvidin accumulation and FhF3′5′H expression, while FhMYB3 was positively correlated with cyanidin/peonidin accumulation and FhF3′H expression (Figure 5), suggesting the cyanin/peonidin flux and malvidin flux may be activated by different MYBs, similar as in the case of kiwifruit, where its F3′H can be upregulated by MYB110 while the F3′5′H cannot be directly affected [43]. Additionally, TFs FhMYB5/6/7/8/9/10/11 were highly homologous to Arabidopsis MYB7, a typical R2R3-type repressor belonging to the subgroup 4 [44], indicating they may function as anthocyanin biosynthesis inhibitors in F. hybrida. The clear function of these candidate key MYBs remains to be elucidated in the near future.
In addition to the well-known MYB–bHLH–WD40 complex, recent studies have published many other transcription factors involved in the anthocyanin biosynthesis, such as the AP2/ERFs in pear, eggplant and strawberry [45,46,47], the WRKYs in apple, Lilium and Malus [48,49,50], as well as the NACs in litchi, peach and apples [51,52,53]. The anthocyanins in F. hybrida showed tissue specificity between the sepals and petals, and we also found that many TFs, like AP2/ERFs, WRKYs and NACs, were differentially expressed (Figure S1). Whether these TFs are involved in regulating the anthocyanin biosynthesis in F. hybrida remains to be seen.

5. Conclusions

To conclude, anthocyanins in F. hybrida were widely modified by glycosylation as well as methylation, and showed diverse accumulation patterns between the sepals and petals. The cyanidin and peonidin derivatives were most abundant in the sepals, while the petals accumulated predominantly malvidin derivatives, which were accounted by the significantly higher expression of FhF3′H and FhF3′5′H in the sepals and petals, respectively. Moreover, key candidate FhMYBs were screened out, and may function specifically in regulating the cyanidin/peonidin or malvidin biosynthesis. These results initially reveal the molecular mechanism in the color variation in different floral organs, and will provide a theoretical basis for color innovation in F. hybrida.

Supplementary Materials

The following supporting information can be downloaded at: https://www.mdpi.com/article/10.3390/horticulturae9111236/s1. Figure S1: Distribution of the coefficient of variation values from different samples. The QC sample represented a mixture of sepals and petals; Figure S2: Differentially expressed transcription factors between sepals and petals in F. hybrida; Table S1: The regression equations used for semiquantitative interpretation; Table S2: The primer information used in qRT-PCR verification; Table S3: Metabolites detected by UPLC-MS/MS in F. hybrida sepals and petals; Table S4: Summary of sequencing and assembly quality in RNA-Seq; Table S5: DEGs involved in anthocyanin biosynthesis in F. hybrida sepals and petals; Table S6: Annotation summary of proteins involved in the analyses of the TF interaction network.

Author Contributions

Project design, C.D.; Materials collection, J.W.; Scientific experiments, S.L., J.L. and J.W.; Writing—draft preparation, S.L. and C.D.; Writing—review and editing, S.L., J.L., J.W. and C.D. All authors have read and agreed to the published version of the manuscript.

Funding

This work was supported by the Shandong Province Natural Science Foundation, China (no. ZR2021QC143) and the Doctoral Initiating Project of Linyi University, China (no. LYDX2021BS046).

Data Availability Statement

The sequence data in this work can be searched in the NCBI database (SRA data: PRJNA1025095).

Conflicts of Interest

The authors declare no conflict of interest.

References

  1. Wu, Q.; Fu, X.; Chen, Z.; Wang, H.; Wang, J.; Zhu, Z.; Zhu, G. Composition, color stability and antioxidant properties of betalain-based extracts from bracts of Bougainvillea. Molecules 2022, 27, 5120. [Google Scholar] [CrossRef] [PubMed]
  2. Li, C.; Qiu, J.; Huang, S.; Yin, J.; Yang, G. AaMYB3 interacts with AabHLH1 to regulate proanthocyanidin accumulation in Anthurium andraeanum (Hort.)—Another strategy to modulate pigmentation. Hortic. Res. 2019, 6, 14. [Google Scholar] [CrossRef] [PubMed]
  3. Zhang, G.; Yuan, S.; Qi, H.; Chu, Z.; Liu, C. Identification of reliable reference genes for the expression of Hydrangea macrophylla ‘Bailmer’ and ‘Duro’ sepal color. Horticulturae 2022, 8, 835. [Google Scholar] [CrossRef]
  4. Okamoto, M.; Niki, T.; Azuma, M.; Shibuya, K.; Ichimura, K. Expression of ethylene biosynthesis genes in the gynoecium and receptacle associated with sepal abscission during senescence in Delphinium grandiflorum. Plant Growth Regul. 2022, 97, 593–609. [Google Scholar] [CrossRef]
  5. Rudall, P.J. Colourful cones: How did flower colour first evolve? J. Exp. Bot. 2020, 71, 759–767. [Google Scholar] [CrossRef]
  6. Garcia, J.E.; Phillips, R.D.; Peter, C.I.; Dyer, A.G. Changing how biologists view flowers—Color as a perception not a trait. Front. Plant Sci. 2020, 11, 601700. [Google Scholar] [CrossRef]
  7. Trunschke, J.; Lunau, K.; Pyke, G.H.; Ren, Z.; Wang, H. Flower color evolution and the evidence of pollinator-mediated selection. Front. Plant Sci. 2021, 12, 617851. [Google Scholar] [CrossRef]
  8. Brunet, J.; Flick, A.J.; Bauer, A.A. Phenotypic selection on flower color and floral display size by three bee species. Front. Plant Sci. 2021, 11, 587528. [Google Scholar] [CrossRef]
  9. Huang, H.; Gao, X.; Gao, X.; Zhang, S.; Zheng, Y.; Zhang, N.; Hong, B.; Zhao, X.; Gu, Z. Flower color mutation, pink to orange, through CmGATA4-CCD4a-5 module regulates carotenoids degradation in chrysanthemum. Plant Sci. 2022, 322, 111290. [Google Scholar] [CrossRef]
  10. Haselmair-Gosch, C.; Miosic, S.; Nitarska, D.; Roth, B.L.; Walliser, B.; Paltram, R.; Lucaciu, R.C.; Eidenberger, L.; Rattei, T.; Olbricht, K.; et al. Great cause—Small effect: Undeclared genetically engineered orange petunias harbor an inefficient dihydroflavonol 4-reductase. Front. Plant Sci. 2018, 9, 149. [Google Scholar] [CrossRef]
  11. Nitarska, D.; Stefanini, C.; Haselmair-Gosch, C.; Miosic, S.; Walliser, B.; Mikulic-Petkovsek, M.; Regos, I.; Slatnar, A.; Debener, T.; Terefe-Ayana, D.; et al. The rare orange-red colored Euphorbia pulcherrima cultivar ‘Harvest Orange’ shows a nonsense mutation in a flavonoid 3’-hydroxylase allele expressed in the bracts. BMC Plant Biol. 2018, 18, 216. [Google Scholar] [CrossRef] [PubMed]
  12. Deng, C.; Li, S.; Feng, C.; Hong, Y.; Huang, H.; Wang, J.; Wang, L.; Dai, S. Metabolite and gene expression analysis reveal the molecular mechanism for petal colour variation in six Centaurea cyanus cultivars. Plant Physiol. Biochem. 2019, 142, 22–33. [Google Scholar] [CrossRef] [PubMed]
  13. Deguchi, A.; Tatsuzawa, F.; Hosokawa, M.; Doi, M.; Ohno, S. Tobacco streak virus (strain dahlia) suppresses posttranscriptional gene silencing of flavone synthase II in black dahlia cultivars and causes a drastic flower color change. Planta 2015, 242, 663–675. [Google Scholar] [CrossRef]
  14. Katsumoto, Y.; Fukuchi-Mizutani, M.; Fukui, Y.; Brugliera, F.; Holton, T.A.; Karan, M.; Nakamura, N.; Yonekura-Sakakibara, K.; Togami, J.; Pigeaire, A.; et al. Engineering of the rose flavonoid biosynthetic pathway successfully generated blue-hued flowers accumulating delphinidin. Plant Cell Physiol. 2007, 48, 1589–1600. [Google Scholar] [CrossRef]
  15. Fukui, Y.; Tanaka, Y.; Kusumi, T.; Iwashita, T.; Nomoto, K. A rationale for the shift in colour towards blue in transgenic carnation flowers expressing the flavonoid 3’,5’-hydroxylase gene. Phytochemistry 2003, 63, 15–23. [Google Scholar] [CrossRef] [PubMed]
  16. Noda, N.; Yoshioka, S.; Kishimoto, S.; Nakayama, M.; Douzono, M.; Tanaka, Y.; Aida, R. Generation of blue chrysanthemums by anthocyanin B-ring hydroxylation and glucosylation and its coloration mechanism. Sci. Adv. 2017, 3, e1602785. [Google Scholar] [CrossRef] [PubMed]
  17. Kaur, S.; Tiwari, V.; Kumari, A.; Chaudhary, E.; Sharma, A.; Ali, U.; Garg, M. Protective and defensive role of anthocyanins under plant abiotic and biotic stresses: An emerging application in sustainable agriculture. J. Biotechnol. 2023, 361, 12–29. [Google Scholar] [CrossRef] [PubMed]
  18. Yan, W.; Li, J.; Lin, X.; Wang, L.; Yang, X.; Xia, X.; Zhang, Y.; Yang, S.; Li, H.; Deng, X.; et al. Changes in plant anthocyanin levels in response to abiotic stresses: A meta-analysis. Plant Biotechnol. Rep. 2022, 16, 497–508. [Google Scholar] [CrossRef]
  19. Mansour, M.M.F. Anthocyanins: Biotechnological targets for enhancing crop tolerance to salinity stress. Sci. Hortic. 2023, 319, 112182. [Google Scholar] [CrossRef]
  20. Fan, X.; Fan, Z.; Yang, Z.; Huang, T.; Tong, Y.; Yang, D.; Mao, X.; Yang, M. Flavonoids—Natural gifts to promote health and longevity. Int. J. Mol. Sci. 2022, 23, 2176. [Google Scholar] [CrossRef]
  21. Li, M.; Qian, M.; Jiang, Q.; Tan, B.; Yin, Y.; Han, X. Evidence of flavonoids on disease prevention. Antioxidants 2023, 12, 527. [Google Scholar] [CrossRef] [PubMed]
  22. Sunil, L.; Shetty, N.P. Biosynthesis and regulation of anthocyanin pathway genes. Appl. Microbiol. Biot. 2022, 106, 1783–1798. [Google Scholar] [CrossRef] [PubMed]
  23. Alappat, B.; Alappat, J. Anthocyanin pigments: Beyond aesthetics. Molecules 2020, 25, 5500. [Google Scholar] [CrossRef] [PubMed]
  24. Uchida, K.; Sawada, Y.; Ochiai, K.; Sato, M.; Inaba, J.; Hirai, M.Y. Identification of a unique type of isoflavone O-methyltransferase, GmIOMT1, based on multi-omics analysis of soybean under biotic stress. Plant Cell Physiol. 2020, 61, 1974–1985. [Google Scholar] [CrossRef]
  25. Liu, X.; Zhao, C.; Gong, Q.; Wang, Y.; Cao, J.; Li, X.; Grierson, D.; Sun, C. Characterization of a caffeoyl-CoA O-methyltransferase-like enzyme involved in biosynthesis of polymethoxylated flavones in Citrus reticulata. J. Exp. Bot. 2020, 71, 3066–3079. [Google Scholar] [CrossRef]
  26. Sun, L.; Huo, J.; Liu, J.; Yu, J.; Zhou, J.; Sun, C.; Wang, Y.; Leng, F. Anthocyanins distribution, transcriptional regulation, epigenetic and post-translational modification in fruits. Food Chem. 2023, 411, 135540. [Google Scholar] [CrossRef]
  27. Deng, C.; Wang, J.; Lu, C.; Li, Y.; Kong, D.; Hong, Y.; Huang, H.; Dai, S. CcMYB6-1 and CcbHLH1, two novel transcription factors synergistically involved in regulating anthocyanin biosynthesis in cornflower. Plant Physiol. Biochem. 2020, 151, 271–283. [Google Scholar] [CrossRef]
  28. Feng, G.; Wang, J.; Pan, Z.; Deng, C. Integrative metabolome and transcriptome analyses reveal the molecular mechanism of yellow-red bicolor formation in Kalanchoe blossfeldiana petals. Horticulturae 2023, 9, 844. [Google Scholar] [CrossRef]
  29. Love, M.I.; Huber, W.; Anders, S. Moderated estimation of fold change and dispersion for RNA-seq data with DESeq2. Genome Biol. 2014, 15, 550. [Google Scholar] [CrossRef]
  30. Varet, H.; Brillet-Guéguen, L.; Coppée, J.Y.; Dillies, M.A. SARTools: A DESeq2- and EdgeR-based r pipeline for comprehensive differential analysis of RNA-seq data. PLoS ONE 2016, 11, e0157022. [Google Scholar] [CrossRef]
  31. Yoshida, K.; Ito, D.; Miki, N.; Kondo, T. Single-cell analysis clarifies mosaic color development in purple hydrangea sepal. New Phytol. 2021, 229, 3549–3557. [Google Scholar] [CrossRef] [PubMed]
  32. Oyama, K.; Yamada, T.; Ito, D.; Kondo, T.; Yoshida, K. Metal complex pigment involved in the blue sepal color development of hydrangea. J. Agric. Food Chem. 2015, 63, 7630–7635. [Google Scholar] [CrossRef] [PubMed]
  33. Li, Y.; Sun, Z.; Lu, J.; Jin, Z.; Li, J. Integrated transcriptomics and metabolomics analysis provide insight into anthocyanin biosynthesis for sepal color formation in Heptacodium miconioides. Front. Plant Sci. 2023, 14, 1044581. [Google Scholar] [CrossRef] [PubMed]
  34. Cheng, J.; Wei, G.; Zhou, H.; Gu, C.; Vimolmangkang, S.; Liao, L.; Han, Y. Unraveling the mechanism underlying the glycosylation and methylation of anthocyanins in peach. Plant Physiol. 2014, 166, 1044–1058. [Google Scholar] [CrossRef] [PubMed]
  35. Feng, K.; Xu, Z.; Liu, J.; Li, J.; Wang, F.; Xiong, A. Isolation, purification, and characterization of AgUCGalT1, a galactosyltransferase involved in anthocyanin galactosylation in purple celery (Apium graveolens L.). Planta 2018, 247, 1363–1375. [Google Scholar] [CrossRef] [PubMed]
  36. Xie, L.; Lu, Y.; Zhou, Y.; Hao, X.; Chen, W. Functional analysis of a methyltransferase involved in anthocyanin biosynthesis from blueberries (Vaccinium corymbosum). J. Agric. Food Chem. 2022, 70, 16253–16262. [Google Scholar] [CrossRef]
  37. Hsu, Y.; Tagami, T.; Matsunaga, K.; Okuyama, M.; Suzuki, T.; Noda, N.; Suzuki, M.; Shimura, H. Functional characterization of UDP-rhamnose-dependent rhamnosyltransferase involved in anthocyanin modification, a key enzyme determining blue coloration in Lobelia erinus. Plant J. 2017, 89, 325–337. [Google Scholar] [CrossRef] [PubMed]
  38. Akita, Y.; Kitamura, S.; Hase, Y.; Narumi, I.; Ishizaka, H.; Kondo, E.; Kameari, N.; Nakayama, M.; Tanikawa, N.; Morita, Y.; et al. Isolation and characterization of the fragrant cyclamen O-methyltransferase involved in flower coloration. Planta 2011, 234, 1127–1136. [Google Scholar] [CrossRef]
  39. Gu, K.; Wang, C.; Hu, D.; Hao, Y. How do anthocyanins paint our horticultural products? Sci. Hortic. 2019, 249, 257–262. [Google Scholar] [CrossRef]
  40. Cappellini, F.; Marinelli, A.; Toccaceli, M.; Tonelli, C.; Petroni, K. Anthocyanins: From mechanisms of regulation in plants to health benefits in foods. Front. Plant Sci. 2021, 12, 748049. [Google Scholar] [CrossRef]
  41. Baudry, A.; Heim, M.A.; Dubreucq, B.; Caboche, M.; Weisshaar, B.; Lepiniec, L. TT2, TT8, and TTG1 synergistically specify the expression of BANYULS and proanthocyanidin biosynthesis in Arabidopsis thaliana. Plant J. 2004, 39, 366–380. [Google Scholar] [CrossRef] [PubMed]
  42. Mondal, S.K.; Roy, S. Genome-wide sequential, evolutionary, organizational and expression analyses of phenylpropanoid biosynthesis associated MYB domain transcription factors in Arabidopsis. J. Biomol. Struct. Dyn. 2018, 36, 1577–1601. [Google Scholar] [CrossRef] [PubMed]
  43. Peng, Y.; Lin-Wang, K.; Cooney, J.M.; Wang, T.; Espley, R.V.; Allan, A.C. Differential regulation of the anthocyanin profile in purple kiwifruit (Actinidia species). Hortic. Res. 2019, 6, 3. [Google Scholar] [CrossRef] [PubMed]
  44. Zhou, M.; Sun, Z.; Wang, C.; Zhang, X.; Tang, Y.; Zhu, X.; Shao, J.; Wu, Y. Changing a conserved amino acid in R2R3-MYB transcription repressors results in cytoplasmic accumulation and abolishes their repressive activity in Arabidopsis. Plant J. 2015, 84, 395–403. [Google Scholar] [CrossRef] [PubMed]
  45. Yao, G.; Ming, M.; Allan, A.C.; Gu, C.; Li, L.; Wu, X.; Wang, R.; Chang, Y.; Qi, K.; Zhang, S.; et al. Map-based cloning of the pear gene MYB114 identifies an interaction with other transcription factors to coordinately regulate fruit anthocyanin biosynthesis. Plant J. 2017, 92, 437–451. [Google Scholar] [CrossRef] [PubMed]
  46. Li, D.; He, Y.; Li, S.; Shi, S.; Li, L.; Liu, Y.; Chen, H. Genome-wide characterization and expression analysis of AP2/ERF genes in eggplant (Solanum melongena L.). Plant Physiol. Biochem. 2021, 167, 492–503. [Google Scholar] [CrossRef]
  47. Zhang, Z.; Shi, Y.; Ma, Y.; Yang, X.; Yin, X.; Zhang, Y.; Xiao, Y.; Liu, W.; Li, Y.; Li, S.; et al. The strawberry transcription factor FaRAV1 positively regulates anthocyanin accumulation by activation of FaMYB10 and anthocyanin pathway genes. Plant Biotechnol. J. 2020, 18, 2267–2279. [Google Scholar] [CrossRef]
  48. Su, M.; Wang, S.; Li, C.; Zhang, Z.; Wang, N.; Li, B.; Chen, X. Ultraviolet-B-induced MdWRKY71-L expression regulates anthocyanin synthesis in apple. Environ. Exp. Bot. 2022, 201, 105000. [Google Scholar] [CrossRef]
  49. Bi, M.; Liang, R.; Wang, J.; Qu, Y.; Liu, X.; Cao, Y.; He, G.; Yang, Y.; Yang, P.; Xu, L.; et al. Multifaceted roles of LhWRKY44 in promoting anthocyanin accumulation in Asiatic hybrid lilies (Lilium spp.). Hortic. Res. 2023, 10, uhad167. [Google Scholar] [CrossRef]
  50. Zhang, J.; Wang, Y.; Mao, Z.; Liu, W.; Ding, L.; Zhang, X.; Yang, Y.; Wu, S.; Chen, X.; Wang, Y. Transcription factor McWRKY71 induced by ozone stress regulates anthocyanin and proanthocyanidin biosynthesis in Malus crabapple. Ecotoxicol. Environ. Saf. 2022, 232, 113274. [Google Scholar] [CrossRef]
  51. Jiang, G.; Li, Z.; Song, Y.; Zhu, H.; Lin, S.; Huang, R.; Jiang, Y.; Duan, X. LcNAC13 physically interacts with LcR1MYB1 to coregulate anthocyanin biosynthesis-related genes during litchi fruit ripening. Biomolecules 2019, 9, 135. [Google Scholar] [CrossRef] [PubMed]
  52. Zhou, H.; Lin-Wang, K.; Wang, H.; Gu, C.; Dare, A.P.; Espley, R.V.; He, H.; Allan, A.C.; Han, Y. Molecular genetics of blood-fleshed peach reveals activation of anthocyanin biosynthesis by NAC transcription factors. Plant J. 2015, 82, 105–121. [Google Scholar] [CrossRef] [PubMed]
  53. Liu, W.; Mei, Z.; Yu, L.; Gu, T.; Li, Z.; Zou, Q.; Zhang, S.; Fang, H.; Wang, Y.; Zhang, Z.; et al. The ABA-induced NAC transcription factor MdNAC1 interacts with a bZIP-type transcription factor to promote anthocyanin synthesis in red-fleshed apples. Hortic. Res. 2023, 10, uhad049. [Google Scholar] [CrossRef] [PubMed]
Figure 1. The flower of F. hybrida and its color phenotype. (A) The overall view of the whole flower. (B) The enlarged view of flower bud (upper), sepal (middle) and petal (lower). (C) The flower color phenotype described by the RHSCC and colorimeter.
Horticulturae 09 01236 g001
Figure 2. The targeted metabolome analysis of the sepals and petals in F. hybrida. (A) Heatmap analysis based on both samples and metabolites. (B) Bar diagram of the fold changes. (C) KEGG enrichment analysis of the DAAs. (D) The semiquantitative interpretation of all the detected metabolites.
Horticulturae 09 01236 g002
Figure 3. Transcriptome analyses of the sepals and petals in F. hybrida. (A) Statistics of the transcript and unigene length. (B) The annotations of the unigenes using seven different databases. (C) The species distribution of the annotated unigenes. (D) The principal component analysis plots of the unigene FPKM.
Horticulturae 09 01236 g003
Figure 4. DEG analysis between the sepals and petals in F. hybrida. (A) The volcano plot of the DEGs in the petal vs. sepal comparison. (B) The heatmap of all DEGs among the six samples. (C) The GO enrichment analysis of the DEGs. (D) The KEGG enrichment analysis of the DEGs.
Horticulturae 09 01236 g004
Figure 5. Multiomics analysis combining the metabolome and transcriptome. (A) The KEGG enrichment analysis of the DEGs and DAAs; (B) The heat-map of the DEGs and DAAs between the sepals and petals; (C) Correlation network of the key DAAs and DEGs visualized by Cytoscape. The red triangles represent differentially accumulated cyanidin and peonidin derivatives, purple triangles represent malvidin derivatives, orange rectangles represent structural genes, including FhF3′H, FhF3′5′H and FhGTs, and yellow hexagons represent TFs, including FhMYBs and FhWD40; (D) The validation of the FPKM obtained in the transcriptome by qRT-PCR.
Horticulturae 09 01236 g005
Figure 6. The protein association network of candidate TFs by STRING analysis.
Horticulturae 09 01236 g006
Disclaimer/Publisher’s Note: The statements, opinions and data contained in all publications are solely those of the individual author(s) and contributor(s) and not of MDPI and/or the editor(s). MDPI and/or the editor(s) disclaim responsibility for any injury to people or property resulting from any ideas, methods, instructions or products referred to in the content.

