
Development of Cleaved Amplified Polymorphic Sequence Marker for Cap Color Identification in Pleurotus cornucopiae


1
Institute of Agricultural Resources and Regional Planning, Chinese Academy of Agricultural Sciences, Beijing 100081, China
2
State Key Laboratory of Efficient Utilization of Arid and Semi-Arid Arable Land in Northern China, Beijing 100081, China
3
Key Laboratory of Microbial Resources, Ministry of Agriculture and Rural Affairs, Beijing 100081, China
4
College of Plant Protection, Shandong Agricultural University, Taian 271018, China
*
Author to whom correspondence should be addressed.
Horticulturae 2023, 9(11), 1238; https://doi.org/10.3390/horticulturae9111238
Submission received: 13 October 2023
/
Revised: 11 November 2023
/
Accepted: 15 November 2023
/
Published: 16 November 2023
(This article belongs to the Special Issue The Edible Mushroom Industry: A Vital Component in Horticultural Production)
Abstract
:Cap color is one of the most crucial commercial traits for oyster mushrooms, and dark-colored varieties are highly favored by consumers, yet they are relatively scarce on the market. There is an urgent need for the selection and breeding of dark oyster mushrooms. Previous studies identified PcTYR, a key gene that controls the cap color of Pleurotus cornucopiae, and four SNPs were identified based on a genome-level sequence comparison of the black and white gene pools for extreme traits in the segregating populations. In this study, we verified whether these SNPs were color-specific sites via specific primer design, PCR amplification, and enzyme digestion of the entire isolated population strains and developed CAPS/dCAPS markers for the early visual identification of cap color to assist material screening in cap color breeding. One CAPS marker, TYR-CAPS-3-2, was developed for identifying the cap color of oyster mushrooms. After digestion with the restriction endonuclease Mse I, the marker generated polymorphic bands that accurately and visually distinguished dark-colored (non-white) and white strains from the cap color-segregating population. Consequently, the application of this marker during the early growth stage of oyster mushrooms can facilitate molecular-marker-assisted selection, expediting the breeding process for dark-colored varieties.
1. Introduction
Pleurotus cornucopiae [1] is one of the widely cultivated oyster mushroom species in China, known for its high nutritional and medicinal value. It is rich in biologically active substances such as polysaccharides, terpenoids, and flavonoids and possesses various beneficial effects, including antitumor, antioxidant, anti-inflammatory, antiviral, and immune-enhancing properties [2,3]. Active macromolecules such as β-glucans, lipopolysaccharides, and resveratrol compounds present in the mushroom can lower cholesterol, scavenge free radicals, and exhibit antioxidant, antiatherosclerosis, antitumor, and immune-regulating activities [4,5]. Additionally, secondary metabolites like terpenoids and steroids have demonstrated antimicrobial, anthelmintic, anti-inflammatory, and antitumor effects [6].
Color trait is one of the primary characteristics of crops, serving as an indicator of maturity for grains, fruits, and vegetables, and is also a significant factor influencing their appearance quality and commercial value. The pigment content in crops can be used as an indicator to evaluate their nutritional value. Consumers prefer to purchase brightly colored grains, fruits, and vegetables on the market, making color trait an important focus of breeding research. Cap color is an essential commodity character in oyster mushrooms, and dark-colored oyster mushrooms are highly favored by consumers, though such strains are relatively rare on the market. In recent years, there have been certain advancements in the molecular genetic mechanisms underlying color trait formation. The cap color of oyster mushrooms is mainly determined by the type and content of melanin, and a higher content of true melanin leads to a darker cap color [7]. Tyrosinase is the rate-limiting enzyme in melanin synthesis [8], and the tyrosinase gene is a key gene that affects the cap color of P. cornucopiae. In our previous research, through QTL fine mapping and gene functional validation, the tyrosinase gene (PcTYR) was identified as the key gene controlling the formation of P. cornucopiae cap color. Simultaneously, by re-sequencing a pool of extreme phenotypes comprising some white and some black strains, four SNPs co-segregating with the cap color trait were detected within the PcTYR gene, with three SNPs located in the intronic region (1038 bp T>C, 1273 bp A>C, 1303bp G>C) and one SNP located in the promoter region (−1590 bp T>C) (Figure 1) [9,10].
Molecular-marker-assisted breeding utilizes the close linkage between molecular markers and target genes to rapidly and accurately select desired traits, thereby improving breeding efficiency. This method has been widely applied in crops with high heterosis utilization levels for rapid parental and progeny selection in hybrid breeding. Single nucleotide polymorphisms (SNPs) refer to sequence variations at the genomic level caused by single nucleotide substitutions or insertions/deletions. SNPs are abundant, highly polymorphic, biallelic, and can be detected using high-throughput automated methods [11]. However, SNP marker detection often requires sequencing and gene chips, making it less practical in ordinary breeding laboratories and lacking visual clarity. Cleaved Amplified Polymorphic Sequence (CAPS) or Polymerase Chain Reaction–Restriction Fragment Length Polymorphism (PCR-RFLP) is a classical method used for SNP genotyping. It combines PCR and RFLP techniques and is based on the variation in bases at restriction enzyme recognition sites in DNA fragments [12]. This method involves the restriction enzyme digestion of PCR products, resulting in polymorphic DNA fragments, thus converting SNP markers into CAPS markers for detection [13]. To detect SNPs without restriction enzyme recognition sites, derived CAPS (dCAPS) markers were developed by introducing mismatched bases artificially [14,15]. CAPS/dCAPS can rapidly and visually verify SNP loci and achieve marker genotyping through PCR and enzyme digestion, avoiding the laborious step of membrane transfer in RFLP analysis while maintaining its precision. These markers have the advantages of co-dominance, site specificity, simplicity, rapid detection, low cost, and independence from sophisticated instruments. As a result, they have been widely used in plant gene typing, mapping, cloning, molecular markers, genetic diversity analysis, variety identification in animals and microorganisms, and genetic linkage mapping [16,17]. In plants, based on watermelon whole-genome resequencing data, SNPs were mined and converted into CAPS markers, genetic linkage maps were constructed, and QTL analysis was conducted on watermelon fruit- and seed-related traits [18]. Through a comparative analysis of the ALS gene sequences of herbicide-resistant formulation and sensitive brassica napus, it was found that there was an SNP mutation, which led to the difference in digestion of BsrD I endonuclease in the gene sequence, and CAPS markers were developed to detect resistance genes [19]. In edible fungi, non-synonymous SNPs in the CAP, GLA1, and TLG1 domain of functional genes were screened out according to the whole-genome sequencing of Lentinula edodes monokaryotic mycelium 135A and 135B, and three pairs of SNP-CAPS molecular markers were developed, and 23 Lentinula edodes monokaryotic strains were divided into types 135A and 135B. This provides a reference value for further studies on the origin and location of the functional genes of mushroom strains [20]. In the Agaricus bisporus, CAPS markers were used to analyze the genetic diversity and population structure of the germplasm resources to support germplasm evaluation and management [21].
In this study, four SNPs linked to color traits in PcTYR genes detected earlier were taken as the research objects. The co-segregation of the SNPs and the trait cap color was validated. Intuitive and operable CAPS markers were developed under laboratory conditions to verify the specificity of the markers in the detection of cap color in the colony of cap color separation, which was applied to the rapid screening of mushroom cap color breeding materials to provide technical support for the molecular-marker-assisted directional breeding of oyster mushrooms.
2. Materials and Methods
2.1. Experimental Materials
The mushroom strains used in this experiment included P. cornucopiae strains CCMSSC00406, 406P1, CCMSSC00358, 358P1, and 358P2; the other oyster mushroom strains CCMSSC00328, CCMSSC00329, CCMSSC00363, CCMSSC00364, CCMSSC00499, CCMSSC00630, CCMSSC03989, CCMSSC04195, CCMSSC00387, CCMSSC00322, CCMSSC04976, CCMSSC04977; as well as the F2 segregating population previously developed [10]. The parental strains of the population were heterothallic strains 406 and 358, characterized by a black color (whiteness index [WI] = 26.23) and white color (WI = 59.67), respectively. The heterokaryotic strain HBPC067, with a black cap color (WI = 23.15), was obtained by crossing the monokaryotic spore isolate BPC067 from strain 406 with the homokaryotic strain 358P1 from the white parental strain 358. Through single-spore isolation, a segregating population of the heterokaryotic strain HBPC067 was obtained. This segregating population was then crossed with the homokaryotic strain (358P2) of the white strain 358 to produce the F2 heterokaryotic population [10] (Figure 2). All strains mentioned above were provided by the China Center for Mushroom Spawn Standards and Control (CCMSSC).
Cap color of mushrooms was measured using a Minolta Chroma Meter (CM-700d) with the tristimulus coordinate system CIELAB scale (Commission Internationale de l’Eclairage 1976, L*a*b color system). Cap color was quantified as the whiteness index (WI), i.e., the value of L-3b, and the mean WI of the measurements was defined as the value for cap color [10]. Based on the observed cap color and WI values, white strains exhibited WI values exceeding 40, whereas non-white strains displayed values below 40.
2.2. Experimental Methods
2.2.1. Primer Design and Synthesis
2.2.2. CAPS/dCAPS Marker Development and Restriction Enzyme Selection
The dCAPS Finder 2.0 software was used for the selection of CAPS/dCAPS restriction enzymes. The main steps included: (1) selecting a 30 bp sequence on both sides of the SNP site and (2) inputting the original and mutated sequences of the SNP site into the dCAPS Finder 2.0 dialogue box to find restriction enzymes that could cut at the site. The corresponding markers were based on SNP-based CAPS/dCAPS markers [22]. Figure S1 shows four SNPs in white and non-white strains and the cleavage sites present at each SNP.
2.2.3. PCR Amplification System and Program
DNA extraction was performed using the plant genomic DNA extraction kit (TIANGEN Biotech, Beijing, China) following the instructions.
The PCR reaction used a 50 μL amplification system, including 25 μL 2× Phanta Max Master Mix (Vazyme, Nanjing, China), 2 μL forward primer (10 μmol/L), 2 μL reverse primer (10 μmol/L), 2 μL DNA template, and 19 μL ddH2O. PCR amplification was performed using a PCR machine (BIO-RAD, Hercules, CA, USA) with the following program: 3 min initial denaturation at 95 °C, followed by 30 s denaturation at 95 °C, 30 s annealing at 53 °C, and 20 s extension at 72 °C, with 34 cycles, and a final extension of 5 min at 72 °C.
2.2.4. Enzyme Digestion System and Electrophoresis Detection of the Digestion Products
A 50 μL enzyme digestion system was prepared, consisting of 5 μL 10× Buffer, 1 U Mse I restriction endonuclease (New England Biolabs, Ipswich, MA, USA), 1 μg of PCR product, and ddH2O to a total volume of 50 μL. After centrifugation and thorough mixing, the reaction mixture was incubated in a water bath at 37 °C for 2 h. The digestion products were then analyzed by electrophoresis on 1% agarose gels under 150 V and 100 mA conditions for 35 min.
3. Results
3.1. Primer Design and PCR Validation
Primers were designed for the four SNPs (−1590 bp T>C, 1038 bp T>C, 1273 bp A>C, and 1303 bp G>C). PCR amplification was performed using DNA from six known genotypes of parental strains (406, 358, BPC067, 358P1, HBPC067, and 358P2). Electrophoresis analysis showed single bands of the expected fragment sizes, and sequencing of the PCR products confirmed their alignment with the reference sequence of PcTYR [10]. This indicated that the primer design was reasonable and effective, enabling further experiments.
3.2. CAPS Marker Development and Screening
Six CAPS markers were designed for the four SNPs due to the diversity of restriction enzyme recognition sites (Table 1). Among them, two markers each were designed for the first (−1590 bp T>C) and third (1273 bp A>C) SNPs, named TYR-CAPS-1-1, TYR-CAPS-1-2, TYR-CAPS-3-1, and TYR-CAPS-3-2, respectively. One marker each was designed for the second (1038 bp T>C) and fourth (1303 bp G>C) SNPs, named TYR-dCAPS-2 and TYR-dCAPS-4. Initial screening with the six known genotypes of parental strains showed that TYR-CAPS-1-1, TYR-CAPS-1-2, and TYR-CAPS-3-1 did not produce bands as theorized, and therefore, they were discarded. TYR-dCAPS-2 and TYR-dCAPS-4 also did not show clear band differences between black and white strains after enzyme digestion (approximately 30 bp) and thus were discarded as well.
TYR-CAPS-3-2, on the other hand, displayed clear polymorphism between the parental strains after enzyme digestion. This marker is based on the variation in G/C alleles at the third SNP locus of the PcTYR gene, where strains with a G base have a black cap color, and strains with a C base have a white cap color. After digestion with the appropriate restriction enzyme, Mse I, TYR-CAPS-3-2 generated polymorphic bands (Figure 3). Dikaryotic black strains of 406 showed three distinct band patterns at 500 bp, 307 bp, and 193 bp, while the monokaryotic black strain 406-1 showed two band patterns at 307 bp and 193 bp. Both the dikaryotic white strain 358 and monokaryotic white strain 358-1 exhibited a single band due to the inability of the PCR product to be cleaved by the enzyme (Figure 4). TYR-CAPS-3-2 displayed good polymorphic effects after enzyme digestion and could clearly distinguish mushroom strains with black and white cap colors. The first (−1590 bp T>C), second (1038 bp T>C), and fourth (1303 bp G>C) SNP loci could not be successfully converted into stable and definitive CAPS markers capable of distinguishing dark and white strains of P. cornucopiae due to the lack of suitable restriction enzymes.
3.3. Validation of CAPS/dCAPS Markers Co-Segregating with Cap Color
Using the selected TYR-CAPS-3-2 marker, genomic DNA was extracted from 131 randomly selected strains (87 non-white strains and 44 white strains) from the F2 population. PCR amplification was performed, followed by Mse I enzyme digestion, and the resulting polymorphic bands were analyzed using agarose gel electrophoresis (Figure 5). The banding patterns obtained were consistent with the cap color (Figure 6) and WI values (Figure 7) of the strains (WI values greater than 40 indicated white strains, while values less than 40 indicated non-white strains). All non-white strains showed distinct bands at 307 bp and 193 bp after digestion, while white strains displayed only a single band at 500 bp. This confirmed the stable presence of the SNP (1303 bp G>C) between non-white and white strains and demonstrated that the TYR-CAPS-3-2 marker is stable with good reproducibility, making it capable of accurately detecting and distinguishing between non-white and white strains.
3.4. Validation of CAPS/dCAPS Markers in Other Dark-Colored Oyster mushrooms Varieties
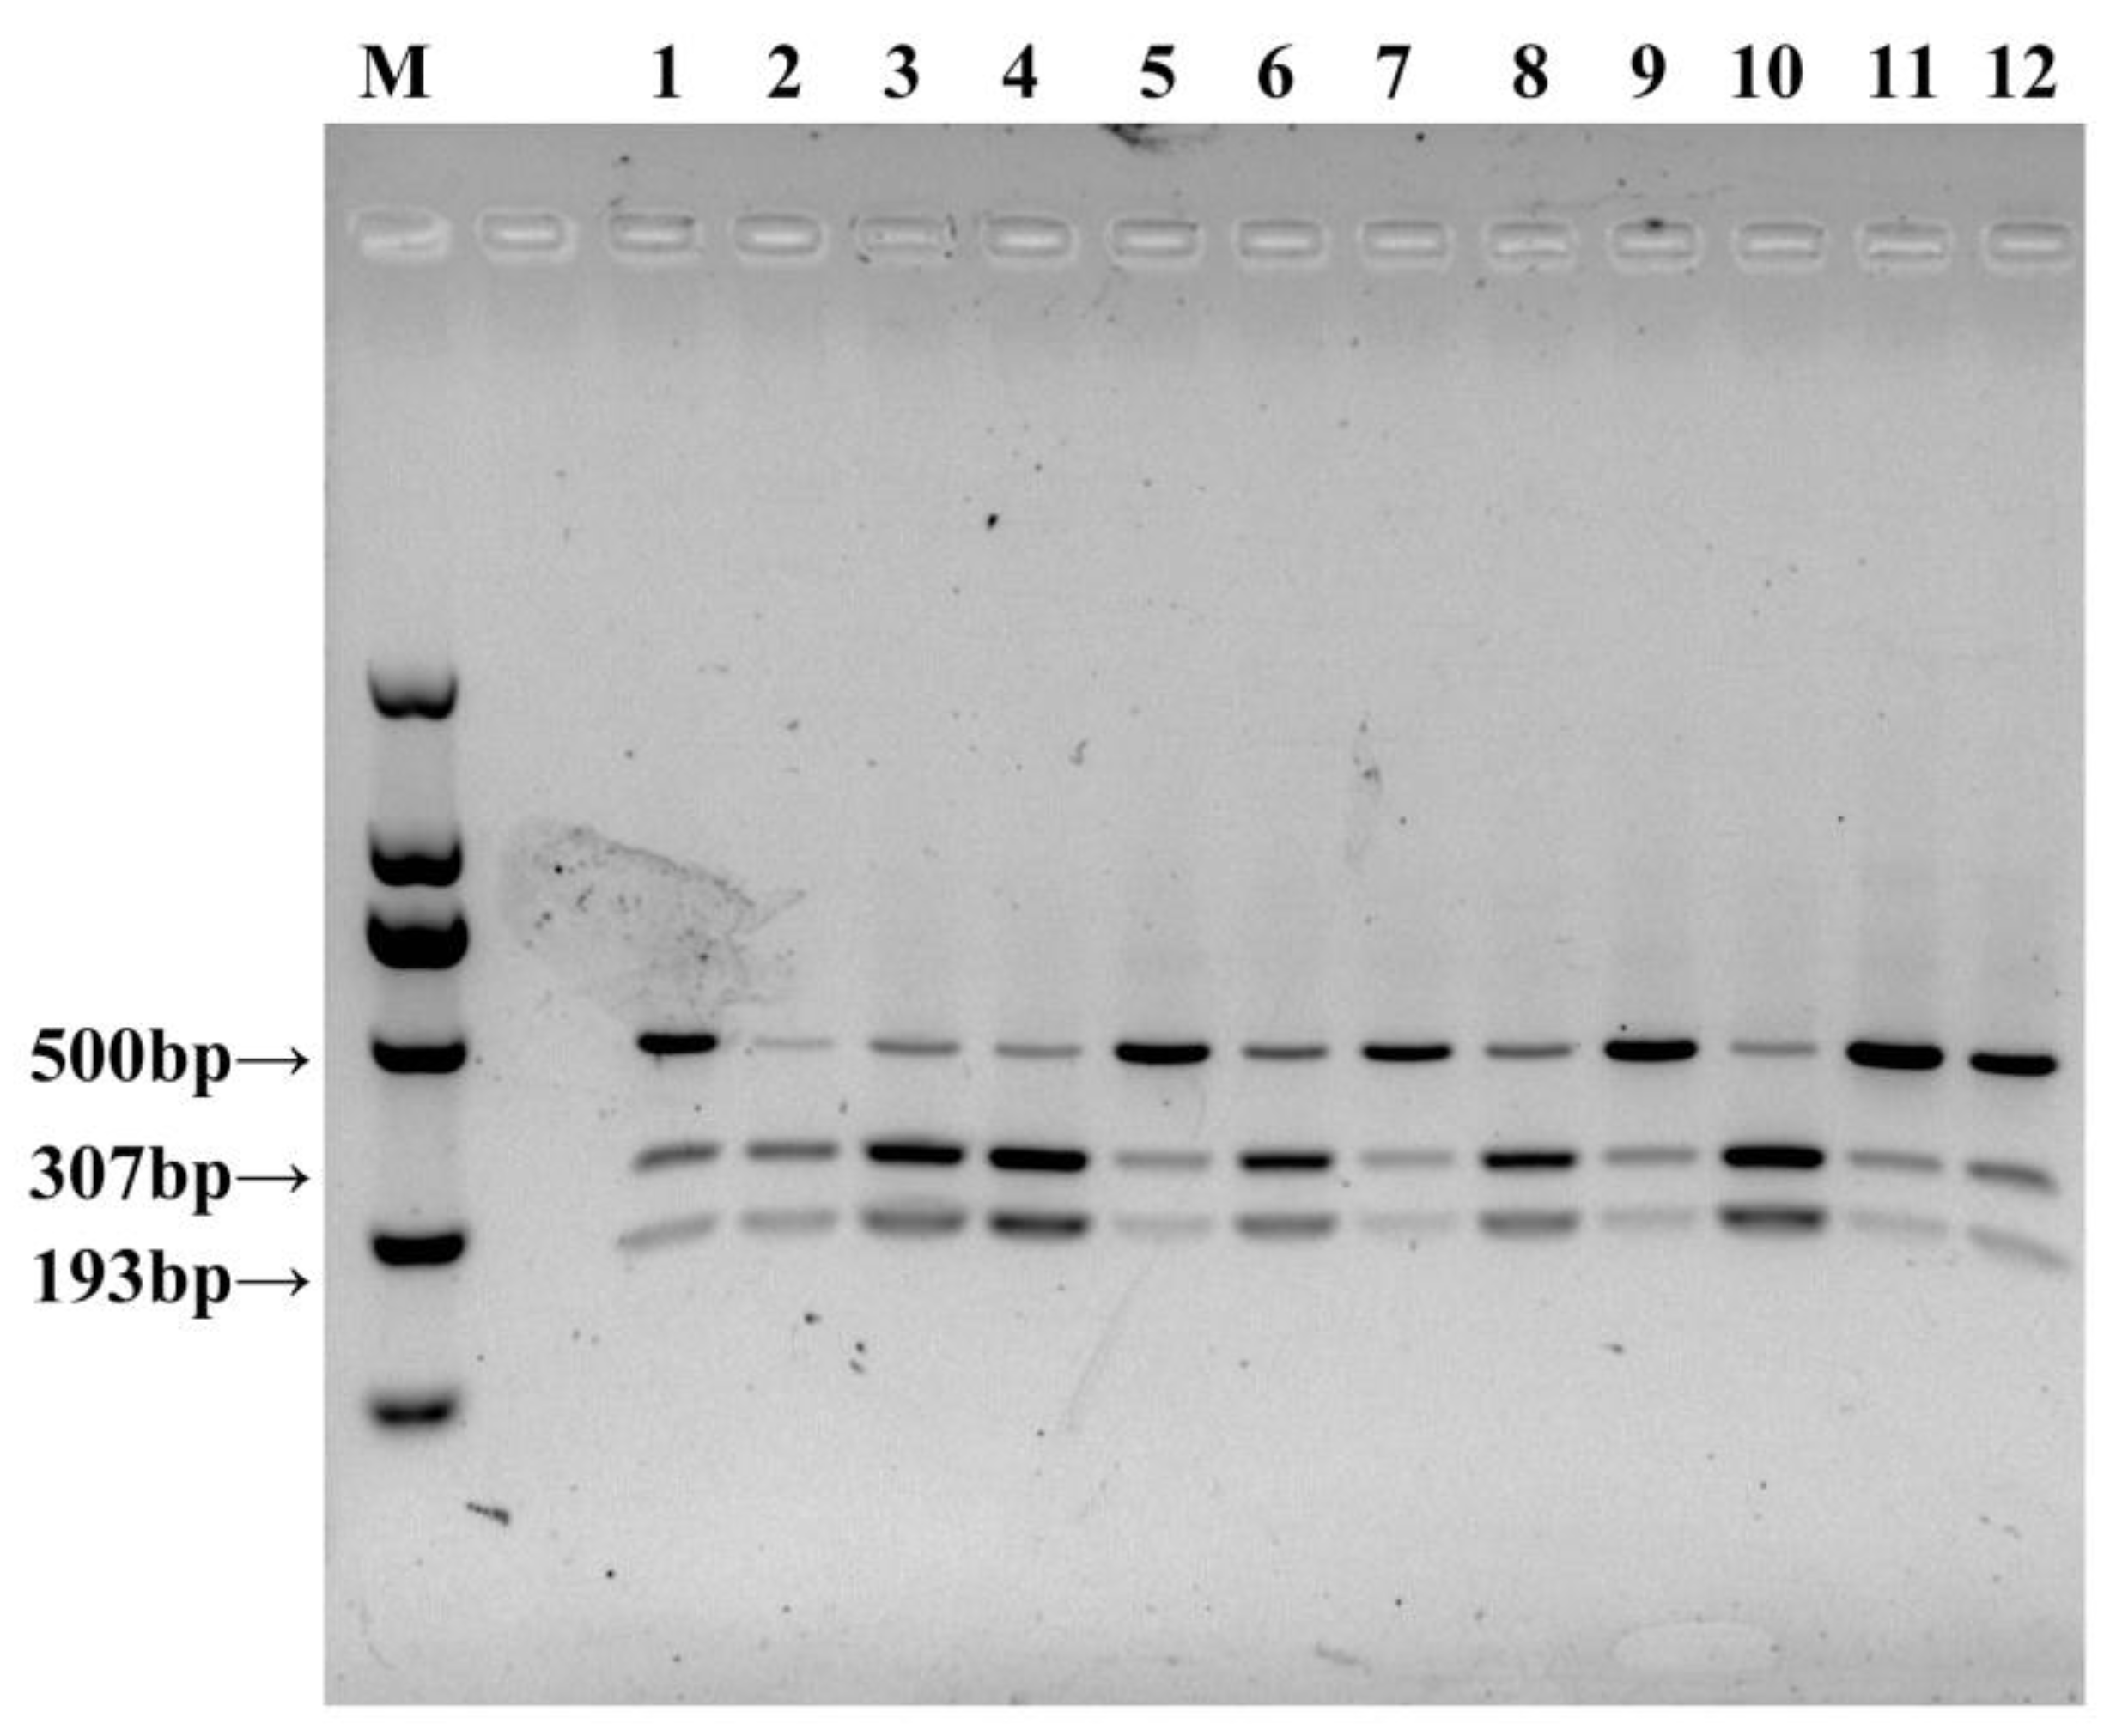
Using the newly developed TYR-CAPS-3-2 marker, PCR amplification was performed on genomic DNA from dark-colored cap strains of oyster mushrooms, including CCMSSC00328, CCMSSC00329, CCMSSC00363, CCMSSC00364, CCMSSC00499, CCMSSC00630, CCMSSC03989, CCMSSC04195, CCMSSC00387, CCMSSC00322, CCMSSC04976, and CCMSSC04977 (Table 2). These strains are all oyster mushrooms, but some of them have not yet been defined in detail in terms of taxonomic status. After Mse I enzyme digestion, the resulting polymorphic bands were analyzed using agarose gel electrophoresis, and distinct bands at 307 bp and 193 bp were observed for all tested strains (Figure 8). It was verified that the marker was also applicable to other oyster mushrooms strains and was used for the rapid identification of non-white strains.
4. Discussion
In this study, we validated the co-segregation of the aforementioned SNPs with the cap color traits and developed molecular markers to facilitate effective screening for the future targeted breeding of cap color traits.
Studies have shown that SNPs can be closely linked to individual traits, and SNPs at different positions may affect gene expression and phenotype, but through different pathways [23]. The four SNPs present between the PcTYR of white and non-white strains may affect gene expression through different pathways. Non-synonymous coding SNPs directly change the amino acid composition of the encoded protein (gene changes leading to changes at the protein level), and their function depends on whether the variant amino acid site is critical for the protein structure or function [24]. But none of the four SNPs had this type. Of the four SNPs, three are in the intron region and one is in the promoter region. Although promoter and intron regions do not directly make up the structure of proteins, they can influence gene expression. Synonymous coding SNPs themselves do not change the protein sequence but may affect promoter activity, mRNA conformation and stability [25], or change the protein folding rate [26], thereby causing changes in protein structure, function, and expression levels [27]. SNPs located in introns mainly rely on affecting splice site activity to influence gene function [28]. During the transcription process, introns are excised, but excised introns still affect initial transcription, translation efficiency, etc. Intronic sequences that are cut are mostly degraded, but some introns that are not degraded produce functional non-coding RNA. Intron is the location of selective splicing during transcription, and its presence ensures the diversity of gene transcription splicing [29]. As the key rate-limiting enzyme in the melanin synthesis pathway, the expression activity of tyrosinase directly affects the amount of melanin produced. The CAPS marker developed in this study is located in an intron and may cause changes in or the inactivation of splice sites, leading to changes in its expression at the translation level, resulting in changes in the protein sequence and thus changing the tyrosinase enzyme activity, affecting the amount of melanin produced, and ultimately regulating the change in cap color [30].
Traditional breeding methods for oyster mushrooms mainly include selection breeding, hybrid breeding, mutation breeding, protoplast fusion breeding, etc., which have played an important role in the breeding process of oyster mushroom and have cultivated many excellent strains that are widely used in production. An indispensable process in breeding work is the targeted screening of breeding materials. Traditional breeding methods mainly rely on large-scale screening based on phenotypes, which are often influenced by environmental conditions, gene interactions, and other factors, leading to long screening cycles and cumbersome breeding work [31]. Molecular breeding integrates modern molecular biology techniques into traditional breeding methods, with stronger targeting and higher efficiency, greatly accelerating the breeding process. The molecular breeding of oyster mushroom started relatively late, but in recent years, with the rapid development of genomics, molecular biology, and other disciplines, molecular breeding practices of oyster mushroom have been carried out successively, mainly for molecular-marker-assisted breeding [32]. Molecular-marker-assisted breeding technology can improve the accuracy and efficiency of breeding and plays an important role in agricultural breeding. An ideal molecular marker can effectively track the target gene in a wide range of genetic backgrounds with high repeatability [33]. The CAPS marker technology combines PCR amplification and enzyme digestion, with advantages such as simple operation and reliable results, and has been widely used. In practical production, in addition to determining the cap color of strains through mushroom cultivation tests, the SNPs of the PcTYR gene can be used for the assisted selection of dark cap strains. However, SNP markers require DNA extraction and high-throughput sequencing or gene chips to obtain genotypes, and then to distinguish between dark and white cap strains, which requires a long process and higher cost. In this study, a functional CAPS marker based on the SNP mutation site of the PcTYR gene in P. cornucopiae was developed, which can be visualized through PCR amplification, enzyme digestion, and electrophoresis under laboratory conditions, achieving the rapid identification of cap color-segregating populations and assisting in the genotype screening of dark cap strains. Since dark cap is dominant to the cap, it is difficult to determine whether the dark strain is a homozygote or heterozygote for the dark allele. The CAPS marker we developed could identify whether the strain is heterozygous or homozygous for the dark alleles. The bands of 307 bp and 193 bp are the characteristic for the homozygous of the dark allele, and that of 500 bp is the feature band of homozygous the white allele. According to the results, almost all the oyster mushroom strains tested are heterozygous for dark and white alleles fruiting non-white caps.
However, CAPS markers rely on a large number of restriction endonucleases, and in practical application, the high cost of restriction endonucleases may be a problem, especially in the selection process of a large number of breeding populations [34]. Therefore, SNAP molecular markers, a type of allele-specific primer, may be another effective solution [35]. The marker is also based on the design of specific primers for amplification, and then the products are separated by electrophoresis to determine different genotypes [36]. SNP-based SNAP markers are simple, efficient, easy to read, low-cost, and can greatly improve the application of molecular-marker-assisted selection in mushroom breeding [37].
In this study, one specific CAPS marker, TYR-CAPS-3-2, was successfully developed based on the SNP locus in the PcTYR gene of P. cornucopiae. It can accurately identify and distinguish dark and white oyster mushroom strains and has good repeatability. There are multiple criteria for selecting good-quality oyster mushrooms, and we can establish more CAPS markers for the rapid detection of traits. By combining these functional markers as marker sets instead of individual marker detection, the marker sets simplify the selection of large-scale oyster mushrooms breeding, which helps to promote the application of molecular-marker-assisted breeding in oyster mushrooms.
5. Conclusions
In this study, based on the single base mutation site in the PcTYR gene of P. cornucopiae, we successfully developed one specific CAPS marker, TYR-CAPS-3-2. It was verified and found to have good repeatability and stability, confirming that the marker can identify and distinguish dark and white oyster mushroom strains. This marker provides a rapid and effective technical means for future molecular-marker-assisted breeding using the PcTYR gene.
Supplementary Materials
The following supporting information can be downloaded at: https://www.mdpi.com/article/10.3390/horticulturae9111238/s1, Figure S1: Four SNPs in white and non-white strains and the cleavage sites present at each SNP.
Author Contributions
W.G. conceived and designed research; Y.Y. participated in all experimental procedures and drafted the manuscript; Y.Z. provided an early basis; Q.C. participated in strains cultivation; C.H. and W.G. supervised the study and critically revised the manuscript. All authors have read and agreed to the published version of the manuscript.
Funding
This research was funded by National Key R&D Program of China (2022YFD1200600); the Beijing Agriculture Innovation Consortium (BAIC03); the Fundamental Research Funds for China Agriculture Research System (CARS20).
Institutional Review Board Statement
Not applicable.
Informed Consent Statement
Not applicable.
Data Availability Statement
Data is contained within the article or supplementary material.
Conflicts of Interest
The authors declare no conflict of interest.
References
- Zheng, S.Y.; Zhang, J.X.; Wang, H.X.; Huang, C.Y. Polyphasic taxonomy of cultivated oyster mushrooms in China. Edible Fungi China 2003, 3, 3–6. [Google Scholar]
- Papaspyridi, L.M.; Aligiannis, N.; Christakopoulos, P.; Skaltsounis, A.L.; Fokialakis, N. Production of bioactive metabolites with pharmaceutical and nutraceutical interest by submerged fermentation of Pleurotus ostreatus in a batch stirred tank bioreactor. In Proceedings of the 11th International Congress on Engineering and Food (ICEF), Athens, Greece, 22–26 May 2011; pp. 1746–1752. [Google Scholar]
- Barbosa, J.R.; Freitas, M.M.D.; Martins, L.H.D.; de Carvalho, R.N. Polysaccharides of mushroom Pleurotus spp.: New extraction techniques, biological activities and development of new technologies. Carbohydr. Polym. 2020, 229, 115550. [Google Scholar] [CrossRef] [PubMed]
- Pandey, A.T.; Pandey, I.; Hachenberger, Y.; Krause, B.C.; Haidar, R.; Laux, P.; Luch, A.; Singh, M.P.; Singh, A.V. Emerging paradigm against global antimicrobial resistance via bioprospecting of mushroom into novel nanotherapeutics development. Trends Food Sci. Technol. 2020, 106, 333–344. [Google Scholar] [CrossRef]
- Mishra, V.; Tomar, S.; Yadav, P.; Singh, M.P. Promising anticancer activity of polysaccharides and other macromolecules derived from oyster mushroom (Pleurotus sp.): An updated review. Int. J. Biol. Macromol. 2021, 182, 1628–1637. [Google Scholar] [CrossRef] [PubMed]
- Ma, K.; Tao, Q.Q.; Wang, K.; Han, J.J.; Bao, L.; Liu, H.W. Research advances on the secondary metabolites produced by edible mushroom Pleurotus and their bioactivities. Mycosystema 2015, 34, 569–580. [Google Scholar]
- Zhang, Y.; Wu, X.; Huang, C.; Zhang, Z.; Gao, W. Isolation and identification of pigments from oyster mushrooms with black, yellow and pink caps. Food Chem. 2022, 372, 131171. [Google Scholar] [CrossRef] [PubMed]
- Zhou, S.H.; Zeng, H.L.; Huang, J.H.; Lei, L.; Tong, X.L.; Li, S.; Zhou, Y.; Guo, H.R.; Khan, M.; Luo, L.P.; et al. Epigenetic regulation of melanogenesis. Ageing Res. Rev. 2021, 69, 101349. [Google Scholar] [CrossRef] [PubMed]
- Zhang, Y.; Gao, W.; Sonnenberg, A.; Chen, Q.; Zhang, J.X.; Huang, C.Y. Genetic linkage and physical mapping for an oyster mushroom (Pleurotus cornucopiae) and quantitative trait locus analysis for cap color. Appl. Environ. Microbiol. 2021, 87, e00953-21. [Google Scholar] [CrossRef]
- Zhang, Y.; Huang, C.Y.; van Peer, A.F.; Sonnenberg, A.S.M.; Zhao, M.W.; Gao, W. Fine mapping and functional analysis of the gene PcTYR, involved in control of cap color of Pleurotus cornucopiae. Appl. Environ. Microbiol. 2022, 88, e02173-21. [Google Scholar] [CrossRef]
- Durstewitz, G.; Polley, A.; Plieske, J.; Luerssen, H.; Graner, E.M.; Wieseke, R.; Ganal, M.W. SNP discovery by amplicon sequencing and multiplex SNP genotyping in the allopolyploid species Brassica Napus. Genome 2010, 53, 948–956. [Google Scholar] [CrossRef]
- Jiang, Y.; Lin, Q.; Han, B.; Gong, R.; Jia, S.; Wang, L.; Qiao, X.; Cui, W.; Xu, Y.; Li, Y.; et al. Molecular differentiation of different pathogenic phenotypes of infectious bursal disease viruses by RT-PCR combined with restriction fragment length polymorphism (RFLP) assay. J. Northeast Agric. Univ. (Engl. Ed.) 2019, 26, 37–45. [Google Scholar]
- Xu, J.L.; Wang, Y.; Hou, M.; Li, Q. Progresson detection methods of SNP. Mol. Plant Breed. 2015, 13, 475–482. [Google Scholar]
- Michaels, S.D.; Amasino, R.M. A robust method for detecting single-nucleotide changes as polymorphic markers by PCR. Plant J. 1998, 14, 381–385. [Google Scholar] [CrossRef] [PubMed]
- Neff, M.M.; Neff, J.D.; Chory, J.; Pepper, A.E. dCAPS, a simple technique for the genetic analysis of single nucleotide polymorphisms: Experimental applications in Arabidopsis thaliana genetics. Plant J. 1998, 14, 387–392. [Google Scholar] [CrossRef] [PubMed]
- Liu, W.; Yuan, G.; Du, L.; Guo, W.; Wang, J. A novel Pro197Glu substitution in acetolactate synthase (ALS) confers broad-spectrum resistance across ALS inhibitors. Pestic. Biochem. Physiol. 2014, 117, 31–38. [Google Scholar] [CrossRef] [PubMed]
- Massa, D.; Krenz, B.; Gerhards, R. Target-site resistance to ALS-inhibiting herbicides in Apera spica-venti populations is conferred by documented and previously unknown mutations. Weed Res. 2011, 51, 294–303. [Google Scholar] [CrossRef]
- Chi, Y.Y.; Gao, P.; Zhu, Z.C.; Luan, F.S.; Li, G.Y.; Yu, P. The QTL analysis of fruit and seed associated traits in watermelon based on CAPS markers. Sci. Agric. Sin. 2017, 50, 1282–1293. [Google Scholar]
- Chen, L.; Zhang, J.F.; Hu, M.L.; Pu, H.M.; Long, W.H.; Gao, J.Q.; Chen, F.; Zhou, X.Y.; Zhang, W.; Chen, S. Development and application of the CAPS marker for herbicide-resistant gene in M342. Jiangsu J. Agric. Sci. 2019, 35, 241–247. [Google Scholar]
- Huang, J.; Tan, Q.; Bao, D.P. Location of important functional genes of Lentinula edodes by using the SNP-CAPS molecular markers. Acta Agriculyurae Shanghai 2015, 31, 13–17. [Google Scholar]
- An, H.; Lee, H.Y.; Shim, D.; Choi, S.H.; Cho, H.; Hyun, T.K.; Jo, I.H.; Chung, J.W. Development of CAPS markers for evaluation of genetic diversity and population structure in the germplasm of button mushroom (Agaricus bisporus). J. Fungi 2021, 7, 375. [Google Scholar] [CrossRef]
- Tao, A.F.; You, Z.Y.; Xu, J.T.; Lin, L.H.; Zhang, L.W.; Qi, J.M.; Fang, P.P. Development and verification of CAPS markers based on SNPs from transcriptome of jute (Corchorus L.). Acta Agron. Sin. 2020, 46, 987–996. [Google Scholar]
- Xu, C. SVM-Based Model for Predicting the Effect of Regulatory SNPs on Gene Expression. Master’s Thesis, Suzhou University, Suzhou, China, 2012. [Google Scholar]
- Chasman, D.; Adams, R.M. Predicting the functional consequences of non-synonymous single nucleotide polymorphisms: Structure-based assessment of amino acid variation 1. J. Mol. Biol. 2001, 307, 683–706. [Google Scholar] [CrossRef] [PubMed]
- Capon, F.; Allen, M.H.; Ameen, M.; Burden, A.D.; Tillman, D.; Barker, J.N.; Trembath, R.C. A synonymous SNP of the corneodesmosin gene leads to increased mRNA stability and demonstrates association with psoriasis across diverse ethnic groups. Hum. Mol. Genet. 2004, 13, 2361–2368. [Google Scholar] [CrossRef] [PubMed]
- Kimchi-Sarfaty, C.; Oh, J.M.; Kim, I.W.; Sauna, Z.E.; Calcagno, A.M.; Ambudkar, S.V.; Gottesman, M.M. A “silent” polymorphism in the MDR1 gene changes substrate specificity. Science 2007, 315, 525–528. [Google Scholar] [CrossRef] [PubMed]
- Hunt, R.; Sauna, Z.E.; Ambudkar, S.V.; Gottesman, M.M.; Kimchi-Sarfaty, C. Silent (Synonymous) SNPs: Should we care about them? In Single Nucleotide Polymorphisms: Methods and Protocols, 2nd ed.; Komar, A.A., Ed.; Methods in Molecular Biology; Humana Press: Totowa, NJ, USA, 2009; pp. 23–39. [Google Scholar]
- Song, N.N.; Chai, Z.X.; Zhong, J.C. Research advances on long non-coding RNA. Biotechnol. Bull. 2016, 32, 23–31. [Google Scholar]
- Flynt, A.S.; Greimann, J.C.; Chung, W.J.; Lima, C.D.; Lai, E.C. MicroRNA biogenesis via splicing and exosome-mediated trimming in Drosophila. Mol. Cell 2010, 38, 900–907. [Google Scholar] [CrossRef] [PubMed]
- Mercer, T.R.; Mattick, J.S. Structure and function of long noncoding RNAs in epigenetic regulation. Nat. Struct. Mol. Biol. 2013, 20, 300–307. [Google Scholar] [CrossRef]
- Chen, S.T.; Li, R.C. Present research on breeding methods of edible fungi and the problems in It as well as the prospects. J. Anhui Agric. Sci. 2012, 40, 5850–5852. [Google Scholar]
- Li, Y.; Wang, J.K.; Qiu, L.J.; Ma, Y.Z.; Li, X.H.; Wan, J.M. Crop molecular breeding in China: Current status and perspectives. Acta Agron. Sin. 2010, 36, 1425–1430. [Google Scholar]
- Wang, Y.Q.; Sun, Z.Q.; Zheng, Z.; Huang, B.Y.; Dong, W.Z.; Tang, F.S.; Zhang, X.Y. Status and prospect of crop molecular marker assisted selection breeding. Jiangsu Agric. Sci. 2018, 46, 6–12. [Google Scholar]
- Lestari, P.; Koh, H. Development of new CAPS/dCAPS and SNAP markers for rice eating quality. Hayati J. Biosci. 2013, 20, 15–23. [Google Scholar] [CrossRef]
- Gupta, P.K.; Roy, J.K.; Prasad, M. Single nucleotide polymorphisms: A new paradigm for molecular marker technology and DNA polymorphism detection with emphasis on their use in plants. Curr. Sci. 2001, 80, 524–535. [Google Scholar]
- Drenkard, E.; Richter, B.G.; Rozen, S.; Stutius, L.M.; Angell, N.A.; Mindrinos, M.; Cho, R.J.; Oefner, P.J.; Davis, R.W.; Ausubel, F.M. A simple procedure for the analysis of single nucleotide polymorphisms facilitates map-based cloning in Arabidopsis. Plant Physiol. 2000, 124, 1483–1492. [Google Scholar] [CrossRef] [PubMed]
- He, Y.; Han, Y.P.; Jiang, L.; Xu, C.W.; Lu, J.F.; Xu, M.L. Functional analysis of starch-synthesis genes in determining rice eating and cooking qualities. Mol. Breed. 2006, 18, 277–290. [Google Scholar] [CrossRef]
Figure 1.
SNP variants in the genic and 2.5 kb promoter region of PcTYR. Panel (a) represents the one SNP at the promoter region (bp −1590, T to C), and panel (b) shows the three SNPs at an intron region (bp 1038, T to C; bp 1293, A to C; bp 1303, G to C) [10].
Figure 1.
SNP variants in the genic and 2.5 kb promoter region of PcTYR. Panel (a) represents the one SNP at the promoter region (bp −1590, T to C), and panel (b) shows the three SNPs at an intron region (bp 1038, T to C; bp 1293, A to C; bp 1303, G to C) [10].
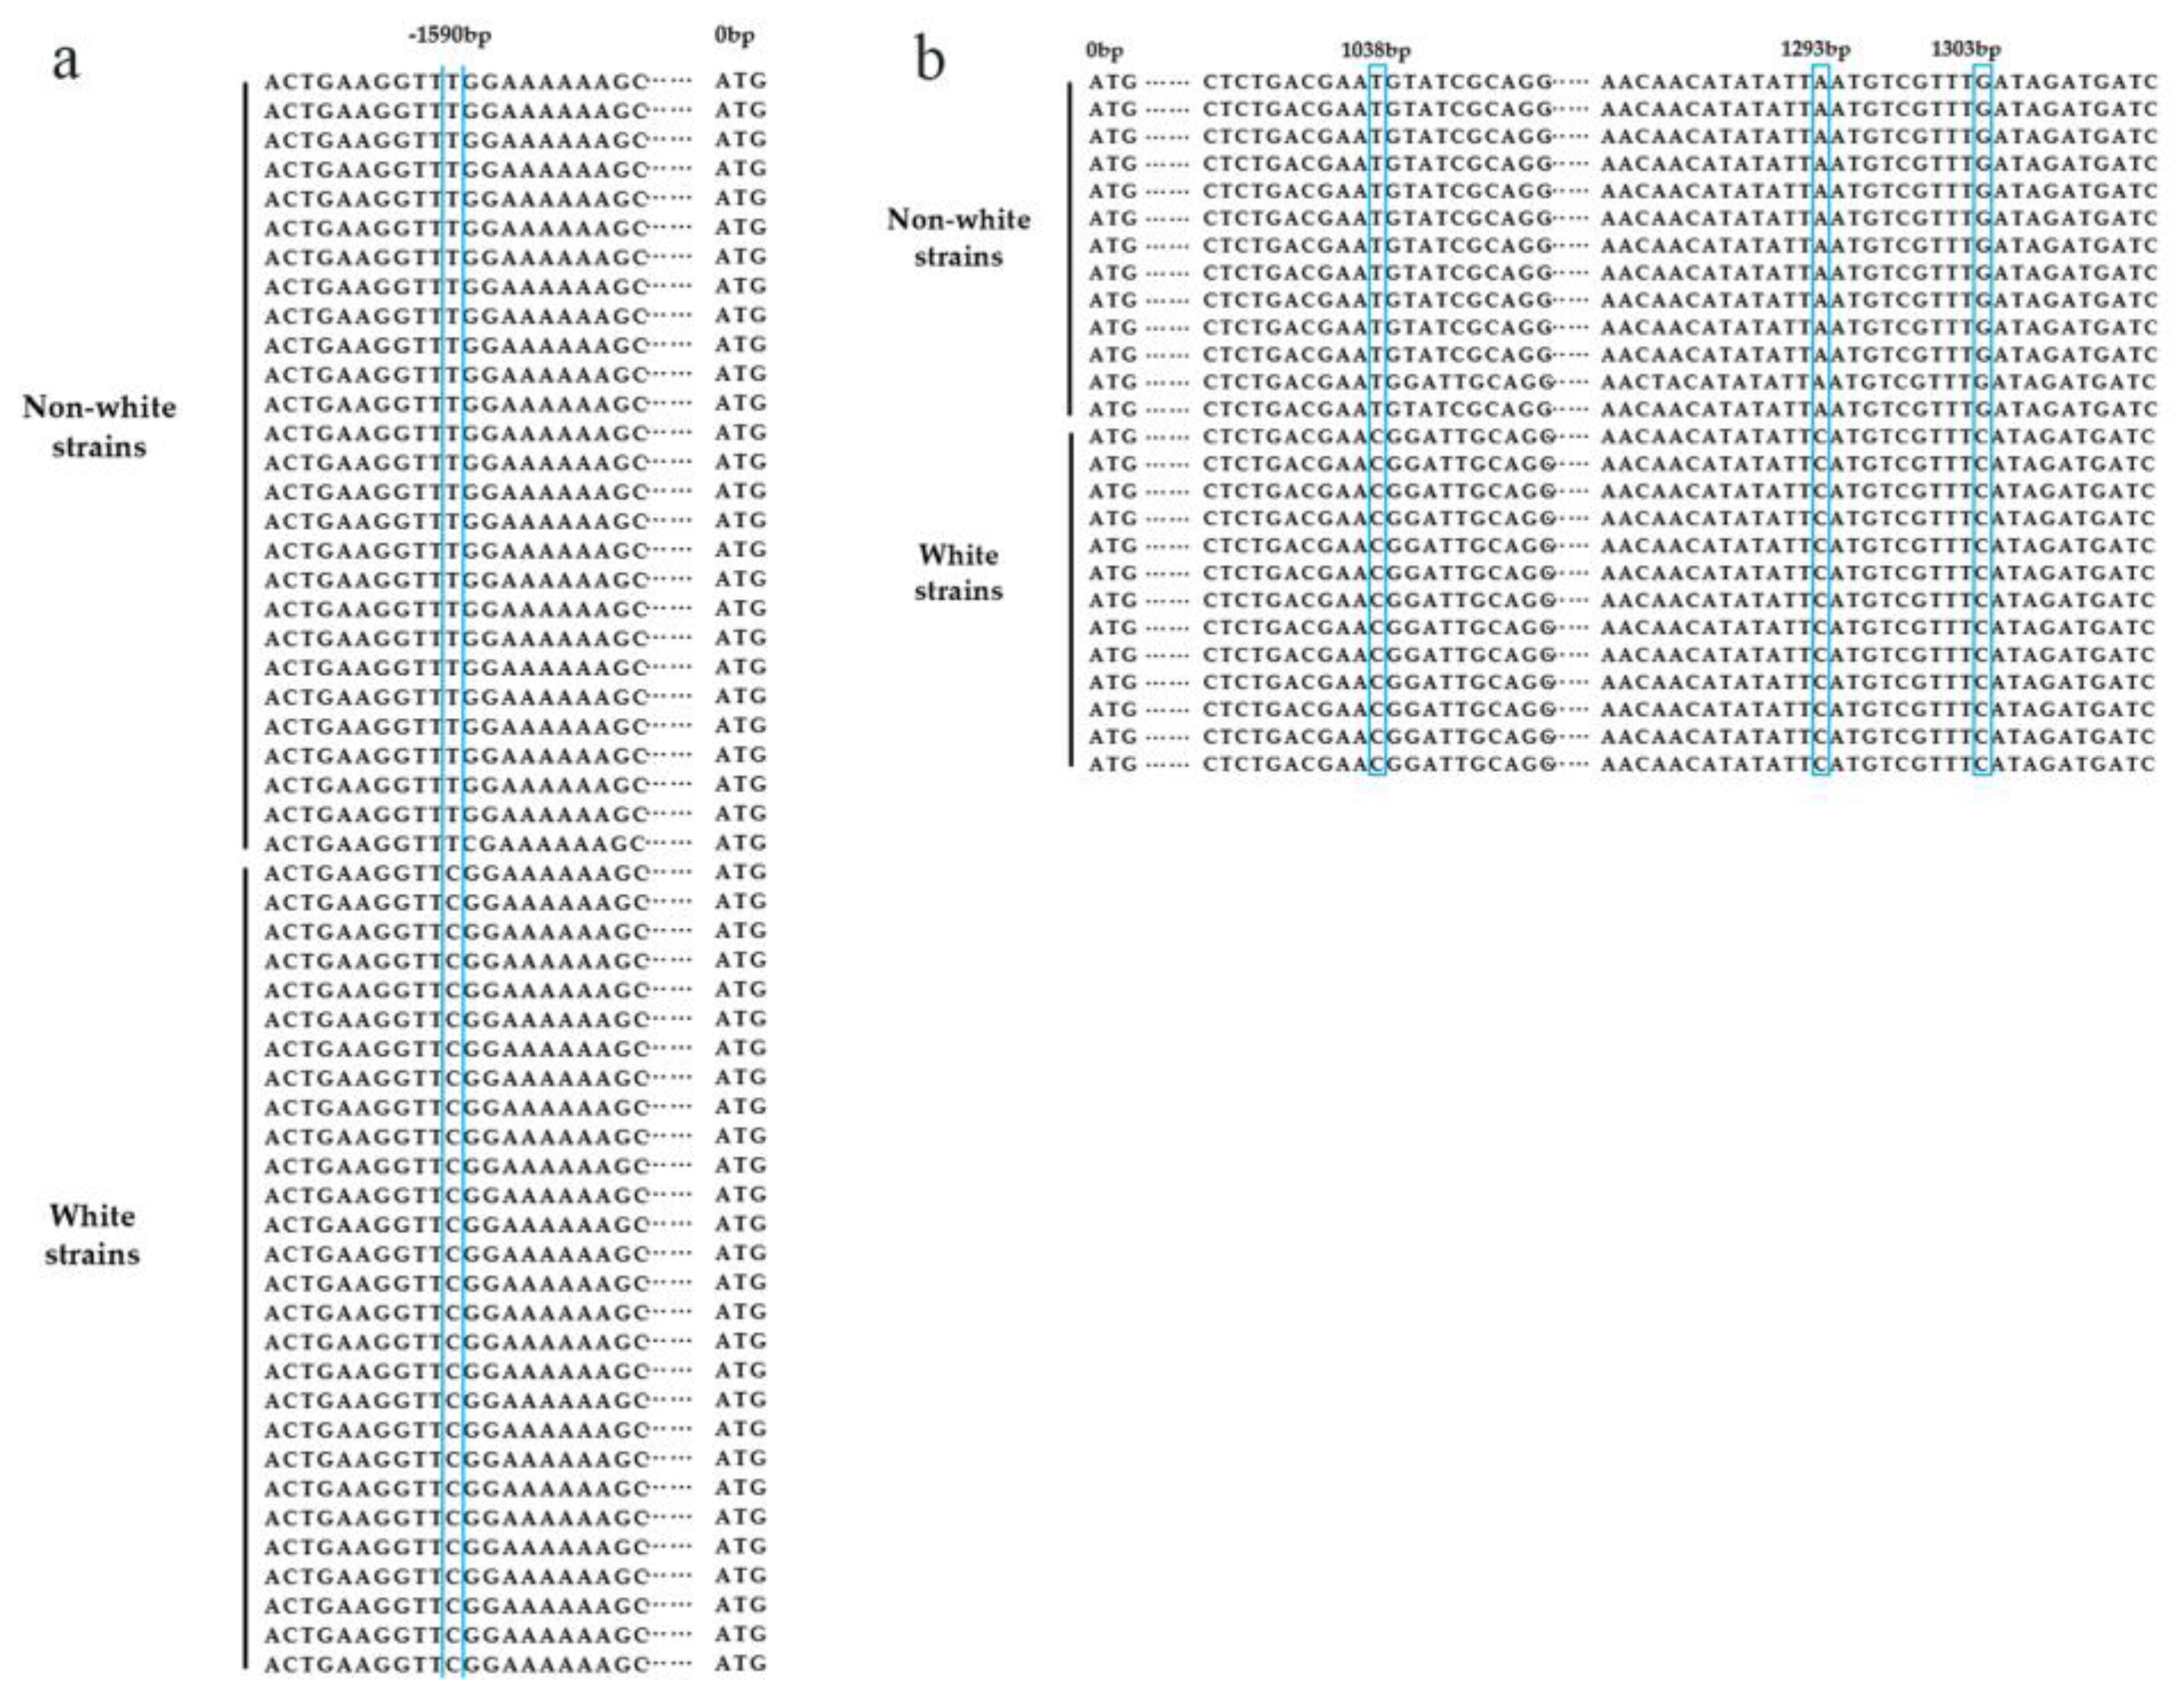
Figure 2.
Flow diagram to illustrate the generation of the segregating population.
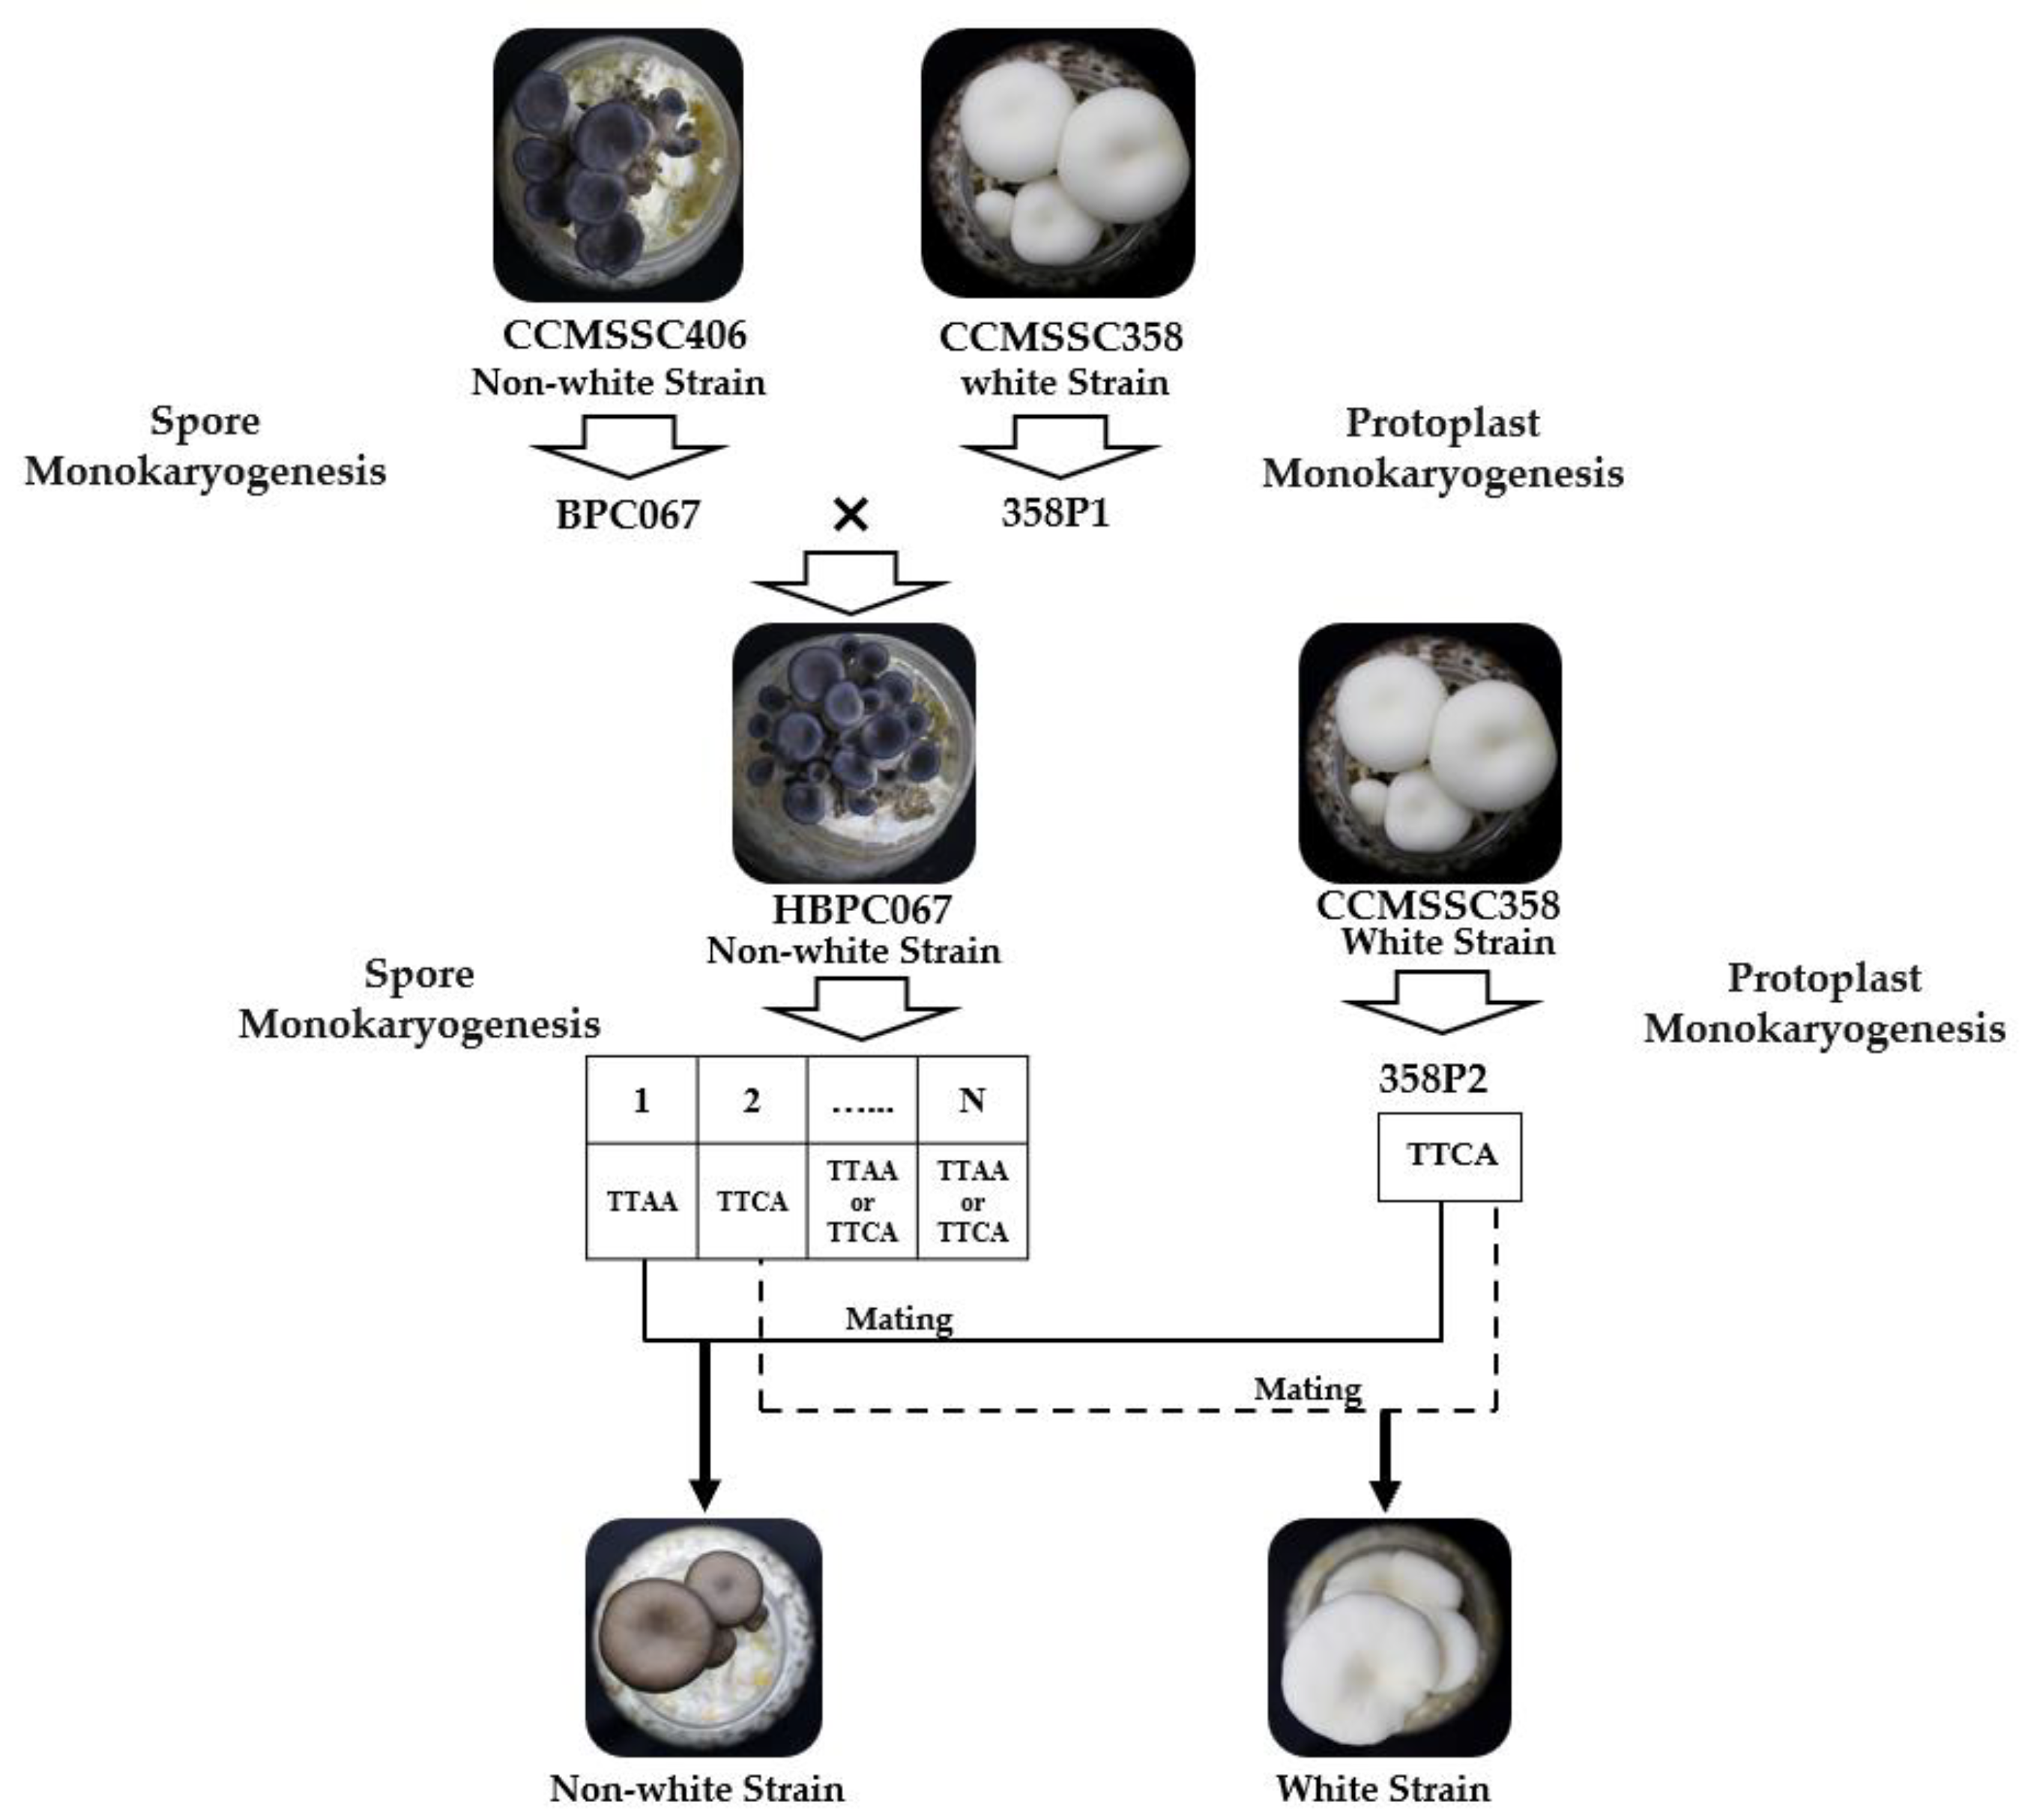
Figure 3.
Schematic diagram of restriction enzyme Mse I digestion. The red line indicates how the restriction site is digested, and the red X indicates that the fragment cannot be digested if the restriction site is incorrect.
Figure 3.
Schematic diagram of restriction enzyme Mse I digestion. The red line indicates how the restriction site is digested, and the red X indicates that the fragment cannot be digested if the restriction site is incorrect.
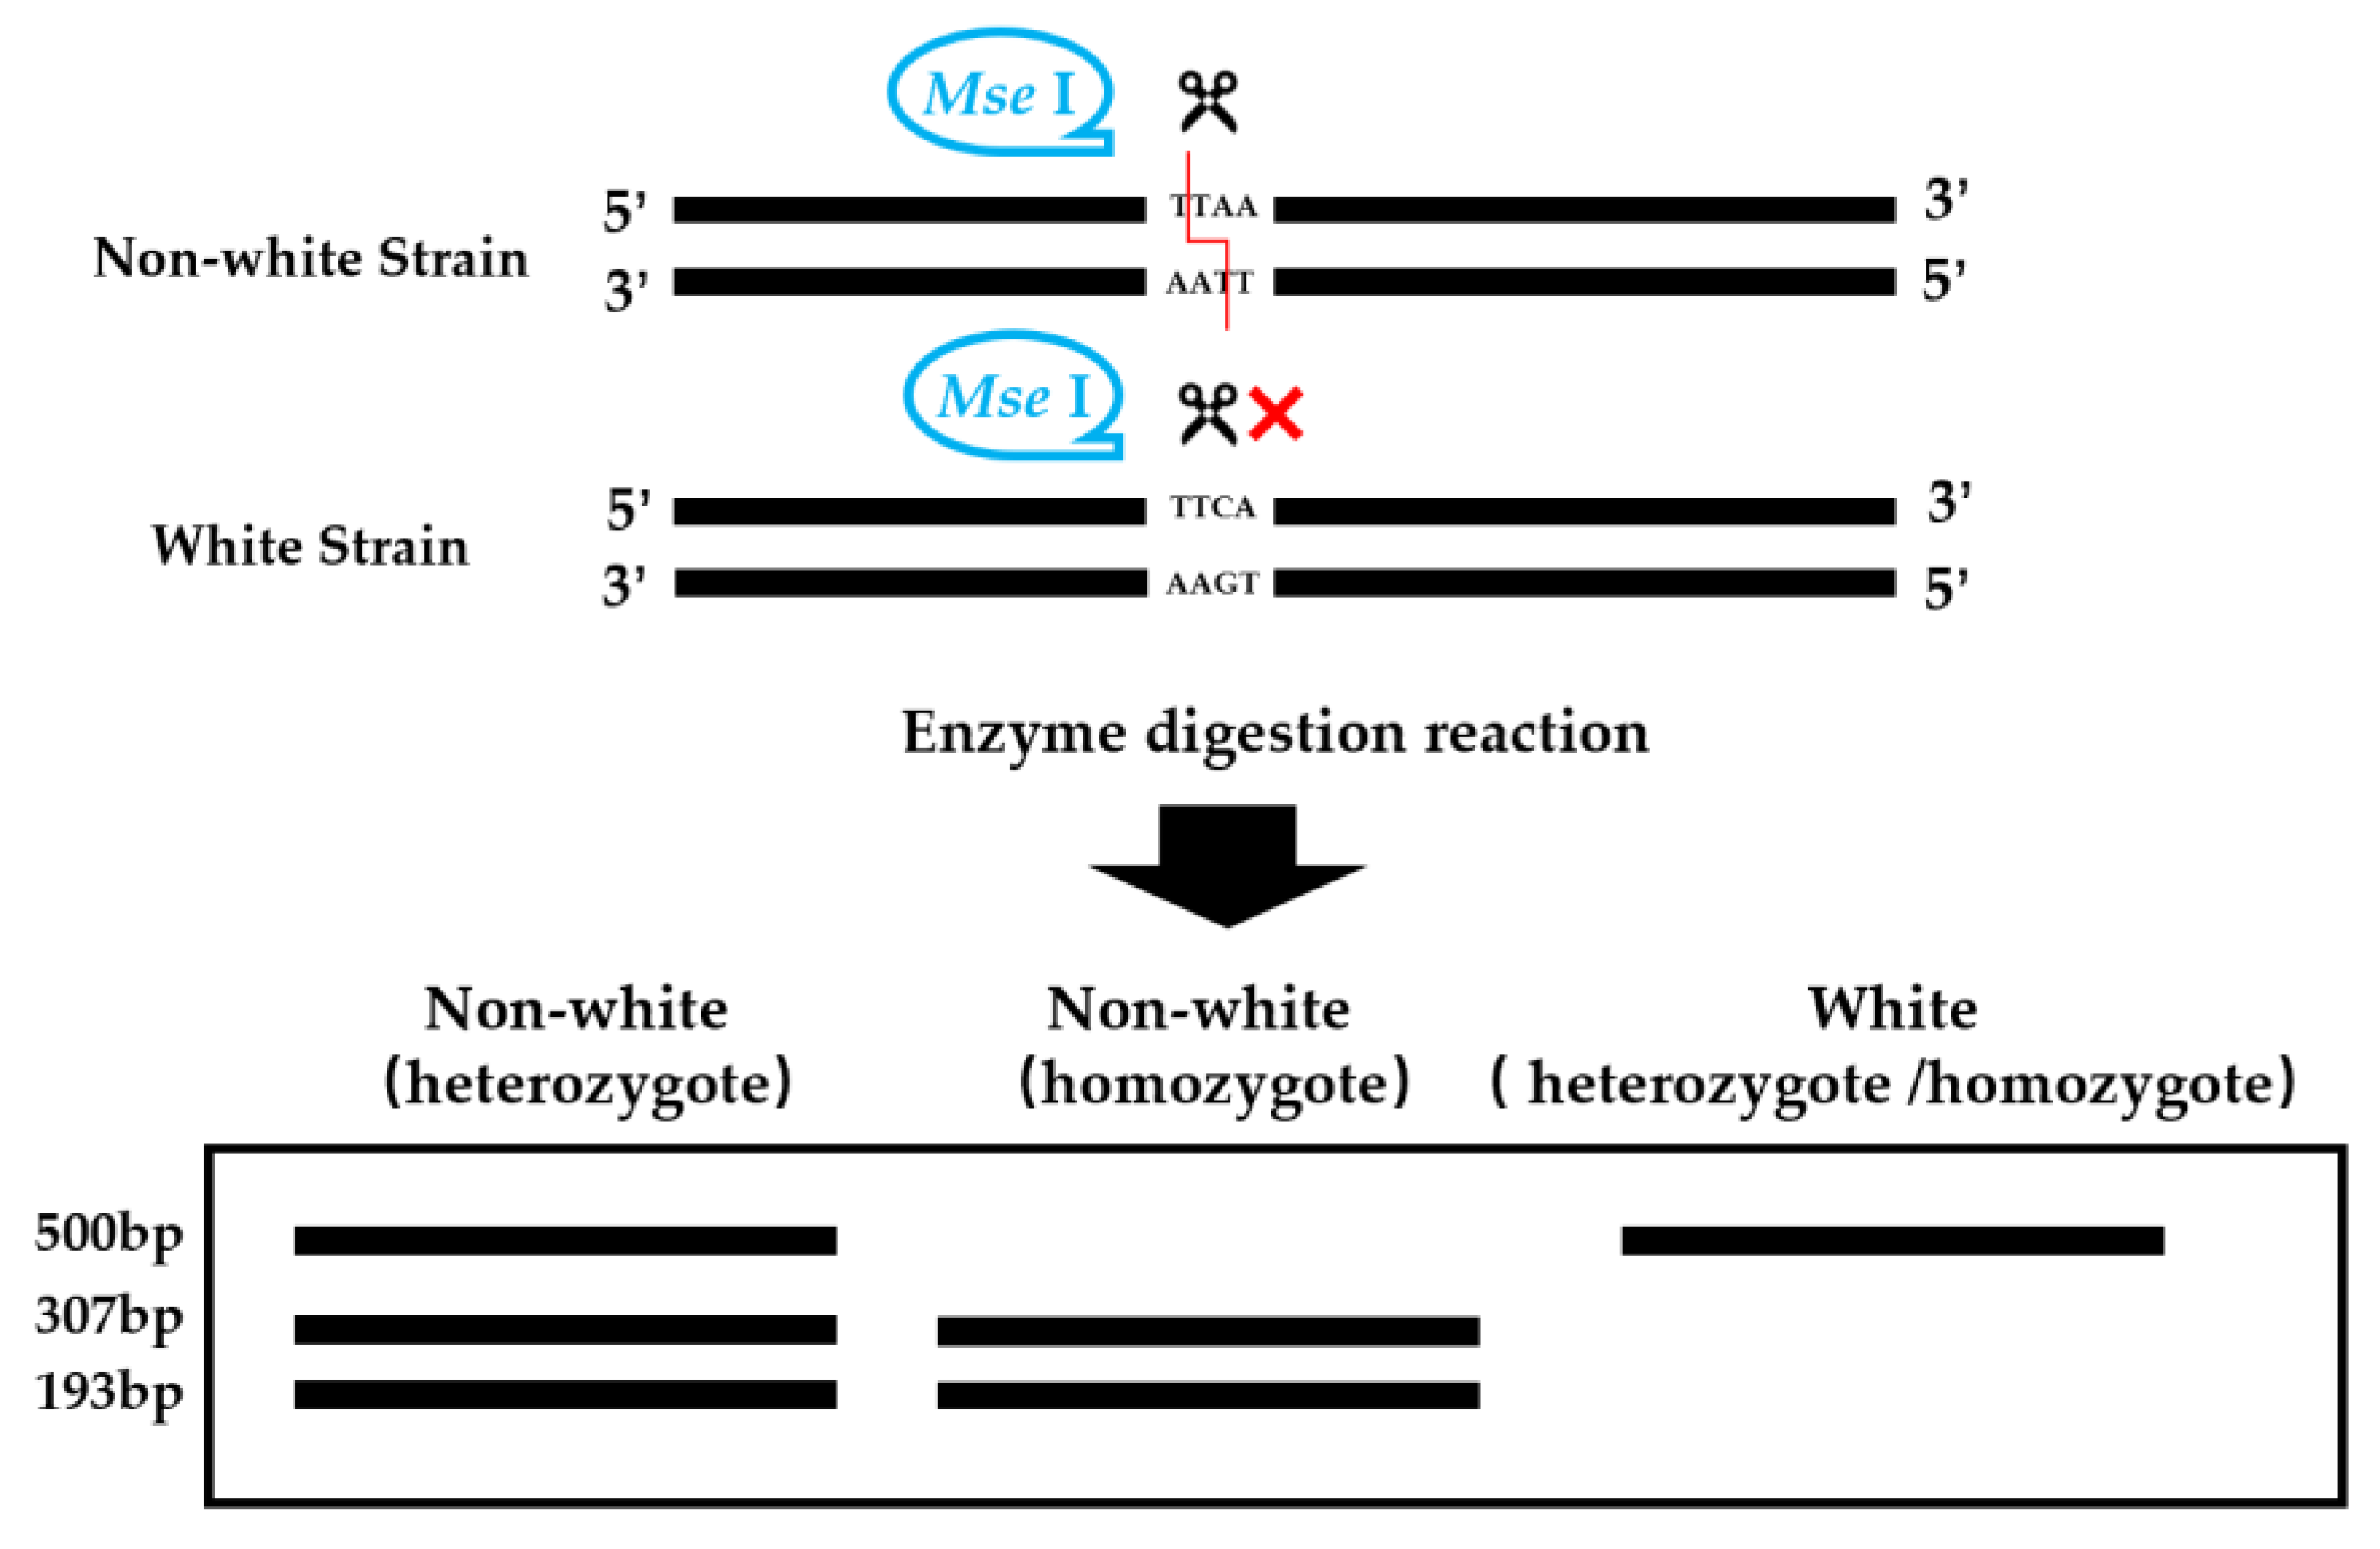
Figure 4.
Polymorphic bands obtained by restriction enzyme Mse I digestion of the white and non-white strains (parental lines). M: 2000 bp DNA Marker. The order of samples is CCMSSC00406, HBPC067, 406P1, BPC067, CCMSSC00358, and 358P1.
Figure 4.
Polymorphic bands obtained by restriction enzyme Mse I digestion of the white and non-white strains (parental lines). M: 2000 bp DNA Marker. The order of samples is CCMSSC00406, HBPC067, 406P1, BPC067, CCMSSC00358, and 358P1.
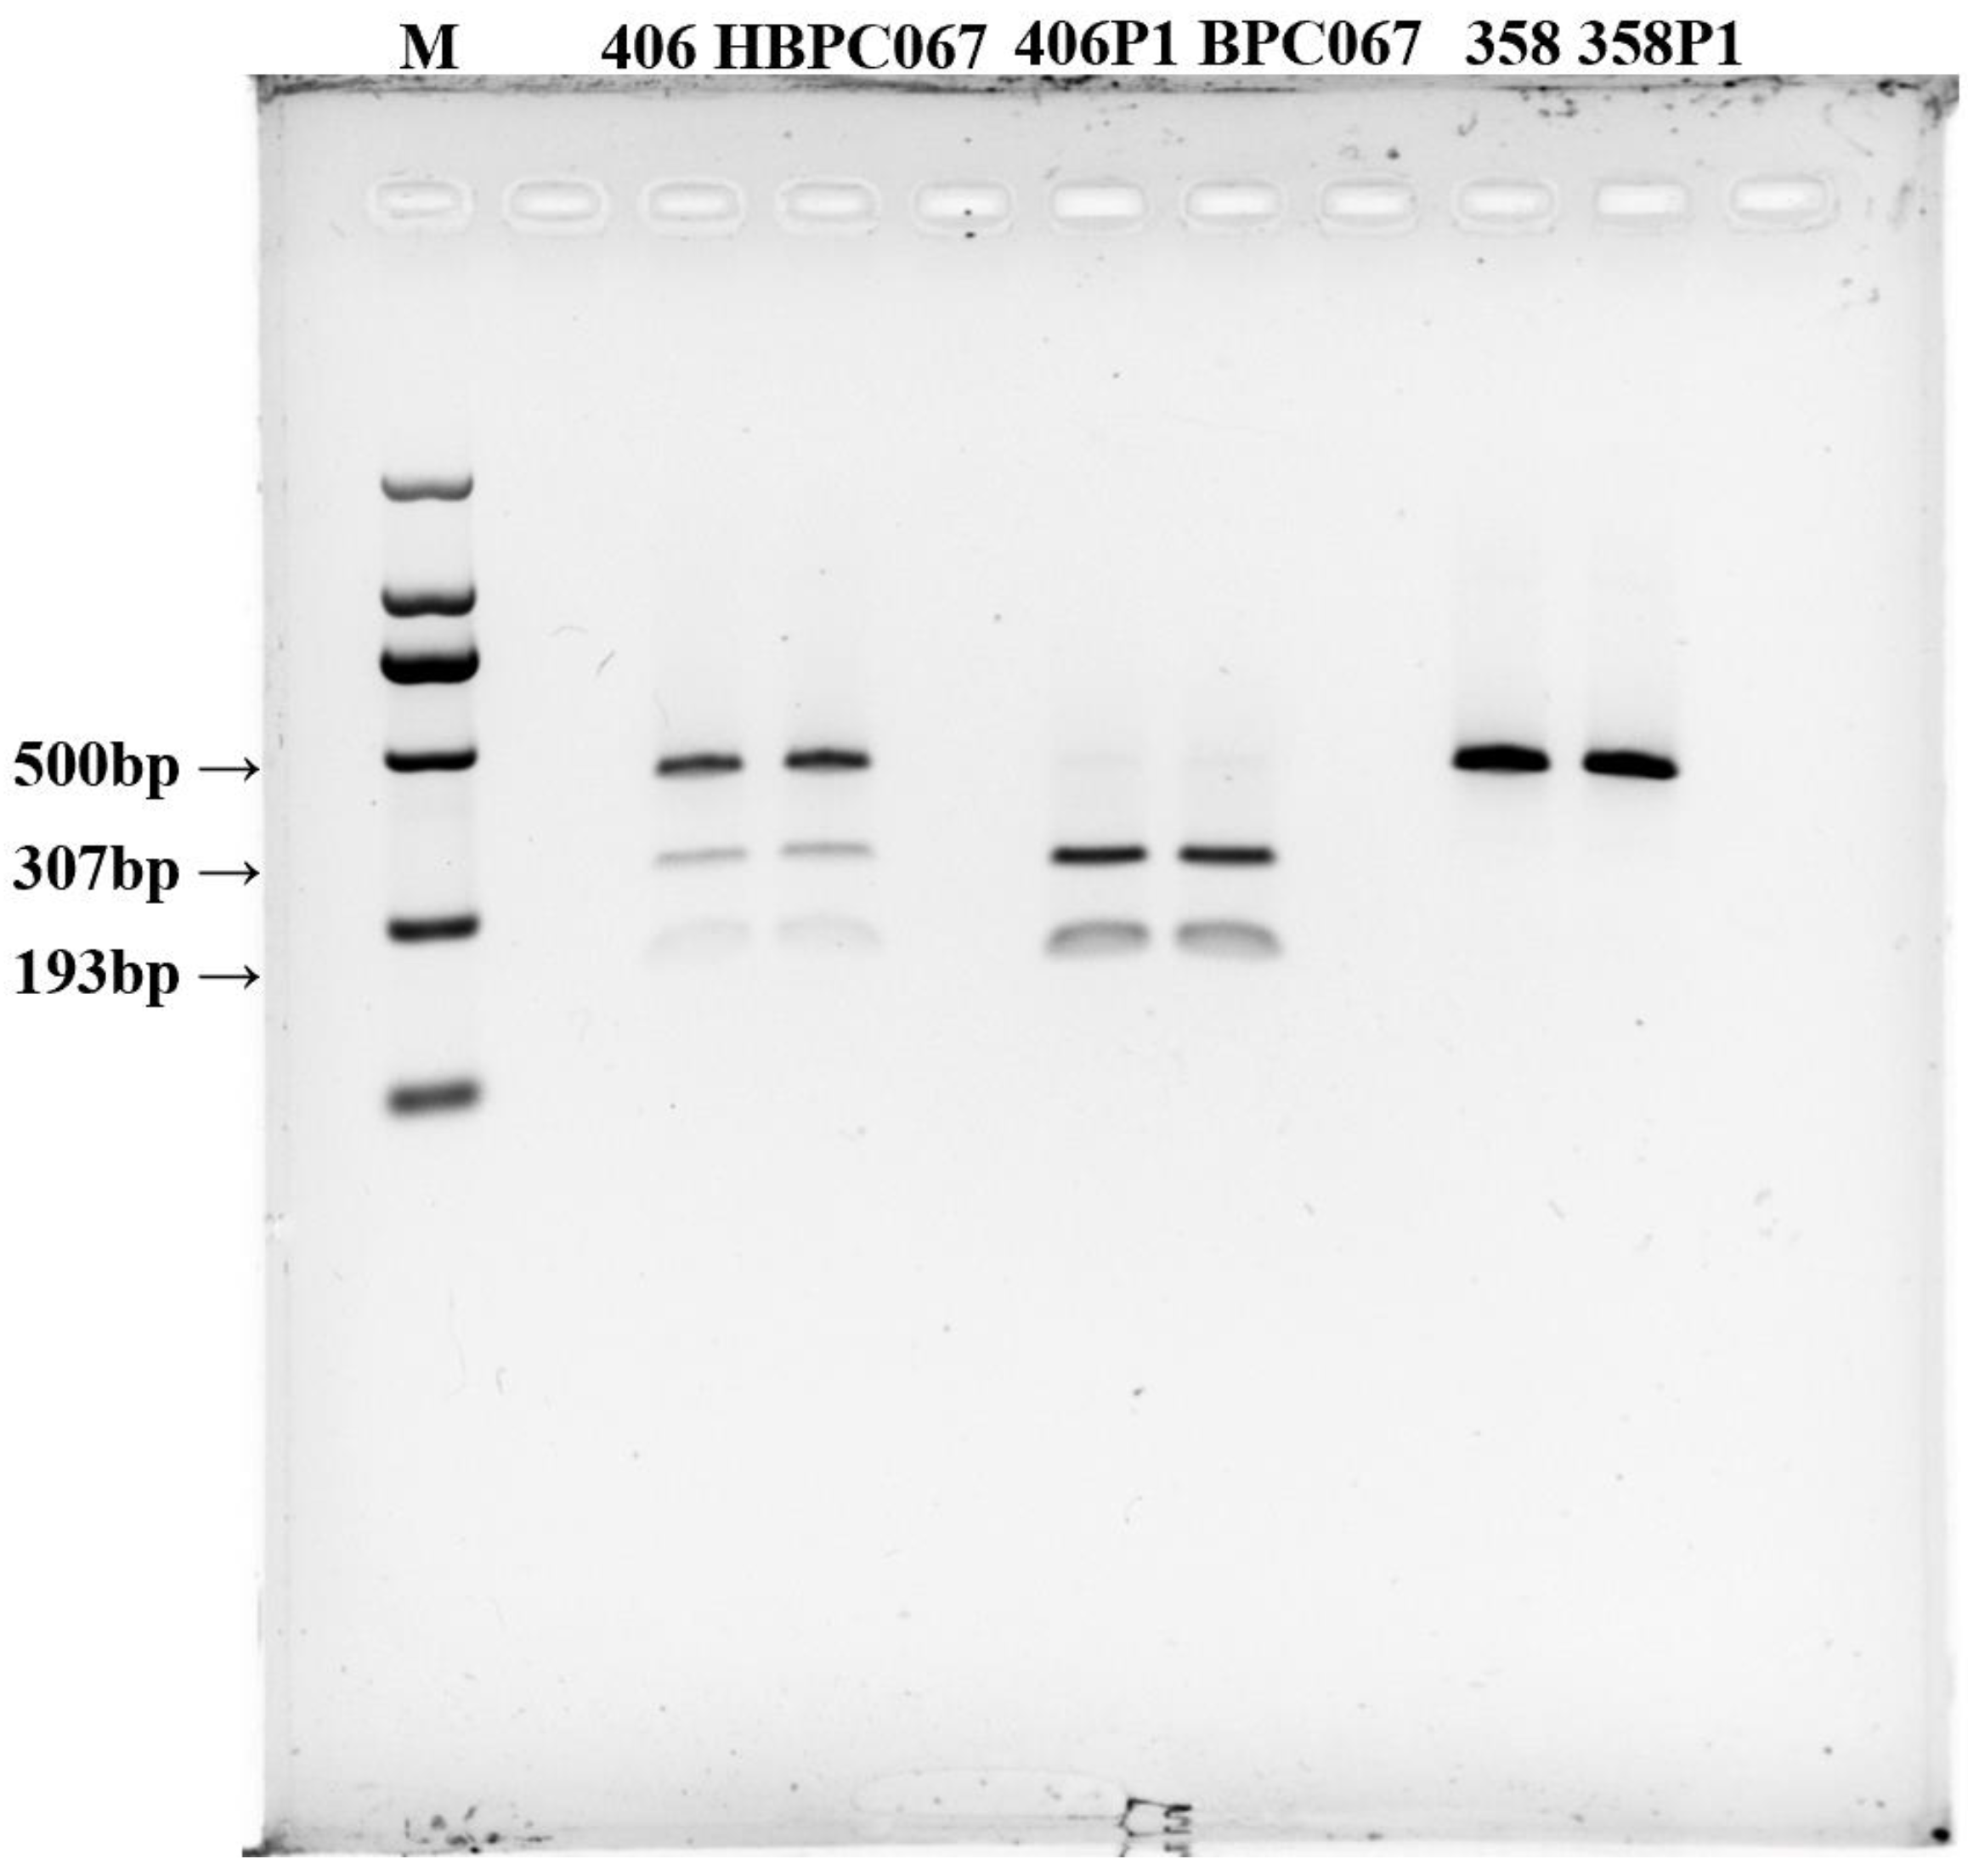
Figure 5.
Polymorphic bands of restriction endonuclease Mse I of 131 individual strains (F2 population). M: 2000 bp DNA Marker; (a–d) is the enzyme cut band of non-white strains in the separated group; (e,f) is the enzyme cut band of the white strain in the separated group.
Figure 5.
Polymorphic bands of restriction endonuclease Mse I of 131 individual strains (F2 population). M: 2000 bp DNA Marker; (a–d) is the enzyme cut band of non-white strains in the separated group; (e,f) is the enzyme cut band of the white strain in the separated group.
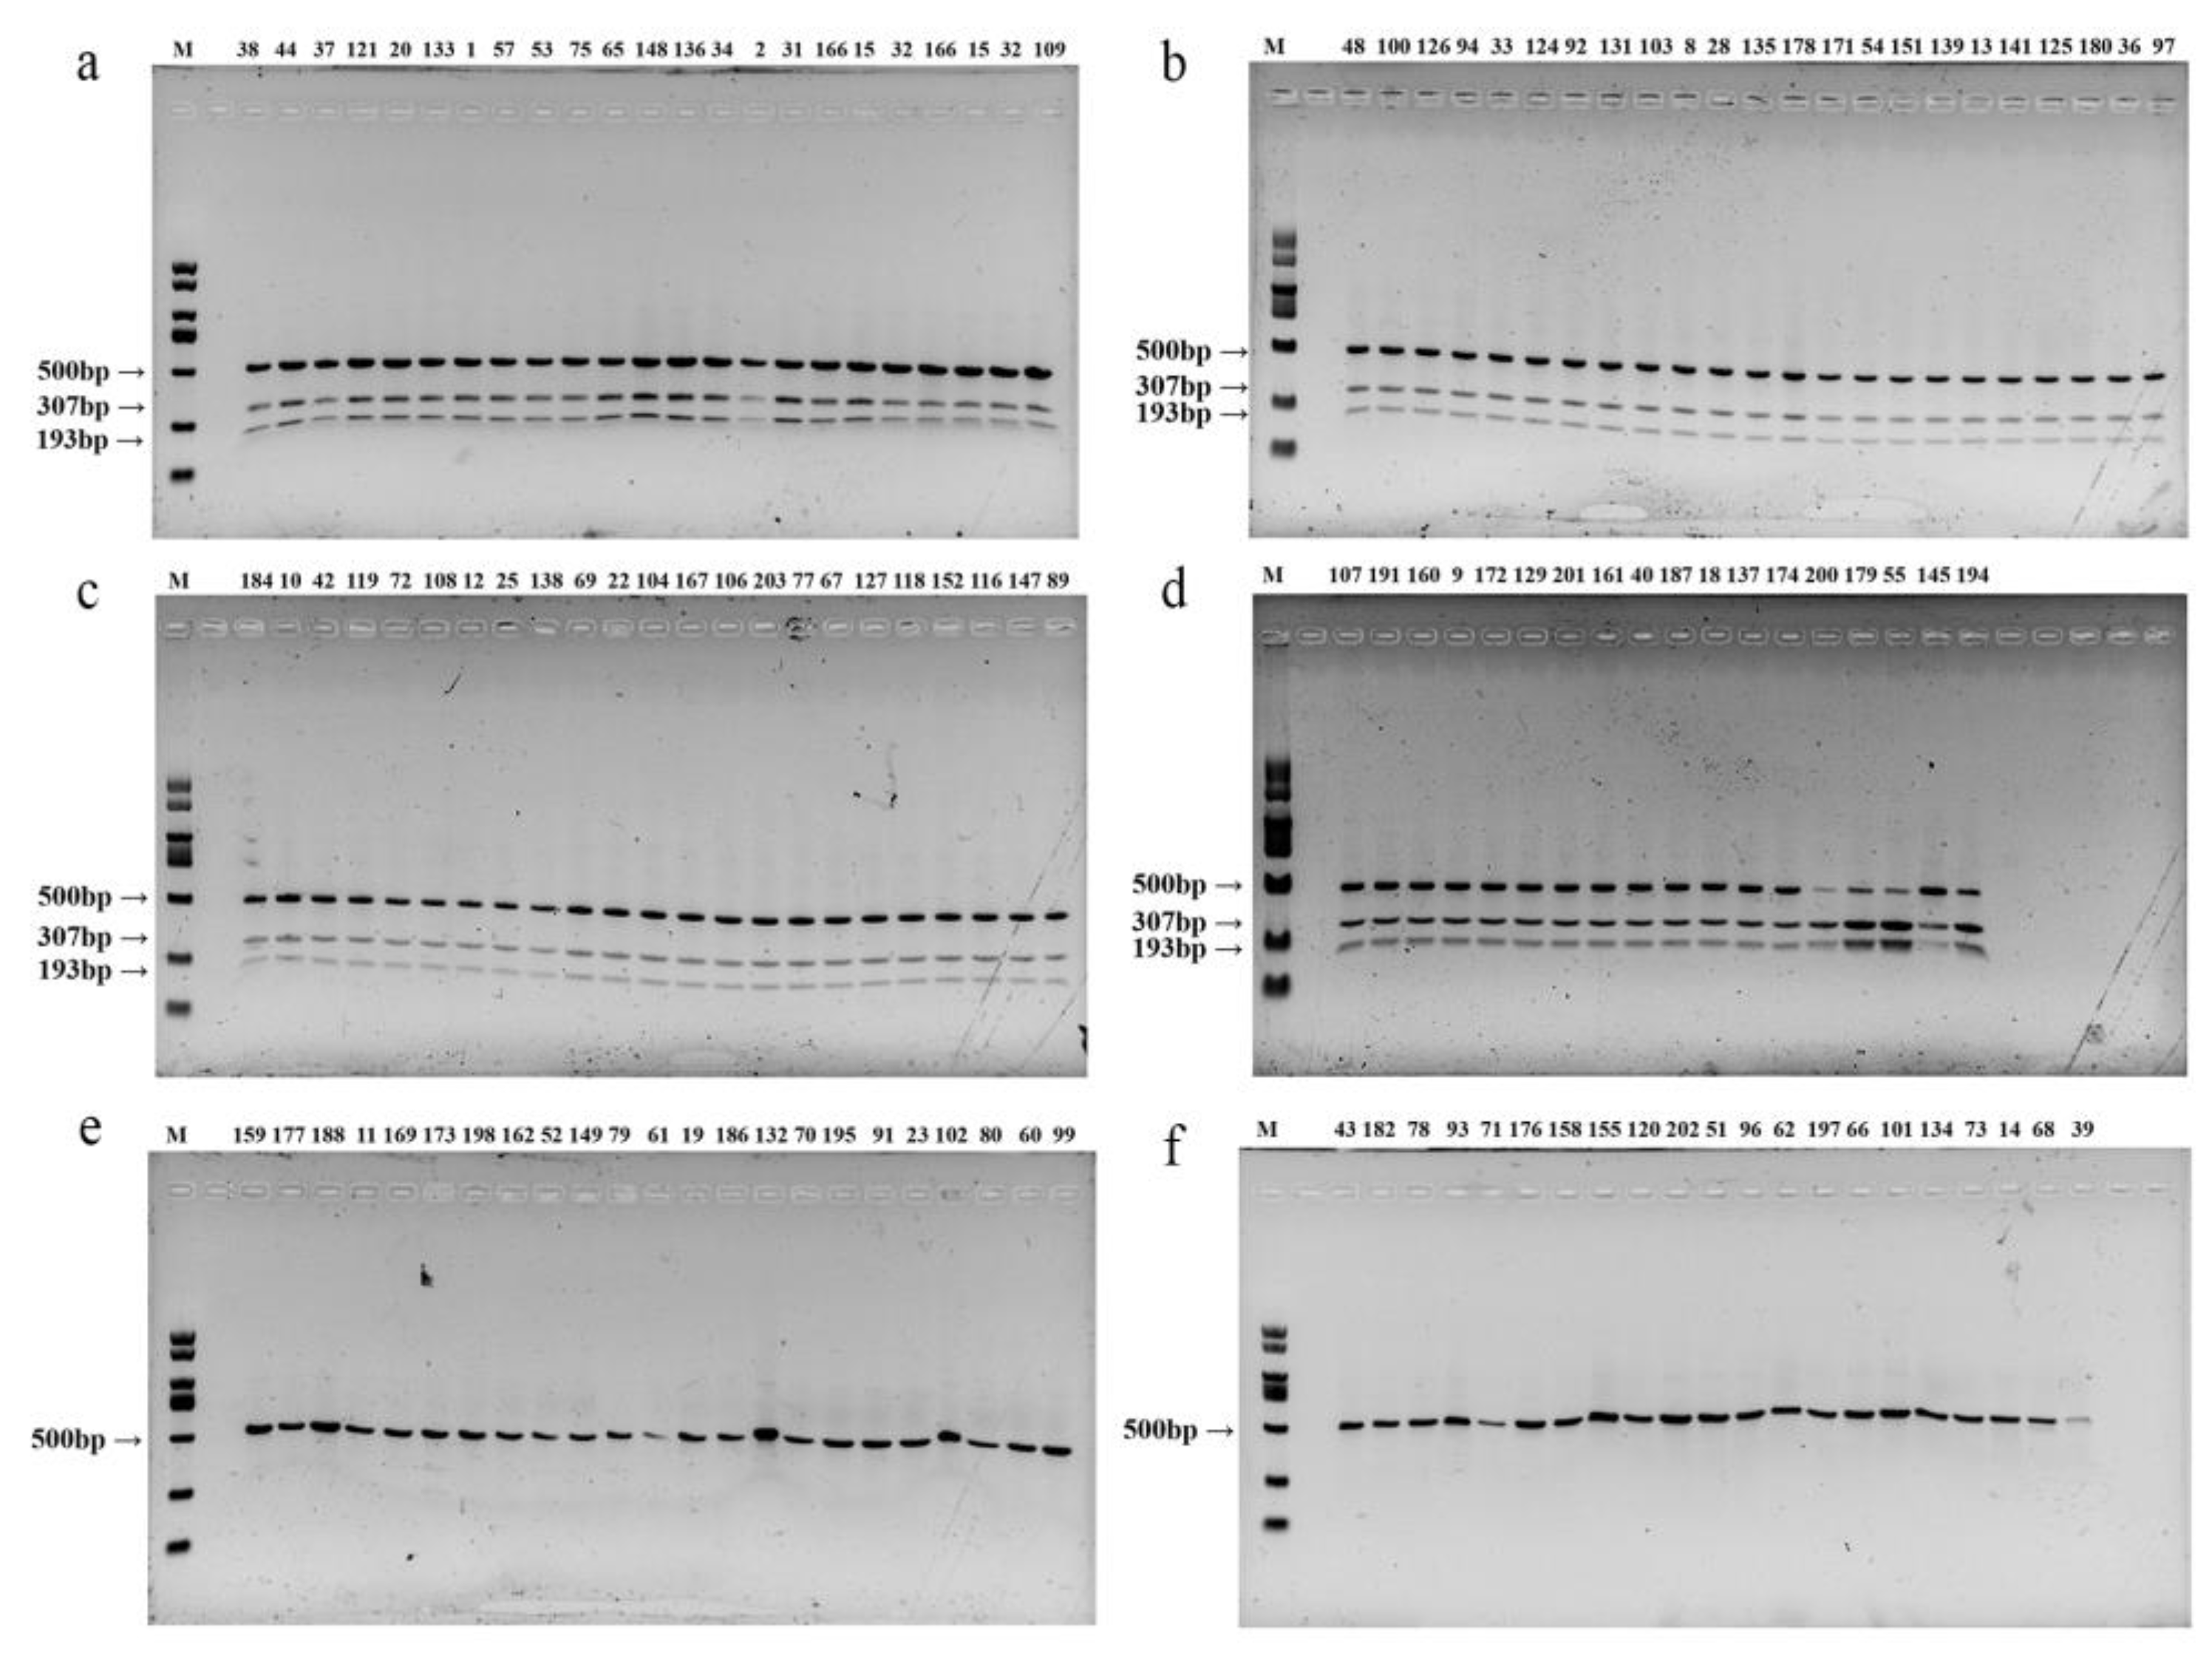
Figure 6.
Pictures of some non-white strains and white strains of mushrooms in the isolated population.
Figure 6.
Pictures of some non-white strains and white strains of mushrooms in the isolated population.
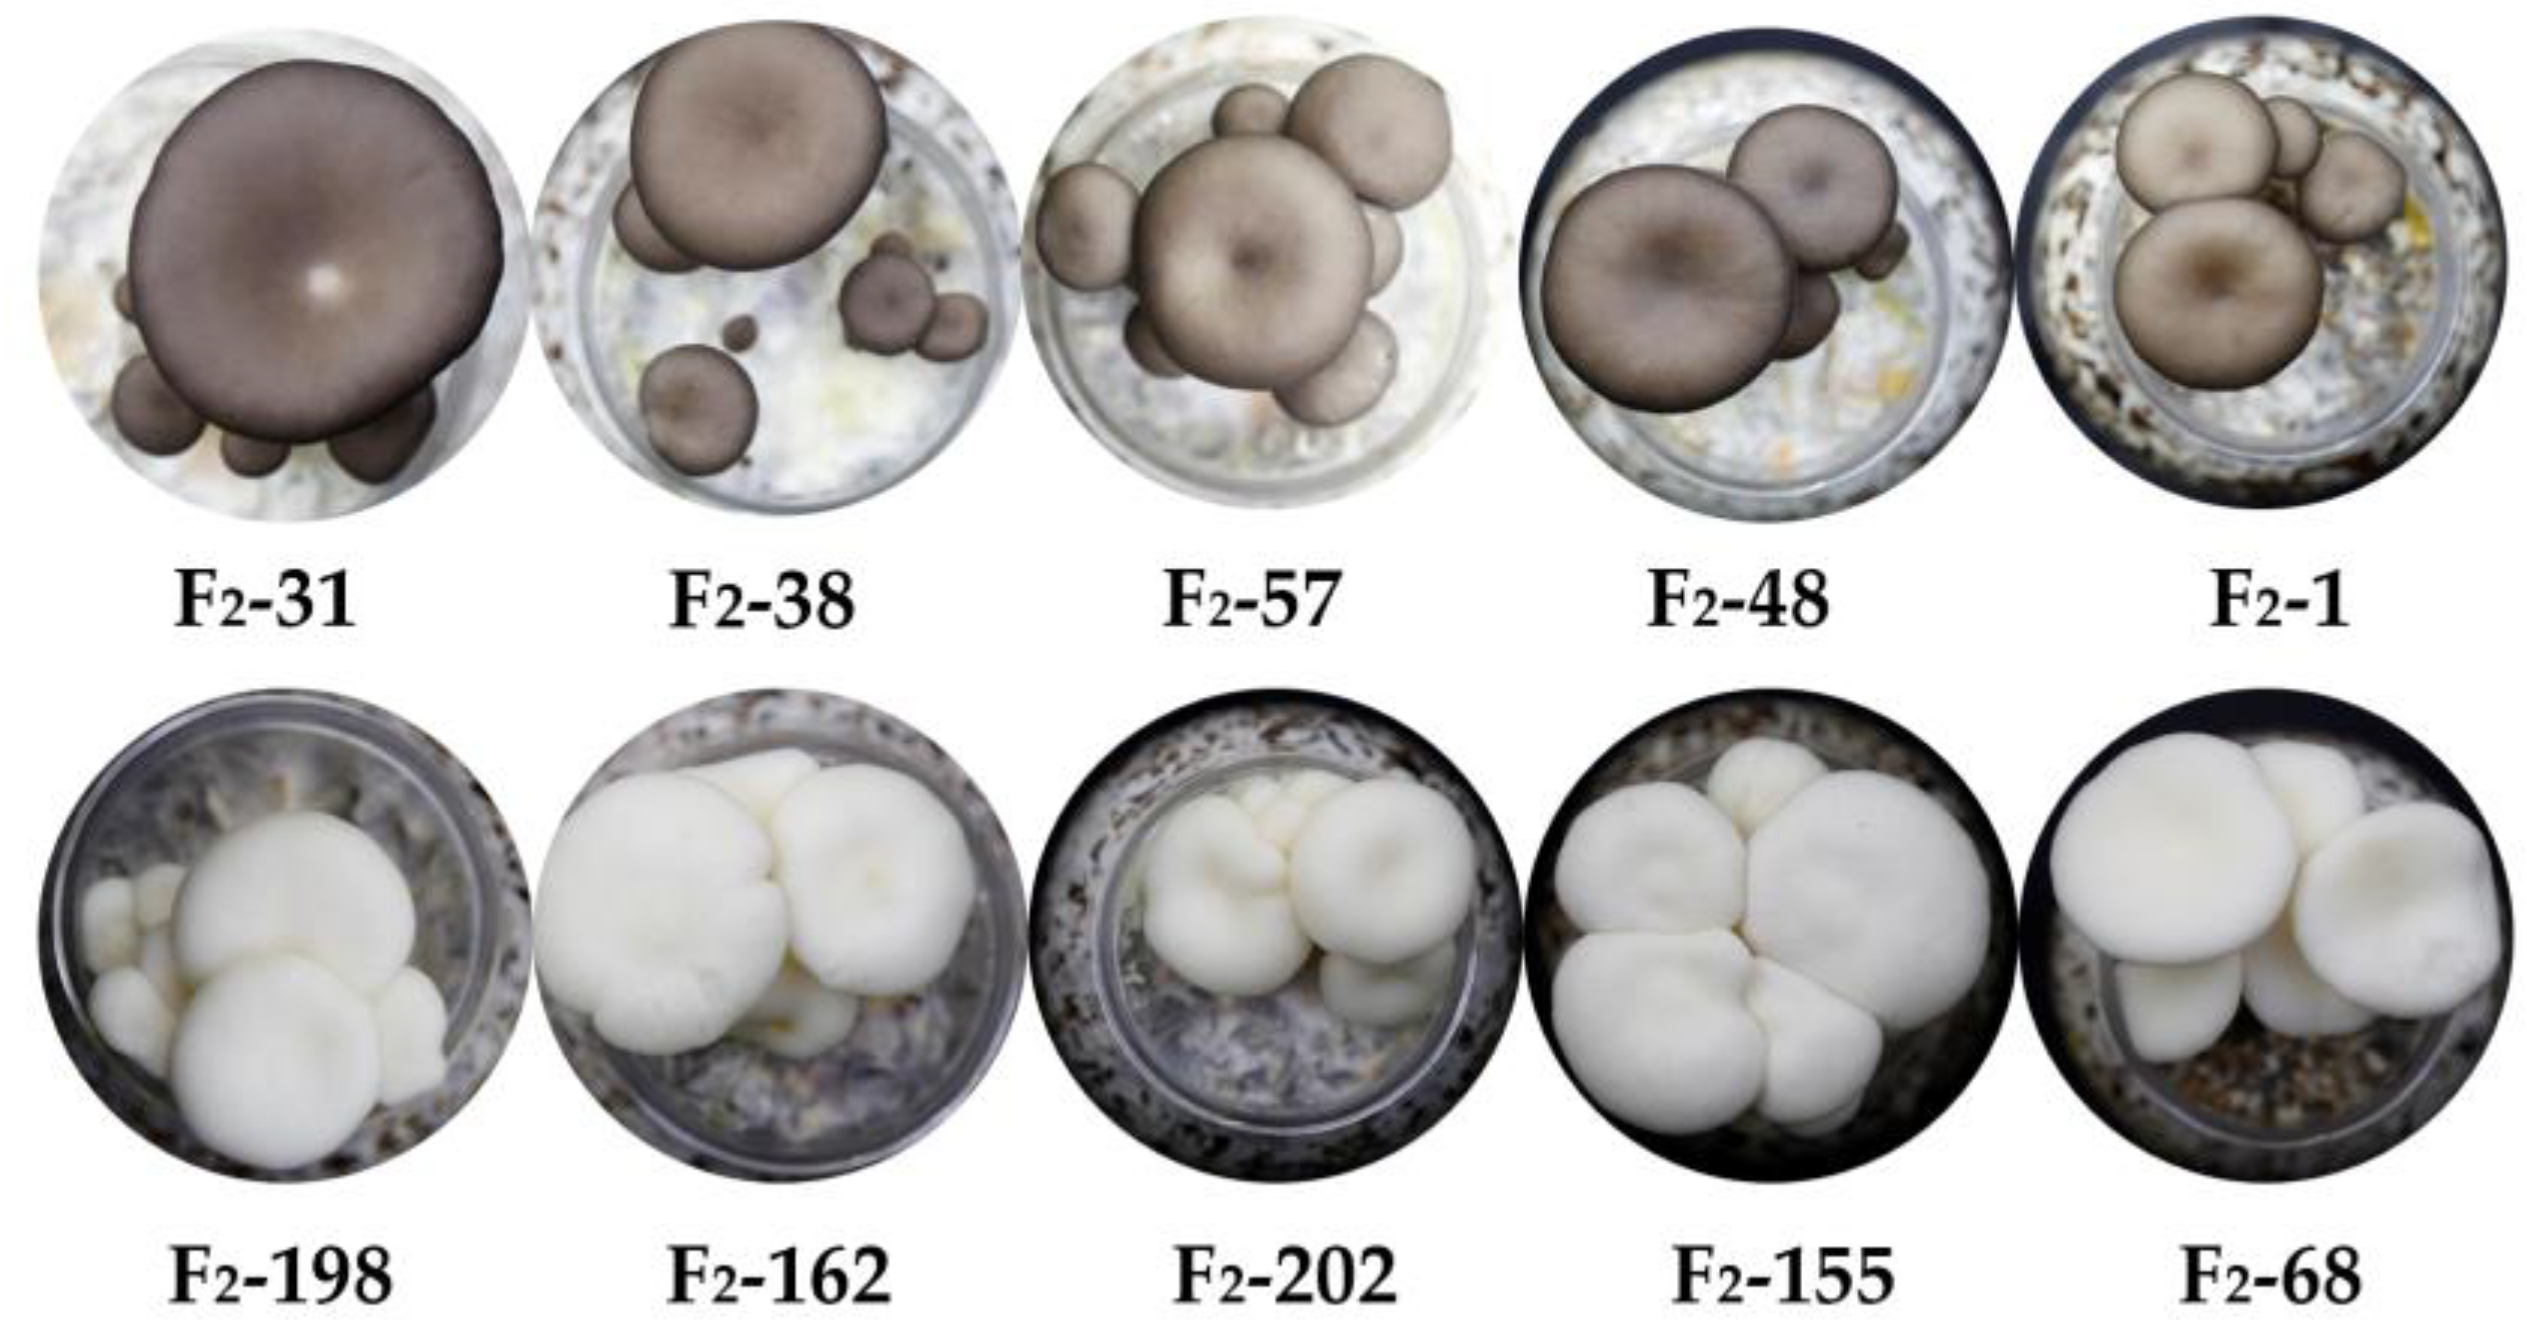
Figure 7.
WI values of the caps for both non-white and white strains in the segregating population. The bar chart (a) represents the WI values of the non-white, while that of (b) depicts the WI values of the white strains. WI values greater than 40 indicated white strains, while values less than 40 indicated non-white strains.
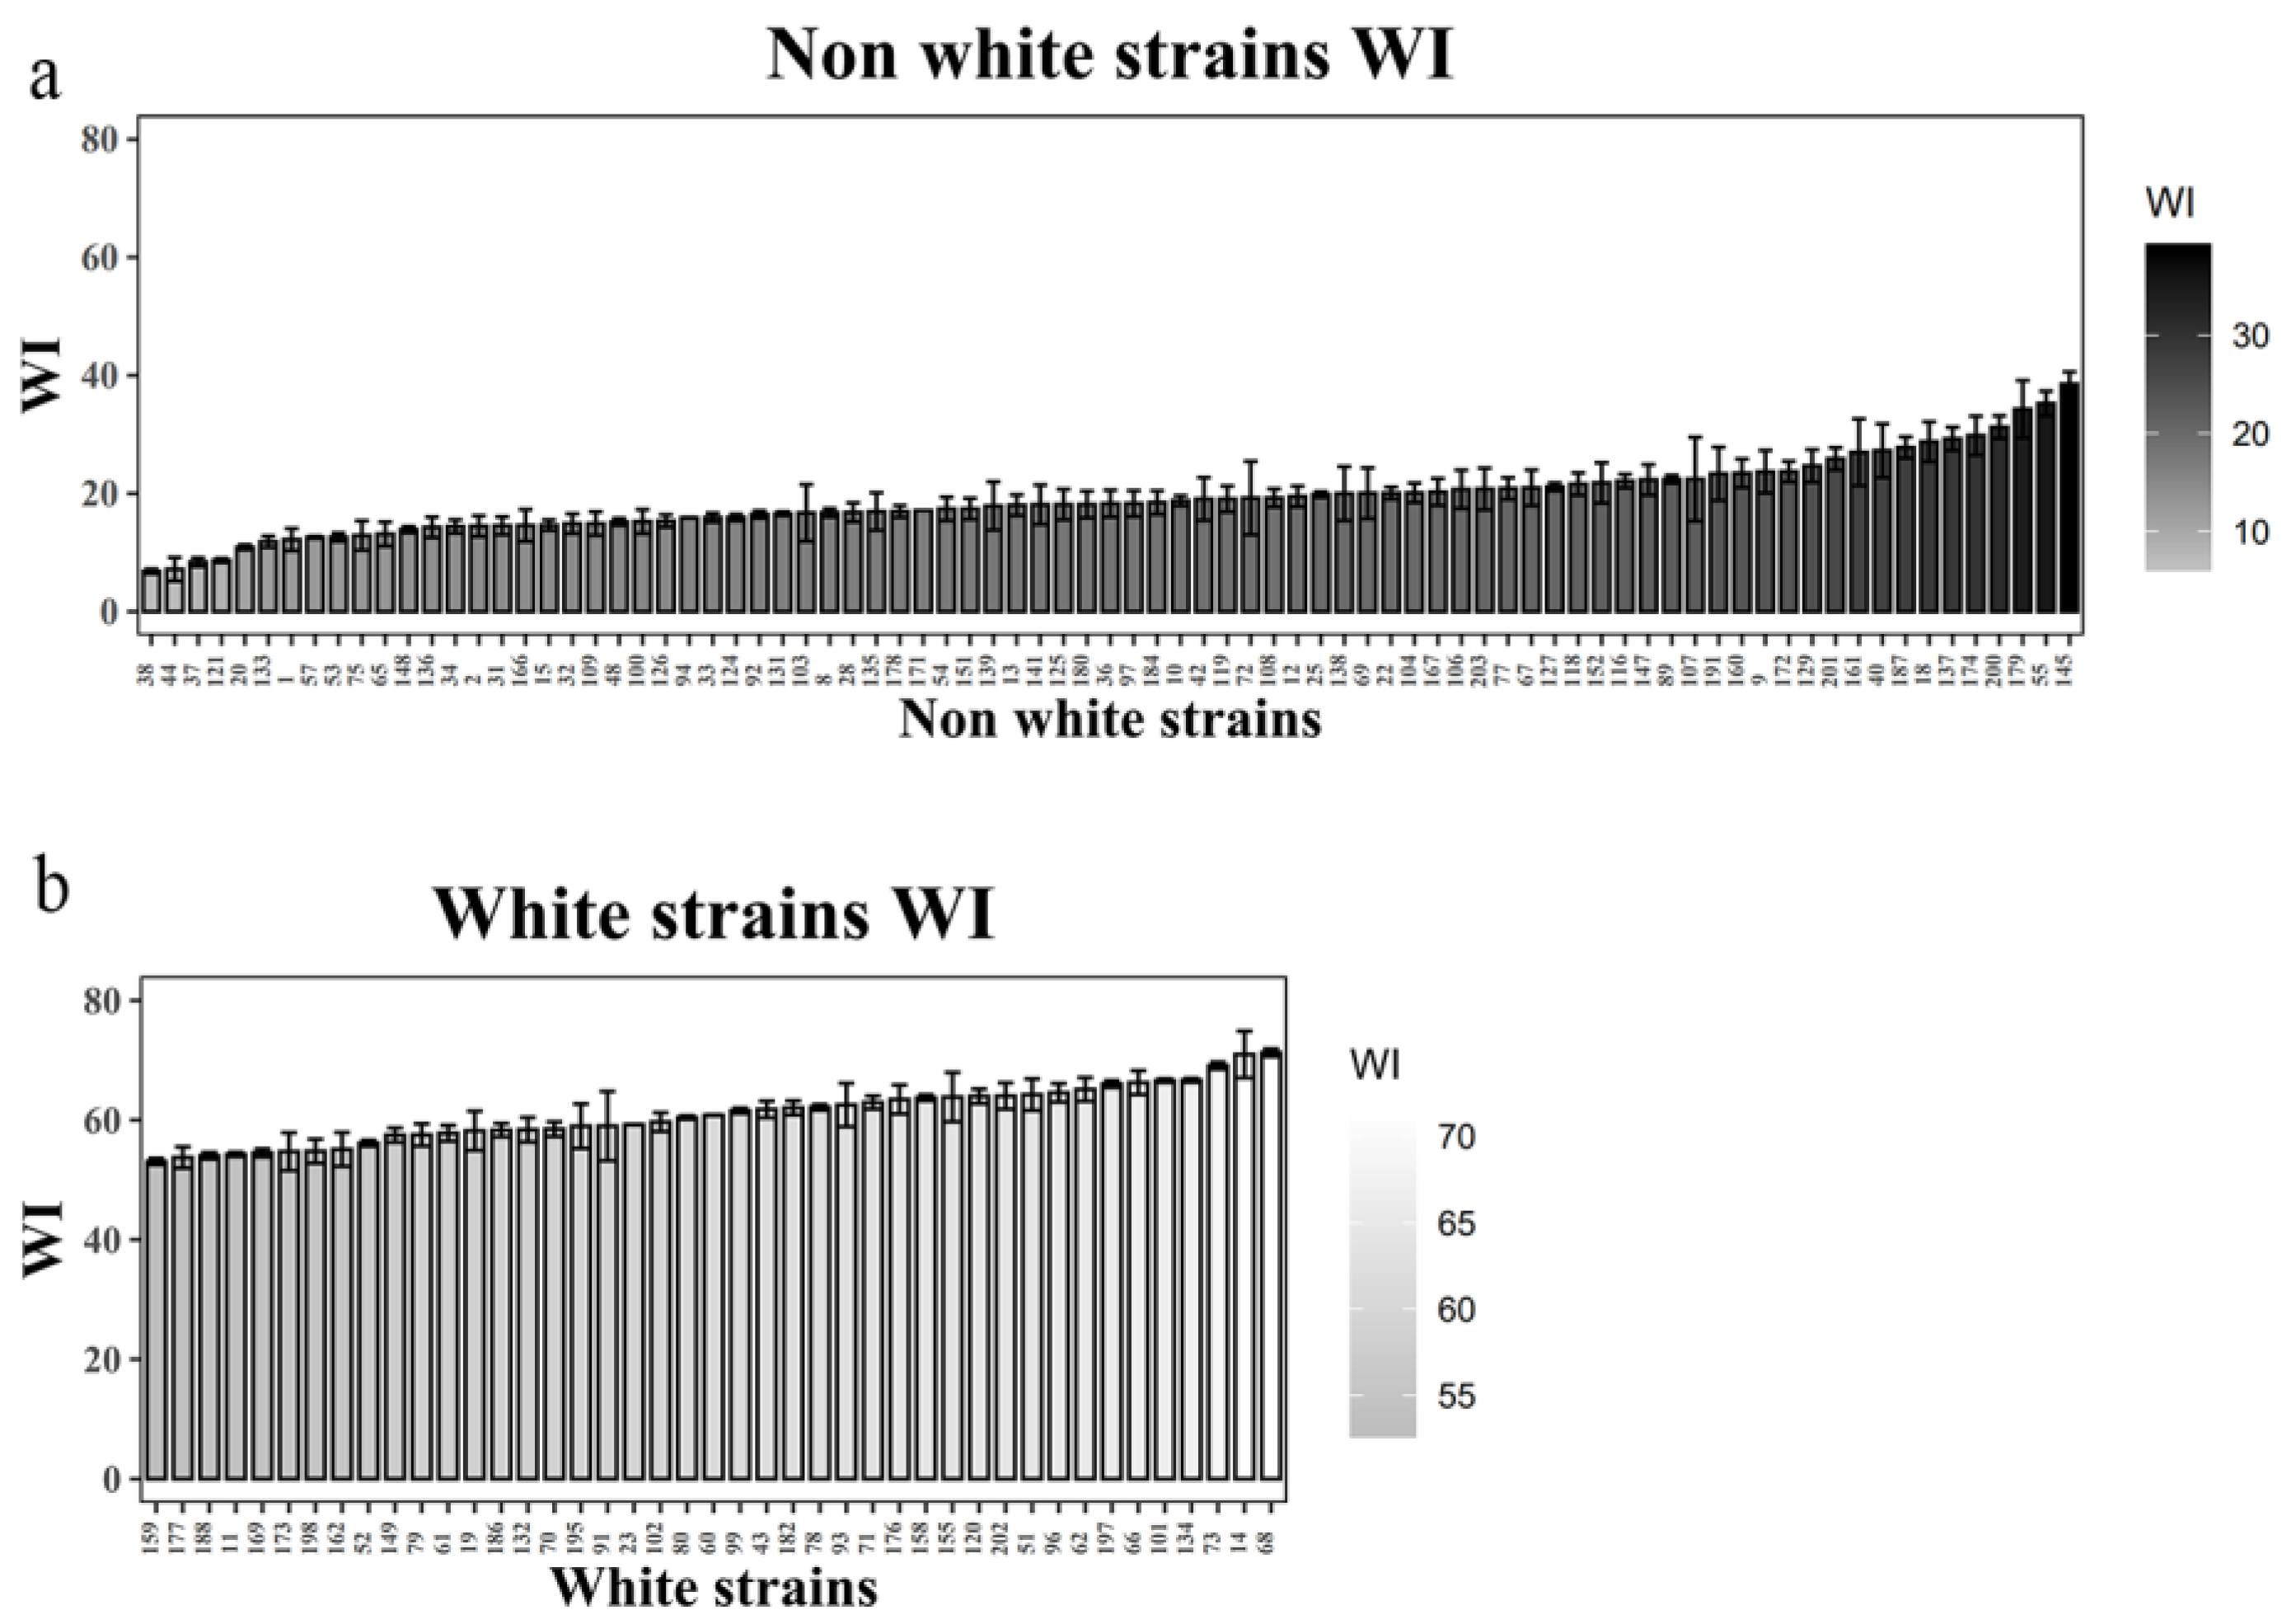
Figure 8.
Polymorphic bands of restriction endonuclease Mse I of oyster mushrooms. M: 2000 bp DNA Marker. 1–12 represents CCMSSC00328, CCMSSC00329, CCMSSC00363, CCMSSC00364, CCMSSC00499, CCMSSC00630, CCMSSC03989, CCMSSC04195, CCMSSC00387, CCMSSC00322, CCMSSC04976, CCMSSC04977.
Figure 8.
Polymorphic bands of restriction endonuclease Mse I of oyster mushrooms. M: 2000 bp DNA Marker. 1–12 represents CCMSSC00328, CCMSSC00329, CCMSSC00363, CCMSSC00364, CCMSSC00499, CCMSSC00630, CCMSSC03989, CCMSSC04195, CCMSSC00387, CCMSSC00322, CCMSSC04976, CCMSSC04977.

Table 1.
CAPS/dCAPS molecular markers used in this study.
| Marker | SNP | Primer Sequence (5′-3′) | Restriction Endonuclease |
|---|---|---|---|
| TYR-CAPS-1-1 | 1: −1590 bp T>C | F: GCCGAATAACGAACCAAAATGCGCG R: AGCAGTCGGAGCGTTCAAGTGGTTA | Hpy188 I (TCNGA) |
| TYR-CAPS-1-2 | 1: −1590 bp T>C | F: GCCGAATAACGAACCAAAATGCGCG R: AGCAGTCGGAGCGTTCAAGTGGTTA | Nla IV (GGNNCC) |
| TYR-dCAPS-2 | 2: 1038 bp T>C | F: TCTACATATATAAAGTTTAACTCTGACGACTGGATT R: ACTTTGAGCCGTCTTTGCATTCCTC | Nla III (CATG) |
| TYR-CAPS-3-1 | 3: 1273 bp A>C | F: GTGCACGGATTGATACATTTGATA R: ATATCCGCCAGTCGTATTCATAA | Nla III (CATG) |
| TYR-CAPS-3-2 | 3: 1273 bp A>C | F: GTGCACGGATTGATACATTTGATA R: ATATCCGCCAGTCGTATTCATAA | Mse I (TTAA) |
| TYR-dCAPS-4 | 4: 1303bp G>C | F: ATCAACAACATCAACTACATATATTAATGTCGTCT R: GGGCCTCCATTAGGGTATCGTTCAT | Hpy188 I (TCNGA) |
Table 2.
Dark-colored oyster mushrooms for experiments.
| Strain Number | Species |
|---|---|
| CCMSSC00328 | Pleurotus ostreatus |
| CCMSSC00329 | Pleurotus ostreatus |
| CCMSSC00363 | Pleurotus sp. |
| CCMSSC00364 | Pleurotus sp. |
| CCMSSC00499 | Pleurotus pulmonarius |
| CCMSSC00630 | Pleurotus sp. |
| CCMSSC03989 | Pleurotus sp. |
| CCMSSC04195 | Pleurotus ostreatus |
| CCMSSC00387 | Pleurotus sp. |
| CCMSSC00322 | Pleurotus ostreatus |
| CCMSSC04976 | Pleurotus sp. |
| CCMSSC04977 | Pleurotus sp. |
Disclaimer/Publisher’s Note: The statements, opinions and data contained in all publications are solely those of the individual author(s) and contributor(s) and not of MDPI and/or the editor(s). MDPI and/or the editor(s) disclaim responsibility for any injury to people or property resulting from any ideas, methods, instructions or products referred to in the content. |
© 2023 by the authors. Licensee MDPI, Basel, Switzerland. This article is an open access article distributed under the terms and conditions of the Creative Commons Attribution (CC BY) license (https://creativecommons.org/licenses/by/4.0/).
Share and Cite
MDPI and ACS Style
Yang, Y.; Zhang, Y.; Huang, C.; Chen, Q.; Gao, W. Development of Cleaved Amplified Polymorphic Sequence Marker for Cap Color Identification in Pleurotus cornucopiae. Horticulturae 2023, 9, 1238. https://doi.org/10.3390/horticulturae9111238
AMA Style
Yang Y, Zhang Y, Huang C, Chen Q, Gao W. Development of Cleaved Amplified Polymorphic Sequence Marker for Cap Color Identification in Pleurotus cornucopiae. Horticulturae. 2023; 9(11):1238. https://doi.org/10.3390/horticulturae9111238
Chicago/Turabian StyleYang, Yashu, Yan Zhang, Chenyang Huang, Qiang Chen, and Wei Gao. 2023. "Development of Cleaved Amplified Polymorphic Sequence Marker for Cap Color Identification in Pleurotus cornucopiae" Horticulturae 9, no. 11: 1238. https://doi.org/10.3390/horticulturae9111238
Note that from the first issue of 2016, this journal uses article numbers instead of page numbers. See further details here.