Article

Prediction of Growth and Quality of Chinese Cabbage Seedlings Cultivated in Different Plug Cell Sizes via Analysis of Image Data Using Multispectral Camera

Department of Environmental Horticulture, University of Seoul, Seoul 02504, Republic of Korea
*
Author to whom correspondence should be addressed.
Horticulturae 2023, 9(12), 1288; https://doi.org/10.3390/horticulturae9121288
Submission received: 1 November 2023 / Revised: 24 November 2023 / Accepted: 28 November 2023 / Published: 30 November 2023

Abstract

:
In recent times, there has been an increasing demand for the development of rapid and non-destructive assessment of the growth and quality of seedlings before transplanting. This study was conducted to examine the growth and quality of Chinese cabbage seedlings that can be determined via the image data acquired using a multispectral camera. Chinese cabbage seedlings were cultivated in five different plug trays (72, 105, 128, 162, and 200 cells/tray) for 30 days after sowing (DAS). The growth of seedlings had no significant difference in the early stage of cultivation; however, it decreased with increasing the number of cells in the plug tray due to the restricted root zone volume in the mid to late stages. Individual leaf area was predicted by analyzing of image data with high accuracy (R2 > 0.8) after 15 DAS; however, the accuracy of leaf area prediction per tray decreased due to overlapping and twisting leaves. Among six different vegetation indices, mrNDVI showed a high correlation (R2 > 0.6) with the dry weight of seedlings at 25 and 30 DAS. We confirmed that the leaf area of seedlings can be predicted non-destructively by analyzing the acquired image data per seedling and tray and suggested the applicability of vegetation indices for predicting the growth and quality of vegetable seedlings.

1. Introduction

Chinese cabbage (Brassica rapa L. ssp. pekinensis) is a very important vegetable crop in Korea, and it accounts for 23 and 30% of domestic vegetable production and consumption, respectively [1,2]. In the vegetable nursery industry, Chinese cabbage is the second most produced vegetable crop in Korea. Chinese cabbages are cultivated in the fields throughout the year, and the cropping systems and cultivars are decided depending on the season.
Seedling cultivation is a process of cultivation in which young high-quality plants are grown uniformly under appropriate conditions before transplanting. The benefits of seedling cultivation include seed savings, faster growth, and higher quality and uniformity compared to direct seeding [3]. In Korea, a large number of vegetable farmers purchase seedlings produced in plug trays from nurseries rather than self-raising the seedlings, and commercial nurseries producing vegetable seedlings have increased in number since the 1990s [4]. Seedling production using plug trays is efficient in terms of growing more seedlings in less space, automation, and labor saving in the cultivation process [5]. Commercial nurseries produce the seedlings using plug trays by controlling the environmental conditions in greenhouses, and their goal is to produce healthy and uniform seedlings for fast establishment and growth after transplanting. As vegetable seedlings are young and vulnerable, even short-term exposure to inappropriate environments can cause a rapid deterioration in the growth and quality; however, most nurseries rely on the experience of their managers to determine whether the seedlings are in a healthy condition.
In Korea, Chinese cabbage is cultivated in all seasons by employing various types of cropping. Plug trays have various cell numbers ranging from 50 to 288 according to the cropping type. The plug trays with a smaller number of cells are used for the production of Chinese cabbage seedlings in winter and spring cropping types due to a longer period of seedling cultivation, and those with a larger number of cells are used for the seedling production in summer and autumn cropping types due to a shorter period of seedling cultivation [6]. The cell size decreased with increasing the number of cells in a plug tray, and the growth of seedlings was affected by the cell size of the plug tray. In many crops, using a plug tray with a larger cell size induced better growth of the seedlings due to the increased root zone volume and amount of light received per seedling [7,8,9]. However, it does not mean that the efficiency of seedling production is promoted by using plug trays with larger cell sizes in a commercial nursery. A smaller number of seedlings were planted in the same area, and more resources (commercial medium, water, plug tray, etc.) were required to produce one seedling [10].
Improper conditions during the seedling cultivation period can reduce the growth and quality of seedlings [11,12,13]. In vegetable crops, the status of seedling growth and quality can be decided by measuring plant height, number of leaves, leaf area, chlorophyll content, and fresh and dry weight of the sample seedlings [14,15,16]. These parameters conventionally employ destructive measurement, and it takes a lot of time and labor for measuring. Therefore, researchers try to develop a method for quickly and non-destructively analyzing the growth and quality of plants. Min et al. [17] detected the nitrogen content in leaves using VIS-NIR spectroscopy and reported that predicting the nitrogen content of the seedlings using the stepwise multiple linear regression (SMLR) and partial least squares (PLS) regression procedures was highly correlated with the actual nitrogen measurements (R2 > 0.7). However, hyperspectral imaging using VIS-NIR spectroscopy is difficult in terms of data processing, which makes it hard to apply in the agricultural industry.
Multispectral imaging, which is a simplified version of hyperspectral imaging, is a leading non-destructive measurement system in agriculture [18]. The reflectance at different wavelengths changes with the chlorophyll content, nutrient, and water content of a plant. Analyzing the reflectance of a plant using images can provide a non-destructive and quick assessment of the current growth, nutrient, and water status of the plant [19,20,21]. Recently, the PLS method, which is a linear regression method for multivariate calibration and is widely used for data processing in hyperspectral imaging, was applied to analyze multispectral images in order to develop a powerful model between the extracted spectra and growth parameters [22]. Multispectral image analysis was conducted in crop cultivation, ranging from large-scale fields to leaves [23,24,25]. Open-field imaging studies were mainly conducted on food crops such as maize, wheat, and rice [26,27,28]. Among the vegetables grown in greenhouses, the technologies of image processing were applied in the case of fruit vegetables [29,30,31]. Previous research has focused on the application of multispectral image analysis for crop cultivation after transplanting, and there is still a lack of studies on the applicability to seedling production. Wang et al. [32] found that multispectral imaging in individual leaf areas can detect nitrogen and moisture stress in tomato seedlings.
The objective of this study is to confirm the applicability of image analysis for detecting the change in the seedling growth and quality as affected by different cell sizes of plug trays during the cultivation period of Chinese cabbage seedlings.

2. Materials and Methods

2.1. Plant Materials and Cultivations

In this study, Chinese cabbage ‘Chun-gwang’ (SAKATA KOREA Co., Ltd., Seoul, Republic of Korea) was used as the plant material. The experiment was conducted in the glass greenhouse at the University of Seoul, Seoul, Republic of Korea (37°34′57.1″ N, 127°03′37.7″ E) from 8 March to 7 April 2023. The seeds were sown in the plug trays with 72, 105, 128, 162, and 200 cells filled with the commercial medium for seedling production (Biosangto, Nongwoobio Co., Ltd., Incheon, Gyeonggi-do, Republic of Korea). The seeds were germinated in the dark room maintained at a 25 °C air temperature for two days. Then, they were transferred to the greenhouse and cultivated for 28 days with sub-irrigation every day. The air temperature, relative humidity, and light intensity in the greenhouse were recorded using the agricultural environmental measuring instrument (aM-31, WISE Sensing Inc., Suwon, Gyeonggi-do, Republic of Korea). During the cultivation period, the average air temperature, relative humidity, and daily light integral in the greenhouse were 23.1 ± 2.5 °C, 33.4 ± 14.2%, and 16.4 ± 6.4 mol·m−2, respectively.

2.2. Growth Measurements

Plant height, number of leaves, SPAD value, leaf area, and fresh and dry weight of shoot in Chinese cabbage seedlings were measured at 10, 15, 20, 25, and 30 DAS. The leaf area meter (LI-3100, LI-COR Inc., Lincoln, NE, USA) and chlorophyll meter (SPAD-502PLUS, KONICA MINOLTA, Inc., Tokyo, Japan) were used for measuring the leaf area and SPAD value, respectively. The shoot fresh weight was obtained using a scale (KERN EWJ 300-3, Kern & Sohn GmbH, Balingen, Germany), and the shoot dry weight was measured after drying in an oven at 70 °C for 7 days. The leaf area index (LAI) was calculated based on the measured leaf area and the area of one cell in a plug tray. The areas of one cell were 24.10, 17.18, 13.60, 11.07, and 8.89 cm2 in the plug trays with 72, 105, 128, 162, and 200 cells, respectively.

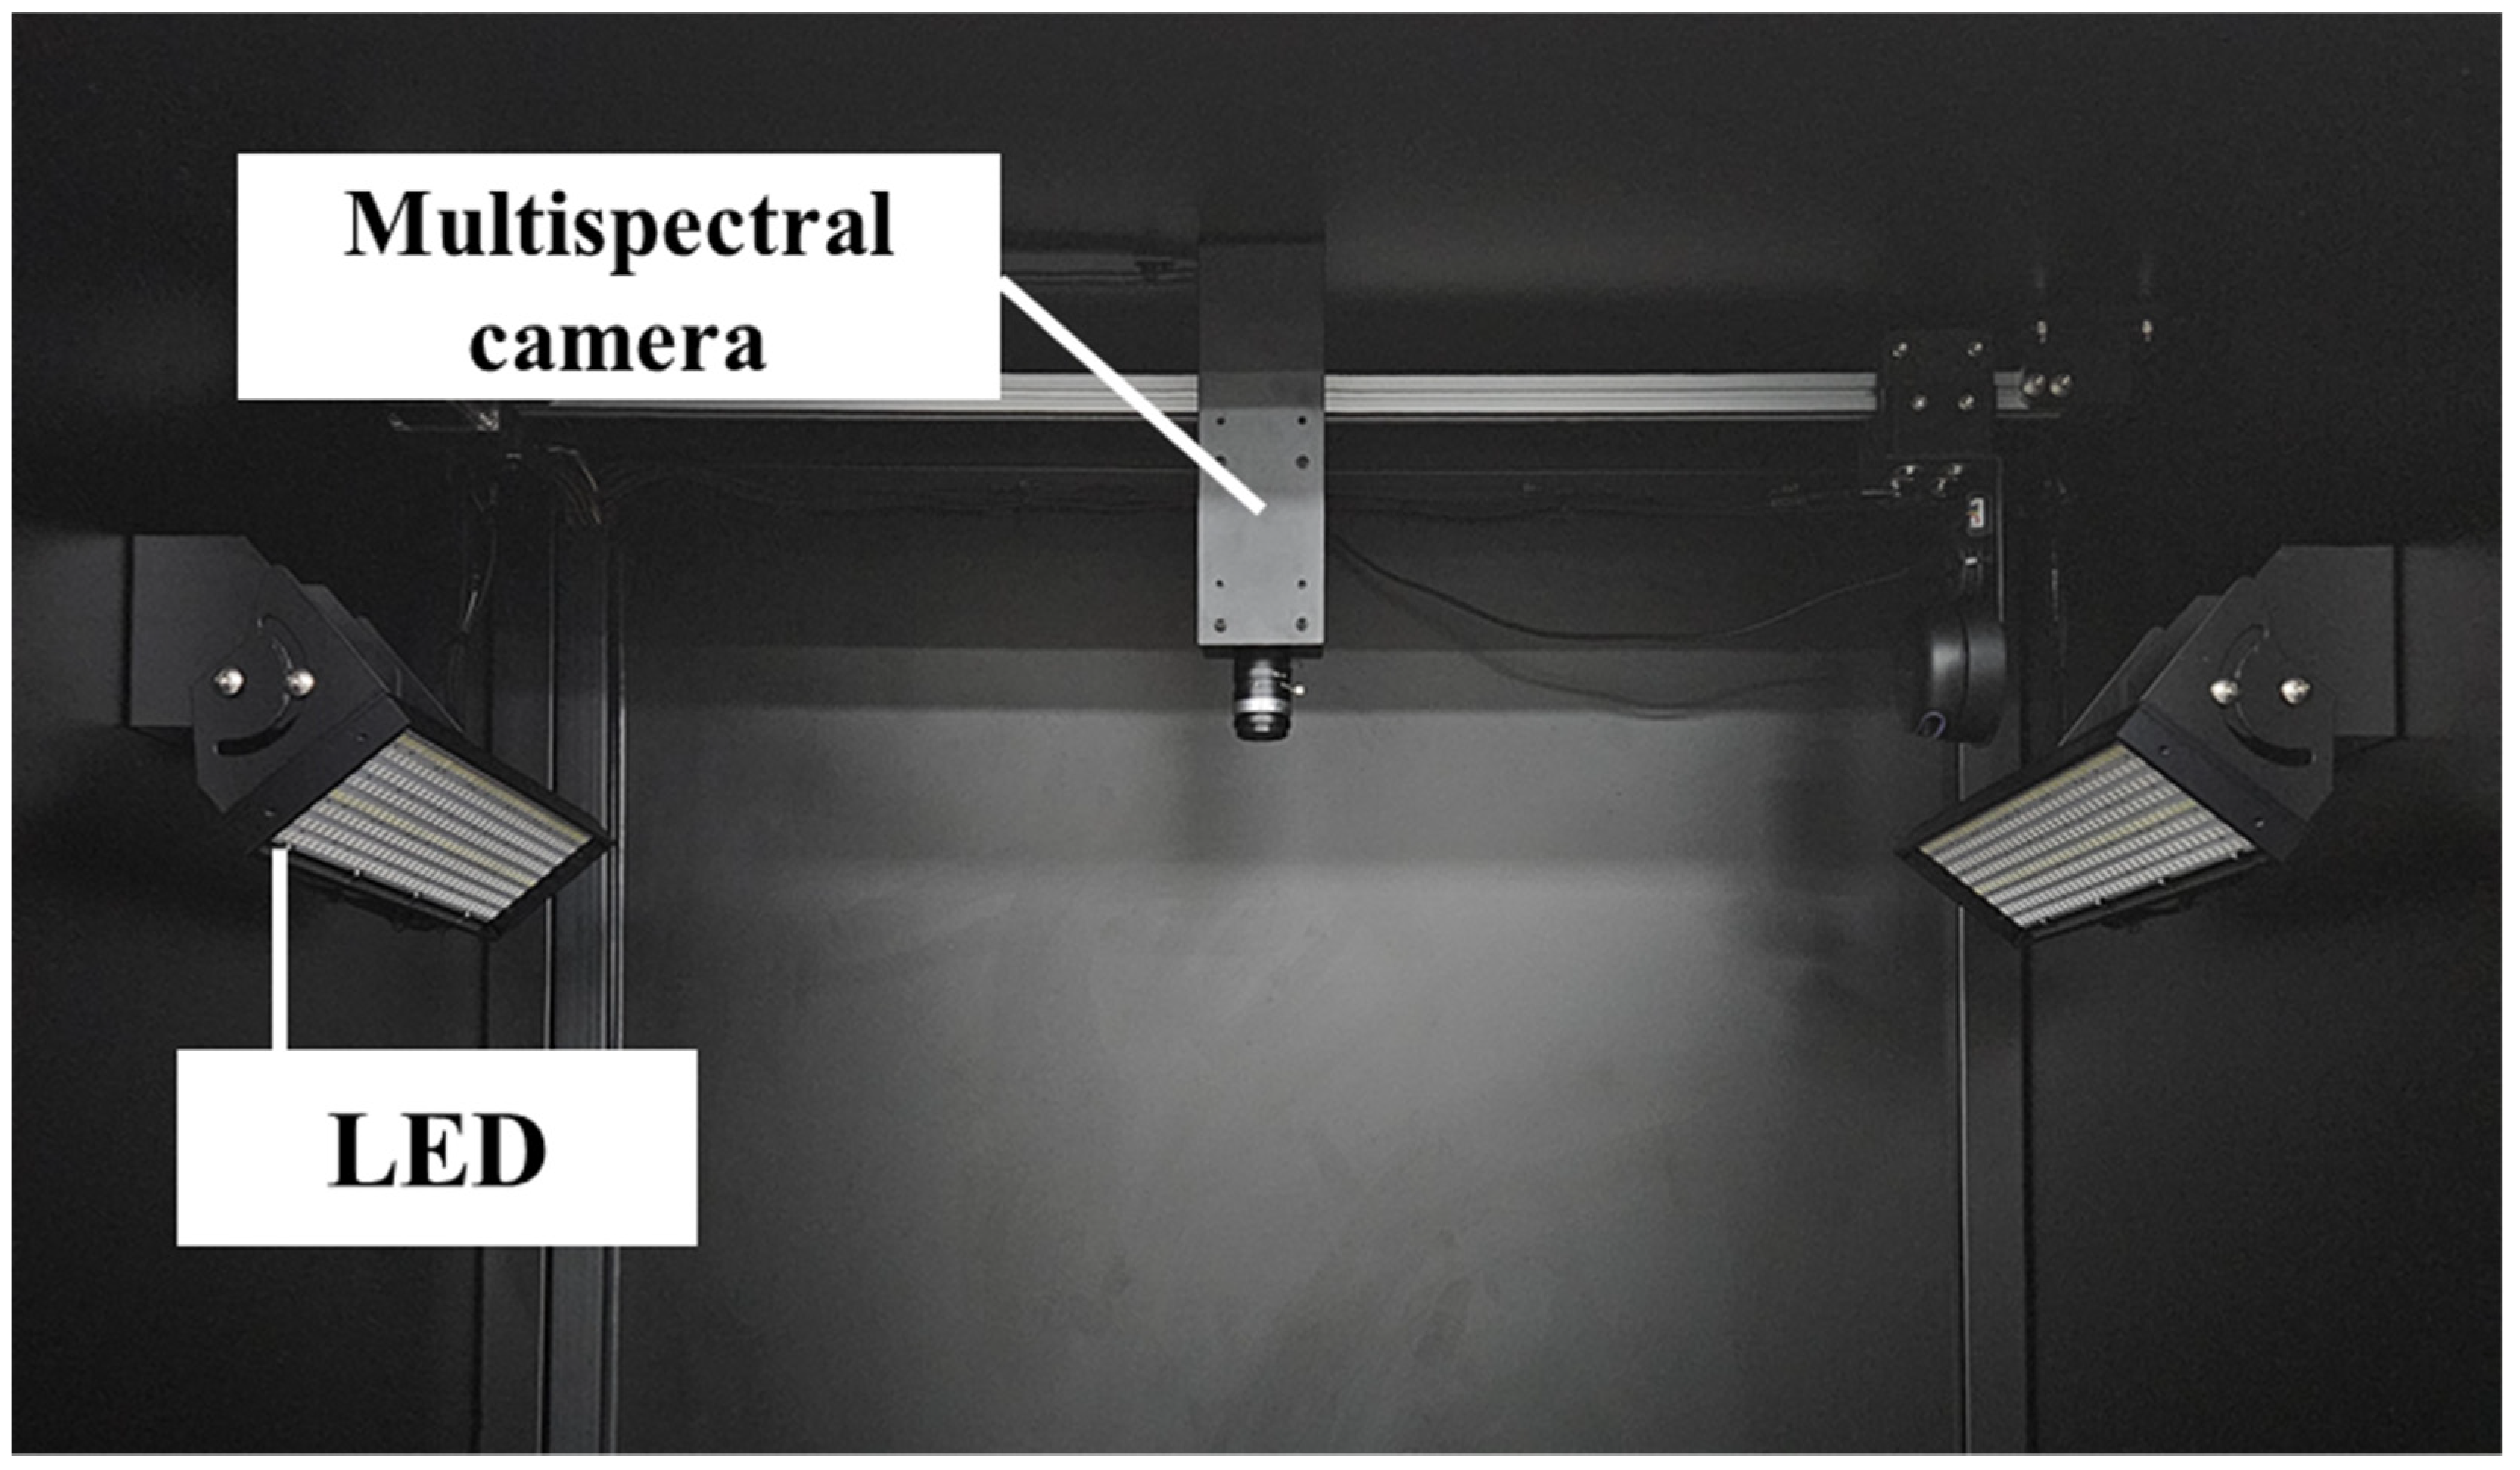
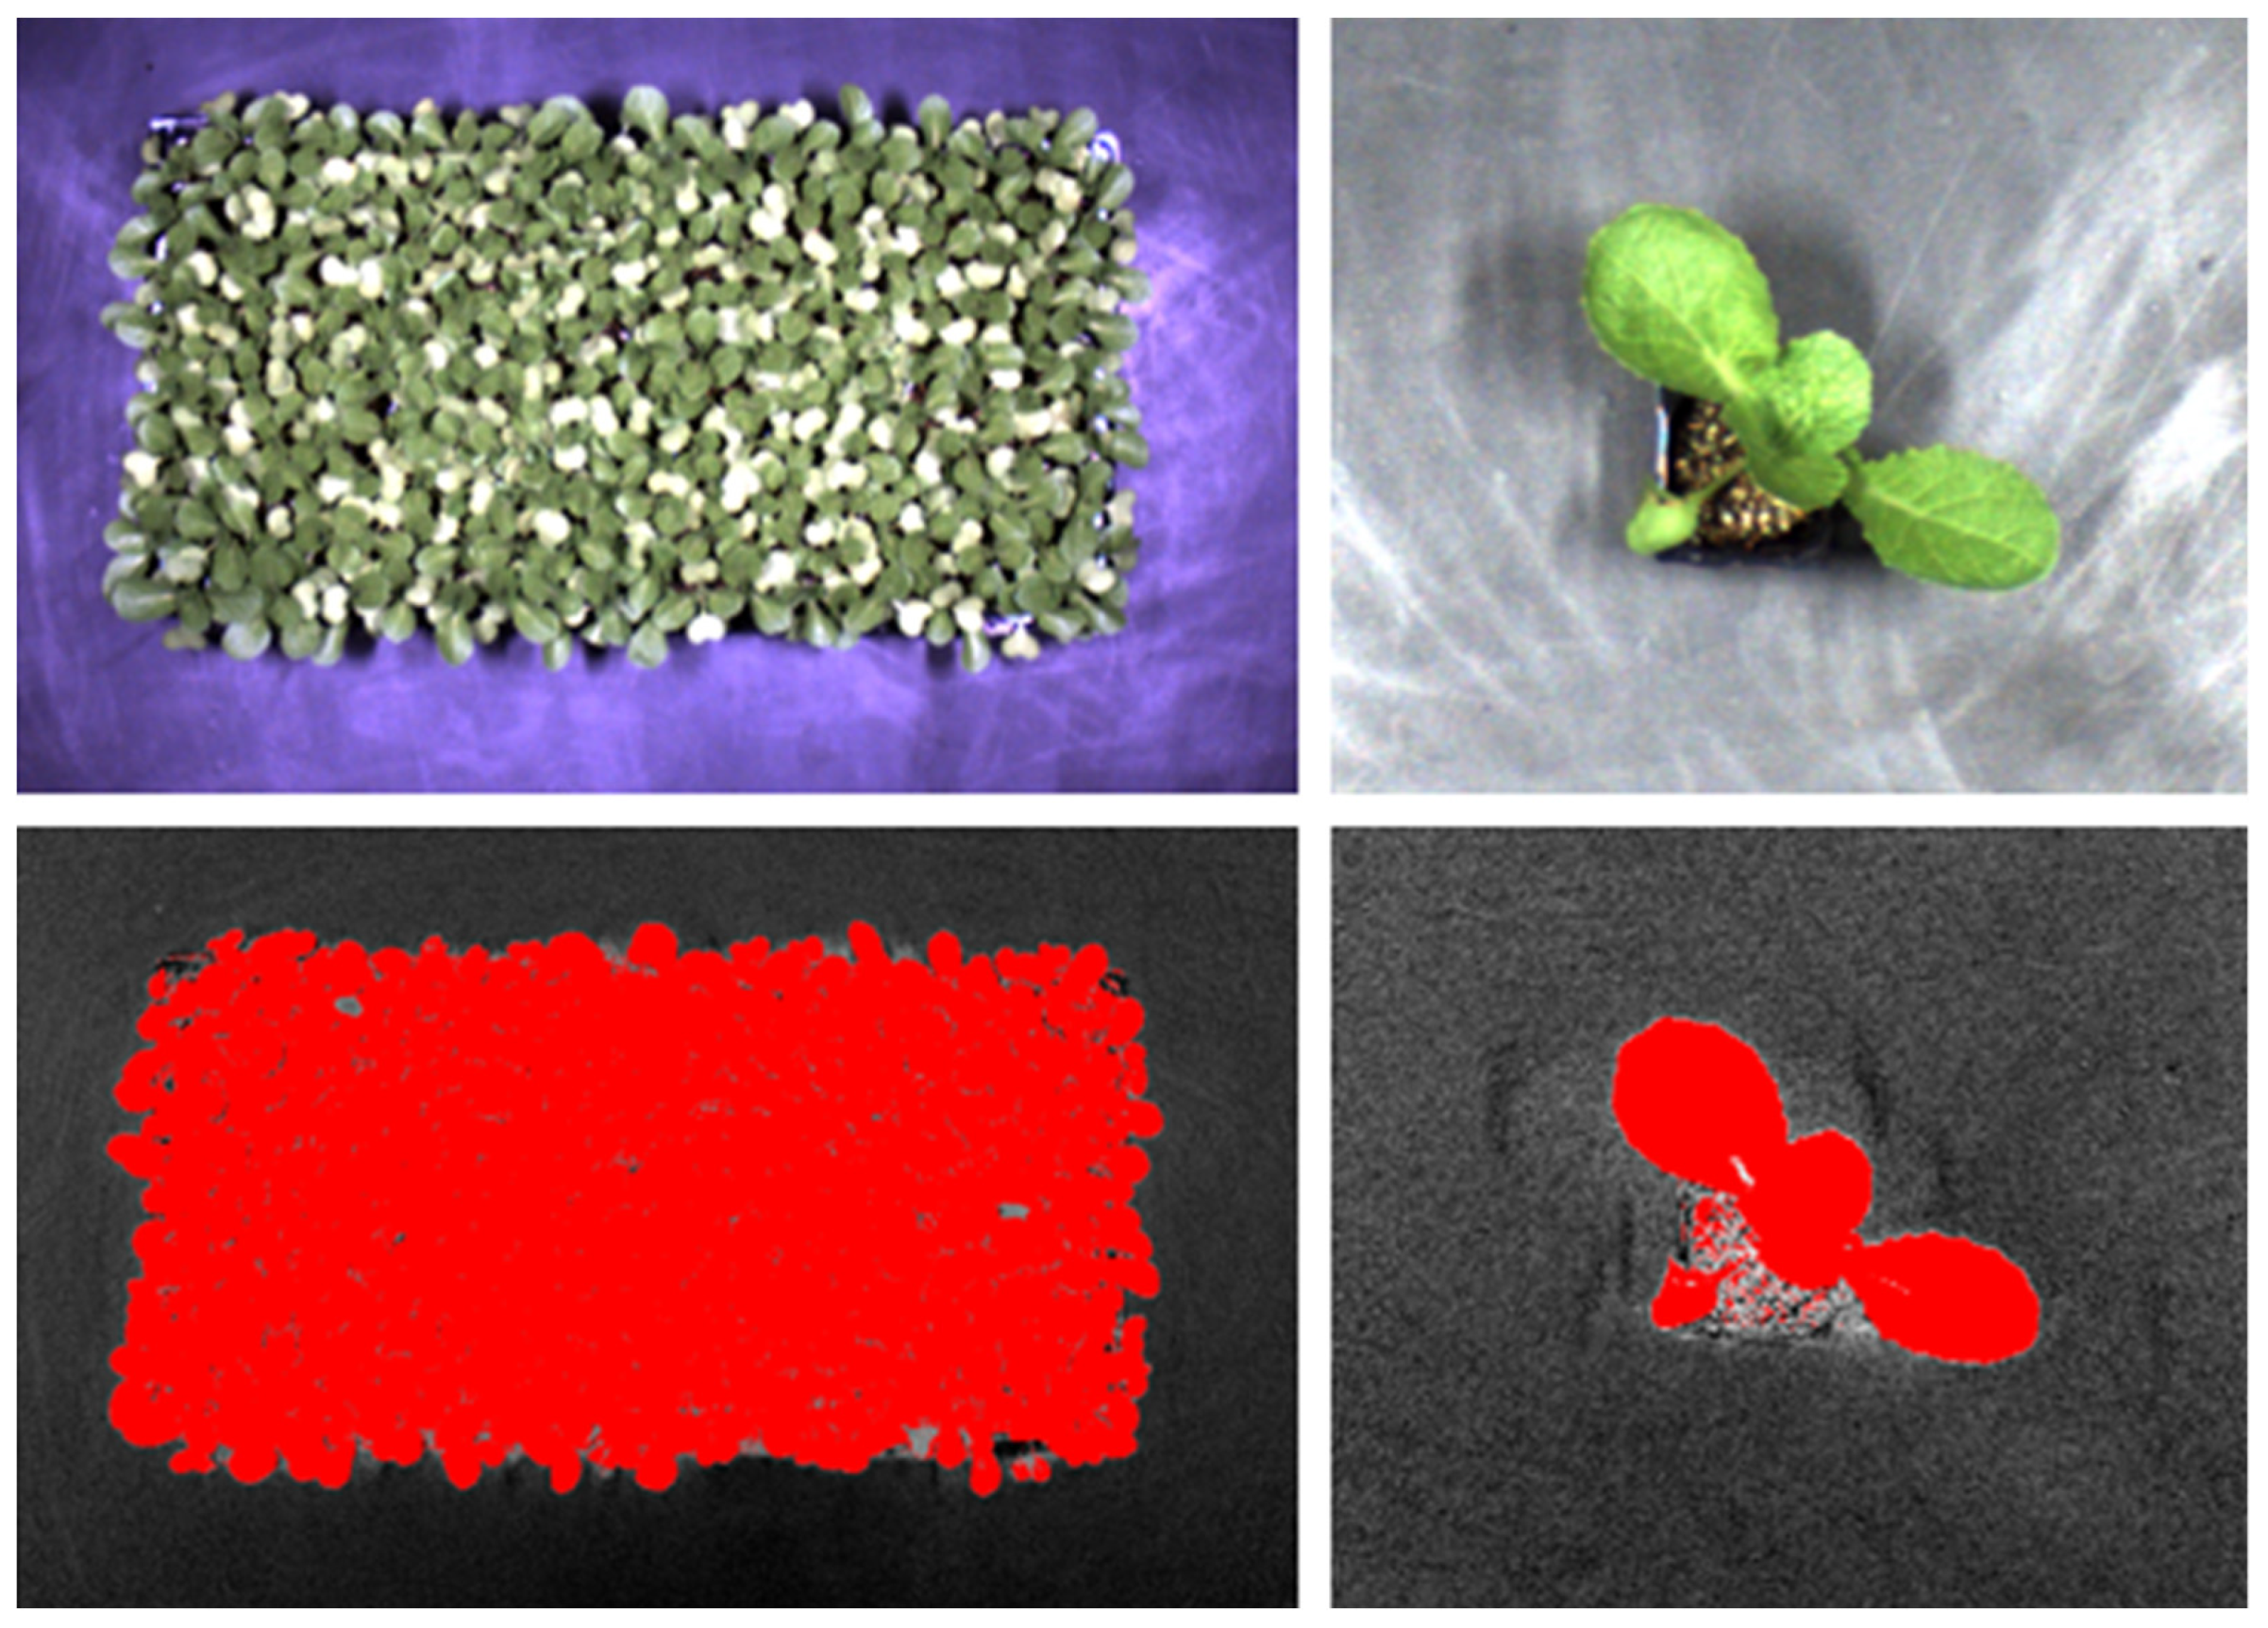
2.3. Image-Based Measurements and Analysis

The images of seedlings were obtained using the Plant Image Measurement System (PIMS) shown in Figure 1. PIMS consists of a multispectral camera (FS-3200T-10GE-NNC, JAI, Copenhagen, Denmark) and LED lighting. The LED provides light optimized for acquiring visible (VIS)-near-infrared (NIR) spectral information.
The images of seedlings and trays were obtained before measuring the seedling growth destructively at 10, 15, 20, 25, and 30 DAS. The images of seedlings and trays were captured at RGB (450 nm, 550 nm, and 650 nm), NIR1 (750 nm), and NIR2 (830 nm). The predicted leaf area (PLA) and spectral reflectance at each wavelength band were analyzed using the ENVI program (ENVI 5.3, L3Harris Geospatial, Broomfield, CO, USA) (Figure 2).
The predicted changes in the leaf area per plug tray with 72, 105, 128, 162, and 200 cells were fitted using a sigmoidal equation as a function of DAS.
Predicted leaf area = a/(1 + e−(x−c)/b)
where a, b, and c are regression parameters and x is DAS.
To investigate the feasibility of using a vegetation index to detect the changes in seedling growth as affected by the cell size in plug trays, the vegetation indices were calculated with the spectral reflectance, as shown in Table 1.

2.4. Image-Based Measurements and Analysis

The experimental data were analyzed using SAS 9.4 statistical software (Enterprise Guide 8.3, SAS Institute Inc., Cary, NC, USA), and Duncan’s multiple range tests were performed to determine the significant difference at p < 0.05. Linear regression analysis was conducted using Microsoft® Excel® (Microsoft 365 MSO Version 16.0.16501.20074, Redmond, WA, USA), and SigmaPlot statistical software (Version 15, Systat Software Inc., Palo Alto, CA, USA) was used for logistic regression analysis.

3. Results and Discussion

3.1. Seedling Growth in Chinese Cabbage as Affected by Cell Size of Plug Tray

The seedling growth was not affected significantly by the cell size of the plug tray at 10 DAS; however, the growth of seedlings in the plug tray with 72 and 105 cells was higher after 15 DAS (Table 2). In all treatments, the seedling growth tended to increase rapidly until 20 DAS and then slowed down. The SPAD value did not show significant differences among different cell plug trays in the cultivation period.
Figure 3 shows the change in the leaf area of seedlings by the cell size of the plug tray. At 10 DAS, there were no significant leaf area differences between treatments; however, the leaf area of seedlings increased by decreasing the number of cells in a plug tray at 15 DAS. The increase in leaf area tended to slow over time after 20 DAS, and the leaf area of the seedlings grown in the plug tray with 72 and 105 cells was approximately three times higher than that grown in the plug tray with 200 cells.
The results are consistent with previous studies that show that the leaf area, shoot fresh weight, and shoot dry weight of seedlings increased with increasing plug tray cell size [10]. Cabbage seedlings grown in plug trays with larger cell sizes had relatively better growth, and the seedlings with better growth led to increased productivity [40]. However, Kim et al. [41] reported that zucchini seedlings grown in a 32-cell plug tray showed lower quality of the first harvested fruit than those grown in plug trays with 50, 105, and 163 cells. The optimal cell size in the plug tray should be determined carefully considering the seedling growth characteristics, cultivation area, period, and resources used during the nursery process.

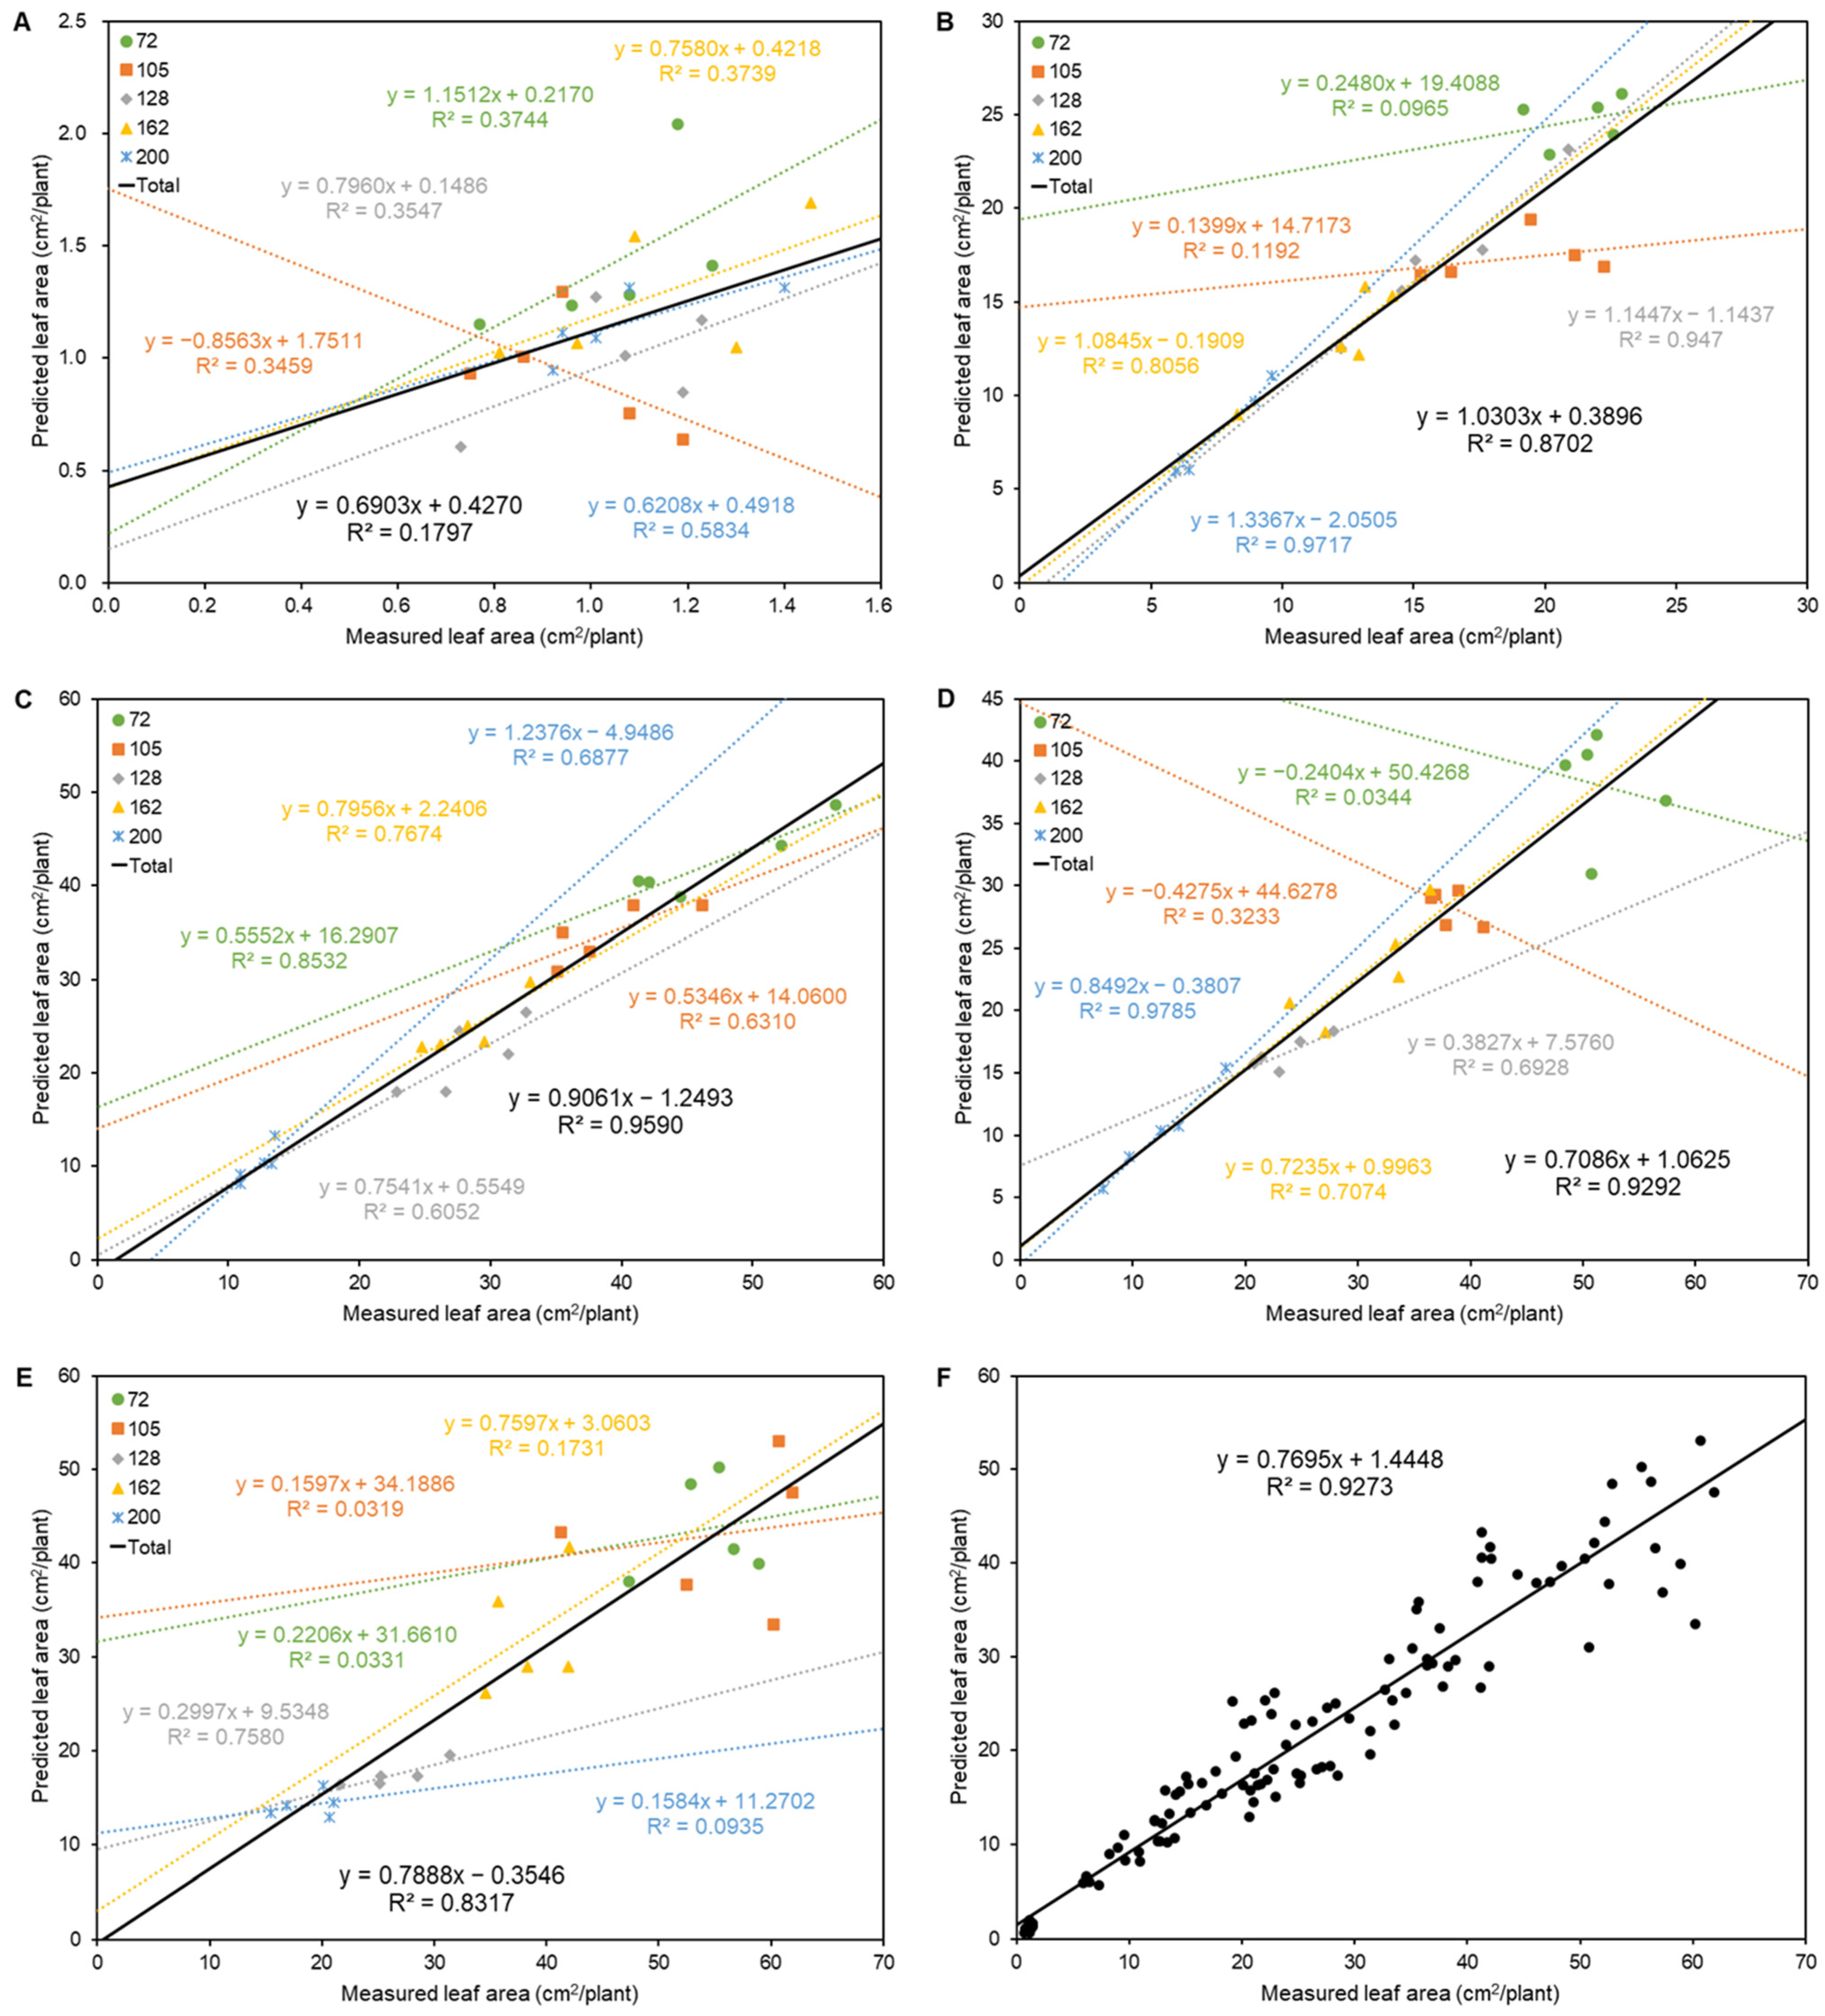
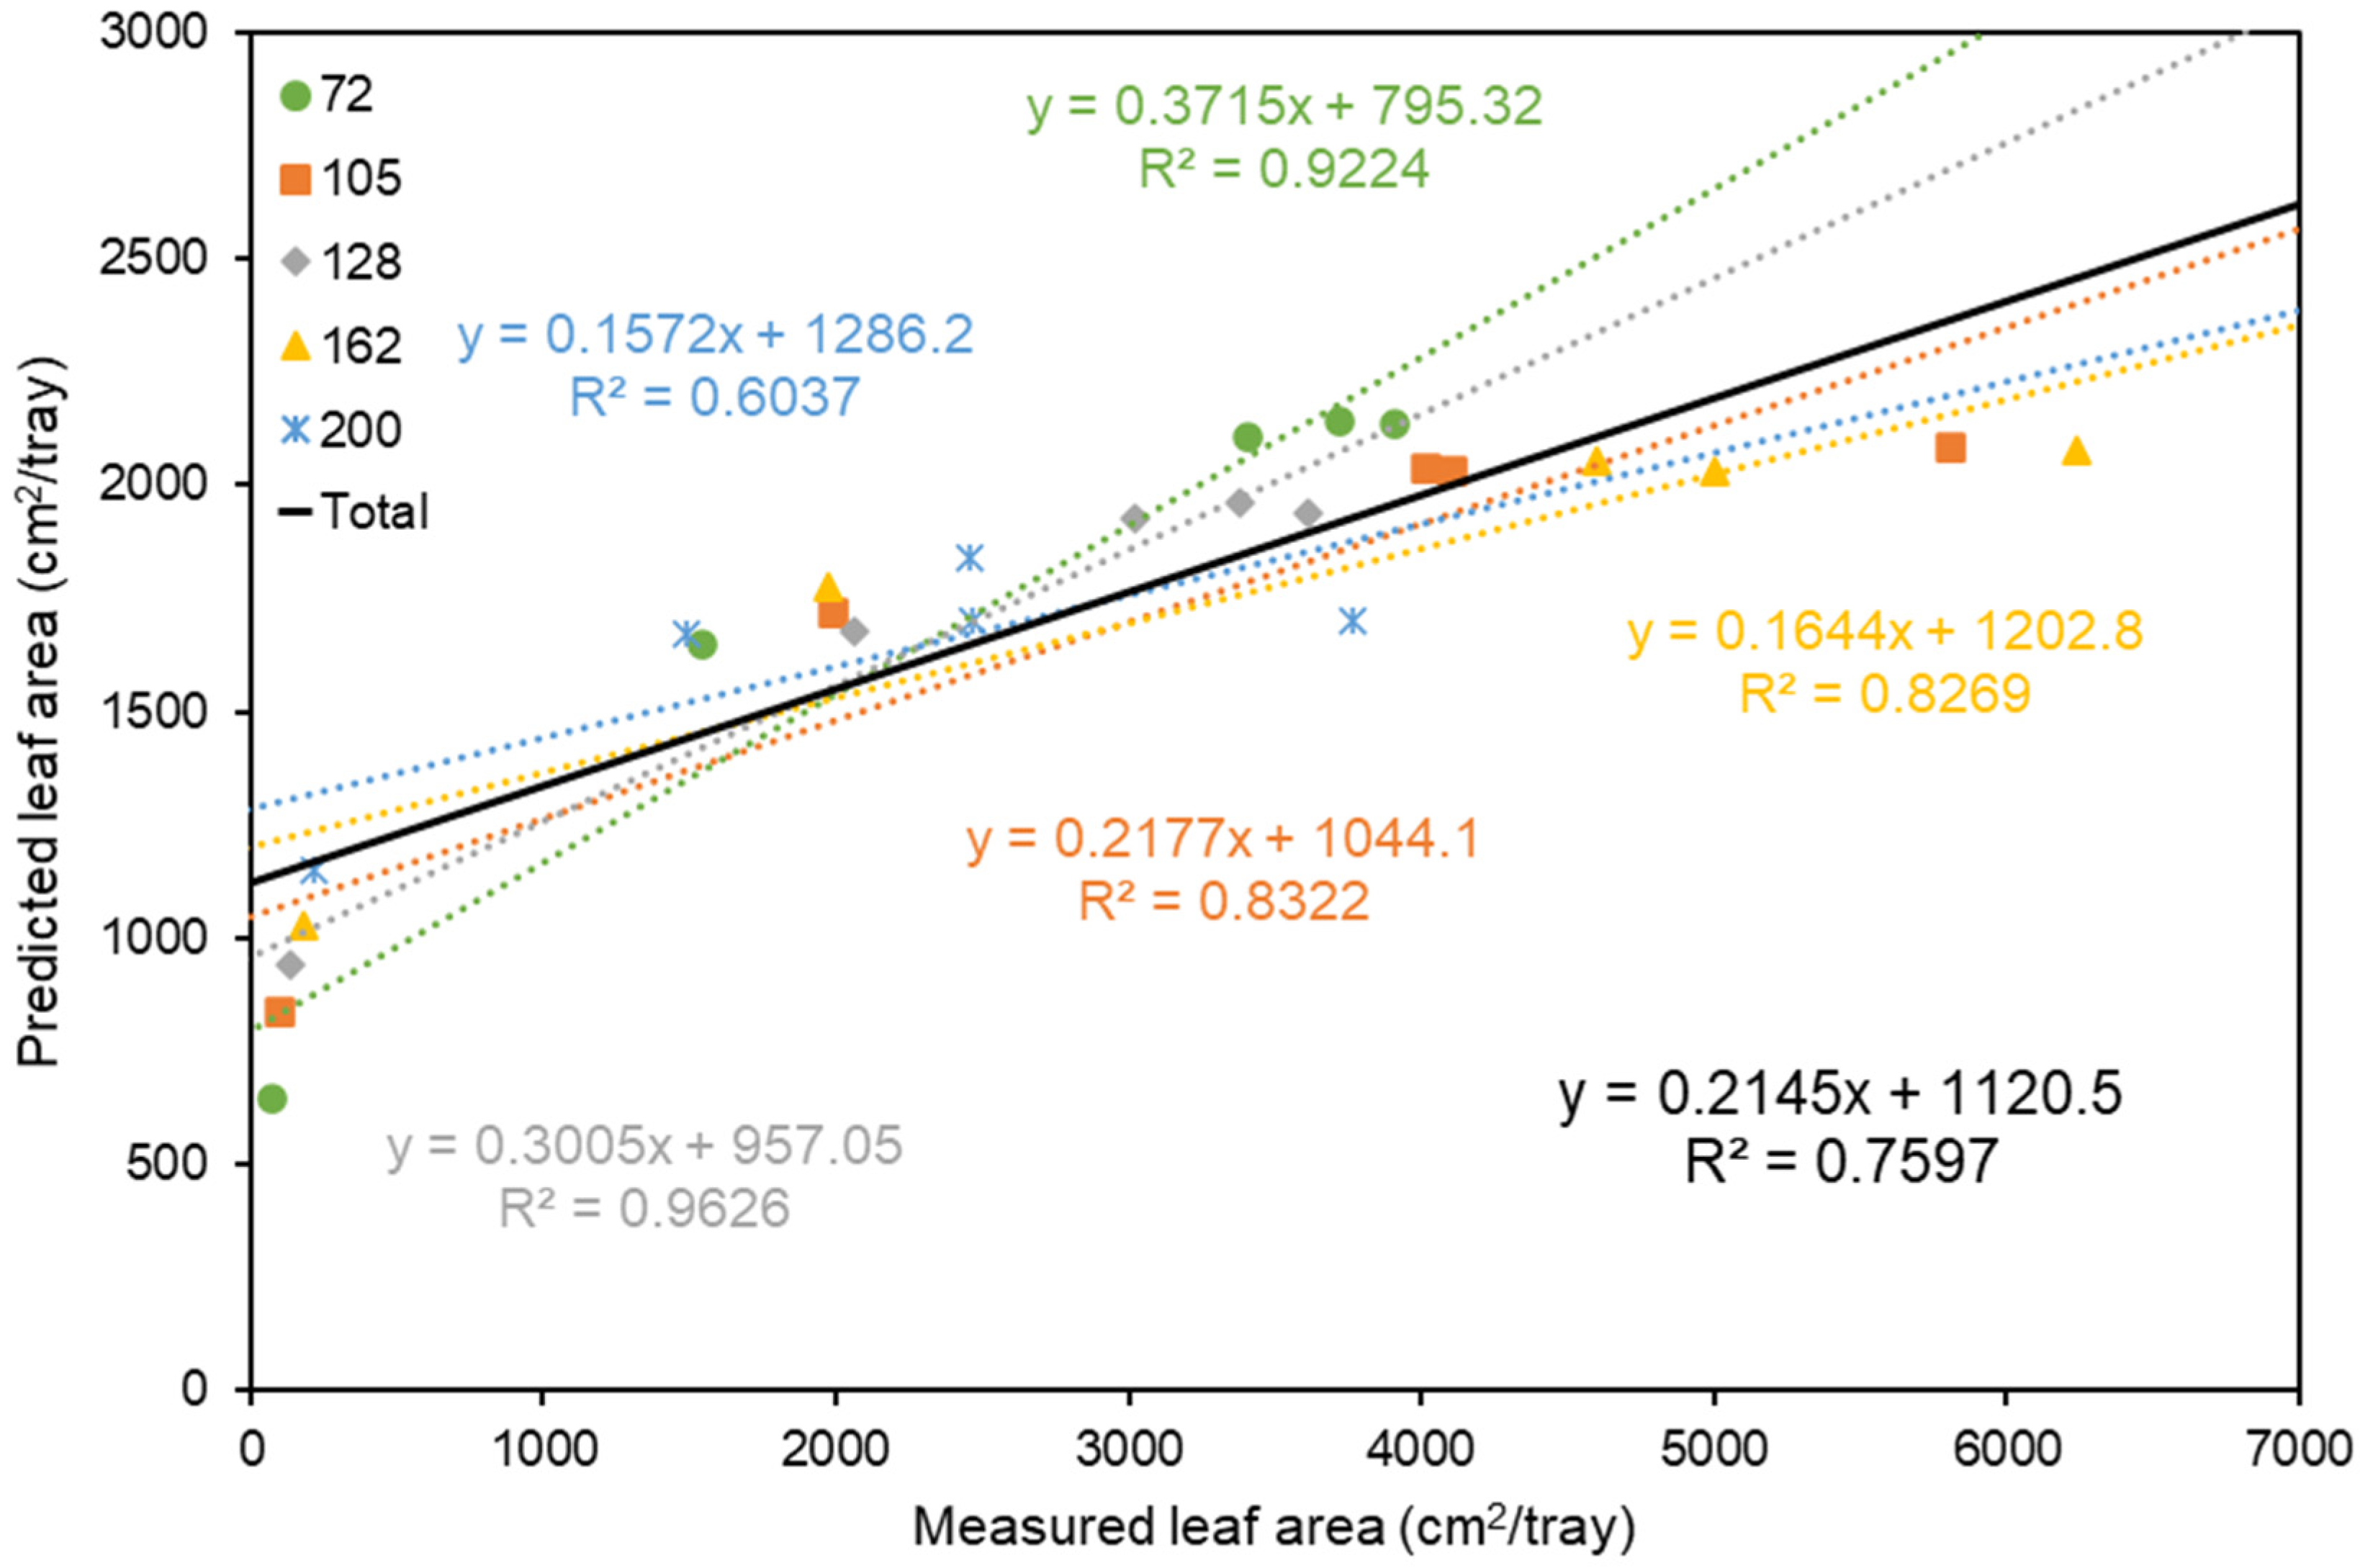
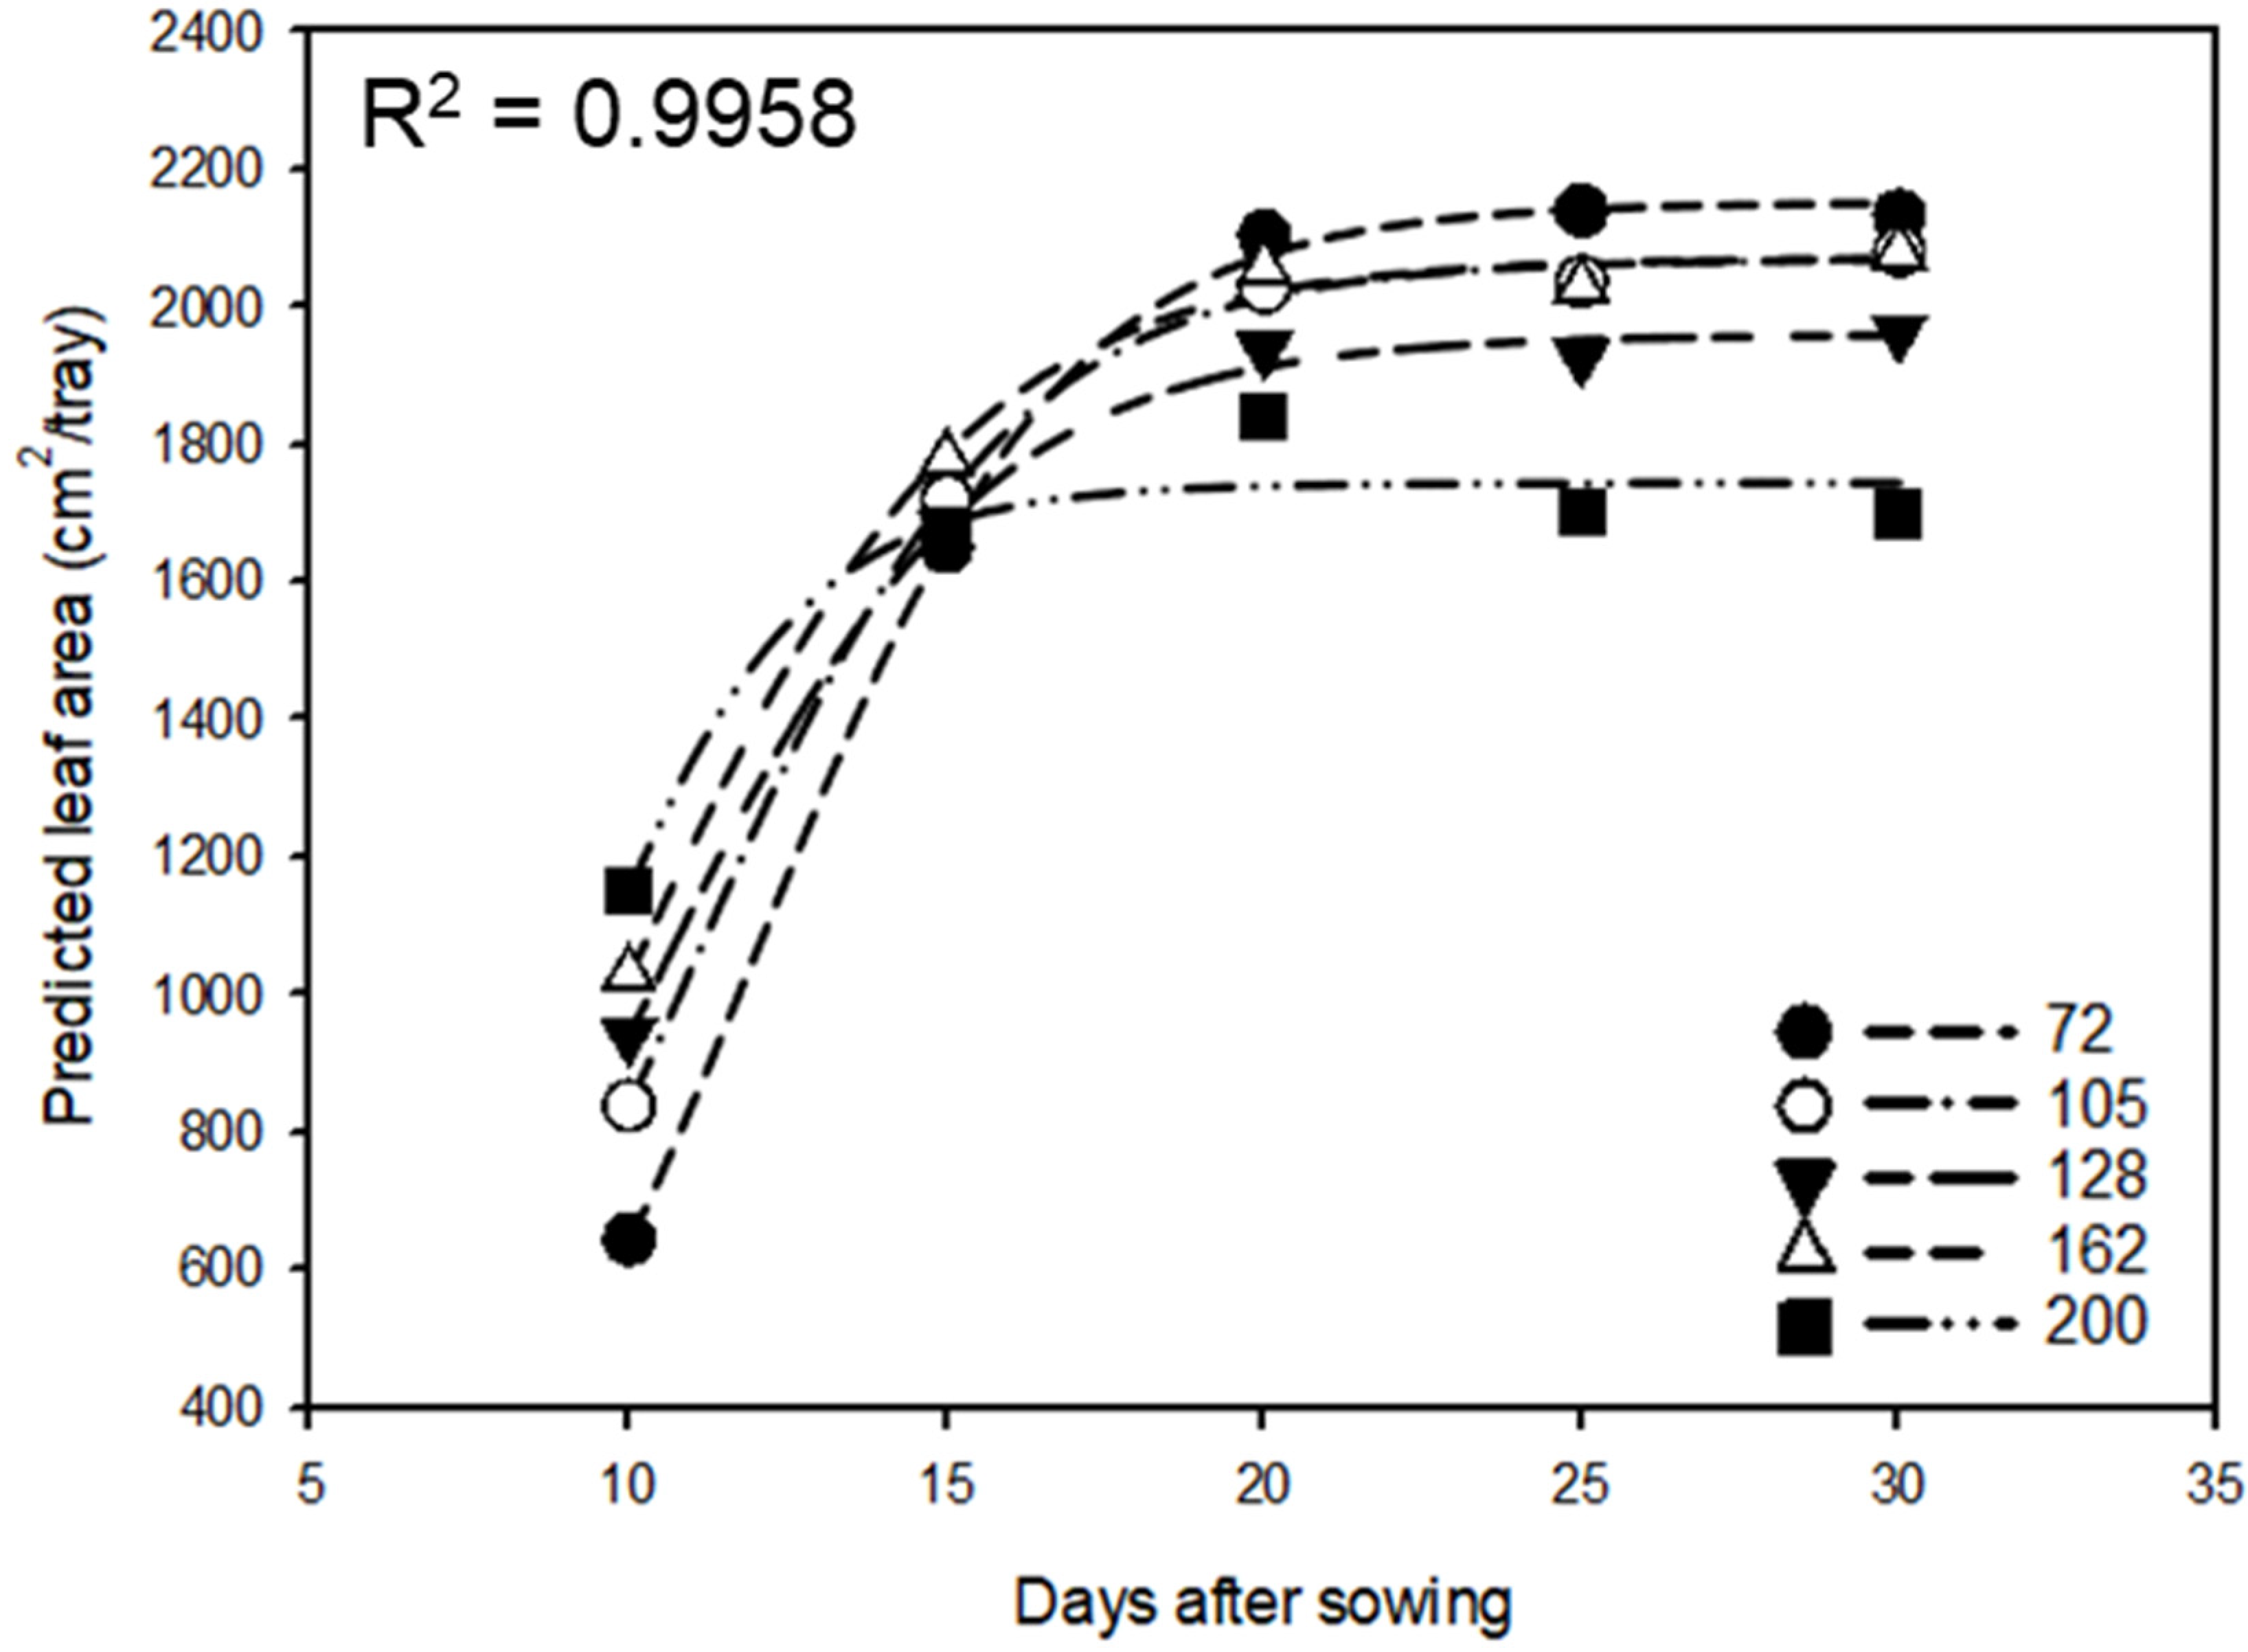
3.2. Correlation Analysis between Measured and Predicted Leaf Area

We correlated the leaf area predicted using multispectral imaging with the measured leaf area (Figure 4). Except at 10 DAS, the coefficients of determination of the linear regression between the predicted and measured values were very high (R2 > 0.8) (Figure 4B–E). As shown in the results for the entire experimental period (Figure 4F), the predicted leaf area correlated with the measured leaf area with a high coefficient of determination (R2 = 0.927). It was confirmed that the individual leaf area can be predicted with high accuracy using multispectral imaging. However, the negative correlation between the predicted and measured leaf areas is likely due to leaf twisting at the time of imaging, resulting in a smaller predicted leaf area.
The leaf area of the plug tray unit was also predicted well through the use of multispectral imaging in all treatments; however, the coefficient of determination was lower compared to the correlation analysis of individual leaf area prediction (Figure 5). The decreased accuracy of leaf area prediction in a plug tray was due to the overlapping and wrapping area of leaves within the plug tray not being considered.
In Figure 6 and Table 3, the predicted leaf area of the plug tray unit was a strong fit to a sigmoidal curve with DAS as independent variables (R2 > 0.95). Sigmoidal regression curves can be used to estimate the predicted leaf area of a plug tray unit over time according to the different cell sizes of plug trays.
Leaf area is one of the important parameters for determining the growth and quality of Chinese cabbage seedlings. The Chinese cabbage is cultivated year round by employing different cropping types in Korea; therefore, Chinese cabbage seedlings are produced using different cultivation managements (different cell plug trays, cultivation period, fertilization, etc.) depending on the nursery throughout the year. As Chinese cabbage seedlings are cultivated using different cell plug trays and different growing days, it is important to analyze the leaf area of the seedling non-destructively in different cell plug trays during the cultivation period. Many researchers conducted the prediction of individual leaf area using image analysis and reported that the leaf area of the plant unit was predicted well [42,43,44,45]. Our results also showed a high level of accuracy in the prediction of individual leaf area.
In commercial nurseries, the management of cultivation and shipment is handled on a plug tray basis and not on a seedling basis. Therefore, the prediction of leaf area per plug tray using image analysis has less accuracy but is more meaningful than the prediction of individual leaf area. Tong et al. [46] found that the leaf area of tomato, cucumber, aubergine, and pepper seedlings in a plug tray was predicted through the segmentation of seedling images and reported that the prediction accuracy was higher than 95% in the four different seedlings. Leaf overlapping, which was estimated to be a source of error in the leaf area analysis of the plug tray unit, was smaller than that in our study because the seedlings were cultivated for 10–15 days in plug trays with 50 and 72 cells in the study by Tong et al. [46]. As the predicted leaf area of a plug tray unit can be used to characterize the changes in leaf area among different cell plug trays, we obtained a sigmoid regression curve of predicted leaf area of a plug tray unit using DAS with a high fitness. A previous study showed that the predicted leaf area of individual lettuce plants fitted to a sigmoidal curve using days after germination, and the models were used to calculate the total incident light throughout the cultivation period [47]. Through further research under various environmental conditions, we can improve the model of predicted leaf area in different cell plug trays using cumulative temperature or light integral during the cultivation period.

3.3. Correlation Analysis between Vegetation Indices and Growth Parameters

Linear regression analysis was conducted to determine the correlation between the measured growth parameters and the vegetation indices calculated using spectral reflectance. At 25 and 30 DAS, shoot dry weight was significantly correlated with several vegetation indices; however, LAI and SPAD values were less correlated (Table 4 and Table 5). Among the vegetation indices, mrNDVI was highly correlated with shoot dry weight at both 25 and 30 DAS.
The vegetation indices used in this study were NDVI, GNDVI, CIgreen, TVI, mrNDVI, and RDVI. The vegetation indices were applied widely to estimate crop growth parameters such as biomass, yield, LAI, etc. NDVI and RDVI are the indices that use the NIR and RED spectrums to estimate the green biomass of plants, and RDVI is the index that modifies NDVI to consider the density of the canopy [39]. GNDVI and CIgreen are the indices that use the NIR and GREEN spectrums and are more sensitive to chlorophyll concentration than NDVI [48,49]. TVI is the index that calculates the area of a triangle consisting of the green peak, the chlorophyll absorption minimum, and the NIR shoulder based on changes in the spectral reflectance due to chlorophyll absorption and leaf tissue abundance. mrNDVI is the index modified from NDVI to correct for increased reflectance across the entire visible spectrum due to high leaf surface reflectance. Sims and Gamon [38] chose R445 as a measure of surface reflectance in mrNDVI because it has a stable value under changes in chlorophyll content. In this study, we replaced R445 with R450, which can be obtained from a multispectral camera.
Our results showed that the correlation between vegetation indices and growth parameters was not clear until 20 DAS, and some vegetation indices correlated with shoot dry weight at 25 and 30 DAS. Previous research reported that NDVI increased with increasing LAI until LAI reached 3 [50,51,52,53]. It was found that GNDVI and CIgreen were more sensitive to chlorophyll concentration than NDVI [34,35,54]. RDVI and TVI showed a high correlation with biomass in wheat and sorghum, respectively [55,56]. The vegetation indices were mainly applied to estimate the growth status in an open field or a forest, and there was some research in greenhouses [57]. mrNDVI, which was highly correlated with water stress [57], showed a high correlation with the shoot dry weight of Chinese cabbage seedlings at 25 and 30 DAS.
NDVI, the most commonly used vegetation index for crop growth detection, showed a lower correlation with growth parameters than the other vegetation indices in our study. In addition, LAI and SPAD values show a low correlation with vegetable indices. As our research is intended to build basic data for the non-destructive detection of Chinese cabbage seedling growth and quality using vegetation indices, we conducted linear regression analysis. However, some vegetation indices applied in this study have been reported to have a non-linear relationship with growth parameters such as LAI and chlorophyll content in previous studies [34,38,58]. NDVI saturates asymptotically when the LAI exceeds 2 and becomes nearly constant in value when the LAI is above 3 [50,58]. At 25 DAS, the LAI of seedlings was higher than 2, which would have reduced the correlation between NDVI and growth parameters.
The application of vegetation indices to the seedling production in a greenhouse is a first attempt, and we suggested that mrNDVI can be used to analyze the seedling growth non-destructively and quickly at the last stage of cultivation. However, early determination of seedling growth using vegetation indices was not possible in this study. In the early stage of seedling production, the reflectance analyzed from the image was strongly influenced by the commercial medium due to the small leaf area. The noise in reflectance prevents the vegetation indices from reflecting seedling growth. Xue et al. [59] also reported that the interference of soil reflectance was one of the factors limiting the application of vegetation indices. The use of vegetation indices can be a powerful tool to save time, money, and crop losses for growth and quality measurements in agriculture; however, vegetation indices can have different sensitivities to different varieties, which means further research is needed to find the optimal vegetation index for each variety [60]. Therefore, the proper vegetation index should be found by measuring the reflectance at a wider range of wavelengths for detecting the growth and quality of seedlings throughout the cultivation period.

4. Conclusions

In this study, we investigated the changes in the growth of Chinese cabbage seedlings affected by plug tray cell size and analyzed the growth and quality of the seedlings non-destructively using multispectral imaging. The growth of seedlings was increased by increasing the cell size in a plug tray. The leaf area, which is one of the important growth parameters in Chinese cabbage seedlings, was predicted using the image data of the seedlings and plug tray units, and individual leaf area was predicted with a high level of accuracy. The accuracy of predicting the leaf area of the plug tray unit was lower than that of the seedling unit due to the increased overlapping and twisting areas according to DAS. Among several vegetation indices, the applicability of mrNDVI was confirmed in terms of evaluating the growth of the Chinese cabbage seedlings at the last stage of cultivation. In this study, we can confirm the applicability of non-destructive analysis using multispectral imaging to detect the growth and quality of seedlings; however, further studies are needed for the field application of non-destructive analysis in commercial nurseries, including improving the accuracy of leaf area prediction of plug tray unit and developing an appropriate vegetation index for early detection of seedling growth.

Author Contributions

Conceptualization, S.B. and Y.K.; Data curation, S.B.; Formal analysis, S.B.; Funding acquisition, Y.K.; Investigation, S.B. and I.H.; Methodology, Y.K.; Project administration, Y.K.; Resources, Y.K.; Supervision, Y.K.; Validation, Y.K.; Visualization, S.B.; Writing—Original Draft Preparation, S.B. and I.H.; Writing—Review and Editing, Y.K. All authors have read and agreed to the published version of the manuscript.

Funding

This research was funded by Cooperative Research Program for Agriculture Science and Technology Development through Rural Development Administration (RDA), Republic of Korea (Project No. PJ01704003).

Data Availability Statement

Data are contained within the article.

Acknowledgments

This research was supported by the 2022 Advanced Facility Fund of the University of Seoul.

Conflicts of Interest

The authors declare no conflict of interest.

References

  1. Ministry of Agriculture, Food and Rural Affairs (MAFRA). Vegetables Production Performance in 2021. Available online: https://data.mafra.go.kr/opendata/data/indexOpenDataDetail.do?data_id=20220216000000001975 (accessed on 27 October 2023).
  2. Ministry of Agriculture, Food and Rural Affairs (MAFRA). Survey on the Consumption of Raw Material in the Food Industry in 2021. Available online: https://data.mafra.go.kr/opendata/data/indexOpenDataDetail.do?data_id=20141015000000000209 (accessed on 27 October 2023).
  3. Jeong, B.R.; Hwang, S.J.; Kang, N.J. Plug Seedling Production, 1st ed.; Gyeongsang National University Press Department: Jinju, Republic of Korea, 2016; pp. 13–22. [Google Scholar]
  4. Park, G.H.; Park, H.T.; Han, H.S. A Study on the Current State and Development Strategies of Raising Seedlings Industry, 1st ed.; Korea Rural Economic Institute: Naju, Republic of Korea, 2011; pp. 15–87. [Google Scholar]
  5. Yeoung, Y.R.; Jeon, J.Y.; Shim, S.Y. Characteristics of root development and seedling quality during pepper seedling growth in copper coated plug trays. J. Korean Soc. Hortic. Sci. 2002, 43, 151–154. [Google Scholar]
  6. Korea Agro-Fisheries & Food Trade Corporation (aT). Distribution of Agricultural Products in 2021. Available online: https://www.kamis.or.kr/customer/circulation/domestic/analysis.do (accessed on 27 October 2023).
  7. Kim, S.E.; Lee, M.H.; Ahn, B.J.; Kim, Y.S. Effects of Spacing and Plug Cell Size on Seedling Quality and Yield and Qualities of Tomatoes. Prot. Hortic. Plant Fact. 2013, 22, 256–261. [Google Scholar] [CrossRef]
  8. Oh, H.J.; Park, Y.G.; Park, J.E.; Jeong, B.R. Effect of Cell Size on Growth and Development of Plug Seedlings of Three Indigenous Medicinal Plants. Prot. Hortic. Plant Fact. 2014, 23, 71–76. [Google Scholar] [CrossRef]
  9. Jeong, H.W.; Kim, H.M.; Lee, H.R.; Kim, H.M.; Hwang, S.J. Growth of Astragalus membranaceus during Nursery Period as Affected by Different Plug Tray Cell Size, Number of Seeds per Cell, Irrigation Interval, and EC Level of Nutrient Solution. HortScience Techonol. 2020, 38, 210–217. [Google Scholar] [CrossRef]
  10. Maynard, E.T.; Vavrina, C.S.; Scott, W.D. Containerized muskmelon transplants: Cell volume effects on pretransplant development and subsequent yield. HortScience 1996, 31, 58–61. [Google Scholar] [CrossRef]
  11. Zhang, J.; Wang, Y.; Wang, P.; Zhang, Q.A.; Yan, C.; Yu, F.; Yi, J.; Fang, L. Effect of different levels of nitrogen, phosphorus, and potassium on root activity and chlorophyll content in leaves of Brassica oleracea seedlings grown in vegetable nursery substrate. Hortic. Environ. Biotechnol. 2017, 58, 5–11. [Google Scholar] [CrossRef]
  12. Zhu, X.; Yang, R.; Han, Y.; Hao, J.; Liu, C.; Fan, S. Effects of different NO3: NH4+ ratios on the photosynthesis and ultrastructure of lettuce seedlings. Hortic. Environ. Biotechnol. 2020, 61, 459–472. [Google Scholar] [CrossRef]
  13. Khaeim, H.; Kende, Z.; Balla, I.; Gyuricza, C.; Eser, A.; Tarnawa, Á. The Effect of Temperature and Water Stresses on Seed Germination and Seedling Growth of Wheat (Triticum aestivum L.). Sustainability 2022, 14, 3887. [Google Scholar] [CrossRef]
  14. Bantis, F.; Koukounaras, A.; Siomos, A.; Menexes, G.; Dangitsis, C.; Kintzonidis, D. Assessing quantitative criteria for characterization of quality categories for grafted watermelon seedlings. Horticulturae 2019, 5, 16. [Google Scholar] [CrossRef]
  15. Kim, H.C.; Cho, Y.H.; Ku, Y.G.; Bae, J.H. Seedling qualities of hot pepper according to seedling growth periods and growth and yield after planting. Hortic. Sci. Technol. 2015, 33, 839–844. [Google Scholar] [CrossRef]
  16. Michelon, N.; Pennisi, G.; Myint, N.O.; Orsini, F.; Gianquinto, G. Optimization of Substrate and Nutrient Solution Strength for Lettuce and Chinese Cabbage Seedling Production in the Semi-Arid Environment of Central Myanmar. Horticulturae 2021, 7, 64. [Google Scholar] [CrossRef]
  17. Min, M.; Lee, W.S.; Kim, Y.H.; Bucklin, R.A. Nondestructive detection of nitrogen in Chinese cabbage leaves using VIS–NIR spectroscopy. HortScience 2006, 41, 62–166. [Google Scholar] [CrossRef]
  18. Liu, C.; Liu, W.; Lu, X.; Ma, F.; Chen, W.; Yang, J.; Zheng, L. Application of multispectral imaging to determine quality attributes and ripeness stage in strawberry fruit. PLoS ONE 2014, 9, e87818. [Google Scholar] [CrossRef] [PubMed]
  19. Zhang, J.; Zhang, D.; Cai, Z.; Wang, L.; Wang, J.; Sun, L.; Fan, X.; Shen, X.; Zhao, J. Spectral technology and multispectral imaging for estimating the photosynthetic pigments and SPAD of the Chinese cabbage based on machine learning. Comput. Electron. Agric. 2022, 195, 106814. [Google Scholar] [CrossRef]
  20. Ihuoma, S.O.; Madramootoo, C.A. Sensitivity of spectral vegetation indices for monitoring water stress in tomato plants. Comput. Electron. Agric. 2019, 163, 104860. [Google Scholar] [CrossRef]
  21. Rubo, S.; Zinkernagel, J. Exploring hyperspectral reflectance indices for the estimation of water and nitrogen status of spinach. Biosyst. Eng. 2022, 214, 58–71. [Google Scholar] [CrossRef]
  22. Lopez-Fornieles, E.; Brunel, G.; Rancon, F.; Gaci, B.; Metz, M.; Devaux, N.; Taylor, J.; Tisseyre, B.; Roger, J.M. Potential of Multiway PLS (N-PLS) regression method to analyse time-series of multispectral images: A case study in agriculture. Remote Sens. 2022, 14, 216. [Google Scholar] [CrossRef]
  23. Agarwal, A.; Gupta, S.D. Assessment of spinach seedling health status and chlorophyll content by multivariate data analysis and multiple linear regression of leaf image features. Comput. Electron. Agric. 2018, 152, 281–289. [Google Scholar] [CrossRef]
  24. Huang, S.; Miao, Y.; Zhao, G.; Yuan, F.; Ma, X.; Tan, C.; Yu, W.; Gnyp, M.L.; Lenz-Wiedemann, V.I.S.; Rascher, U.; et al. Satellite remote sensing-based in-season diagnosis of rice nitrogen status in Northeast China. Remote Sens. 2015, 7, 10646–10667. [Google Scholar] [CrossRef]
  25. Schlemmer, M.; Gitelson, A.; Schepers, J.; Ferguson, R.; Peng, Y.; Shanahan, J.; Rundquist, D. Remote estimation of nitrogen and chlorophyll contents in maize at leaf and canopy levels. Int. J. Appl. Earth Obs. Geoinf. 2013, 25, 47–54. [Google Scholar] [CrossRef]
  26. Bian, C.; Shi, H.; Wu, S.; Zhang, K.; Wei, M.; Zhao, Y.; Sun, Y.; Zhuang, H.; Zhang, X.; Chen, S. Prediction of field-scale wheat yield using machine learning method and multi-spectral UAV data. Remote Sens. 2022, 14, 1474. [Google Scholar] [CrossRef]
  27. Zhang, L.; Zhang, H.; Niu, Y.; Han, W. Mapping maize water stress based on UAV multispectral remote sensing. Remote Sens. 2019, 11, 605. [Google Scholar] [CrossRef]
  28. Zheng, H.; Cheng, T.; Li, D.; Zhou, X.; Yao, X.; Tian, Y.; Cao, W.; Zhu, Y. Evaluation of RGB, color-infrared and multispectral images acquired from unmanned aerial systems for the estimation of nitrogen accumulation in rice. Remote Sens. 2018, 10, 824. [Google Scholar] [CrossRef]
  29. Padilla, F.M.; Peña-Fleitas, M.T.; Gallardo, M.; Thompson, R.B. Evaluation of optical sensor measurements of canopy reflectance and of leaf flavonols and chlorophyll contents to assess crop nitrogen status of muskmelon. Eur. J. Agron. 2014, 58, 39–52. [Google Scholar] [CrossRef]
  30. Padilla, F.M.; Peña-Fleitas, M.T.; Gallardo, M.; Thompson, R.B. Threshold values of canopy reflectance indices and chlorophyll meter readings for optimal nitrogen nutrition of tomato. Ann. Appl. Biol. 2015, 166, 271–285. [Google Scholar] [CrossRef]
  31. Sun, G.; Wang, X.; Sun, Y.; Ding, Y.; Lu, W. Measurement method based on multispectral three-dimensional imaging for the chlorophyll contents of greenhouse tomato plants. Sensors 2019, 19, 3345. [Google Scholar] [CrossRef] [PubMed]
  32. Wang, H.; Qian, X.; Zhang, L.; Xu, S.; Li, H.; Xia, X.; Dai, L.; Xu, L.; Yu, J.; Liu, X. A method of high throughput monitoring crop physiology using chlorophyll fluorescence and multispectral imaging. Front. Plant Sci. 2018, 9, 407. [Google Scholar] [CrossRef]
  33. Rouse, J.W.; Haas, R.H.; Schell, J.A.; Deering, D.W. Monitoring vegetation systems in the Great Plains with ERTS. NASA Spec. Publ. 1974, 351, 309–317. [Google Scholar]
  34. Gitelson, A.A.; Kaufman, Y.J.; Merzlyak, M.N. Use of a green channel in remote sensing of global vegetation from EOS-MODIS. Remote Sens. Environ. 1996, 58, 289–298. [Google Scholar] [CrossRef]
  35. Gitelson, A.A.; Gritz, Y.; Merzlyak, M.N. Relationships between leaf chlorophyll content and spectral reflectance and algorithms for non-destructive chlorophyll assessment in higher plant leaves. J. Plant Physiol. 2003, 160, 271–282. [Google Scholar] [CrossRef]
  36. Gitelson, A.A.; Viña, A.; Ciganda, V.; Rundquist, D.C.; Arkebauer, T.J. Remote estimation of canopy chlorophyll content in crops. Geophys. Res. Lett. 2005, 32, 271–282. [Google Scholar] [CrossRef]
  37. Broge, N.H.; Leblanc, E. Comparing prediction power and stability of broadband and hyperspectral vegetation indices for estimation of green leaf area index and canopy chlorophyll density. Remote Sens. Environ. 2000, 76, 156–172. [Google Scholar] [CrossRef]
  38. Sims, D.A.; Gamon, J.A. Relationships between leaf pigment content and spectral reflectance across a wide range of species, leaf structures and developmental stages. Remote Sens. Environ. 2002, 81, 337–354. [Google Scholar] [CrossRef]
  39. Roujean, J.L.; Breon, F.M. Estimating PAR absorbed by vegetation from bidirectional reflectance measurements. Remote Sens. Environ. 1995, 51, 375–384. [Google Scholar] [CrossRef]
  40. Marsh, D.B.; Paul, K.B. Influence of container type and cell size on cabbage transplant development and field performance. HortScience 1988, 23, 310–311. [Google Scholar] [CrossRef]
  41. Kim, Y.S.; Park, Y.G.; Jung, B.R. Seedling Quality, and Early Growth and Fruit Productivity after Transplanting of Squash as Affected by Plug Cell Size and Seedling Raising Period. J. Bio-Environ. Control 2019, 28, 185–196. [Google Scholar] [CrossRef]
  42. Singh, B.; Kumar, S.; Elangovan, A.; Vasht, D.; Arya, S.; Duc, N.T.; Swami, P.; Pawar, G.S.; Raju, D.; Krishna, H.; et al. Phenomics based prediction of plant biomass and leaf area in wheat using machine learning approaches. Front. Plant Sci. 2023, 14, 1214801. [Google Scholar] [CrossRef] [PubMed]
  43. Nyakwende, E.; Paull, C.J.; Atherton, J.G. Non-destructive determination of leaf area in tomato plants using image processing. J. Hortic. Sci. 1997, 72, 255–262. [Google Scholar] [CrossRef]
  44. Mohammadi, V.; Minaei, S.; Mahdavian, A.R.; Khoshtaghaza, M.H.; Gouton, P. Estimation of Leaf Area in Bell Pepper Plant using Image Processing techniques and Artificial Neural Networks. In Proceedings of the 2021 IEEE International Conference on Signal and Image Processing Applications (IEEE ICSIPA 2021), Kuala Terengganu, Malaysia, 13–15 September 2021; Institute of Electrical and Electronic Engineers (IEEE): Piscataway, NJ, USA, 2021; pp. 173–178. [Google Scholar]
  45. Gang, M.S.; Kim, H.J.; Kim, D.W. Estimation of Greenhouse Lettuce Growth Indices Based on a Two-Stage CNN Using RGB-D Images. Sensors 2022, 22, 5499. [Google Scholar] [CrossRef]
  46. Tong, J.H.; Li, J.B.; Jiang, H.Y. Machine vision techniques for the evaluation of seedling quality based on leaf area. Biosyst. Eng. 2013, 115, 369–379. [Google Scholar] [CrossRef]
  47. Kim, C.H.; van Iersel, M.W. Morphological and Physiological Screening to Predict Lettuce Biomass Production in Controlled Environment Agriculture. Remote Sens. 2022, 14, 316. [Google Scholar] [CrossRef]
  48. De Souza, R.; Grasso, R.; Peña-Fleitas, M.T.; Gallardo, M.; Thompson, R.B.; Padilla, F.M. Effect of cultivar on chlorophyll meter and canopy reflectance measurements in cucumber. Sensors 2020, 20, 509. [Google Scholar] [CrossRef] [PubMed]
  49. Wu, C.; Wang, L.; Niu, Z.; Gao, S.; Wu, M. Nondestructive estimation of canopy chlorophyll content using Hyperion and Landsat/TM images. Int. J. Remote Sens. 2010, 31, 2159–2167. [Google Scholar] [CrossRef]
  50. Aparicio, N.; Villegas, D.; Casadesus, J.; Araus, J.L.; Royo, C. Spectral vegetation indices as nondestructive tools for determining durum wheat yield. Agron. J. 2000, 92, 83–91. [Google Scholar] [CrossRef]
  51. Carlson, T.N.; Ripley, D.A. On the relation between NDVI, fractional vegetation cover, and leaf area index. Remote Sens. Environ. 1997, 62, 241–252. [Google Scholar] [CrossRef]
  52. Curran, P.J. Multispectral remote sensing for the estimation of green leaf area index. Philos. Trans. R. Soc. London. Ser. A Math. Phys. Sci. 1983, 309, 257–270. [Google Scholar] [CrossRef]
  53. Sellers, P.J. Canopy reflectance, photosynthesis and transpiration. Int. J. Remote Sens. 1985, 6, 1335–1372. [Google Scholar] [CrossRef]
  54. Solari, F.; Shanahan, J.; Ferguson, R.; Schepers, J.; Gitelson, A. Active sensor reflectance measurements of corn nitrogen status and yield potential. Agron. J. 2008, 100, 571–579. [Google Scholar] [CrossRef]
  55. Tang, Z.; Guo, J.; Xiang, Y.; Lu, X.; Wang, Q.; Wang, H.; Cheng, M.; Wang, H.; Wang, X.; An, J.; et al. Estimation of Leaf Area Index and Above-Ground Biomass of Winter Wheat Based on Optimal Spectral Index. Agronomy 2022, 12, 1729. [Google Scholar] [CrossRef]
  56. Li, J.; Shi, Y.; Veeranampalayam-Sivakumar, A.N.; Schachtman, D.P. Elucidating sorghum biomass, nitrogen and chlorophyll contents with spectral and morphological traits derived from unmanned aircraft system. Front. Plant Sci. 2018, 9, 1406. [Google Scholar] [CrossRef]
  57. Elvanidi, A.; Katsoulas, N.; Bartzanas, T.; Ferentinos, K.P.; Kittas, C. Crop water status assessment in controlled environment using crop reflectance and temperature measurements. Precis. Agric. 2017, 18, 332–349. [Google Scholar] [CrossRef]
  58. Haboudane, D.; Miller, J.R.; Pattey, E.; Zarco-Tejada, P.J.; Strachan, I.B. Hyperspectral vegetation indices and novel algorithms for predicting green LAI of crop canopies: Modeling and validation in the context of precision agriculture. Remote Sens. Environ. 2004, 90, 337–352. [Google Scholar] [CrossRef]
  59. Xue, J.; Su, B. Significant remote sensing vegetation indices: A review of developments and applications. J. Sens. 2017, 2017, 1353691. [Google Scholar] [CrossRef]
  60. Badagliacca, G.; Messina, G.; Praticò, S.; Lo Presti, E.; Preiti, G.; Monti, M.; Modica, G. Multispectral Vegetation Indices and Machine Learning Approaches for Durum Wheat (Triticum durum Desf.) Yield Prediction across Different Varieties. AgriEngineering 2023, 5, 2032–2048. [Google Scholar] [CrossRef]
Figure 1. Plant image measurement system (PIMS). An LED with a wavelength in the range of 400 to 1000 nm and a multispectral camera are installed in this system.
Horticulturae 09 01288 g001
Figure 2. Seedling image analysis using ENVI program.
Horticulturae 09 01288 g002
Figure 3. Changes in leaf area of Chinese cabbage ‘Chun-gwang’ seedlings at 10, 15, 20, 25, and 30 days after sowing.
Horticulturae 09 01288 g003
Figure 4. Correlation between measured and predicted leaf areas of seedling unit in Chinese cabbage ‘Chun-gwang’ ((A), 10; (B), 15; (C), 20; (D), 25; (E), 30 DAS; (F), total).
Horticulturae 09 01288 g004
Figure 5. Correlation between measured and predicted leaf areas of plug tray unit in Chinese cabbage ‘Chun-gwang’.
Horticulturae 09 01288 g005
Figure 6. Sigmoidal regression curves of predicted leaf area in a plug tray of Chinese cabbage ‘Chun-gwang’ throughout the days after sowing.
Horticulturae 09 01288 g006
Table 1. Vegetation indices examined in this study. R represents the reflectance values at the indicated wavelengths in nm. RNIR is the average of R750 and R830.
IndexEquationReference
Normalized Difference
Vegetation Index (NDVI)
(RNIR − RRED)/(RNIR + RRED)[33]
Green Normalized Difference
Vegetation Index (GNDVI)
(RNIR − RGREEN)/(RNIR + RGREEN)[34]
Green Chlorophyll Index (CIgreen)(RNIR/RGREEN) − 1[35,36]
Triangle Vegetation Index (TVI)0.5 × (120 × (RNIR − RGREEN) − 200 × (RRED − RGREEN))[37]
Modified Red Edge Normalized
Difference Vegetation Index (mrNDVI)
(R750 − R650)/(R750 + R650 − 2 × R450) [38]
Renormalized Difference
Vegetation Index (RDVI)
(RNIR − RRED)/(RNIR + RRED)1/2[39]
Table 2. Changes in growth parameters of Chinese cabbage ‘Chun-gwang’ seedlings at 10, 15, 20, 25, and 30 days after sowing.
DAS zCells
of Plug Tray
Plant Height
(cm)
Number of Leaves
(/Plant)
SPAD ValueShoot Fresh Weight
(g/Plant)
Shoot Dry Weight
(g/Plant)
1072 cell2.50b y1.8a22.20a0.251a0.016a
105 cell2.24b1.0b24.66a0.231ab0.016a
128 cell2.22b1.2ab22.40a0.212b0.017a
162 cell2.82a1.4ab22.62a0.242ab0.015a
200 cell3.06a1.2ab25.42a0.235ab0.016a
1572 cell6.26a3.2a28.32a0.916a0.068a
105 cell5.98a3.2a28.64a0.760b0.062ab
128 cell5.54ab3.2a28.12a0.724b0.058bc
162 cell5.00bc3.0a29.08a0.559c0.051c
200 cell4.40c2.6a28.08a0.404d0.035d
2072 cell8.54a4.8a27.06a1.678a0.170a
105 cell8.12a4.2b26.10a1.562a0.168a
128 cell7.24b3.8b26.86a1.189b0.125b
162 cell6.76b4.2b25.64a1.167b0.118b
200 cell5.28c3.0c27.90a0.631c0.081c
2572 cell8.30a5.4a28.40a1.879a0.271a
105 cell7.42b5.2ab26.62a1.397b0.197b
128 cell6.94b4.6b26.12a0.960c0.139c
162 cell6.04c4.8ab26.78a1.221b0.177b
200 cell5.30d3.6c27.24a0.561d0.088d
3072 cell7.24b6.0a27.76a1.987a0.368a
105 cell8.16a6.0a27.90a2.141a0.348a
128 cell6.32c4.8bc26.02a1.025c0.159c
162 cell7.28b5.4ab28.24a1.572b0.246b
200 cell5.64c4.2c27.98a0.694d0.127c
z Days after sowing. y Means in columns followed by different letters are significantly different when considering Duncan’s multiple range test at p < 0.05.
Table 3. Sigmoidal equation of predicted leaf area in a plug tray of Chinese cabbage ‘Chun-gwang’ throughout the days after sowing.
TreatmentEquationR2
72 cellPLA = 2152.58/(1 + e−(x−12.07)/2.41)0.999
105 cellPLA = 2069.76/(1 + e−(x−10.97)/2.51)0.999
128 cellPLA = 1960.13/(1 + e−(x−10.22)/2.63)0.998
162 cellPLA = 2071.66/(1 + e−(x−10.05)/2.68)0.997
200 cellPLA = 1744.24/(1 + e−(x−8.79)/1.84)0.952
Table 4. Coefficient of determination (R2) of linear regression analysis between growth parameter and vegetation index in the seedlings of Chinese cabbage ‘Chun-gwang’ at 25 days after sowing.
NDVIGNDVICIgreenTVImrNDVIRDVI
LAI0.27530.26520.26540.16190.27750.2418
SPAD value0.02370.02000.02150.23800.10090.1492
Shoot dry weight0.56740.60780.61560.34800.60680.5221
Table 5. Coefficient of determination (R2) of linear regression analysis between growth parameter and vegetation index in the seedlings of Chinese cabbage ‘Chun-gwang’ at 30 days after sowing.
NDVIGNDVICIgreenTVImrNDVIRDVI
LAI0.03390.03150.03100.11640.21520.0913
SPAD value0.08780.11060.11010.08290.24240.1093
Shoot dry weight0.48320.47730.47060.64140.60950.7018
Disclaimer/Publisher’s Note: The statements, opinions and data contained in all publications are solely those of the individual author(s) and contributor(s) and not of MDPI and/or the editor(s). MDPI and/or the editor(s) disclaim responsibility for any injury to people or property resulting from any ideas, methods, instructions or products referred to in the content.

