
Enhancing Antioxidant Properties of Prunus spinosa Fruit Extracts via Extraction Optimization
 ,
,  ,
,  ,
,  ,
, 
Abstract
:1. Introduction
2. Materials and Methods
2.1. Chemicals and Reagents
2.2. Plant Collection and Preparation
2.3. Extraction Procedure
2.4. Response Surface Methodology (RSM) Optimization of Extraction and Experiment Design
2.5. HPLC-Based Determination of the Neochlorogenic Acid Content and Other Polyphenolic Compounds
2.6. Analyses of Extracts
2.7. Statistical Analysis
3. Results and Discussion
3.1. Optimization of the Extraction
3.2. Multivariate Correlation Analysis (MCA)
3.3. Analysis of the Optimum Extract
4. Conclusions
Supplementary Materials
Author Contributions
Funding
Data Availability Statement
Conflicts of Interest
References
- Rosales Soto, M.U.; Brown, K.; Ross, C.F. Antioxidant Activity and Consumer Acceptance of Grape Seed Flour-Containing Food Products. Int. J. Food Sci. Technol. 2012, 47, 592–602. [Google Scholar] [CrossRef]
- Carlsen, M.H.; Halvorsen, B.L.; Holte, K.; Bøhn, S.K.; Dragland, S.; Sampson, L.; Willey, C.; Senoo, H.; Umezono, Y.; Sanada, C.; et al. The Total Antioxidant Content of More than 3100 Foods, Beverages, Spices, Herbs and Supplements Used Worldwide. Nutr. J. 2010, 9, 3. [Google Scholar] [CrossRef] [PubMed]
- Marchelak, A.; Owczarek, A.; Matczak, M.; Pawlak, A.; Kolodziejczyk-Czepas, J.; Nowak, P.; Olszewska, M.A. Bioactivity Potential of Prunus spinosa L. Flower Extracts: Phytochemical Profiling, Cellular Safety, Pro-Inflammatory Enzymes Inhibition and Protective Effects against Oxidative Stress In Vitro. Front. Pharmacol. 2017, 8, 680. [Google Scholar] [CrossRef] [PubMed]
- Kondrashev, S.; Nesterova, N.; Luzin, A.; Kochanov, V.; Luzina, A.; Matyushin, A. Qualitative and Quantitative Assay of Hydroxycinnamates of Prunus spinosa L. Pharmacogn. J. 2020, 12, 157–161. [Google Scholar] [CrossRef]
- Mitroi, C.L.; Gherman, A.; Gociu, M.; Bujancă, G.; Cocan, N.; Rădulescu, L.; Megyesi, C.I.; Velciov, A. The Antioxidant Activity of Blackthorn Fruits (Prunus spinosa L.) Review. J. Agroaliment. Process. Technol. 2022, 28, 288–291. [Google Scholar]
- Ozzengin, B.; Zannou, O.; Koca, I. Quality Attributes and Antioxidant Activity of Three Wild Plums from Prunus spinosa and Prunus domestica Species. Meas. Food 2023, 10, 100079. [Google Scholar] [CrossRef]
- Ulusoy, A.; Tamer, C.E. Determination of Suitability of Black Carrot (Daucus carota L. Spp. Sativus Var. Atrorubens Alef.) Juice Concentrate, Cherry Laurel (Prunus laurocerasus), Blackthorn (Prunus spinosa) and Red Raspberry (Rubus ideaus) for Kombucha Beverage Production. J. Food Meas. Charact. 2019, 13, 1524–1536. [Google Scholar] [CrossRef]
- Karakas, N.; Okur, M.E.; Ozturk, I.; Ayla, S.; Karadağ, A.E.; Polat, D.Ç. Antioxidant Activity and Cytotoxic Effects of Prunus spinosa L. Fruit Extract on Various Cancer Cell Lines. Medeni. Med. J. 2019, 34, 297–304. [Google Scholar] [CrossRef]
- Capek, P.; Košťálová, Z. Isolation, Chemical Characterization and Antioxidant Activity of Prunus spinosa L. Fruit Phenolic Polysaccharide-Proteins. Carbohydr. Res. 2022, 515, 108547. [Google Scholar] [CrossRef]
- Ayla, Ş.; Günal, M.Y.; Sayın Şakul, A.A.; Biçeroğlu, Ö.; Özdemir, E.M.; Okur, M.E.; Polat, D.Ç.; Üstündağ Okur, N.; Bilgiç, B.E. Effects of Prunus spinosa L. fruits on experimental wound healing. Medeni. Med. J. 2017, 32, 152–158. [Google Scholar] [CrossRef]
- Sikora, E.; Bieniek, M.I.; Borczak, B. Composition and Antioxidant Properties of Fresh and Frozen Stored Blackthorn Fruits (Prunus spinosa L.). Acta Sci. Pol. Technol. Aliment. 2013, 12, 365–372. [Google Scholar]
- Pozzo, L.; Russo, R.; Frassinetti, S.; Vizzarri, F.; Árvay, J.; Vornoli, A.; Casamassima, D.; Palazzo, M.; Della Croce, C.M.; Longo, V. Wild Italian Prunus spinosa L. Fruit Exerts In Vitro Antimicrobial Activity and Protects Against In Vitro and In Vivo Oxidative Stress. Foods 2020, 9, 5. [Google Scholar] [CrossRef] [PubMed]
- Pinacho, R.; Cavero, R.Y.; Astiasarán, I.; Ansorena, D.; Calvo, M.I. Phenolic Compounds of Blackthorn (Prunus spinosa L.) and Influence of In Vitro Digestion on Their Antioxidant Capacity. J. Funct. Foods 2015, 19, 49–62. [Google Scholar] [CrossRef]
- Usenik, V.; Fabčič, J.; Štampar, F. Sugars, Organic Acids, Phenolic Composition and Antioxidant Activity of Sweet Cherry (Prunus avium L.). Food Chem. 2008, 107, 185–192. [Google Scholar] [CrossRef]
- Ieri, F.; Pinelli, P.; Romani, A. Simultaneous Determination of Anthocyanins, Coumarins and Phenolic Acids in Fruits, Kernels and Liqueur of Prunus mahaleb L. Food Chem. 2012, 135, 2157–2162. [Google Scholar] [CrossRef] [PubMed]
- Sabatini, L.; Fraternale, D.; Di Giacomo, B.; Mari, M.; Albertini, M.C.; Gordillo, B.; Rocchi, M.B.L.; Sisti, D.; Coppari, S.; Semprucci, F.; et al. Chemical Composition, Antioxidant, Antimicrobial and Anti-Inflammatory Activity of Prunus spinosa L. Fruit Ethanol Extract. J. Funct. Foods 2020, 67, 103885. [Google Scholar] [CrossRef]
- Aleksic, V.; Knezevic, P. Antimicrobial and Antioxidative Activity of Extracts and Essential Oils of Myrtus communis L. Microbiol. Res. 2014, 169, 240–254. [Google Scholar] [CrossRef]
- Balouiri, M.; Sadiki, M.; Ibnsouda, S.K. Methods for In Vitro Evaluating Antimicrobial Activity: A Review. J. Pharm. Anal. 2016, 6, 71–79. [Google Scholar] [CrossRef]
- Veličković, J.M.; Kostic, D.; Stojanović, G.; Mitic, S.; Mitić, M.; Randelović, S.S.; Dordević, A.S. Phenolic Composition, Antioxidant and Antimicrobial Activity of the Extracts from Prunus spinosa L. Fruit. Hem. Ind. 2014, 68, 297–303. [Google Scholar] [CrossRef]
- Naziri, E.; Nenadis, N.; Mantzouridou, F.T.; Tsimidou, M.Z. Valorization of the Major Agrifood Industrial By-Products and Waste from Central Macedonia (Greece) for the Recovery of Compounds for Food Applications. Food Res. Int. 2014, 65, 350–358. [Google Scholar] [CrossRef]
- Pappas, V.M.; Lakka, A.; Palaiogiannis, D.; Athanasiadis, V.; Bozinou, E.; Ntourtoglou, G.; Makris, D.P.; Dourtoglou, V.G.; Lalas, S.I. Optimization of Pulsed Electric Field as Standalone “Green” Extraction Procedure for the Recovery of High Value-Added Compounds from Fresh Olive Leaves. Antioxidants 2021, 10, 1554. [Google Scholar] [CrossRef]
- Athanasiadis, V.; Pappas, V.M.; Palaiogiannis, D.; Chatzimitakos, T.; Bozinou, E.; Makris, D.P.; Lalas, S.I. Pulsed Electric Field-Based Extraction of Total Polyphenols from Sideritis raiseri Using Hydroethanolic Mixtures. Oxygen 2022, 2, 91–98. [Google Scholar] [CrossRef]
- Athanasiadis, V.; Chatzimitakos, T.; Bozinou, E.; Kotsou, K.; Palaiogiannis, D.; Lalas, S.I. Optimization of Extraction Parameters for Enhanced Recovery of Bioactive Compounds from Quince Peels Using Response Surface Methodology. Foods 2023, 12, 2099. [Google Scholar] [CrossRef] [PubMed]
- Bozinou, E.; Lakka, A.; Poulianiti, K.; Lalas, S.; Makris, D.P. Cyclodextrins as High-Performance Green Co-Solvents in the Aqueous Extraction of Polyphenols and Anthocyanin Pigments from Solid Onion Waste. Eur. Food Res. Technol. 2021, 247, 2831–2845. [Google Scholar] [CrossRef]
- Athanasiadis, V.; Chatzimitakos, T.; Kotsou, K.; Palaiogiannis, D.; Bozinou, E.; Lalas, S.I. Optimization of the Extraction Parameters for the Isolation of Bioactive Compounds from Orange Peel Waste. Sustainability 2022, 14, 13926. [Google Scholar] [CrossRef]
- Chatzimitakos, T.; Athanasiadis, V.; Kotsou, K.; Palaiogiannis, D.; Bozinou, E.; Lalas, S.I. Optimized Isolation Procedure for the Extraction of Bioactive Compounds from Spent Coffee Grounds. Appl. Sci. 2023, 13, 2819. [Google Scholar] [CrossRef]
- Lakka, A.; Grigorakis, S.; Kaltsa, O.; Karageorgou, I.; Batra, G.; Bozinou, E.; Lalas, S.; Makris, D.P. The Effect of Ultrasonication Pretreatment on the Production of Polyphenol-Enriched Extracts from Moringa oleifera L. (Drumstick Tree) Using a Novel Bio-Based Deep Eutectic Solvent. Appl. Sci. 2020, 10, 220. [Google Scholar] [CrossRef]
- Tzima, K.; Kallithraka, S.; Kotseridis, Y.; Makris, D.P. A Comparative Evaluation of Aqueous Natural Organic Acid Media for the Efficient Recovery of Flavonoids from Red Grape (Vitis vinifera) Pomace. Waste Biomass Valorization 2015, 6, 391–400. [Google Scholar] [CrossRef]
- Antognoni, F.; Potente, G.; Mandrioli, R.; Angeloni, C.; Freschi, M.; Malaguti, M.; Hrelia, S.; Lugli, S.; Gennari, F.; Muzzi, E.; et al. Fruit Quality Characterization of New Sweet Cherry Cultivars as a Good Source of Bioactive Phenolic Compounds with Antioxidant and Neuroprotective Potential. Antioxidants 2020, 9, 677. [Google Scholar] [CrossRef]
- Opriş, O.; Soran, M.-L.; Lung, I.; Stegarescu, A.; Guţoiu, S.; Podea, R.; Podea, P. Optimization of Extraction Conditions of Polyphenols, Antioxidant Capacity and Sun Protection Factor from Prunus spinosa Fruits. Application in Sunscreen Formulation. J. Iran. Chem. Soc. 2021, 18, 2625–2636. [Google Scholar] [CrossRef]
- González-de-Peredo, A.V.; Vázquez-Espinosa, M.; Espada-Bellido, E.; Ferreiro-González, M.; Carrera, C.; Palma, M.; Álvarez, J.Á.; Barbero, G.F.; Ayuso, J. Optimization of Analytical Ultrasound-Assisted Methods for the Extraction of Total Phenolic Compounds and Anthocyanins from Sloes (Prunus spinosa L.). Agronomy 2020, 10, 966. [Google Scholar] [CrossRef]
- Magiera, A.; Czerwińska, M.E.; Owczarek, A.; Marchelak, A.; Granica, S.; Olszewska, M.A. Polyphenols and Maillard Reaction Products in Dried Prunus spinosa Fruits: Quality Aspects and Contribution to Anti-Inflammatory and Antioxidant Activity in Human Immune Cells Ex Vivo. Molecules 2022, 27, 3302. [Google Scholar] [CrossRef] [PubMed]
- Prvulovic, D.; Popovic, M.; Malenčić, Đ.; Ljubojevic, M.; Barac, G.; Ognjanov, V. Phenolic Content of Antioxidant Capacity of Sweet and Sour Cherries. Stud. Univ. Babeș Bolyai Chem. 2012, 57, 175–181. [Google Scholar]
- Prvulovic, D.; Popovic, M.; Malenčić, Đ.; Ljubojevic, M.; Ognjanov, V. Phenolic Compounds in Sweet Cherry (Prunus avium L.) Petioles and Their Antioxidant Properties. Res. J. Agric. Sci. 2012, 43, 198–202. [Google Scholar]
- Damar, I.; Yilmaz, E. Ultrasound-Assisted Extraction of Phenolic Compounds in Blackthorn (Prunus spinosa L.): Characterization, Antioxidant Activity and Optimization by Response Surface Methodology. J. Food Meas. Charact. 2023, 17, 1467–1479. [Google Scholar] [CrossRef]
- Blagojević, B.; Četojević-Simin, D.; Djurić, S.; Lazzara, G.; Milioto, S.; Agić, D.; Vasile, B.S.; Popović, B.M. Anthocyanins and Phenolic Acids from Prunus spinosa L. Encapsulation in Halloysite and Maltodextrin Based Carriers. Appl. Clay Sci. 2022, 222, 106489. [Google Scholar] [CrossRef]
- Popović, B.M.; Blagojević, B.; Ždero Pavlović, R.; Mićić, N.; Bijelić, S.; Bogdanović, B.; Mišan, A.; Duarte, C.M.M.; Serra, A.T. Comparison between Polyphenol Profile and Bioactive Response in Blackthorn (Prunus spinosa L.) Genotypes from North Serbia-from Raw Data to PCA Analysis. Food Chem. 2020, 302, 125373. [Google Scholar] [CrossRef]
- Gao, X.; Zhang, S.; Wang, L.; Yu, L.; Zhao, X.; Ni, H.; Wang, Y.; Wang, J.; Shan, C.; Fu, Y. Anti-Inflammatory Effects of Neochlorogenic Acid Extract from Mulberry Leaf (Morus alba L.) Against LPS-Stimulated Inflammatory Response through Mediating the AMPK/Nrf2 Signaling Pathway in A549 Cells. Molecules 2020, 25, 1385. [Google Scholar] [CrossRef]
- Li, J.; Wang, S.-P.; Wang, Y.-Q.; Shi, L.; Zhang, Z.-K.; Dong, F.; Li, H.-R.; Zhang, J.-Y.; Man, Y.-Q. Comparative Metabolism Study on Chlorogenic Acid, Cryptochlorogenic Acid and Neochlorogenic Acid Using UHPLC-Q-TOF MS Coupled with Network Pharmacology. Chin. J. Nat. Med. 2021, 19, 212–224. [Google Scholar] [CrossRef]
- Ballistreri, G.; Continella, A.; Gentile, A.; Amenta, M.; Fabroni, S.; Rapisarda, P. Fruit Quality and Bioactive Compounds Relevant to Human Health of Sweet Cherry (Prunus avium L.) Cultivars Grown in Italy. Food Chem. 2013, 140, 630–638. [Google Scholar] [CrossRef]
- Tomić, J.; Štampar, F.; Glišić, I.; Jakopič, J. Phytochemical Assessment of Plum (Prunus domestica L.) Cultivars Selected in Serbia. Food Chem. 2019, 299, 125113. [Google Scholar] [CrossRef] [PubMed]
- Yılmaz, F.M.; Karaaslan, M.; Vardin, H. Optimization of Extraction Parameters on the Isolation of Phenolic Compounds from Sour Cherry (Prunus cerasus L.) Pomace. J. Food Sci. Technol. 2015, 52, 2851–2859. [Google Scholar] [CrossRef] [PubMed]
- Crupi, P.; Genghi, R.; Antonacci, D. In-Time and in-Space Tandem Mass Spectrometry to Determine the Metabolic Profiling of Flavonoids in a Typical Sweet Cherry (Prunus avium L.) Cultivar from Southern Italy. J. Mass Spectrom. 2014, 49, 1025–1034. [Google Scholar] [CrossRef] [PubMed]
- Celik, F.; Gundogdu, M.; Alp, S.; Muradoglu, F.; Ercişli, S.; Gecer, M.K.; Canan, I. Determination of Phenolic Compounds, Antioxidant Capacity and Organic Acids Contents of Prunus domestica L., Prunus cerasifera Ehrh. and Prunus spinosa L. Fruits by HPLC. Acta Chromatogr. 2017, 29, 507–510. [Google Scholar] [CrossRef]
- Di Matteo, A.; Russo, R.; Graziani, G.; Ritieni, A.; Di Vaio, C. Characterization of Autochthonous Sweet Cherry Cultivars (Prunus avium L.) of Southern Italy for Fruit Quality, Bioactive Compounds and Antioxidant Activity. J. Sci. Food Agric. 2017, 97, 2782–2794. [Google Scholar] [CrossRef]
- Backes, E.; Leichtweis, M.G.; Pereira, C.; Carocho, M.; Barreira, J.C.M.; Kamal Genena, A.; José Baraldi, I.; Filomena Barreiro, M.; Barros, L.; Ferreira, I.C.F.R. Ficus carica L. and Prunus spinosa L. Extracts as New Anthocyanin-Based Food Colorants: A Thorough Study in Confectionery Products. Food Chem. 2020, 333, 127457. [Google Scholar] [CrossRef]
- Jagota, S.K.; Dani, H.M. A New Colorimetric Technique for the Estimation of Vitamin C Using Folin Phenol Reagent. Anal. Biochem. 1982, 127, 178–182. [Google Scholar] [CrossRef]


| Independent Variables | Code Units | Coded Variable Level | ||||
|---|---|---|---|---|---|---|
| 1 | 2 | 3 | 4 | 5 | ||
| Technique | X1 | ST 1 | PEF 2 + ST | US 3 + ST | PEF + US + ST | – |
| C (%, v/v) | X2 | 0 | 25 | 50 | 75 | 100 |
| t (min) | X3 | 30 | 60 | 90 | 120 | 150 |
| T (°C) | X4 | 20 | 35 | 50 | 65 | 80 |
| Design Point | Independent Variables | Responses | ||||||||
|---|---|---|---|---|---|---|---|---|---|---|
| X1 | X2 | X3 | X4 | Total Polyphenols (mg GAE/g) | Neochlorogenic Acid (mg/g) | Total Anthocyanins (μg CyE/g) | ||||
| Measured | Predicted | Measured | Predicted | Measured | Predicted | |||||
| 1 | 3 | 1 | 3 | 4 | 8.20 | 7.97 | 3.04 | 2.87 | 38.8 | 38.6 |
| 2 | 3 | 2 | 1 | 3 | 12.56 | 12.61 | 3.77 | 3.56 | 101.5 | 99.2 |
| 3 | 2 | 3 | 4 | 3 | 14.62 | 13.24 | 2.92 | 2.72 | 140.5 | 137.0 |
| 4 | 2 | 4 | 5 | 4 | 13.42 | 15.11 | 2.62 | 2.98 | 123.8 | 130.2 |
| 5 | 3 | 5 | 4 | 2 | 4.83 | 5.13 | 1.83 | 1.93 | 73.2 | 71.6 |
| 6 | 4 | 1 | 4 | 5 | 7.89 | 8.40 | 3.55 | 3.63 | 30.8 | 31.5 |
| 7 | 4 | 2 | 3 | 1 | 12.15 | 12.30 | 2.66 | 2.69 | 59.2 | 61.1 |
| 8 | 1 | 3 | 3 | 2 | 11.82 | 13.27 | 2.86 | 2.61 | 129.8 | 126.6 |
| 9 | 1 | 4 | 4 | 1 | 24.20 | 23.43 | 2.42 | 2.43 | 125.0 | 126.8 |
| 10 | 1 | 5 | 1 | 4 | 5.60 | 5.19 | 1.95 | 1.97 | 89.4 | 89.2 |
| 11 | 1 | 1 | 2 | 3 | 4.61 | 5.57 | 2.35 | 2.60 | 38.4 | 42.0 |
| 12 | 1 | 2 | 5 | 5 | 23.73 | 22.87 | 4.57 | 4.46 | 134.6 | 132.0 |
| 13 | 4 | 3 | 2 | 4 | 22.49 | 21.59 | 2.84 | 2.96 | 129.9 | 126.6 |
| 14 | 3 | 4 | 2 | 5 | 13.59 | 14.15 | 2.64 | 2.65 | 149.0 | 152.3 |
| 15 | 2 | 5 | 3 | 5 | 6.32 | 6.23 | 1.78 | 1.70 | 90.8 | 88.5 |
| 16 | 2 | 1 | 1 | 1 | 3.08 | 2.73 | 1.69 | 1.60 | 11.5 | 8.7 |
| 17 | 2 | 2 | 2 | 2 | 6.12 | 5.13 | 2.33 | 2.58 | 89.2 | 93.2 |
| 18 | 3 | 3 | 5 | 1 | 19.50 | 19.94 | 2.60 | 2.63 | 149.2 | 148.2 |
| 19 | 4 | 4 | 1 | 2 | 22.82 | 23.50 | 2.02 | 2.06 | 98.8 | 101.0 |
| 20 | 4 | 5 | 5 | 3 | 7.22 | 6.41 | 2.06 | 1.86 | 65.6 | 64.7 |
| Responses | Second-Order Polynomial Equations (Models) | R2 | p | Equation |
|---|---|---|---|---|
| Total polyphenols | Y = −3.2 − 2.98X1 − 3.59X2 + 12.2X3 − 0.55X4 + 2.27X12 + 0.26X22 + 1.6X32 − 0.4X42 + 0.35X1X2 − 4.27X1X3 + 1.39X1X4 − 1.25X2X3 + 1.26X2X4 − 1.68X3X4 | 0.9857 | 0.0011 | (2) |
| Neochlorogenic acid | Y = −0.69 + 0.29X1 + 2.86X2 − 1.7X3 + 1.07X4 + 0.05X12 − 0.4X22 + 0.01X32 + 0.17X42 − 0.14X1X2 + 0.19X1X3 − 0.27X1X4 + 0.29X2X3 − 0.37X2X4 + 0.03X3X4 | 0.9461 | 0.0267 | (3) |
| Total anthocyanins | Y = −110.55 + 4.07X1 + 126.57X2 + 6.67X3 + 11.21X4 − 4.63X12 − 19.43X22 + 2.55X32 + 2.21X42 + 3.54X1X2 − 0.61X1X3 + 0.89X1X4 − 1.64X2X3 − 1.49X2X4 − 4.71X3X4 | 0.9954 | <0.0001 | (4) |
| Design Point | Independent Variables | Color Coordinates | |||||
|---|---|---|---|---|---|---|---|
| X1 | X2 | X3 | X4 | L* | a* | b* | |
| 1 | 3 | 1 | 3 | 4 | 47.5 | 24.2 | 20.0 |
| 2 | 3 | 2 | 1 | 3 | 35.3 | 26.0 | 16.6 |
| 3 | 2 | 3 | 4 | 3 | 35.0 | 26.0 | 11.7 |
| 4 | 2 | 4 | 5 | 4 | 43.4 | 16.6 | 20.0 |
| 5 | 3 | 5 | 4 | 2 | 52.2 | 15.6 | 31.5 |
| 6 | 4 | 1 | 4 | 5 | 41.7 | 25.2 | 16.4 |
| 7 | 4 | 2 | 3 | 1 | 40.4 | 24.4 | 16.9 |
| 8 | 1 | 3 | 3 | 2 | 34.0 | 22.1 | 12.7 |
| 9 | 1 | 4 | 4 | 1 | 37.2 | 20.3 | 21.2 |
| 10 | 1 | 5 | 1 | 4 | 49.3 | 17.1 | 32.0 |
| 11 | 1 | 1 | 2 | 3 | 46.4 | 22.6 | 21.3 |
| 12 | 1 | 2 | 5 | 5 | 34.9 | 26.0 | 11.7 |
| 13 | 4 | 3 | 2 | 4 | 34.8 | 21.5 | 12.4 |
| 14 | 3 | 4 | 2 | 5 | 38.9 | 20.5 | 16.1 |
| 15 | 2 | 5 | 3 | 5 | 51.3 | 13.7 | 31.0 |
| 16 | 2 | 1 | 1 | 1 | 52.9 | 17.9 | 23.7 |
| 17 | 2 | 2 | 2 | 2 | 42.6 | 23.4 | 22.1 |
| 18 | 3 | 3 | 5 | 1 | 33.5 | 22.6 | 11.1 |
| 19 | 4 | 4 | 1 | 2 | 41.6 | 18.9 | 19.5 |
| 20 | 4 | 5 | 5 | 3 | 40.8 | 24.4 | 20.8 |
| Responses | Optimal Conditions | ||||
|---|---|---|---|---|---|
| Maximum Predicted Response | Technique (X1) | C (%, v/v) (X2) | t (min) (X3) | T (°C) (X4) | |
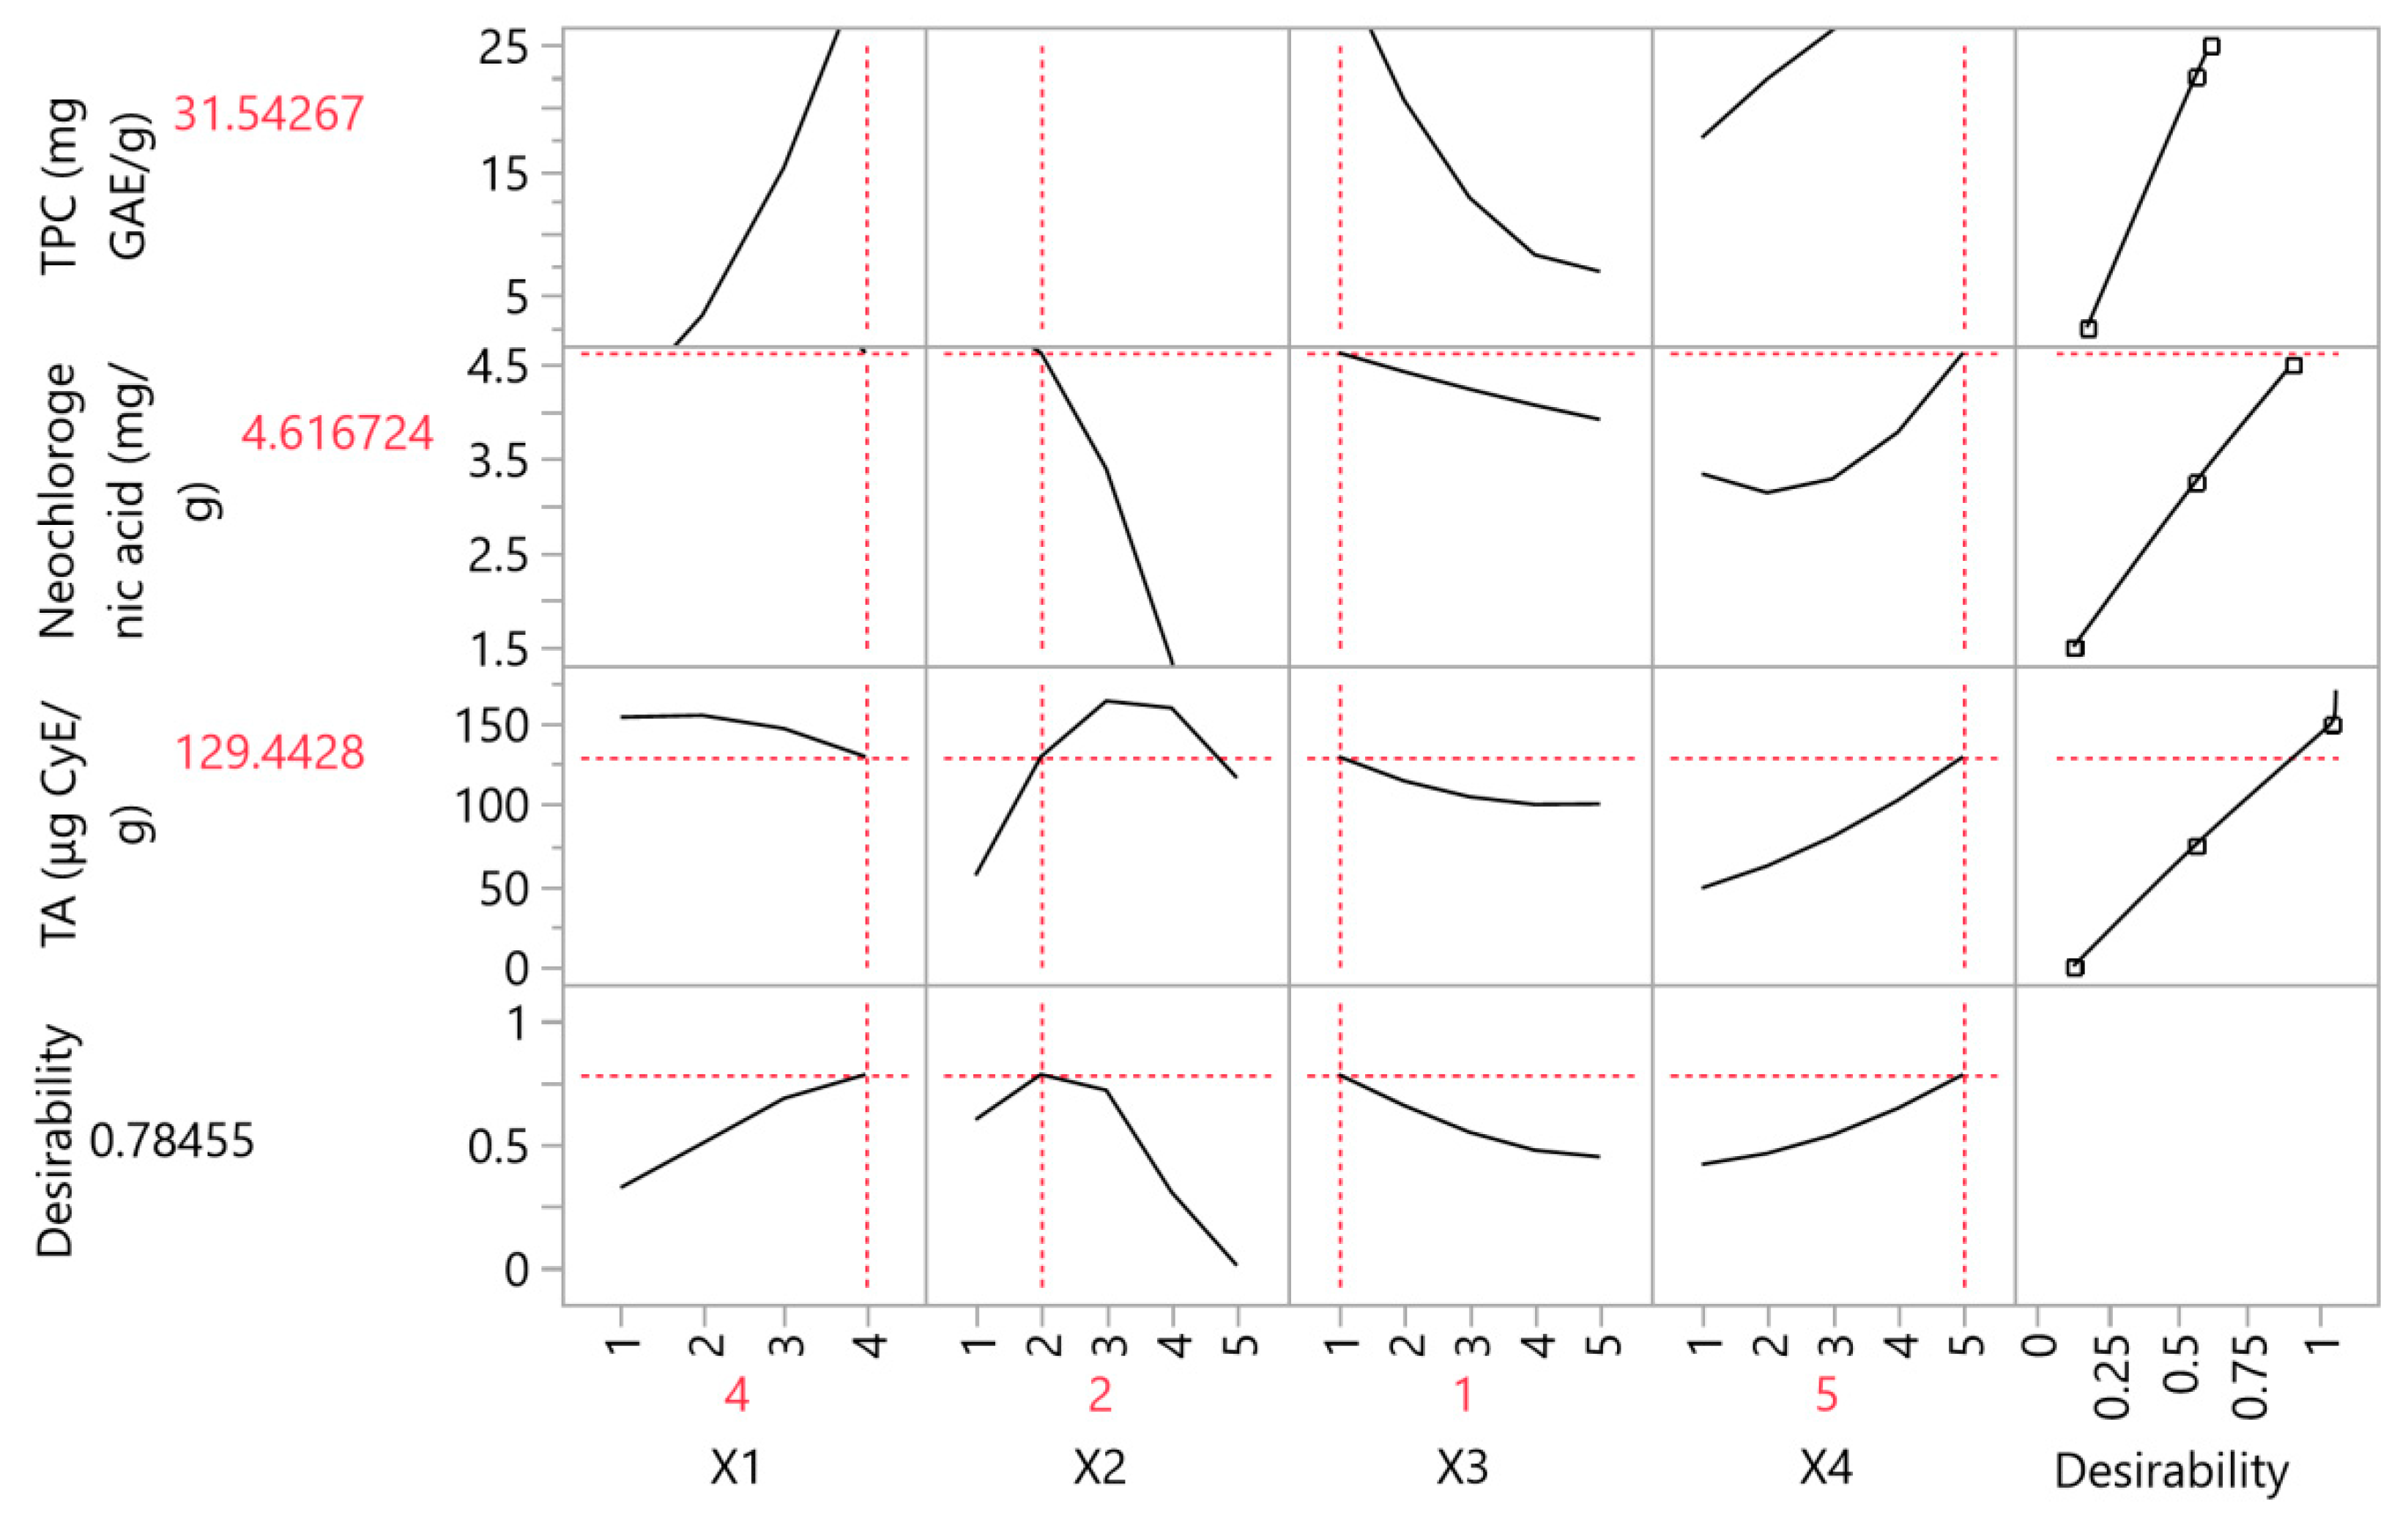
| Total polyphenols (mg GAE/g) | 23.5 ± 3.98 | PEF + US + ST (4) | 75 (4) | 30 (1) | 35 (2) |
| Neochlorogenic acid (mg/g) | 4.46 ± 0.8 | ST (1) | 25 (2) | 150 (5) | 80 (5) |
| Total anthocyanins (μg CyE/g) | 153.26 ± 13.5 | US + ST (3) | 50 (3) | 30 (1) | 65 (4) |
| Variables | PLS Model Values | Experimental Values |
|---|---|---|
| Total polyphenols (mg GAE/g) | 31.54 | 30.74 ± 1.23 |
| Neochlorogenic acid (mg/g) | 4.62 | 4.13 ± 0.08 |
| Total anthocyanins (μg CyE/g) | 129.4 | 125.2 ± 5.8 |
| Quality Parameters | Optimal Extract |
| Total flavonoids (mg RtE/g) | 3.23 ± 0.17 |
| FRAP (μmol AAE/g) | 146.09 ± 3.2 |
| DPPH (μmol DPPH/g) | 200.15 ± 6.36 |
| AAHP (μmol AAE/g) | 18.65 ± 1.58 |
| Ascorbic acid (mg/100 g) | 119.4 ± 4.63 |
| Color analysis | |
| L* | 33.4 ± 1.3 |
| a* | 23.1 ± 0.9 |
| b* | 11.9 ± 0.5 |
| Polyphenolic compounds (mg/g) | |
| Gallic acid | 0.05 ± 0 |
| Procatechuic acid | 0.03 ± 0 |
| Neochlorogenic acid | 4.13 ± 0.08 |
| Catechin | 0.39 ± 0.01 |
| Cyanidin 3-O-glucoside | 1.16 ± 0.08 |
| Delphinidin 3,5-di-O-galactoside | 0.75 ± 0.02 |
| Chlorogenic acid | 0.3 ± 0.02 |
| Delphinidin 3,5-di-O-glucoside | 0.36 ± 0.01 |
| Cyanidin 3-O-(6″-malonylglucoside) | 1.04 ± 0.06 |
| Rutin | 0.19 ± 0.01 |
| Quercetin 3-O-galactoside | 0.08 ± 0.01 |
| Quercetin 3-β-D-glucoside | 0.08 ± 0 |
| Kaempferol 3-O-β-rutinoside | 0.13 ± 0 |
| Kaempferol 3-glucoside | 0.07 ± 0 |
| SUM | 8.76 ± 0.31 |
Disclaimer/Publisher’s Note: The statements, opinions and data contained in all publications are solely those of the individual author(s) and contributor(s) and not of MDPI and/or the editor(s). MDPI and/or the editor(s) disclaim responsibility for any injury to people or property resulting from any ideas, methods, instructions or products referred to in the content. |
© 2023 by the authors. Licensee MDPI, Basel, Switzerland. This article is an open access article distributed under the terms and conditions of the Creative Commons Attribution (CC BY) license (https://creativecommons.org/licenses/by/4.0/).
Share and Cite
Kotsou, K.; Stoikou, M.; Athanasiadis, V.; Chatzimitakos, T.; Mantiniotou, M.; Sfougaris, A.I.; Lalas, S.I. Enhancing Antioxidant Properties of Prunus spinosa Fruit Extracts via Extraction Optimization. Horticulturae 2023, 9, 942. https://doi.org/10.3390/horticulturae9080942
Kotsou K, Stoikou M, Athanasiadis V, Chatzimitakos T, Mantiniotou M, Sfougaris AI, Lalas SI. Enhancing Antioxidant Properties of Prunus spinosa Fruit Extracts via Extraction Optimization. Horticulturae. 2023; 9(8):942. https://doi.org/10.3390/horticulturae9080942
Chicago/Turabian StyleKotsou, Konstantina, Magdalena Stoikou, Vassilis Athanasiadis, Theodoros Chatzimitakos, Martha Mantiniotou, Athanassios I. Sfougaris, and Stavros I. Lalas. 2023. "Enhancing Antioxidant Properties of Prunus spinosa Fruit Extracts via Extraction Optimization" Horticulturae 9, no. 8: 942. https://doi.org/10.3390/horticulturae9080942