1. Introduction
Spin-crossover solids (SCO) [
1,
2,
3] are among the most studied switchable molecular solids from the theoretical point of view. The first historical models which have been proposed to give a simplified representation of the SCO phenomenon were based on two-level approaches, like regular solutions [
4] or Ising-like [
5,
6] approaches. Although they reproduced the main features of the SCO phenomenon, like the existence of the first-order transition and its dependence with the ligand field and interaction parameters, these models remain too qualitative and do not capture the essential physical mechanism of the SCO problem. In such models, the first-order thermal transition is obtained through a phenomenological interaction parameter, electronic in nature. Consequently, they discarded the volume change accompanying the spin transition, and so the effect of stresses on the transition mechanism. At variance from these electronic models, the continuous medium model developed by Spiering [
7] showed that an elastic interaction could as well give rise to the observed first-order transitions. More recently, discrete models based on deformable lattices [
8,
9,
10,
11,
12,
13,
14,
15,
16] were introduced so as to mimic the spatio-temporal features revealed by optical microscopy investigations [
17,
18,
19] for the nucleation and growth of the spin state phases at the thermal transition of SCO single crystals. They conciliate the continuous medium and discrete lattice approaches, with purely elastic interactions, so as to reproduce both lattice and spin transformations of the system. Their relevance is established through their ability to reproduce, at least qualitatively, the said spatio-temporal effects, summarized as follows in the well-documented case of the HS → LS transition of fresh single crystals: (i) the transition usually starts from a corner or/and edge of the crystal (depending on its shape); (ii) the spin state spreads over the whole crystal with a well-defined front-line, the shape of which depends on the interplay with the edges of the crystal; (iii) the front-line propagates at a very slow velocity (≈2–10 μm/s); (iv) the presence of large mechanical stresses may lead to an irreversible damage; and (v) the presence of stresses (after thermal cycling) strongly impact the subsequent transition temperatures. By proceeding to a local analysis of the kinetics of the transformation we deduced that the nucleation and growth process at the thermal transition is a multi-scale process driven by the propagation of mechanical stresses ahead of the transformation front-line [
19]. These results pointed out the importance of the coupling between the spin state change and the local deformation of the lattice, leading to a very interesting theoretical problem in which electronic (spin) and structural (lattice parameter) degrees of freedom are strongly interlinked. Among these quoted elastic models, the electro-elastic model [
20], that we solved for several types of crystal shapes [
21,
22,
23] has proved its consistency in describing the interplay between the spin state propagation and the macroscopic lattice deformation. It is extended, here, in the present work to include the effect of a defect, which is in practice a hole, injected in the 2D square lattice. Our motivation is to study the impact of the presence of such defect on the nucleation, propagation of the LS fraction during the relaxation of the HS metastable state at low-temperature; a situation which mimics that of the relaxation of the photo-induced HS state after LIESST (Light-Induced Excited Spin State Trapping) effect [
24]. For so doing, two situations are investigated: (i) the perfect rectangular lattice; and (ii) and a lattice with a structural defect, which is simply modeled by a hole located in the center. The paper is organized as follows: in
Section 2, the model and simulation method are described;
Section 3 is devoted to the results of the model (thermal hysteresis and relaxation of the HS fraction at low temperature) with a focus on the atomic displacements and the propagation of mechanical stresses in the presence of a defect; in
Section 4 we summarize the main conclusions and outline some possible developments of the model.
2. The Model
We consider an electro-elastic model which mimics the spin-crossover transition, for which we have already discussed some of its thermodynamic properties in recent works [
19,
21]. This model is based on two-states fictitious spins,
and
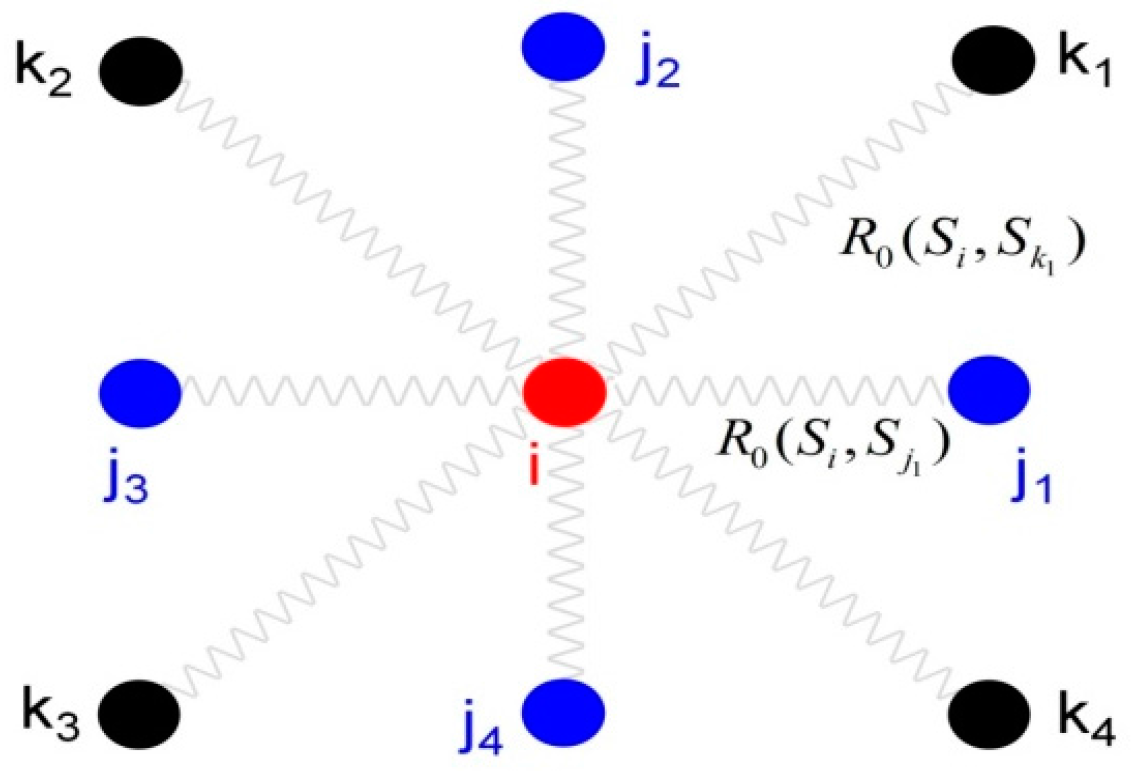
, respectively associated with the HS and LS states of the molecule. The molecules (here, the sites) interact via elastic springs, as depicted in
Figure 1.
The elastic constant and the equilibrium distances between the sites, depend on the connected spin states, so that the Hamiltonian of the system writes as:
The first term of Equation (1) is the energy gap separating the LS and HS states of an isolated molecule. It contains an energy contribution, Δ, arising from the difference of ligand fields in the HS and LS states, and the entropic contribution, resulting from the electro-vibrational degeneracy ratio, g , between the HS and LS states. The second and third terms of Equation (1) account for elastic interactions, between nearest- (nn) and next-nearest-neighbors (nnn) of spin-crossover units.
The quantity (resp. represents the equilibrium distance between the nn sites i and j (respectively, i and k), connected by a spring, whose elastic constant is A (resp. B). Therefore, the elastic contribution, of Equation (1) describes the energy cost of the “bond length”, , when its value is different from its ideal value .
Let us denote by,
,
and
, the respective nn distances between two HS-HS, HS-LS, and LS-LS neighboring SCO molecules. In addition, let us consider that,
. The general expression of the equilibrium distance,
can be expressed as:
where:
According to these expressions, we then have: , , and
Let us discuss now the structure of Equation (1) to get some analytical predictions. Inserting expression of Equation (2a) in Equation (1) and after some simple mathematical developments, we arrive to the following effective compressible Ising-like Hamiltonian with local, exchange-like interaction
J, and local field-like
:
where nnn stands for the next-nearest-neighbor contributions, which are not written here for simplicity reasons, but which are included in the simulations.
In Equation (3),
J and
are given by:
where
. In Equation (4), the index
j runs over the neighbors of the site
i and
(=
for a 2D square lattice) is the coordination number.
Equations (3) and (4) offer an interesting perspective. Indeed, Equation (1) reduces to a generalized Ising-like model written on an elastic lattice and accounting for elastic interactions. The third term is the elastic energy of an effective lattice, having an average lattice parameter equal to
. The effective spin-spin interaction
J > 0, which has a short-range anti-ferro nature, is now proportional to the elastic energy related to the misfit of lattice parameters between the LS and HS phases, and the new effective ligand-field,
, includes now the elastic field contribution,
, which clearly stabilizes the HS state and, hence, renormalizes the ligand-field
As a result, Equation (3) defines an extended Ising-like model including the volume change accompanying the spin transition phenomenon; a contribution which was absent in the original Ising-like model [
25]. Furthermore, it is worth noticing that this model generates naturally short- and long-range interactions. The short-range interactions arise from the spin-spin interaction term,
, while the long-range interactions [
8] are due to the effective local ligand-field
(Equation (4)) which depends on the lattice distortions.
The main thermodynamic properties of this generalized Ising-like model accounting for elastic interactions can be summarized as follows: (i) the transition temperature,
, is found as a temperature for which the average value of the effective field-like,
, is equal to zero (
and
) which gives:
(ii) the system undergoes a first-order transition from some critical value of the elastic energy
. For a deeper analysis of the phase diagram of the present model, the reader can refer to [
17].
Buoyed by these first results, we attack now the solution of Equation (1) using Monte Carlo (MC) simulations. All simulations presented in this work are obtained from the study of the general Equation (1). We have used the following realistic parameter values in our simulations: K for the ligand field energy, , for the degeneracy ratio, nm, nm, nm for the equilibrium nn distances (lattice parameters). The equilibrium distances of nnn distances have been taken equal to those of the nn multiplied by , owing to the adopted 2D square lattice symmetry. The elastic constant are chosen equal to K∙nm−2.
Within these parameter values, we have estimated the bulk modulus value, as ~ GPa, and the equilibrium temperature, K.
In the present work we are interested in the study of the nucleation and growth processes of the spin transition at the thermal transition on one hand, and in the relaxation of the photo-induced HS metastable state on the other hand. These phenomena will be investigated in a 2D rectangular (i) perfect lattice (without defects) and (ii) in a similar lattice in which we inject a structural defect (a hole). The goal here is to study the effect of the presence of such a defect on the electro-elastic properties of the spin transition, for both equilibrium and non-equilibrium aspects.
3. Results and Discussion
First, we investigate the thermal properties of a planar rectangular lattice with particles with free boundary conditions. The temperature was increased from T = 1 K to 200 K, and then decreased to 1 K, by 1 K increments.
The MC procedure is performed on spins variables and atomic positions as follows: we chose randomly an atom and flip its spin state using the usual MC Metropolis algorithm. In any case (spin flip accepted or rejected), we visit randomly and sequentially the whole lattice sites and attempt to move each site by
nm in randomly chosen direction. If the new position is permitted by the usual Monte Carlo Metropolis algorithm, then we update the position of the atom; if it is forbidden, the atom is left in its original position. Then, we chose randomly a new site for which we perform the same procedure. The algorithm of relaxation of all lattice positions is repeated 10 times, for each spin flip, to reach the stable mechanical state. Next, we update each of the
spins, using the same procedure. We define the single MC step (MCS) as the time for which we have visited all the spins one time. So, in 1 MCS, each atomic positions has been updated 12,000 times. To reach the thermal equilibrium, the ”spin-lattice MCS”—was repeated 2.0 × 10
3 times at each temperature. The first 10
3 times were used for reaching equilibrium of the system, and the second 10
3 ones for the statistical analysis of the physical quantities of interest. The average properties of the system, HS fraction,
, and the average value of the nn lattice parameter distance,
are, respectively, defined as:
where
and
are the coordinates of the molecules at sites
i and
j which, respectively, run over
and
. The results of the simulations on a perfect lattice (without structure) are shown in
Figure 2.
3.1. Effect of the Presence of a Macroscopic Defect
Now, we insert a “circular” defect (here, a hole) of radius
unit cells in the rectangular lattice. For simplicity reasons, we locate the hole in the center of the lattice, as shown in
Figure 3. However, it should be mentioned that due to the discrete nature of the lattice the “circular” hole does not appear as circular, but rather as a rectangle.
MC simulations are then performed on this lattice with defect, for which we calculated the thermal dependence of the HS fraction, and followed the spatiotemporal features of the spin state nucleation along the heating and cooling branches of the thermal hysteresis. The results are summarized in
Figure 3, in which we have included the thermal hysteresis of the perfect lattice (without defect) in blue and that of the lattice with a defect in green. The results clearly show that the width (
K) of the thermal hysteresis of the initial perfect lattice is significantly reduced (
K) by
K, and almost with the same quantity for the cooling and heating branches. Furthermore, one can easily remark that the transition temperature, which is considered to be located around the center of the thermal hysteresis (a rough approximation), remains unchanged. These facts allow one to state that the hole does not create any additional pressure on the lattice, because the pressure usually shifts the thermal hysteresis at high temperature, due to the stabilization of the LS state. The presence of the hole acts, then, exclusively on the propagation of the elastic interactions. Since the elastic interactions are ferro-elastic at long-range order, the presence of the hole cuts their propagation, which results in their weakening. This situation is then very interesting, since it allows to control the strength of the interactions in the lattice without any effect on the transition temperature. In the inset of
Figure 3, we depict the spatial distribution of the HS and LS sites for some chosen temperatures. There we see that the thermal transformation on cooling induces the formation of macroscopic LS domains, starting from both opposite borders of the lattice, and propagating towards the defect. A similar situation is also obtained on heating, with however stronger HS/LS fluctuations around the defect region. This small difference is mainly due to the difference of temperatures at which these snapshots have been recorded.
3.2. Relaxation of the HS State at Low Temperature
In the second part of this
Section 3, we study the relaxation of the metastable HS state at low-temperature, with the aim to simulate the relaxation properties of the photo-induced HS metastable state. The calculations are made at
T = 10 K. For so doing, we prepare all sites in the HS state, by initializing all spin values at
and all nn distances
nm. We then perform MC simulations on the spin states and the lattice positions. After each MC step, we measure the average value of the HS fraction and that of the average nn distance.
3.2.1. Case of the Perfect Lattice
Figure 4 illustrates the temporal dependence of the HS fraction during the relaxation from saturated HS state at 10 K. The shape of the relaxation curves shows the existence of four regimes. To facilitate the understanding of the relaxation mechanism, we depicted in
Figure 5, some selected snapshots showing the spatiotemporal behavior of the electronic and structural degrees of freedom of the lattice. The first regime I, for which
is the incubation regime. There, the HS fraction is almost constant, but the lattice positions perform small motions, which constitute a precursor regime for the next regime, II. In this second regime, starting after 3000 MC steps, the HS fraction decreases abruptly until point C. According to the snapshot B of
Figure 5, this region corresponds to the lateral growth of the macroscopic LS phase, whose propagation is enhanced by the proximity of the border, which helps in relaxing the elastic strain at the HS/LS interface. From
MCS–
MCS, the transformation rate of the HS phase slows down, and the HS fraction evolves almost linearly on time, as seen in
Figure 4. Two lattice snapshots, C and D of
Figure 5 show that this region corresponds to the longitudinal propagation of the HS/LS interface, with a spatially irregular, but quite stable, interface shape. Snapshots C and D also show the macroscopic lattice deformation accompanying this front propagation, resulting from the interplay between the electronic (spin) and structural degrees of freedom. The linear character of the curve
in this region, means that the velocity of the front propagation (which is proportional to
) is constant. This region persists until
MCS, where an avalanche phenomenon is observed, leading to suddenly accelerate the relaxation of the HS fraction towards the LS state. Point E in
Figure 4 is chosen in this region and the corresponding lattice configuration is shown in the panel E of
Figure 5. In fact, this abrupt acceleration of
is due to the proximity of the border (surface) of the lattice. Indeed, when the elastic interface approaches the lattice border, it “feels” the surface which enhances the relaxation of the elastic strain around and ahead the front interface. This pure mechanical effect affects the spin state to which it is coupled via the elastic field (see contribution
in Equation (3)) which results in a local increase of the effective ligand field in favor of the LS state. It is interesting to notice here that optical microscopy experiments [
20,
26] often lead to the observation of such accelerations in the end of the interface propagation mechanism, which usually end by a macroscopic motion of the crystal due to the release of elastic strain, generated by the presence of the HS/LS interface.
Let us briefly re-examine the pattern formation during this isothermal relaxation and comment the snapshots of electro-elastic configurations shown in
Figure 5. First of all, it is interesting to notice that the transformation, triggered by a stochastic incubation, starts at the corner of the lattice (snapshot B), which constitutes a fragile point from which the nucleation can take place. Snapshot B also shows that the interface shape, in this regime, is circular or more precisely curved. This is due to the border effects which impose very strong boundary conditions and to the lattice deformation at the surface. Thus, if the distortion of the lattice is very weak (case of
), the HS/LS interface should be exactly circular. When the interface reaches the lateral border of the lattice, it starts to propagate along the longitudinal direction of the crystal. Snapshots C and D depict this situation. Usually this regime is a kind of a cruise climb process in which the elastic energy is constant. In the last regime (snapshot F), a large part of the lattice is already transformed into LS spin, and the remained HS domain relaxes like an avalanche to the LS state (see the corresponding sigmoidal shape of the relaxation curve in
Figure 4).
3.2.2. Effect of the Hole
Now we study the previous phenomenon for the lattice with defect and compare the obtained results for the two situations. At this end, all physical parameters are kept the same as those of the previous figures.
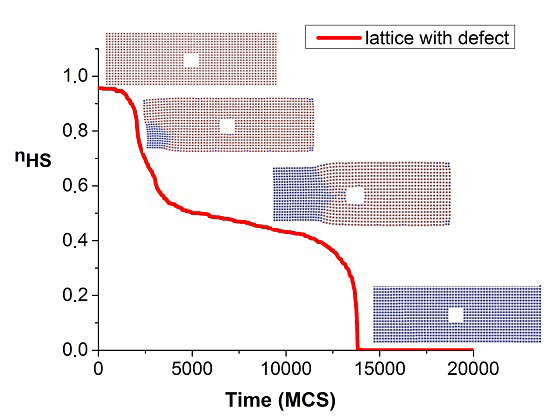
Figure 6 shows the temporal evolution of the metastable HS fraction of the lattice with a hole or a defect (red curve) during the HS to LS relaxation at 10 K. The results obtained for the perfect lattice are included here (blue curve) for comparison. Several differences can be noted between the two curves. First of all, the lifetime of the metastable HS state is clearly longer (~14,000 MCS) for the lattice with defect than for the perfect one (~11,000 MCS). The incubation period (that is the region where
) is, in contrast, much shorter for the lattice with a defect, although transverse movement (points B and C) of the interface along the
Y axis seems to take place in the same time period. The most important difference arises from the existence of a clear plateau during the longitudinal motion of the interface of the lattice with defect, while it is smeared in the blue curve. This means that the propagation of the elastic LS/HS interface is significantly slowed down by the presence of the hole. Indeed, by comparing the slopes of the blue and red curves in this region, we found that the interface propagates with a velocity 4.5 times smaller in the lattice with a hole. Thus, the hole hinders the front propagation.
The spatiotemporal features of the spin and structural transformations during the thermal relaxation of the lattice with defect are presented in
Figure 7. The results will be discussed in relation with the energetic aspects of this transformation. At this end, we have calculated the total elastic energy of the lattice for both cases (perfect lattice and lattice with defect) during the front propagation, whose results are summarized in
Figure 8.
Figure 7, depicting the lattice with defect transformation, gives evidence for a domain growth process starting from the corners as in
Figure 5 (see panel B). However, snapshots B in both figures show clearly that the shape of the interface even in this first process is different. While it is more or less circular or curved in
Figure 5, it becomes more irregular in
Figure 7. Snapshot C, shows the growing interface towards the center of the crystal with a net distortion of the interface region that faces the hole position. This behavior is reminiscent of experimental observations [
19,
20] obtained by optical microscopy, where we have seen that near the defects the interface is deformed and trapped for a while. At point D of
Figure 6, the HS/LS interface, given in the corresponding snapshot D (
Figure 7), is pinned by the defect. This can be explained by the fact that the hole plays the role of an extra surface, which relaxes the strain around it. This dampens the propagation of the elastic interface which should circumvent it. The relaxation restarts again thanks to the transformation of the HS phase situated from the other side of the hole, as seen in panels D and E of
Figure 7. Interestingly, we notice in the last regime, that due to the slowness of the regimes C–F, the nucleation could take place form the other corners, leading to the emergence of a second interface from the right tip of the lattice (see snapshot G). This phenomenon explains the acceleration of the interface speed in the region F–G (red curve) of
Figure 6.
Now, we discuss the energetic aspects of this transformation. The total elastic energies of the perfect lattice (in blue) and with defect (in red) during the HS to LS relaxation are presented in
Figure 8. First, all temporal regimes, discussed above, can be easily identified in these curves. The blue curve, corresponding to the results of
Figure 4 and
Figure 5, shows that elastic energy is almost constant during the longitudinal regime of the front propagation. This is an important observation, because it constitutes the physical origin of the obtained constant velocity of the interface propagation. The comparison between the elastic energies of the two lattices, shows that in the regions where the HS/LS interface is formed (
MCS), the elastic energy is smaller for the lattice with a hole. However, the latter drastically increases around
MCS, but this behavior is due to the emergence of the new interface from the right border (snapshot G in
Figure 7). The interaction between the two front interfaces creates an energy excess in the lattice, which relaxes later around
MCS.


