Article

Investigating Size- and Temperature-Dependent Coercivity and Saturation Magnetization in PEG Coated Fe3O4 Nanoparticles

1
Department of Physics, United Arab Emirates University, Al-Ain 15551, United Arab Emirates
2
Max-Planck-Institute for Chemical Physics of Solids, Nöthnitzer Straße-40, 01187 Dresden, Germany
3
Surface Physics and Material Science Division, Saha Institute of Nuclear Physics, HBNI, 1/AF Bidhannagar, Kolkata 700064, India
4
Department of Physics, Indian Institute of Technology Madras, Chennai 600036, India
*
Author to whom correspondence should be addressed.
Magnetochemistry 2017, 3(2), 19; https://doi.org/10.3390/magnetochemistry3020019
Submission received: 25 April 2017 / Revised: 8 May 2017 / Accepted: 11 May 2017 / Published: 20 May 2017

Abstract

:
Polyethylene glycol (PEG) coated magnetic Fe3O4 nanoparticles with diameters of 12 nm, 15 nm, and 16 nm were synthesized by the usual co-precipitation method. The structure and morphology of the samples were characterized using X-ray diffraction (XRD) and high resolution transmission electron microscopy (HRTEM). The ac magnetic susceptibility measurements were carried out using a vibrating sample magnetometer (VSM). The dc magnetic measurements were carried out using a commercial Quantum Design superconducting quantum interference device (SQUID). The XRD patterns indicated the sole existence of the inverse cubic spinel phase of Fe3O4 in all the samples. The histograms extracted from the TEM images show narrow size distributions with average sizes that are very similar to those obtained from the XRD images using the Scherrer’s formula. The temperature dependence of both coercivity and saturation magnetization, which were determined from the magnetic hysteresis loops, were found to have considerable deviations from the Bloch’s and Kneller’s laws. The size-dependent coercivity and saturation magnetization were found to be non-monotonic at nearly all temperatures. These results are discussed and attributed mainly to the finite size effects in addition to the existence of inter-particle interactions and of spin-glass structures that resulted from frozen canted surface spins at low temperatures.
PACS/MSC/JEL Classification:
61.46.+w; 75.50.−y; 75.47.Lx

1. Introduction

Fe3O4 magnetic nanoparticles have attracted the attention of the researchers in various fields such as physics, medicine, and biology due to their multifunctional properties such as small size, superparamagnetism, low toxicity, etc. [1,2,3,4,5,6,7,8,9]. However, one of the major drawbacks of these Fe3O4 nanoparticles was their general tendency to aggregate due to strong magnetic dipole-dipole attractions between particles. In biomedical applications, the nanoparticle (NP) suspension may be delivered to the site of application intravenously or by a direct localized injection method. Both of these methods require agglomeration free nanoparticles which cannot inhibit their own distribution. This restriction can be overcome either by reducing the size of the NPs or by modifying their surface chemistry. The surface modification of nanoparticles with various biocompatible and biodegradable high molecular weight polymers [10,11] has the most direct effect of increasing the hydrodynamic size of the particles, modifying their transport and biodistribution properties. Coatings can also aid the colloidal stability of the particles against aggregation and gravitational settling by reducing the inter-particle dipole-dipole interactions [12,13,14,15,16,17]. Common coatings are; derivatives of dextran [18,19], polyvinyl alcohol (PVA), Polyethylene glycol (PEG), some nonpolymeric coatings, etc. [20]. The stability of the coated particles relies on the strength of the bond between the core and coating.
In this work, we synthesized PEG-coated Fe3O4 nanoparticles with different sizes. The PEG coating minimizes dipolar interactions and hence prevents nanoparticles from agglomeration and makes them more biocompatible [21]. In spite of several reports on the magnetic properties of these functionalized materials, there is still much scopes available to study the detailed magnetic properties in this system [22,23,24]. Size- and temperature-dependent magnetic properties are essential information in the field of magnetism of nanoparticles. Knowledge about these two important issues will significantly advance the application of magnetic particles in ultrahigh-density magnetic storage devices and in medical applications, such as magnetic resonance imaging and local magnetic hyperthermia. In this work we have studied the temperature- and size-dependent coercivity and saturation magnetization of PEG-coated Fe3O4 nanoparticles with different sizes.

2. Materials and Methods

We synthesized PEG functional iron oxide (Fe3O4) nanoparticles by the usual co-precipitation method. FeCl3·6H2O (0.1 M) and FeCl2·4H2O (0.05 M) were used as the initial materials. The precursor materials were dissolved in deionized water separately and mixed at room temperature. Ammonium hydroxide solution (25%) was quickly added to the mixture. A 25% NH4OH solution was continuously added drop by drop until the pH was 10. The mixed solution was stirred for 30 min. The reaction time was controlled at 1 h, 3 h, and 5 h to obtain different size nanoparticles. Finally, the Fe3O4 nanoparticles were collected by magnetic field separation and washed properly. The final precipitation was collected and dried at 40 °C in vacuum. The PEG solutions with commensurate concentrations were prepared by dissolving PEG powder in distilled water. Stoichiometric amounts of water and Fe3O4 nanoparticles were vigorously stirred for 15 min. Afterwards, the PEG-solution was added to the suspension and stirred for 30 min. The mixture was centrifuged at 6000 rpm to obtain a stable ferrofluid. Finally, it was collected and dried overnight in vacuum. The samples which were made with reaction times of 1 h, 2 h, and 5 h were named S1, S2, and S3, respectively. The X-ray diffraction patterns were recorded by a SHI-MADZU Lab (Kyoto, Japan) X-XRD-6100 with CuKα (λ = 1.5418 A°) diffractometer. The transmission electron microscopy (TEM) measurement was done using an FEI, TECNAI G2 F30, S-TWIN microscope operating at 300 kV equipped with a GATAN Orius SC1000B CCD camera (GG Eindhoven, The Netherlands). The dc magnetic measurements were carried out using a commercial Quantum Design superconducting quantum interference device (SQUID), (San Diego, CA, USA). The ac magnetic susceptibility measurements were carried out using a vibrating sample magnetometer (VSM) from Quantum Design. To confirm the PEG coatings, Fourier transform infrared spectra (FTIR) analysis was carried out by the potassium bromide pellet method in Bruker, Ettlingen, Germany in the range from 400–4000 cm−1. The colloidal stability of these nanoparticles was probed by measuring zeta potential (ZP) using a Zetasizer (Nano-ZS90, Malvern, UK). Zero-field-cooled magnetic hysteresis measurements were conducted at several temperatures in the temperature range from 2 to 300 K while the magnetic fields was varied from −3 T to +3 T. Zero-field-cooled and field-cooled temperature-dependent magnetization measurements were conducted on all the samples at 20 Oe in the temperature range from 2 to 300 K.

3. Results and Discussion

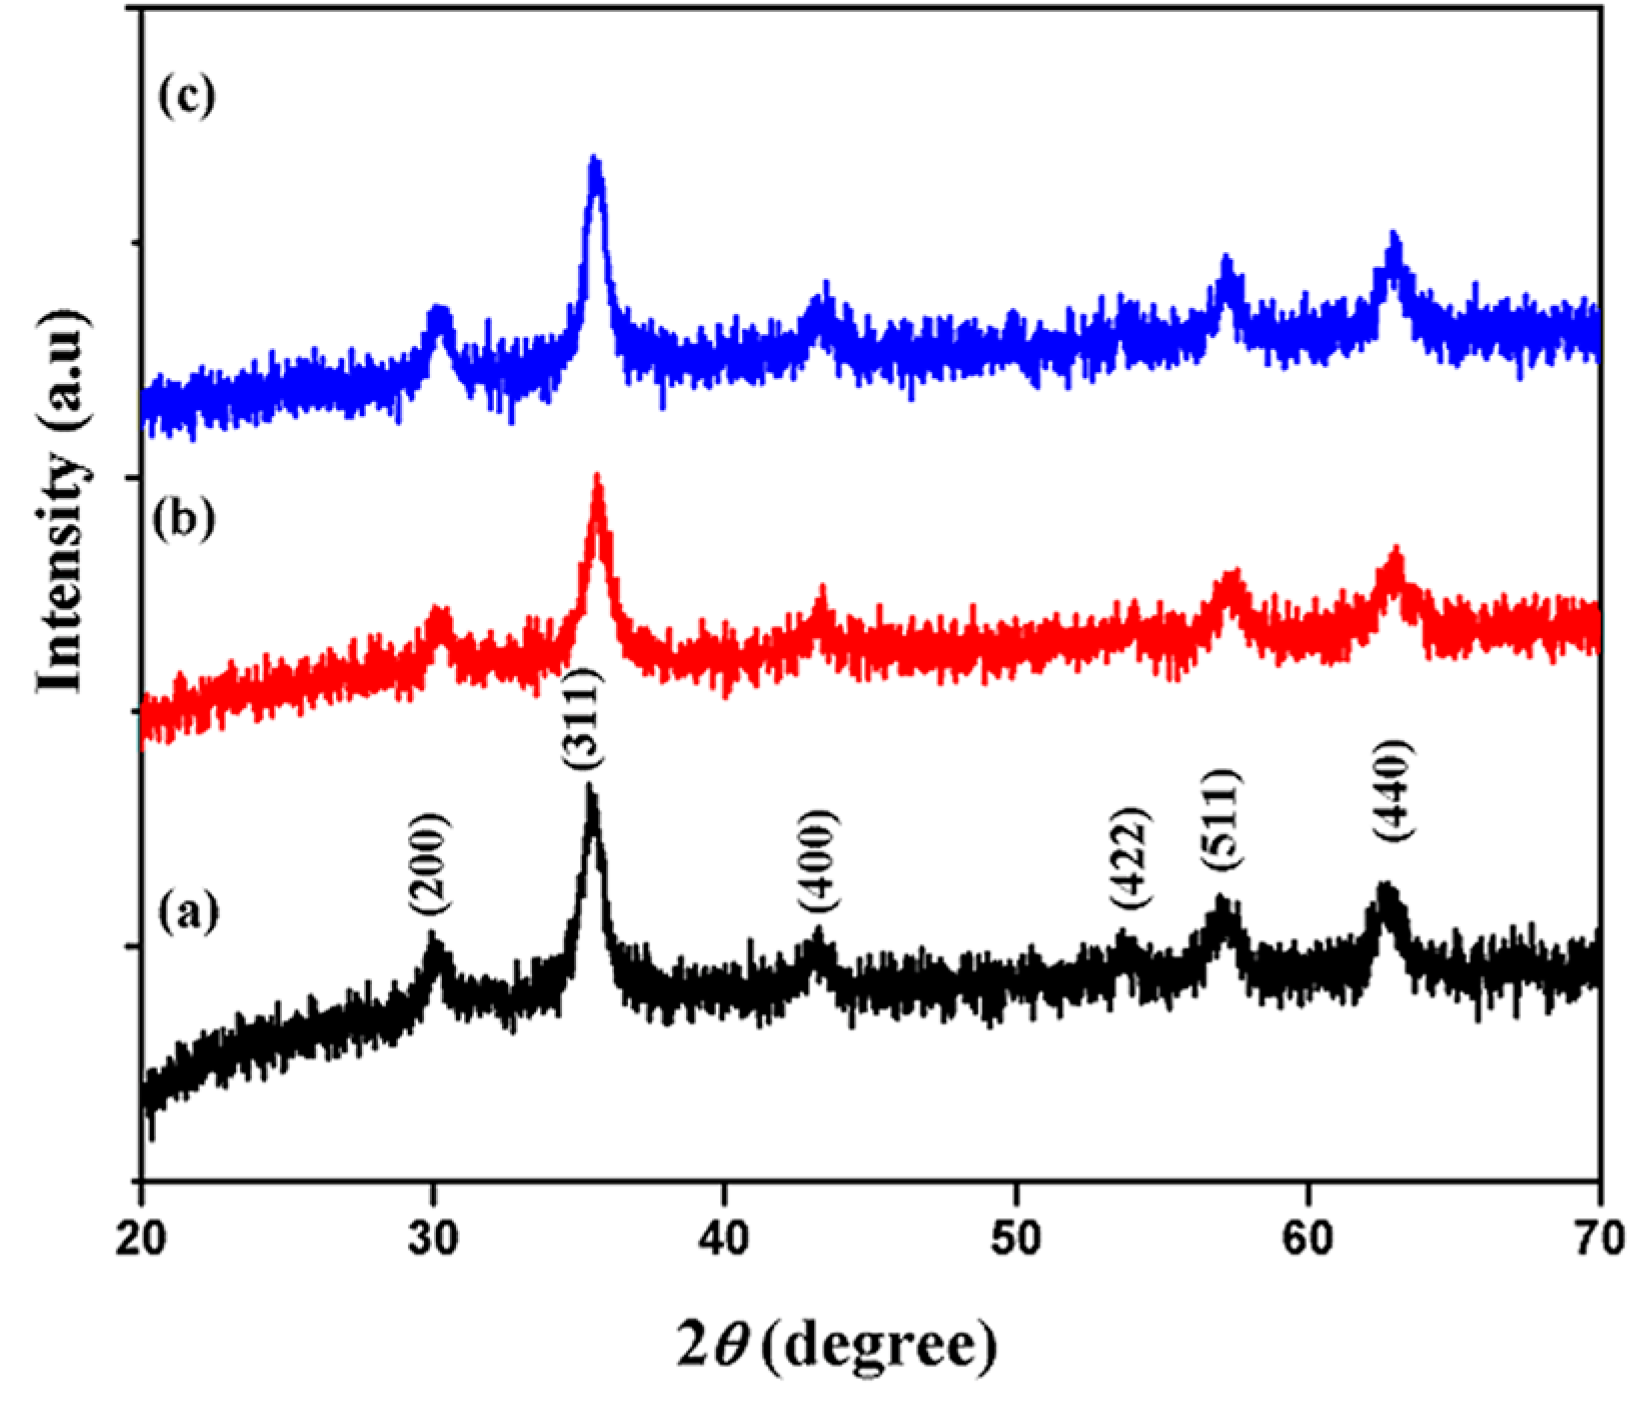
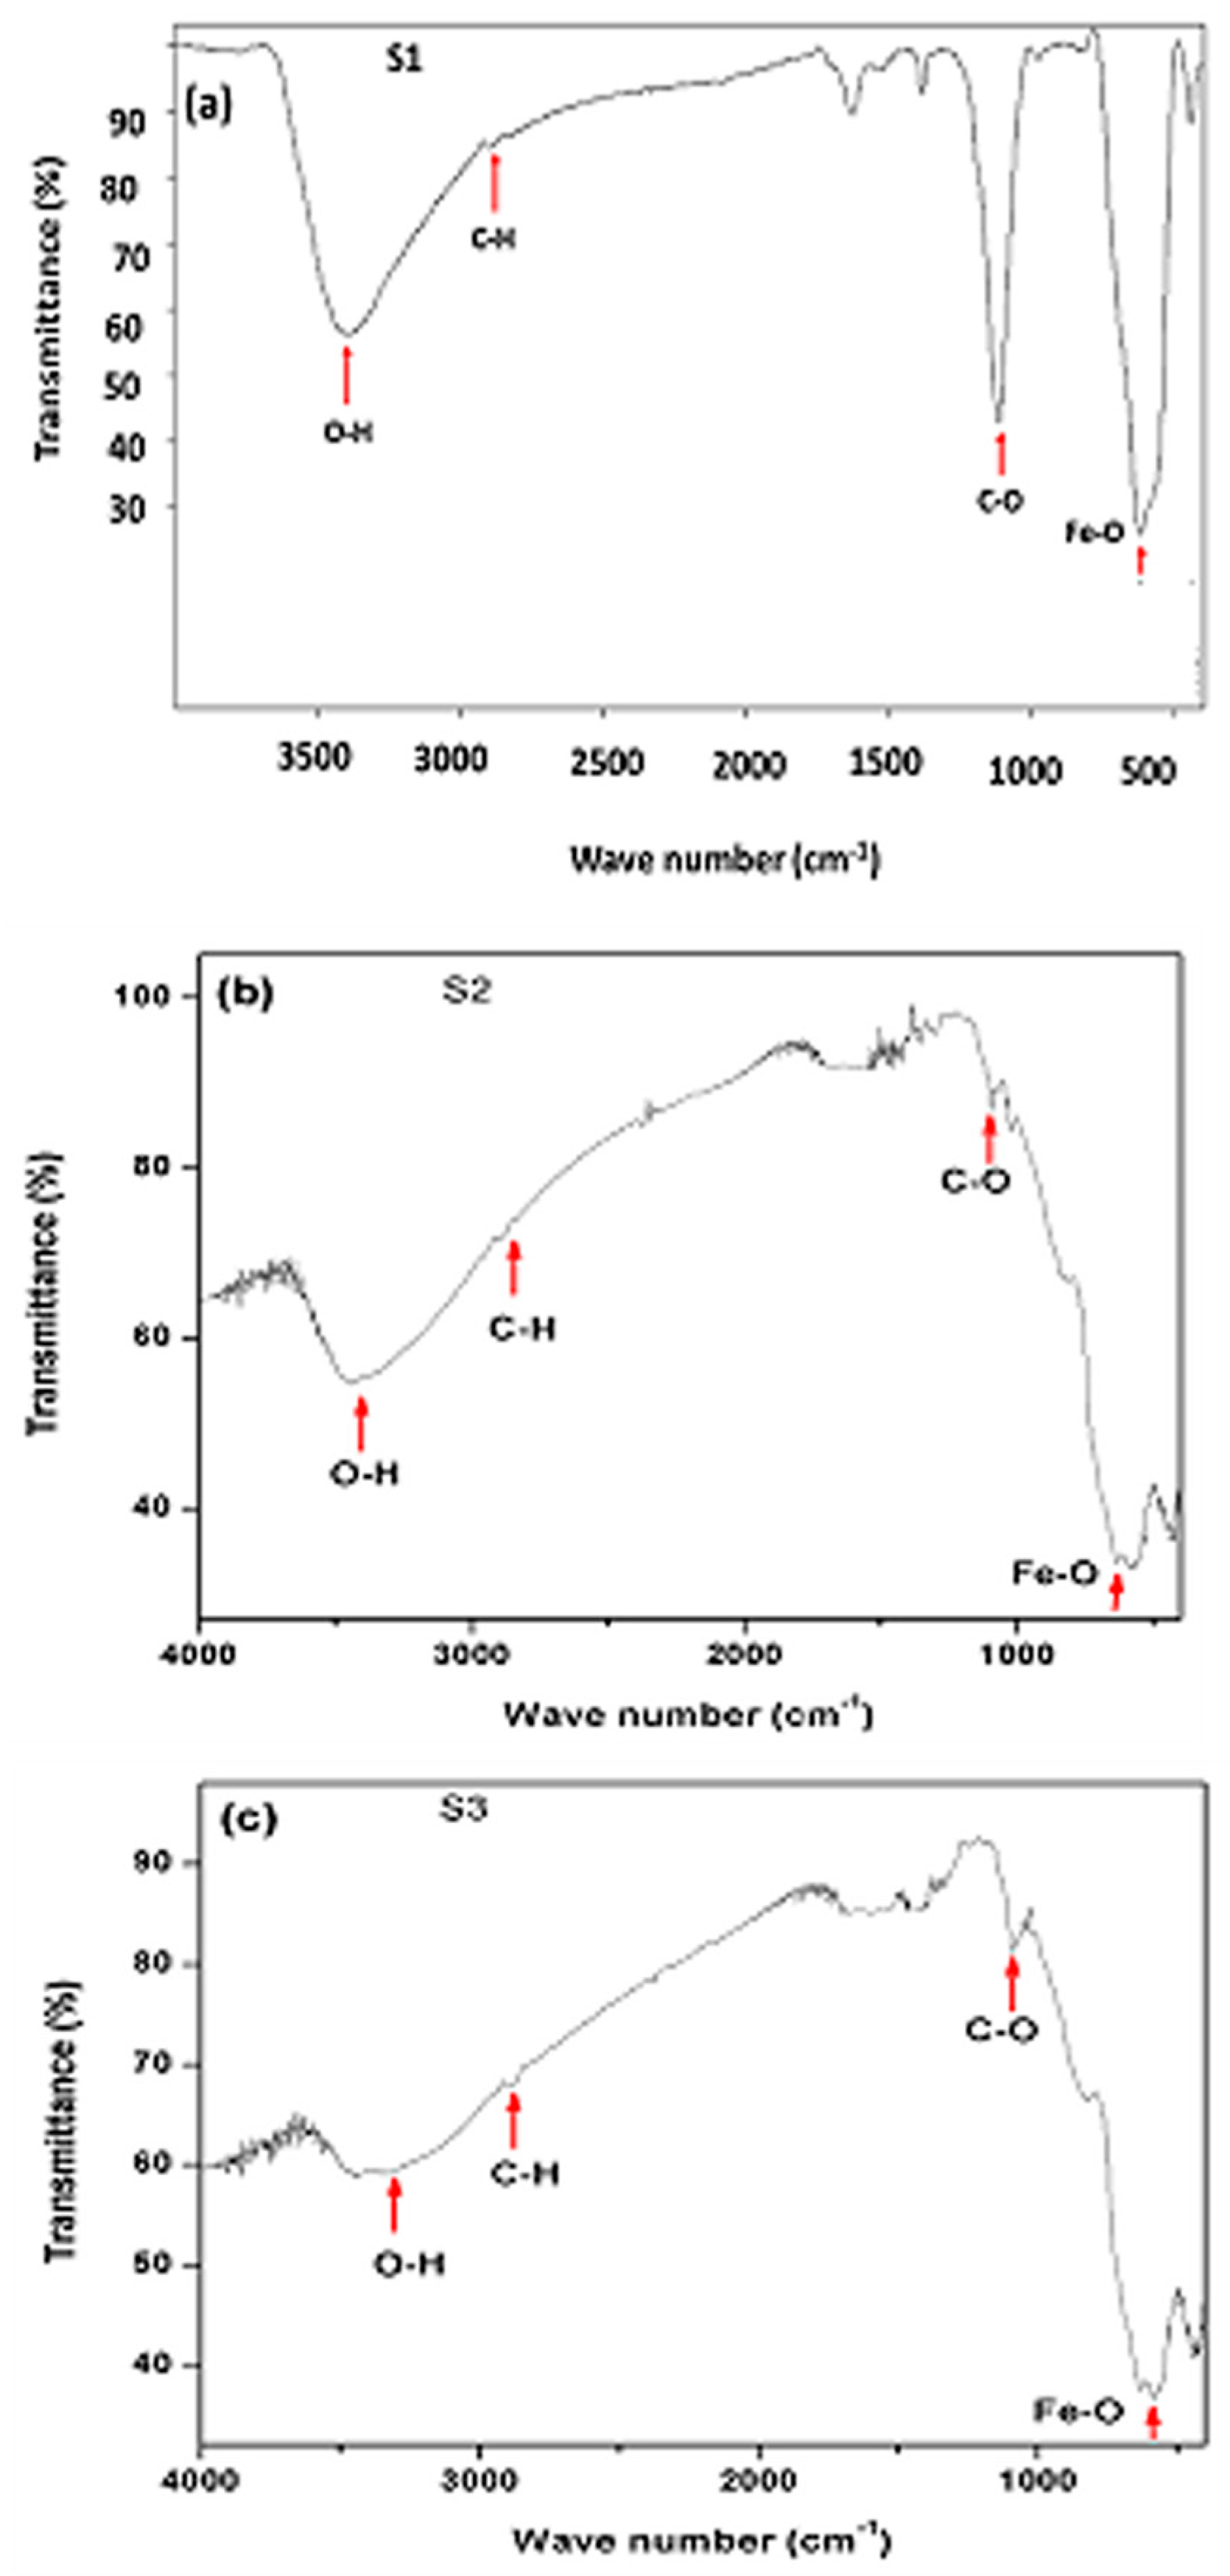
3.1. Structural and Phase Analysis

Figure 1 shows the X-ray diffraction patterns of the PEG-coated Fe3O4 nanoparticles. The XRD peaks of the Fe3O4 were compared with the standard Joint Committee on Powder Diffraction Standards (JCPDS) file (PDF No. 65-3107). The phase purity of the samples was ascertained by X-ray diffraction analysis. The XRD plot was taken for 2θ ranging from 20° to 70°. All the XRD peaks were indexed to Fe3O4 and we did not observe any signature of secondary phases, confirming the phase purity. The characteristic peaks at 2θ = 30.1°, 35.4°, 43.3°, 53.6°, 57.2°, and 62.7°, were attributed to (220), (311), (400), (422), (511), and (440) Bragg reflections of magnetite (Fe3O4) XRD patterns. The preponderance of the amorphous phase of PEG indicates that the crystalline behavior of Fe3O4 was suppressed due to the presence of PEG. Note that the Fe3O4 nanoparticles had a cubic spinel structure. The average particle size was inferred from the XRD by using Scherrer’s formula; D P = 0.94 λ β   cos θ where D P is the average crystallite size, λ is the X-ray wavelength, β is the full width of half maximum (FWHM) of the XRD line, and θ is the Bragg’s angle. The average particle sizes calculated using Scherrer’s formula were 12 nm, 15 nm, and 16 nm, for samples S1, S2, and S3, respectively.

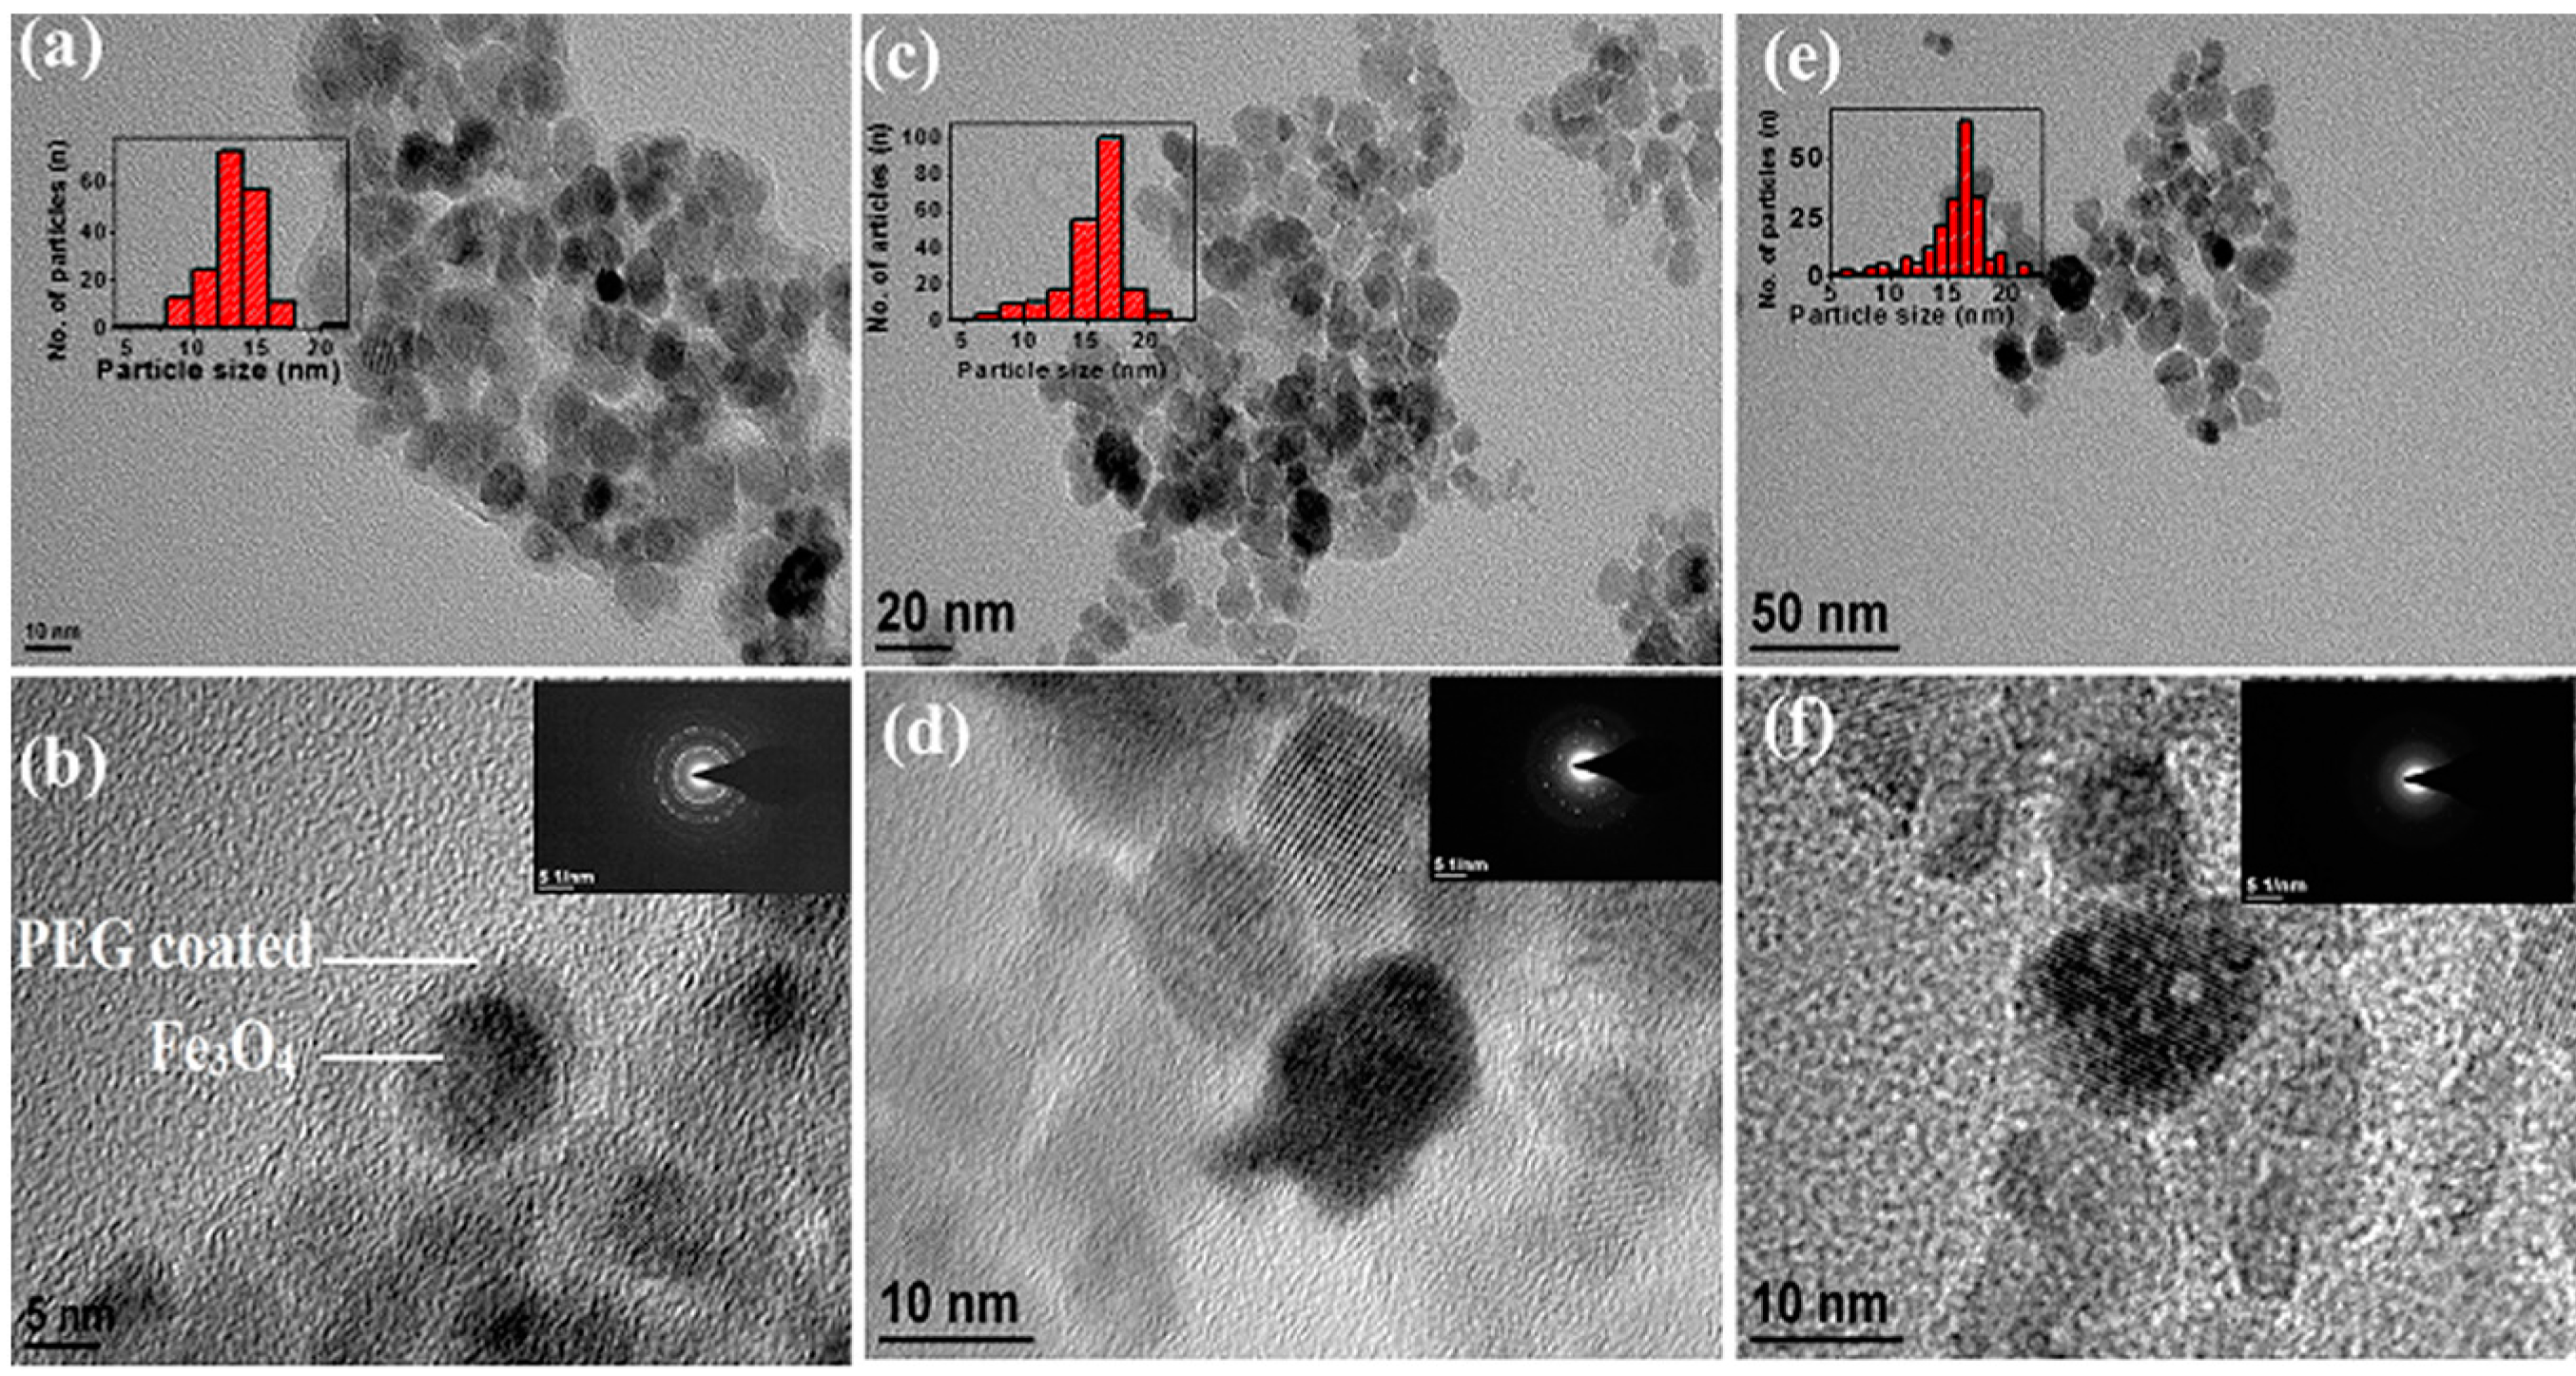
3.2. Morphological Characterization

The morphology of the nanoparticles was confirmed by several microscopic methods such as high resolution transmission electron microscopy (HRTEM), and selected area electron diffraction (SAED). The particles were almost spherical in shape for all the samples. Figure 2 shows the morphology and high crystalline nature of the three Fe3O4 nanoparticle samples.
The average Fe3O4 particle diameters calculated from the TEM images for the S1, S2, and S3 samples were 12 nm, 15 nm, and 16 nm, respectively. The histogram, as shown in the inset of Figure 2a, confirmed the narrow size distribution of the nanoparticles where the average core Fe3O4 particle diameter was 12 nm and the coating thickness was around 2 nm for sample S1. The circular rings as shown in the SAED pattern (Figure 2b inset) confirmed the polycrystalline nature of the sample.
FTIR analysis of the nanoparticles was carried out by the potassium bromide pellet method in Bruker, Ettlingen, Germany at the range from 400–4000 cm−1. Figure 3a shows the FTIR spectra of the PEG coating of sample S1. The characteristic bands related to the Fe−O vibrations near 620 cm−1 are observed. Apart from that, a broad −O−H stretch around 3420 cm−1, a sharp −C−H stretch around 2890 cm−1, and a −C−O stretch around 1116 cm−1 are observed in the PEG coated NPs, confirming the presence of PEG residue in the samples [25,26]. Typical FTIR curves for samples S2 and S3 are shown in Figure 3b,c, respectively.

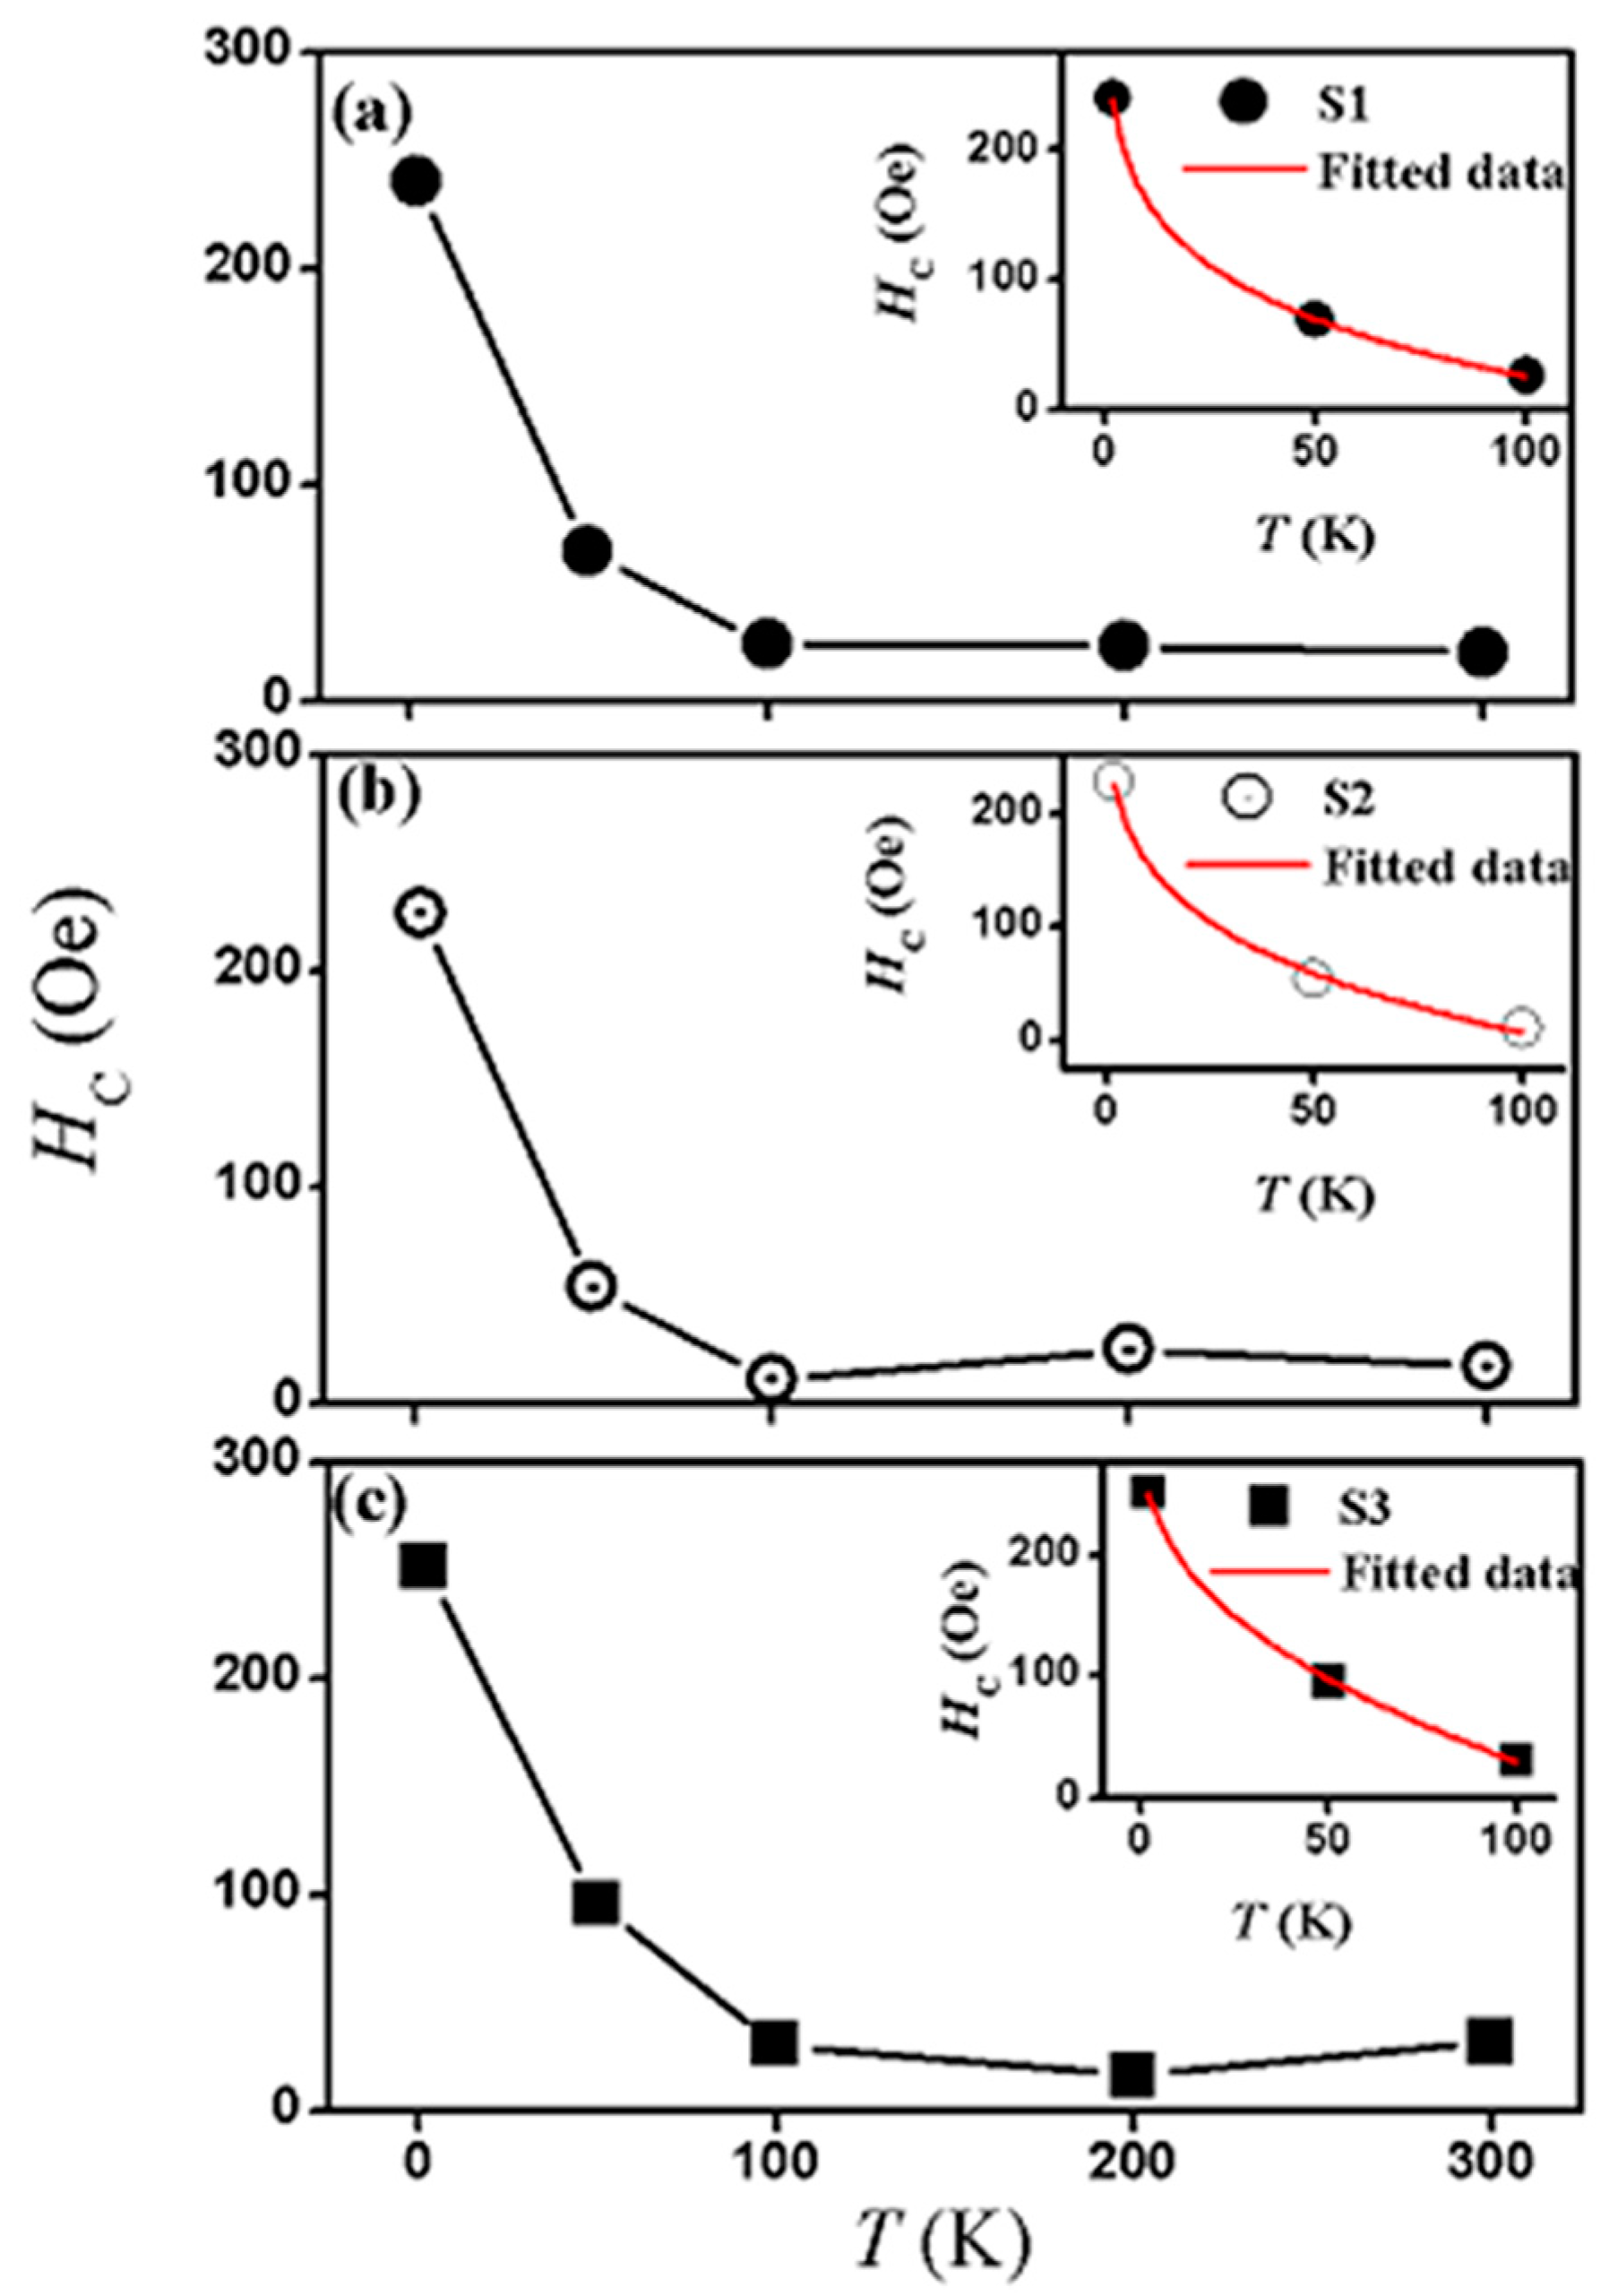
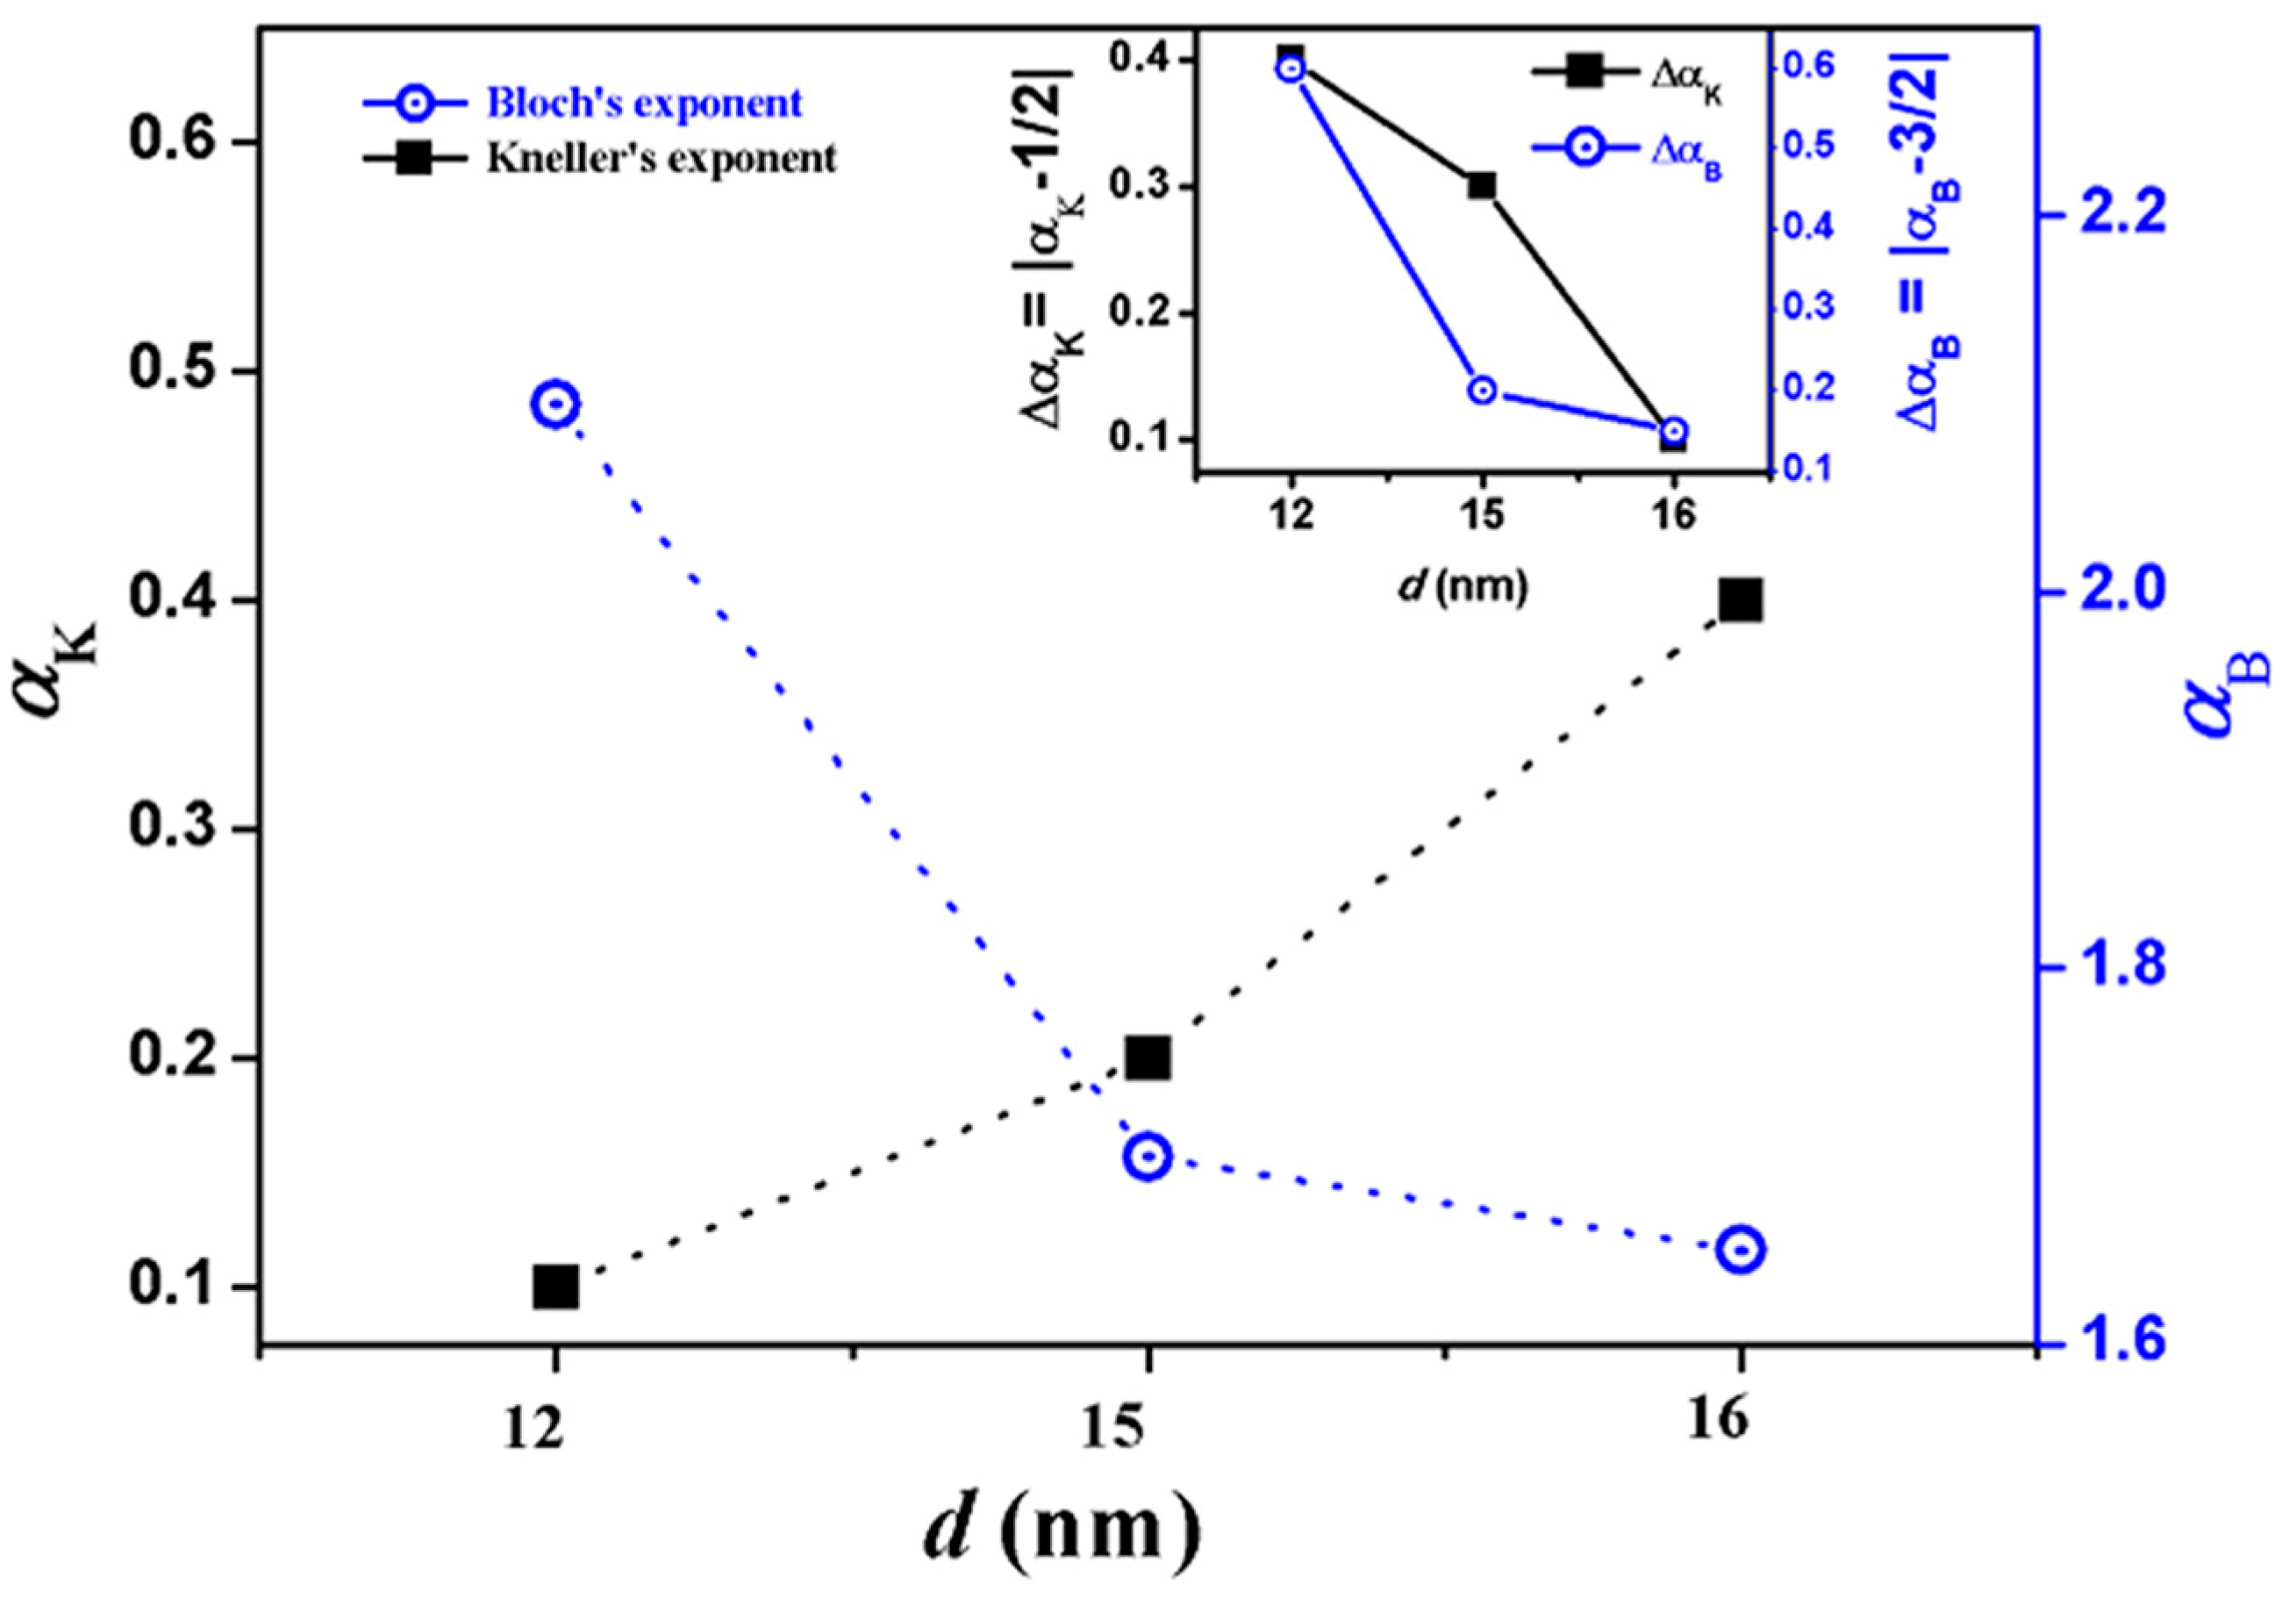
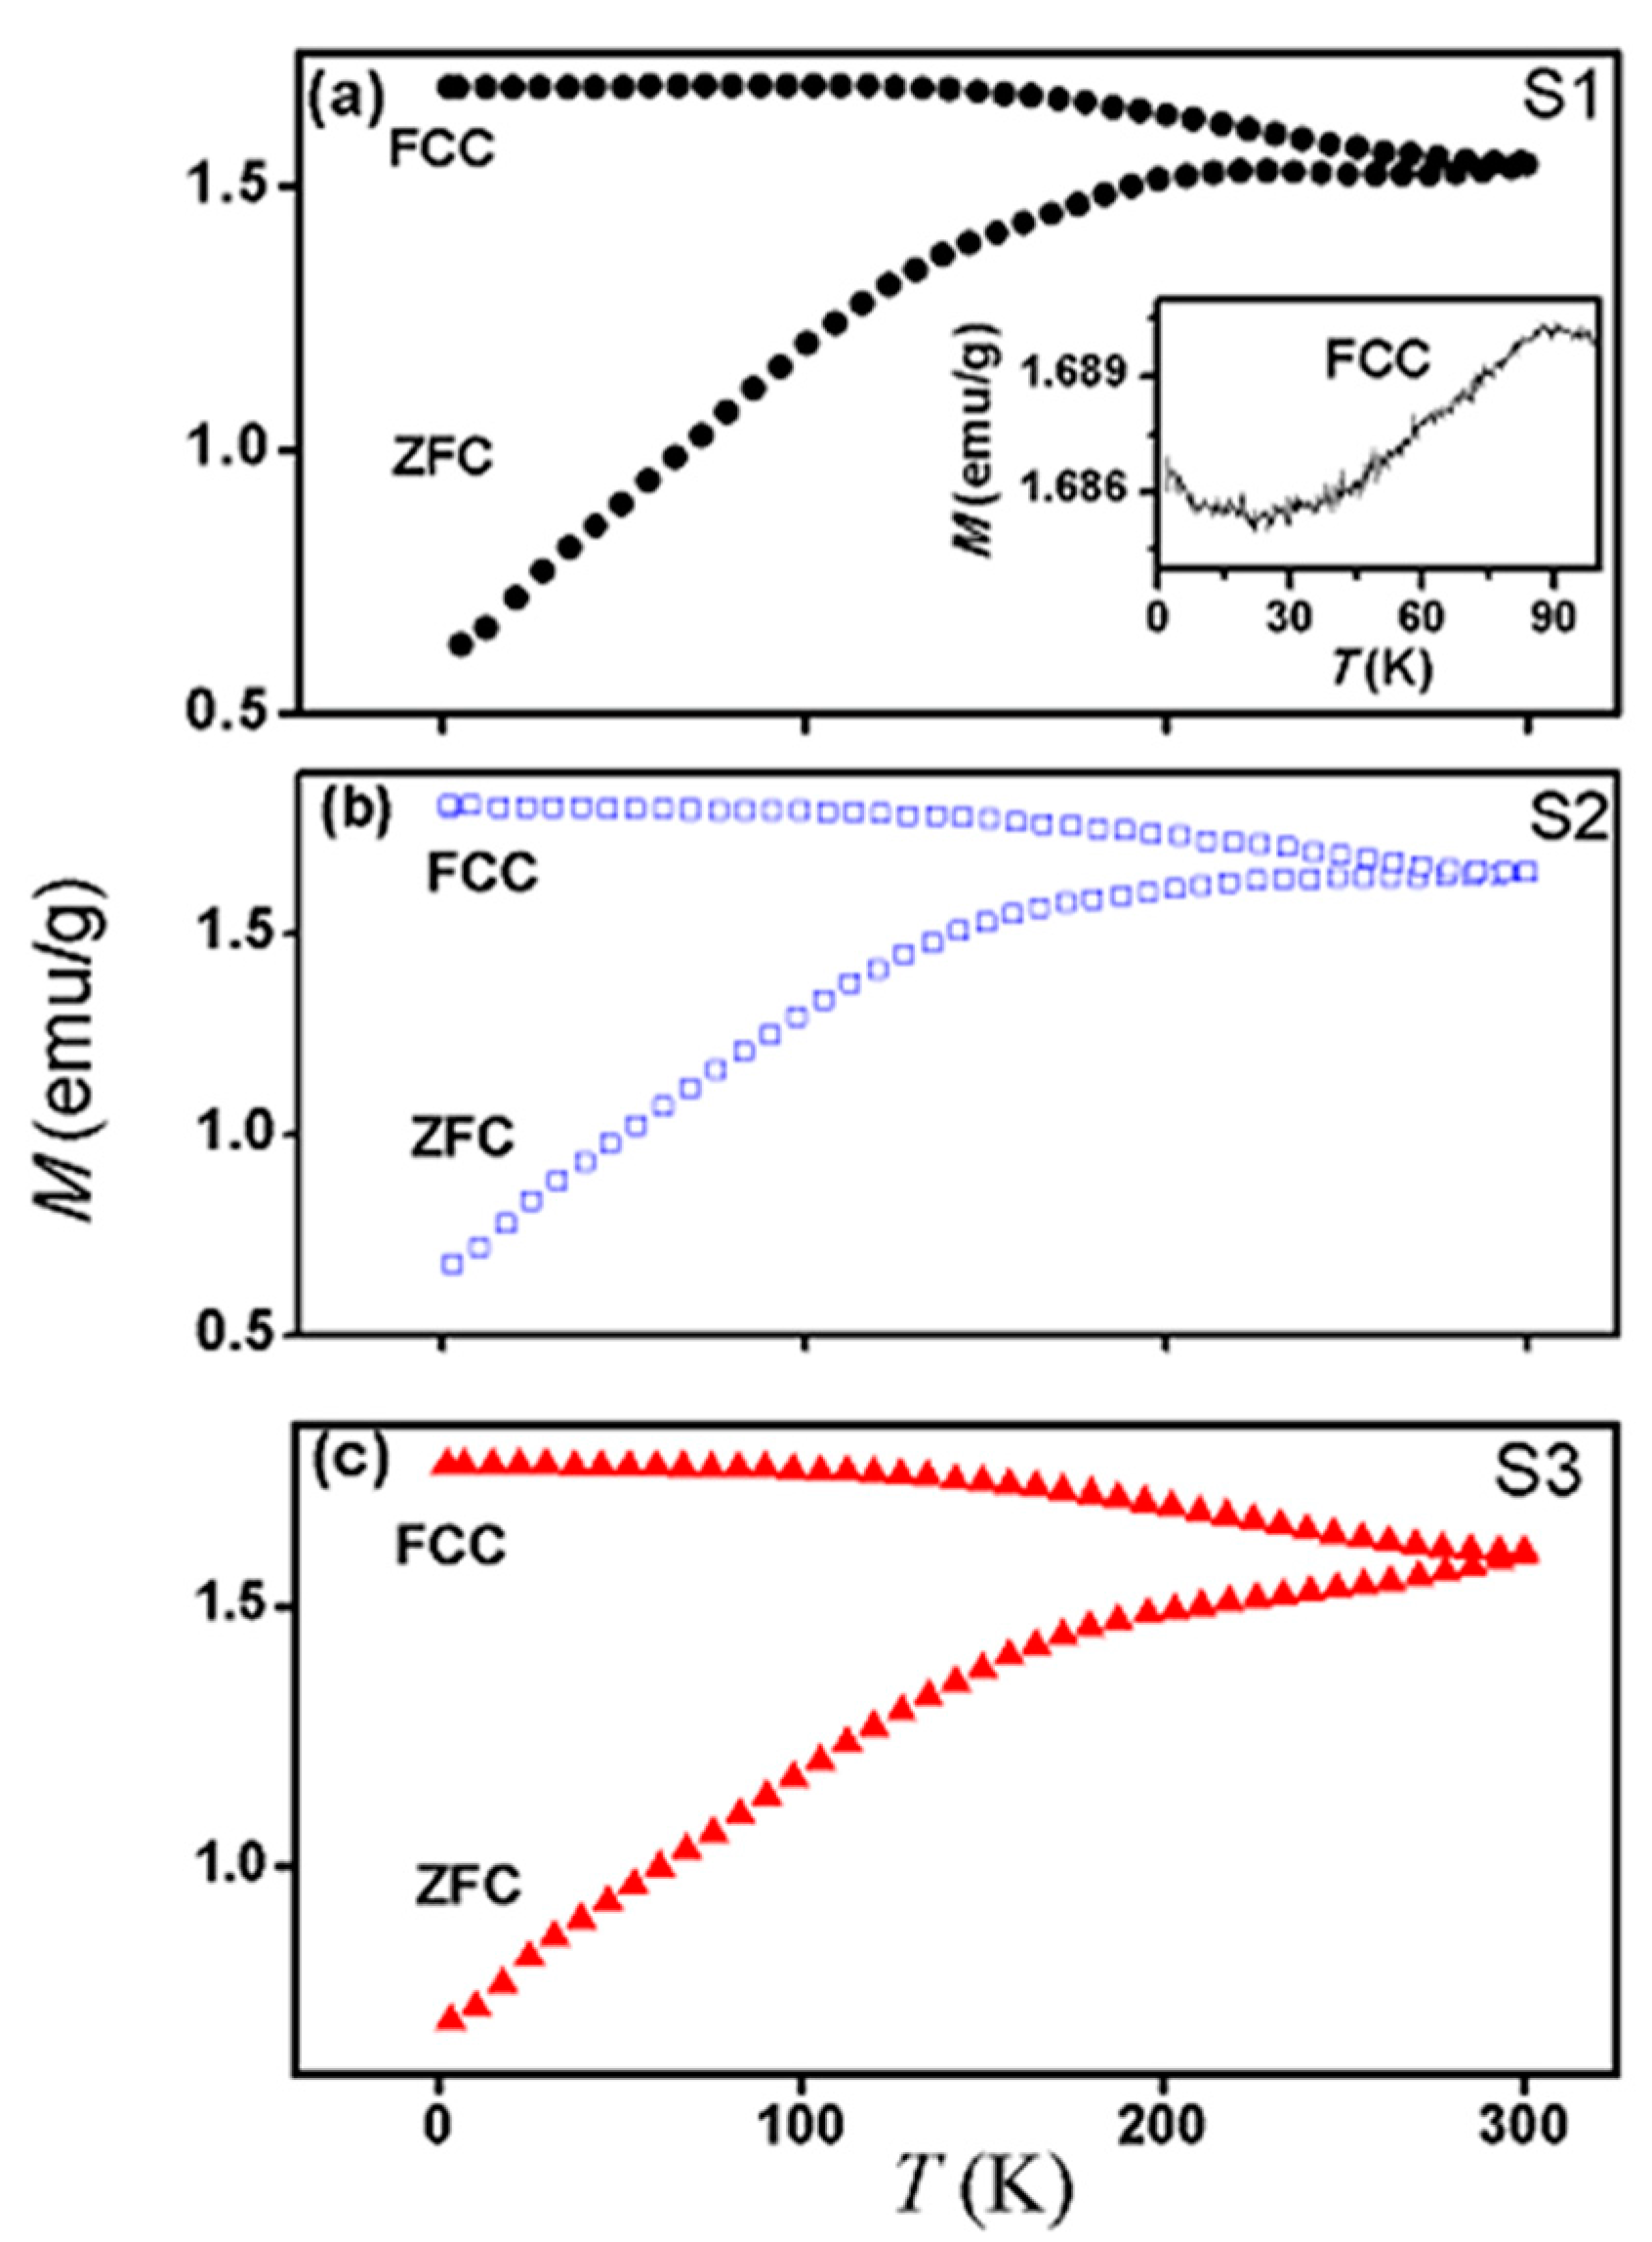
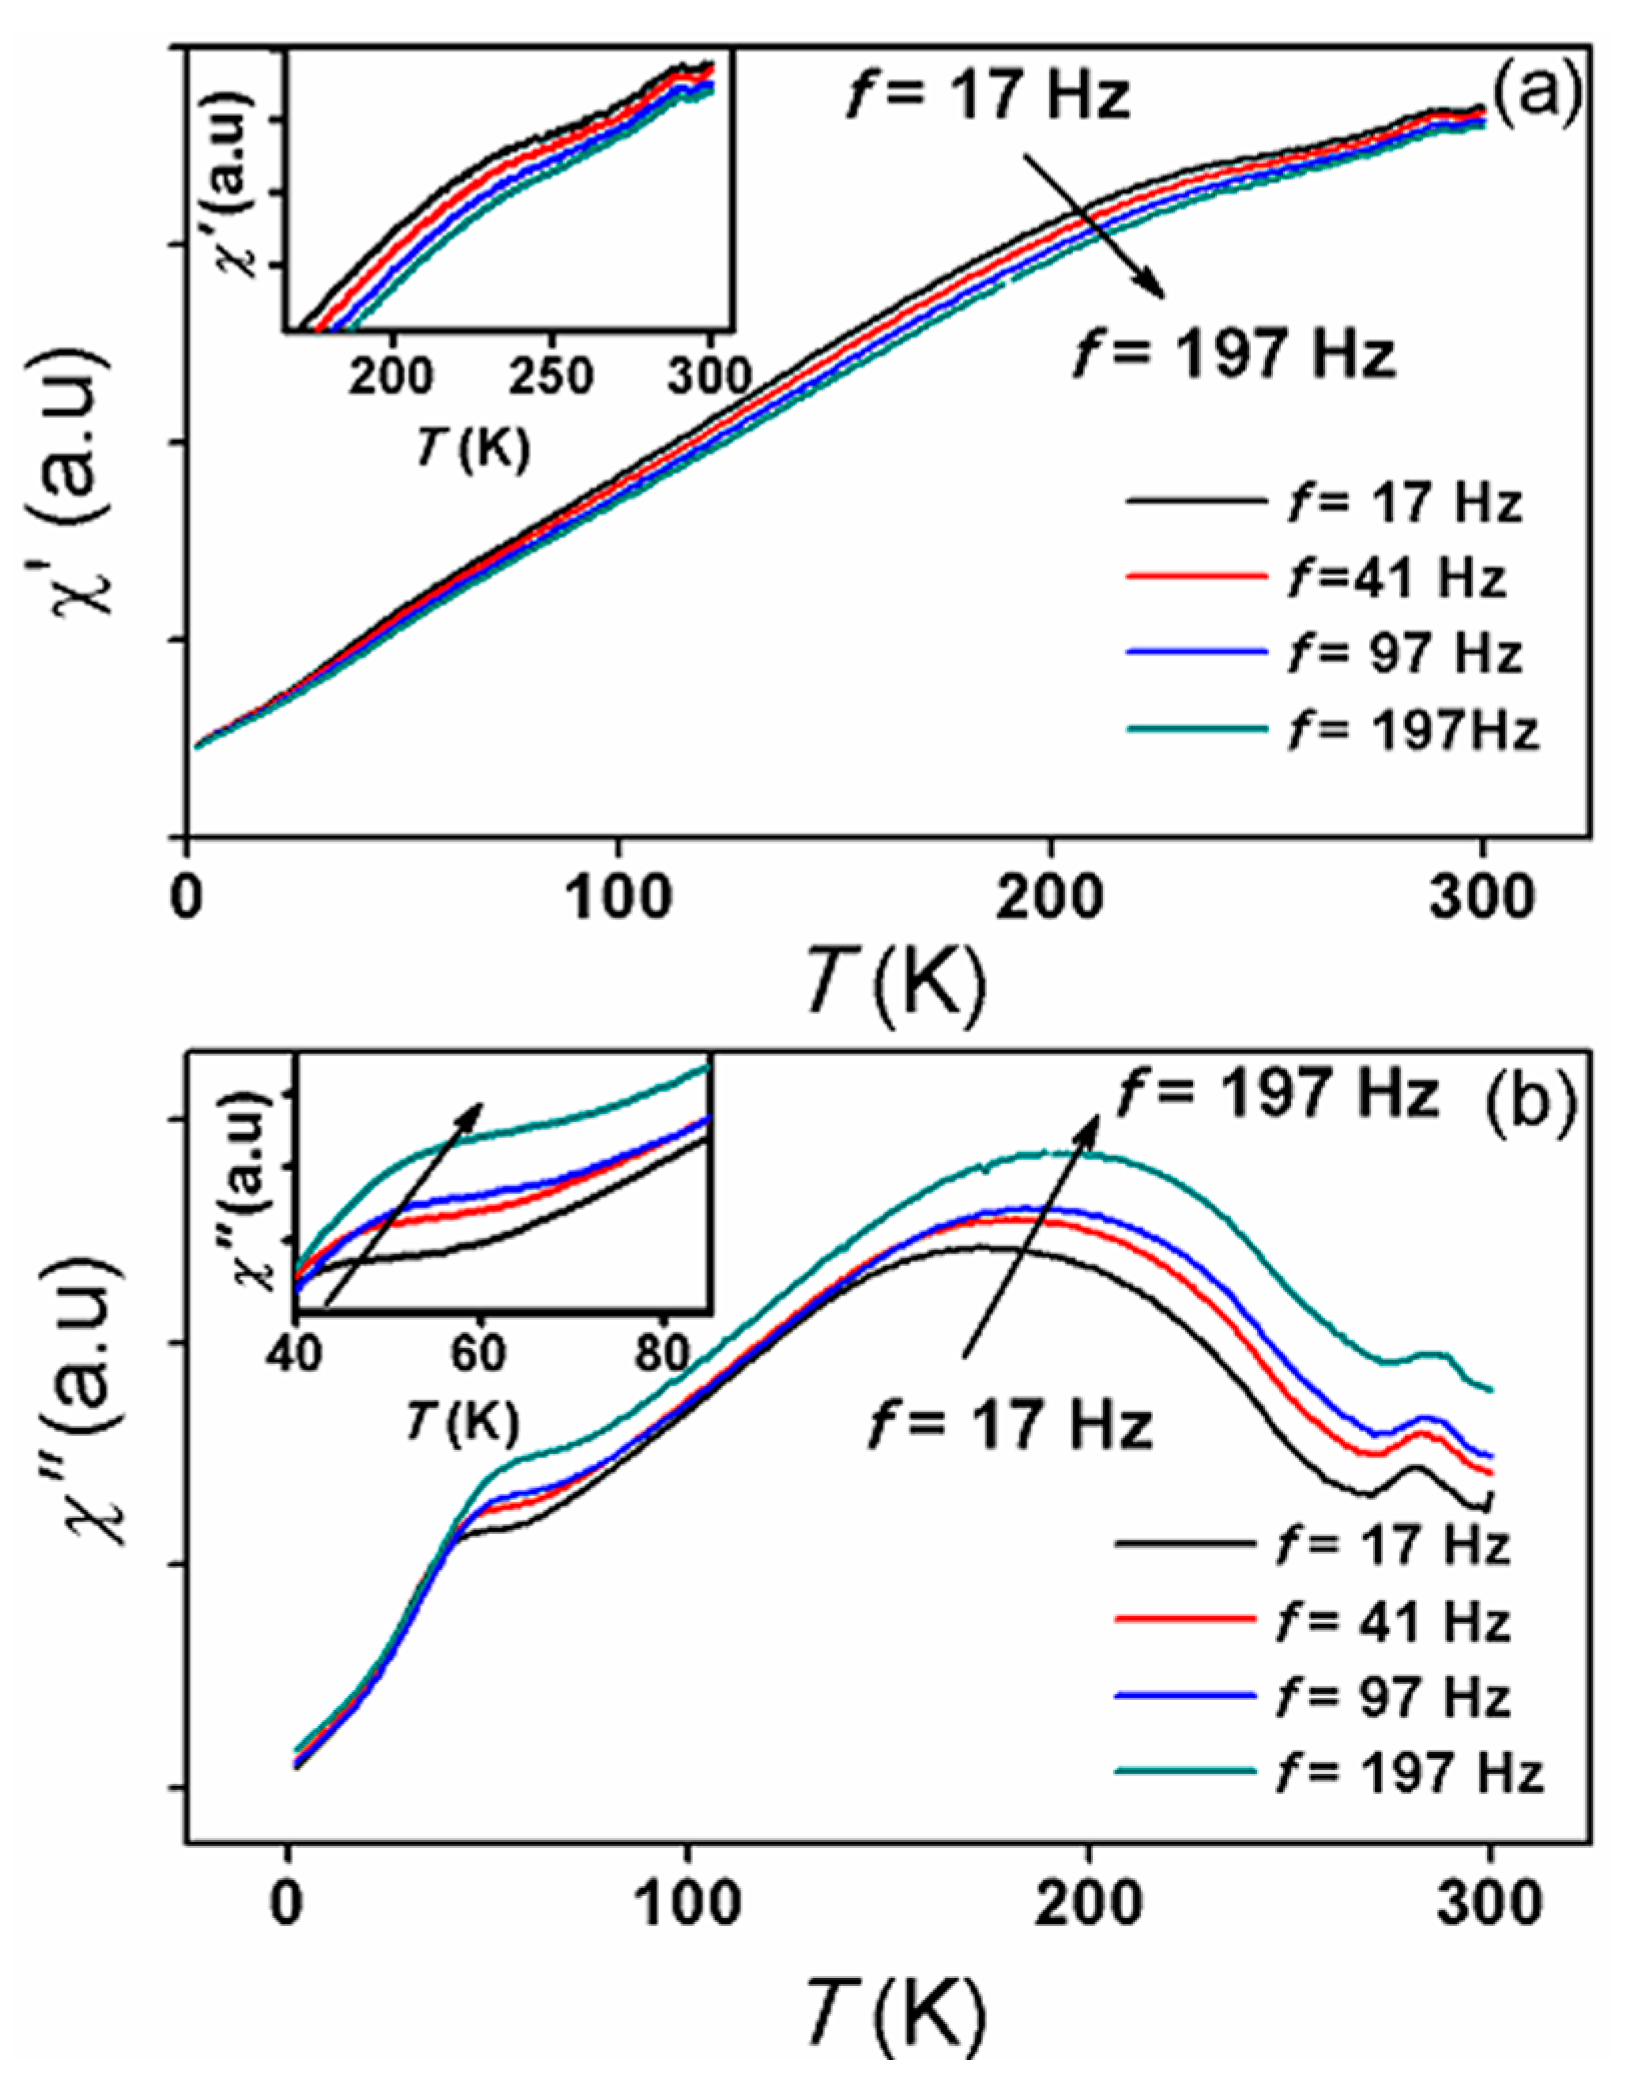
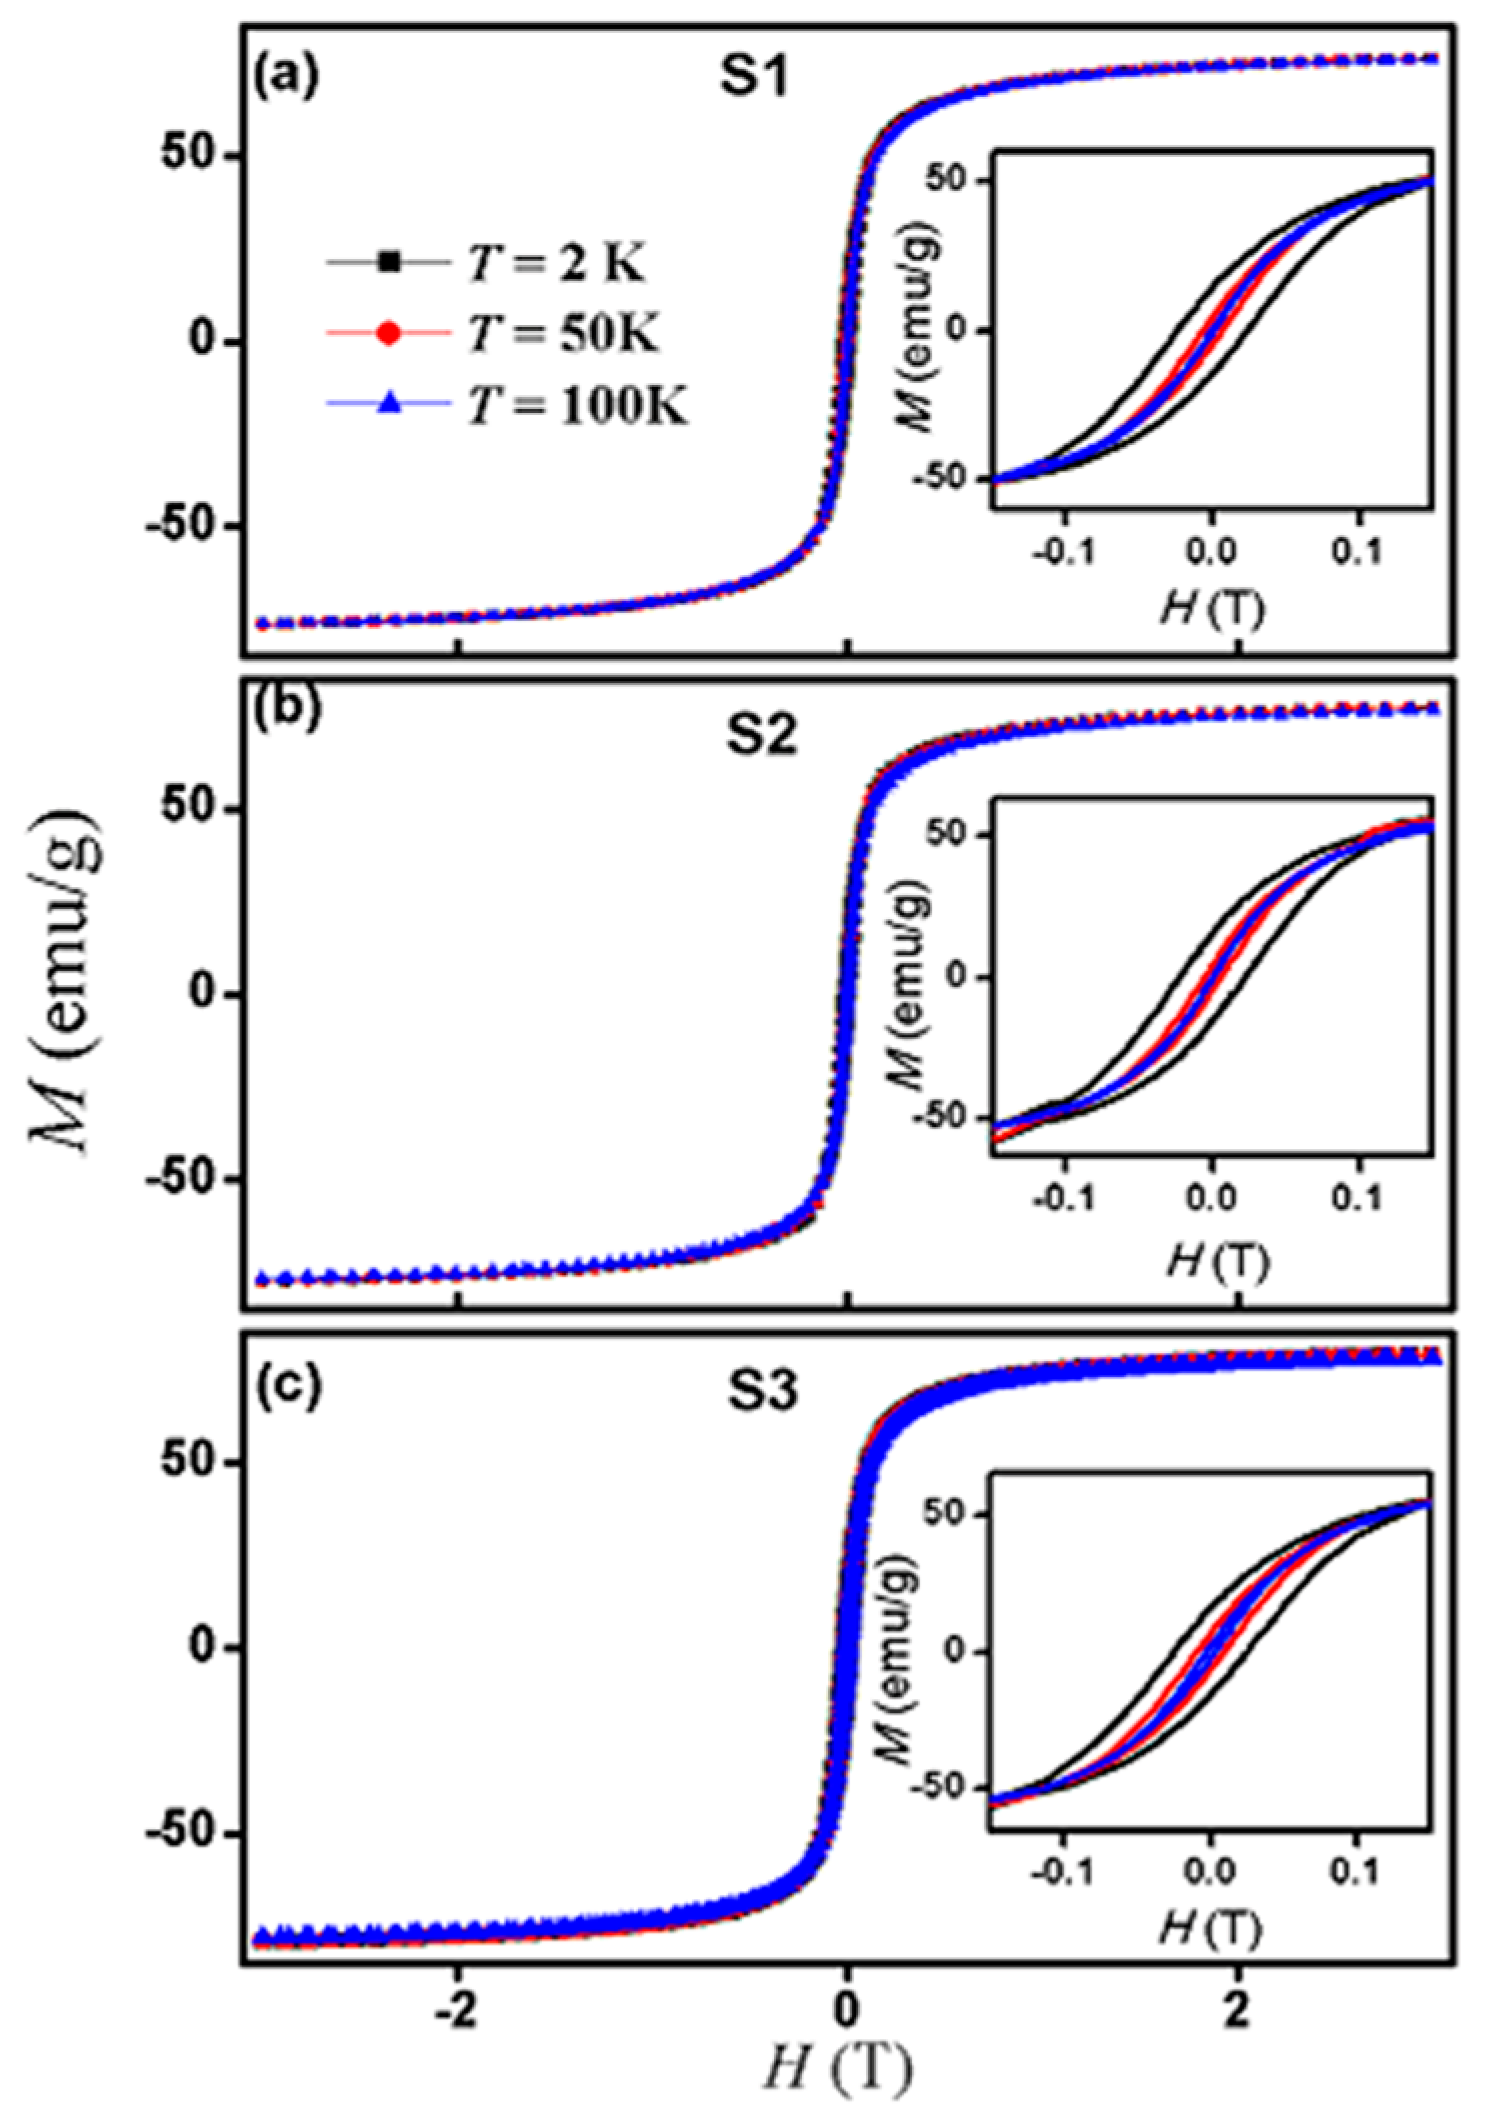
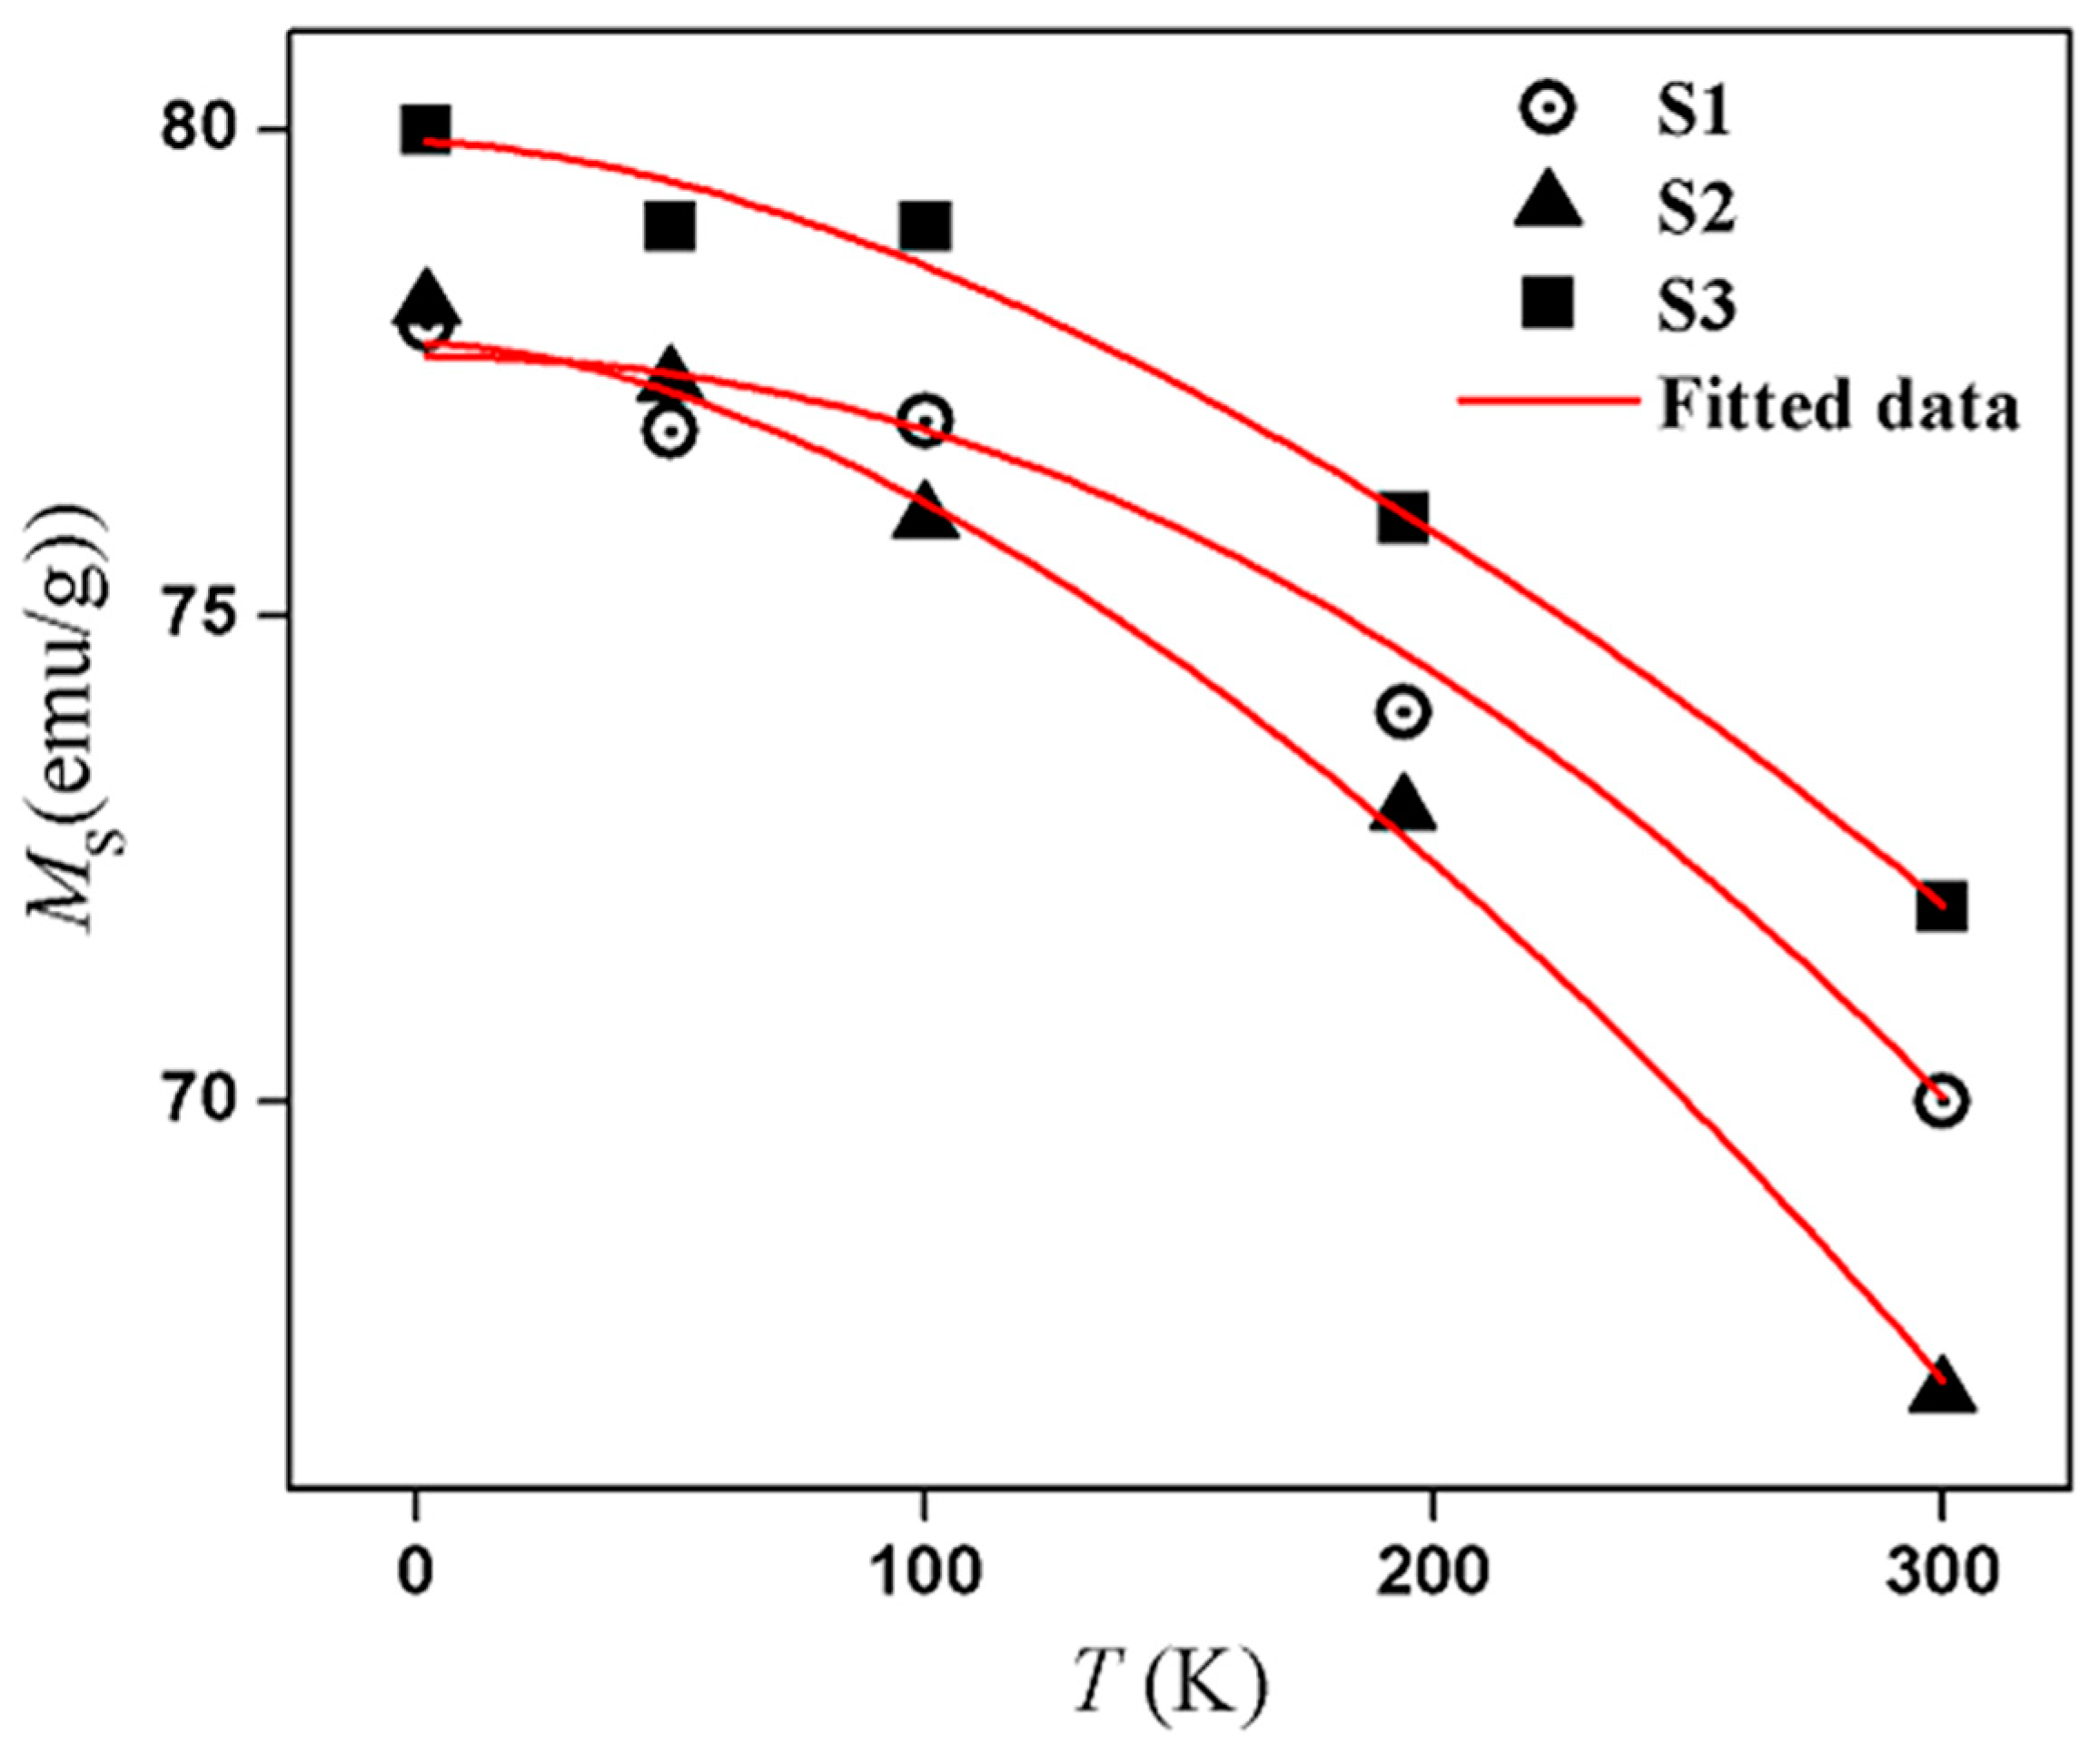
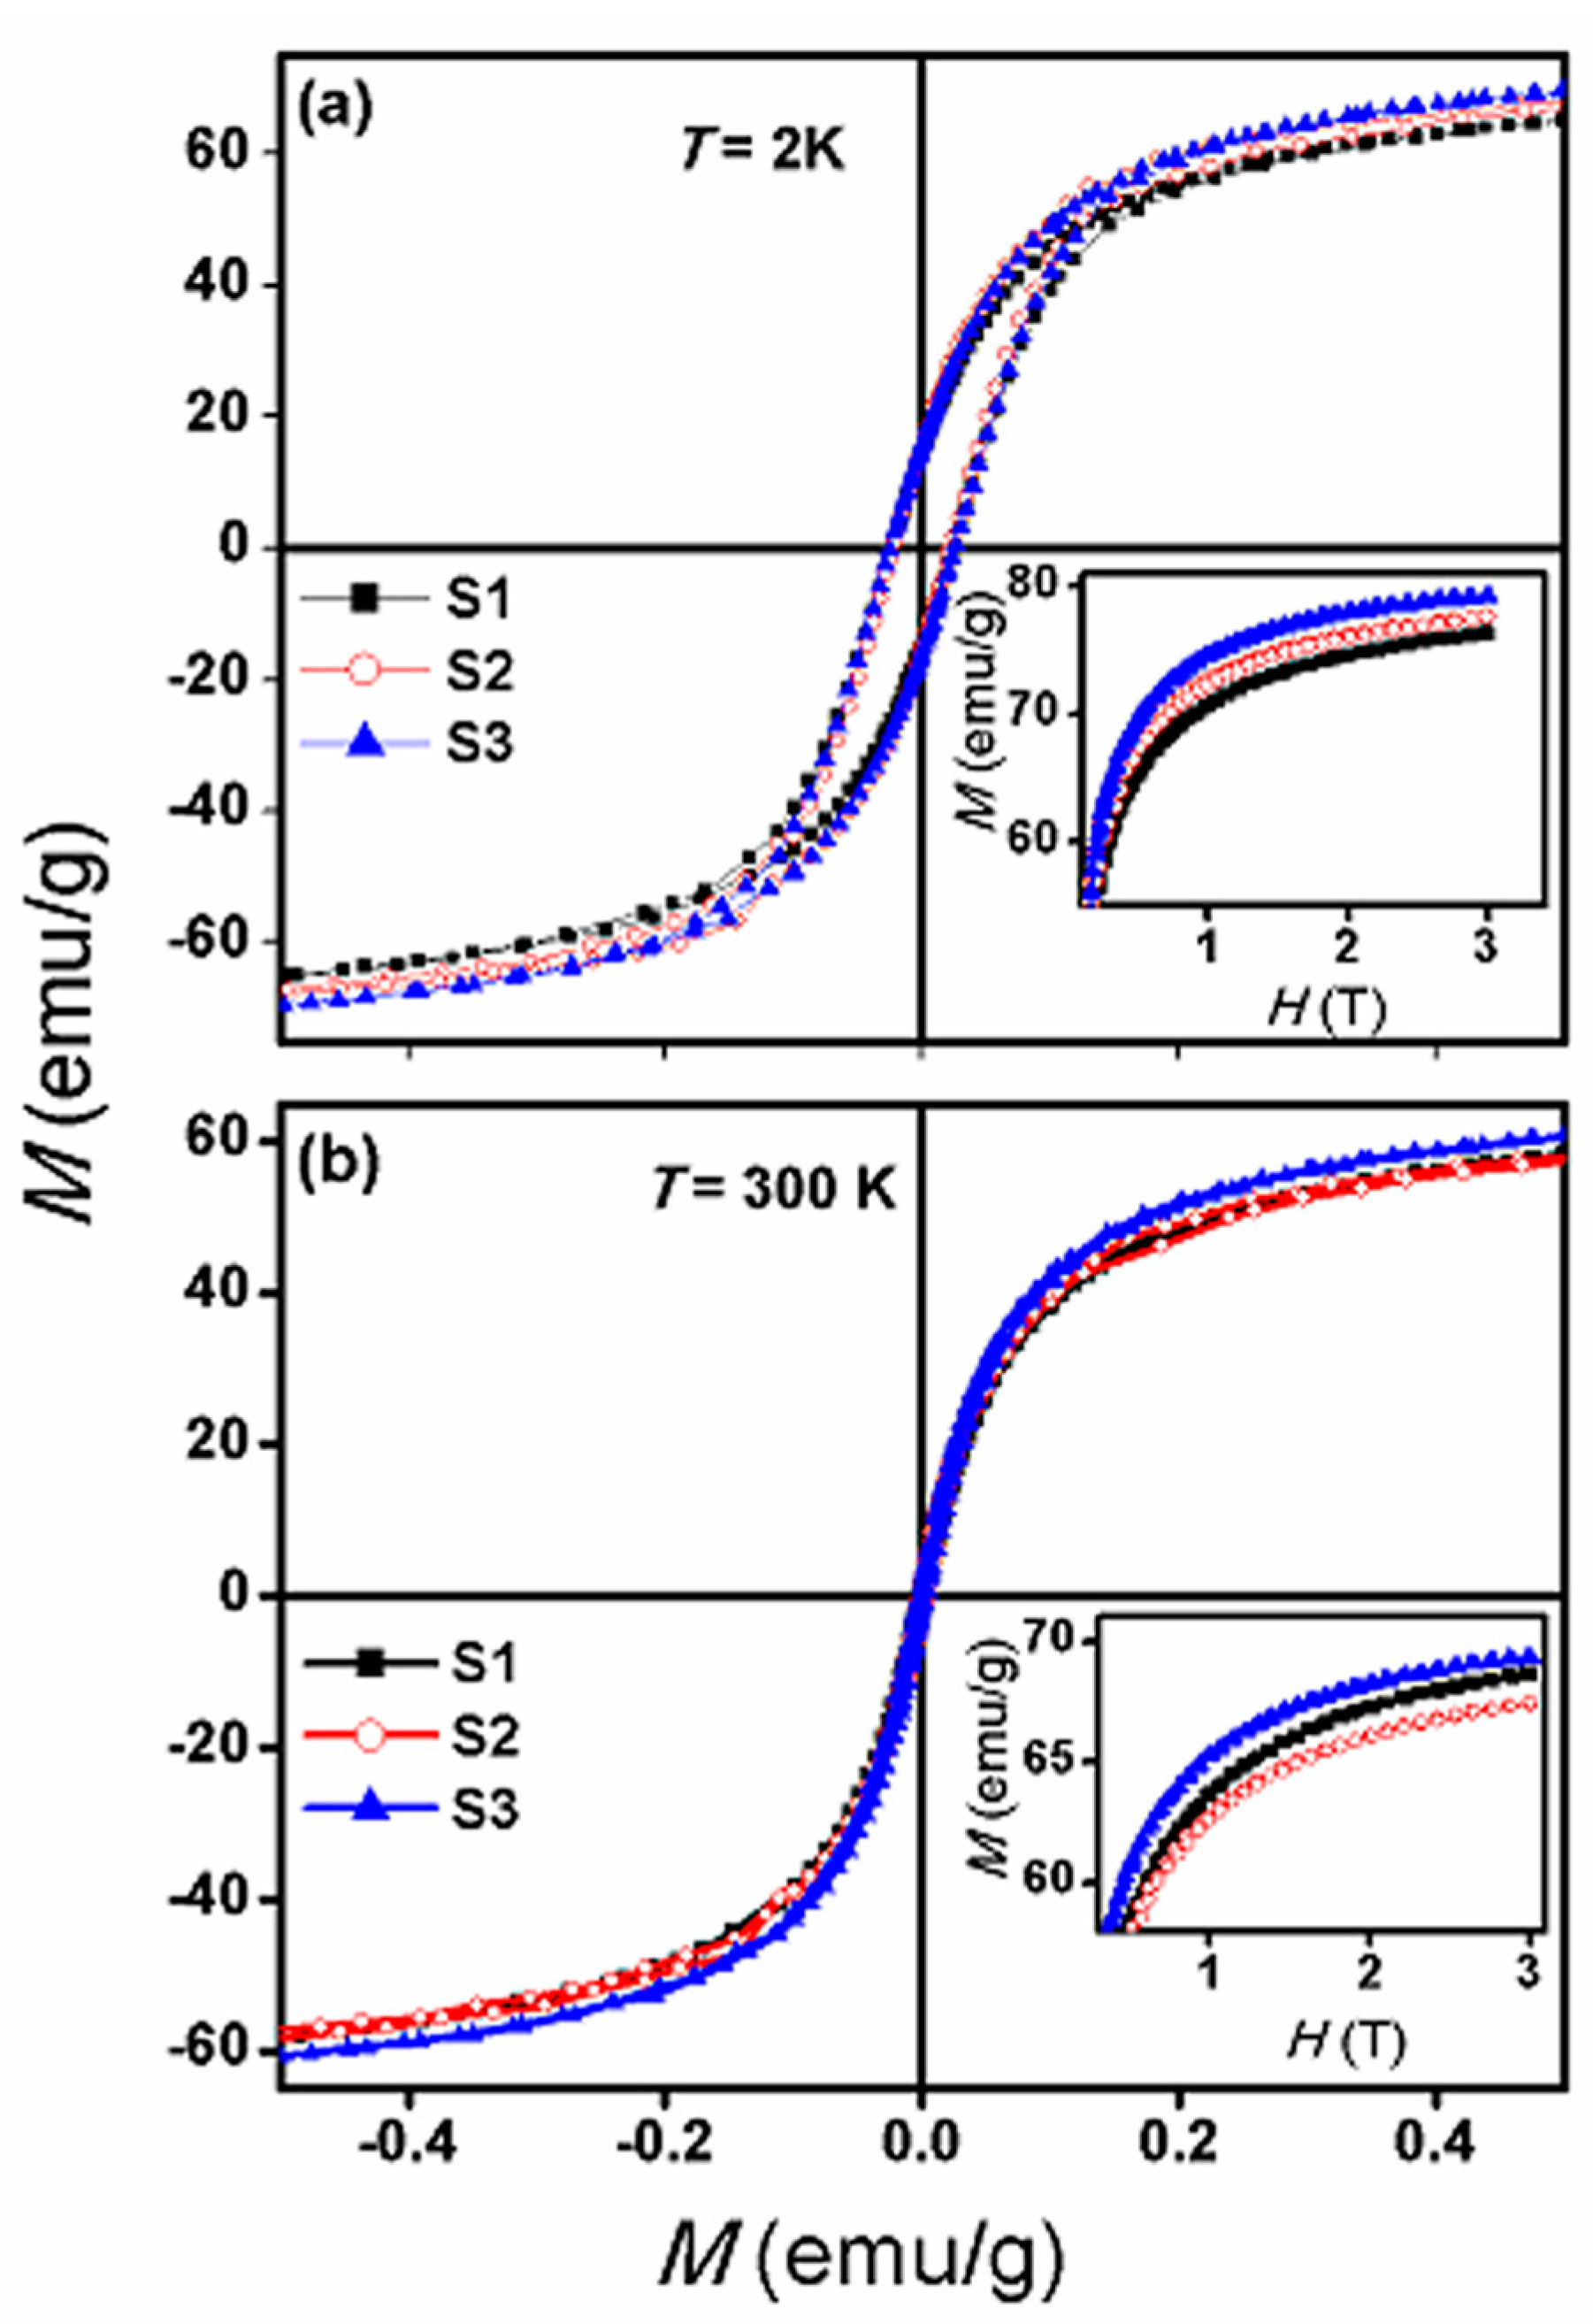
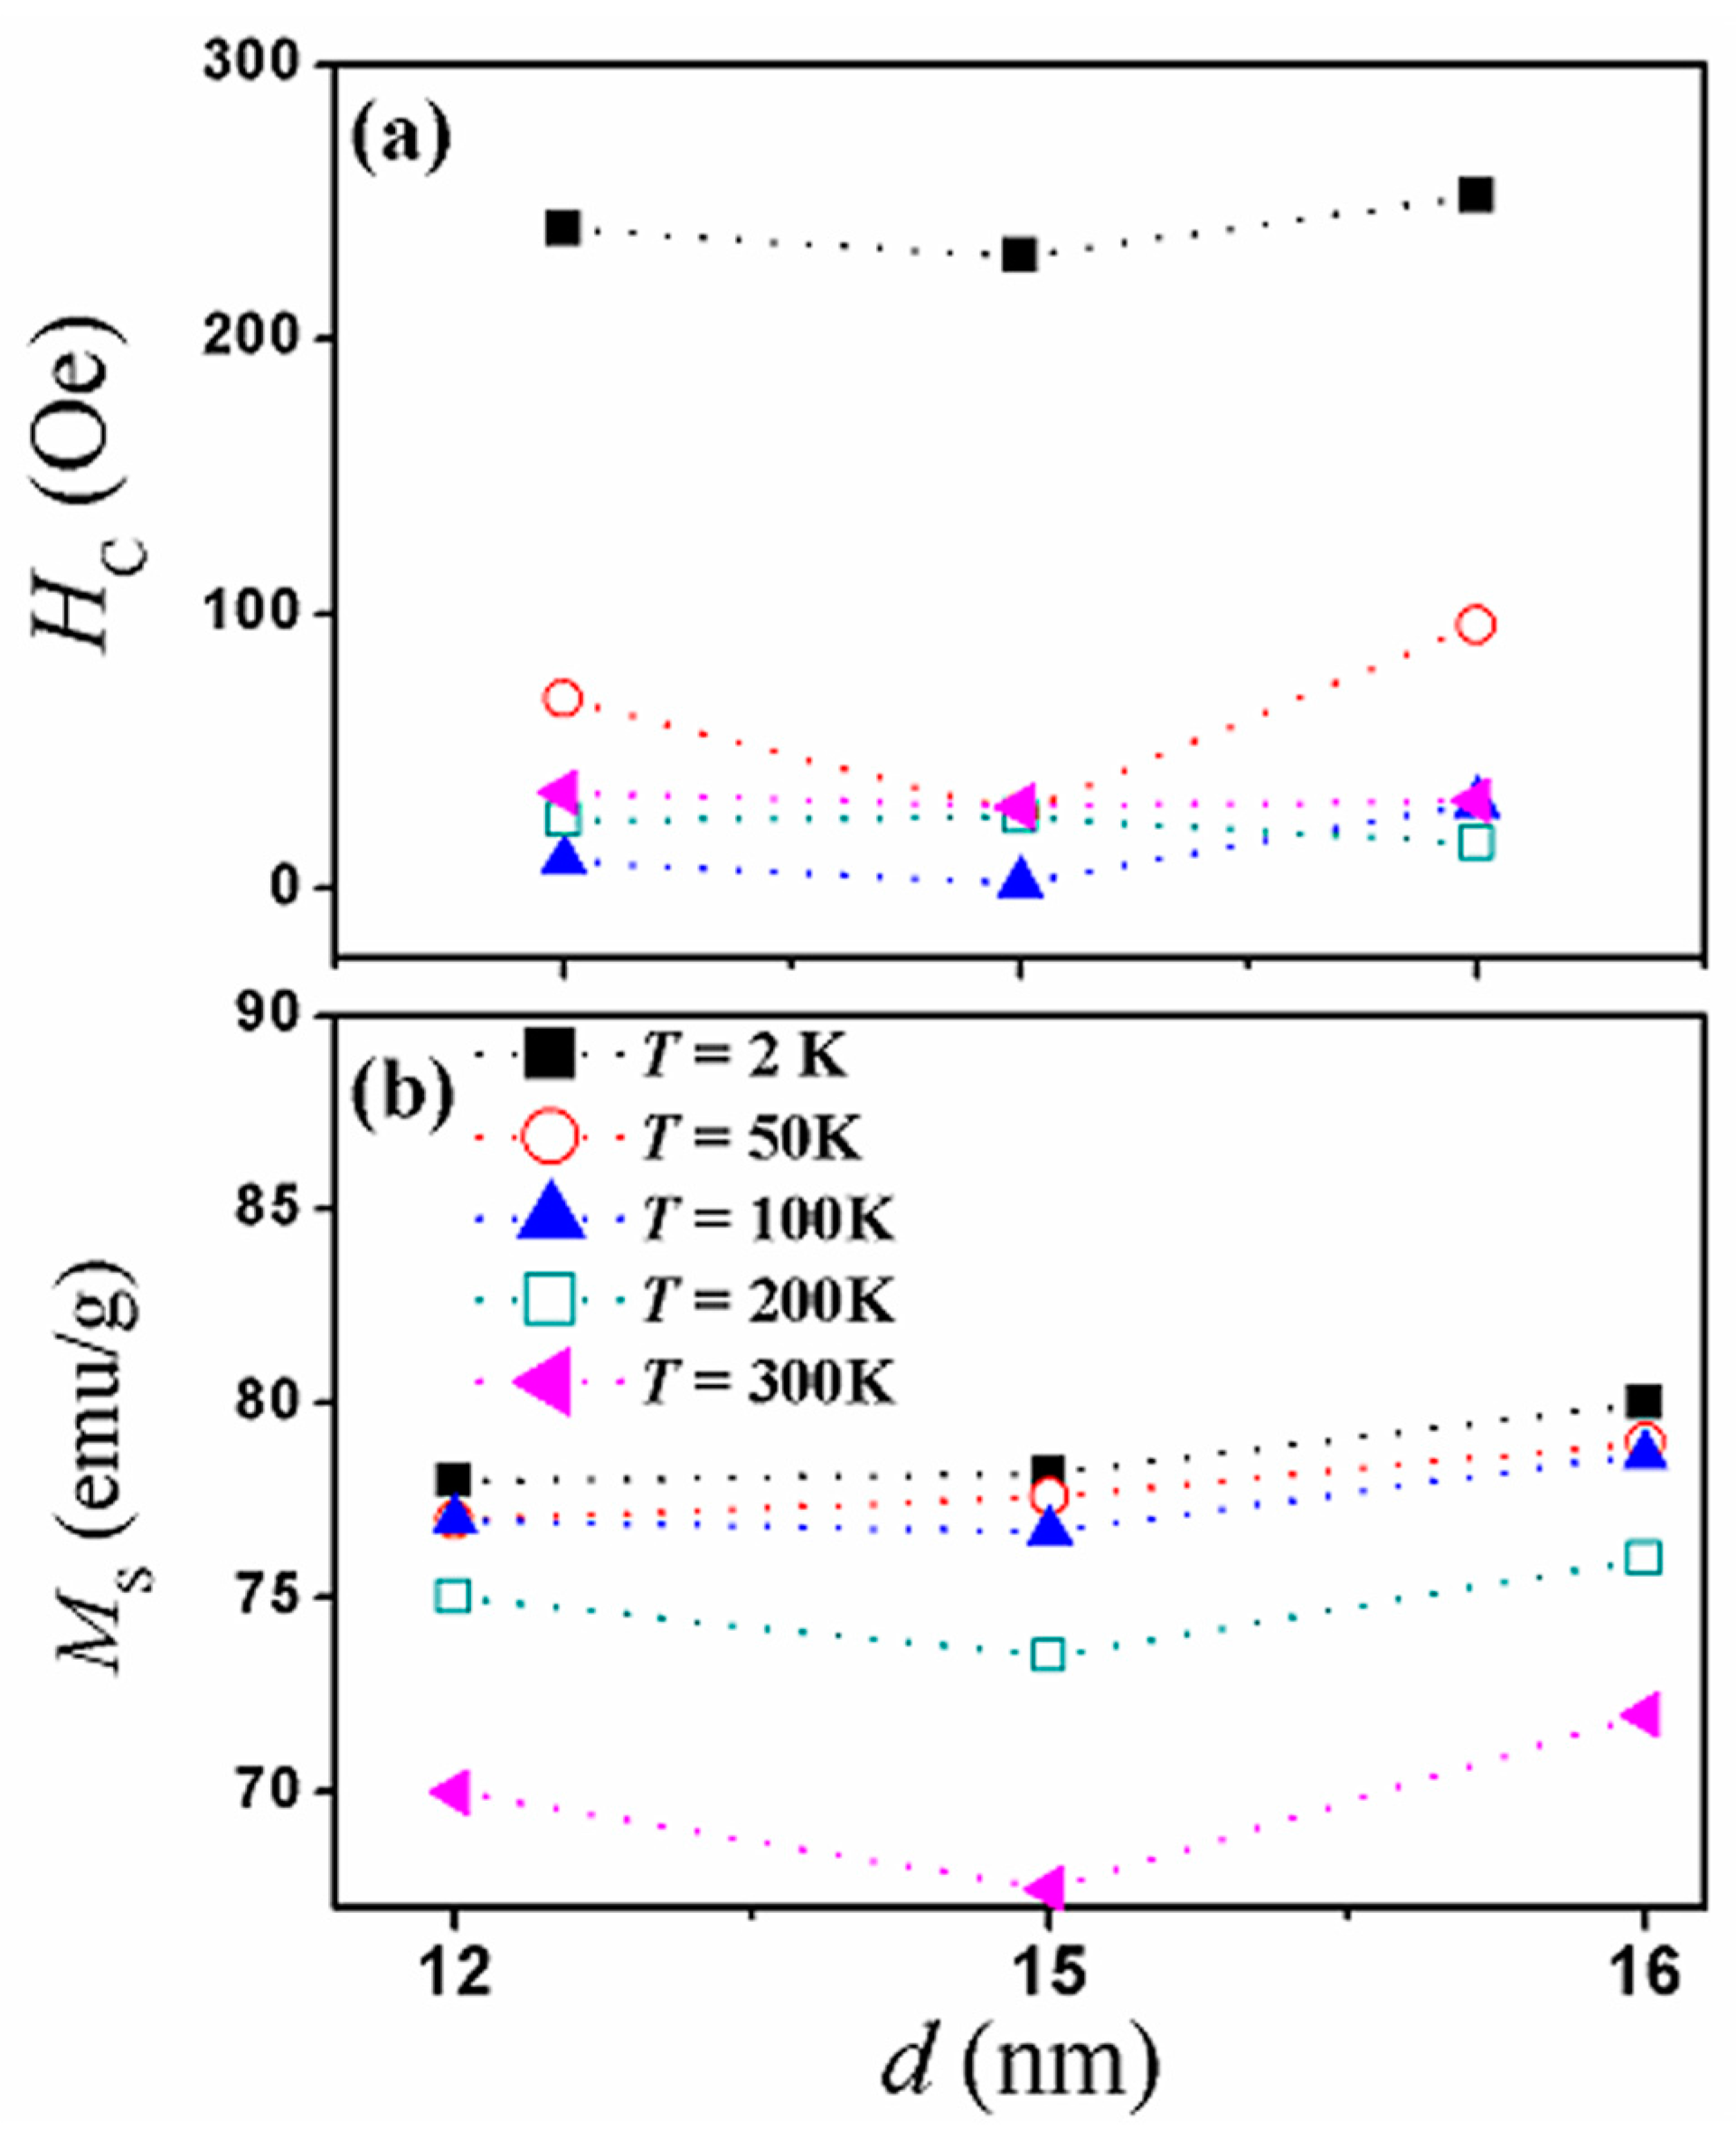
3.3. Magnetic Properties

Magnetization versus applied magnetic field (M-H) measurements were carried out under the zero- field-condition at 2, 50, and 100 K. In each hysteresis loop cycle, the magnetization data was recorded while the applied field was varied between −3 T to 3 T. In the zero-field cooling (ZFC) protocol, the temperature of the sample was cooled down from room temperature to a particular temperature in the absence of any applied magnetic field. After that, a magnetic field was applied and the magnetic moment was measured. The M-H hysteresis loops under ZFC at T = 2, 50, and 100 K, for samples S1, S2, and S3 are shown in Figure 4a–c, respectively. Here we only show the region for the applied field up to 0.5 T so that the openings in the loops can be seen. Typical hysteresis loops were obtained at 200 K and 300 K for all samples, but with smaller openings. The saturation magnetization values were found from the extrapolation of the M versus 1/H curves for the limit when 1/H approaches zero.
It is worth mentioning that the reported magnetization values are smaller than the real values for these coated nanoparticles. In obtaining the magnetization, the magnetic moment measured by the SQUID was divided by mass of the sample. However, this mass includes both the mass of the PEG coating (which does not contribute to the magnetization) and the mass of the iron oxide core. The reported magnetization values should be due to the iron oxide core only. Hence, the real magnetization values should be larger, where the measured values should be multiplied by the ratio of the total mass of the particle to the mass of the core ( m t o t a l / m c o r e ). By calculating the average sizes of the core and the shell in each sample (from the HRTEM images) and by using a density of 5 g/cm3 for the Fe3O4 core [27] and 1.13 g/cm3 for the PEG coating [28], the calculated mass ratios ( m t o t a l / m c o r e ) are 1.13, 1.11, and 1.097 for samples S1, S2, and S3, respectively.
Two important results are obtained from the hysteresis loops presented in Figure 4 and the similar ones at higher temperatures; these are (a) the magnetization of all samples did not reach saturation at all temperatures, even at the maximum applied field of 3 T in our experiments, and (b) the openings of the hysteresis loops remain in all samples even at 300 K. The absence of saturation of the magnetization hints at surface spin effects. The existence of openings in the hysteresis loops indicates the absence of superparamagnetic behavior in all the samples. Hence, coercivity did not vanish even at room temperature.
The field dependence of the magnetic nanoparticles’ assembly exhibits hysteresis for T < TB and a non-hysteric behavior for T > TB, where TB is the blocking temperature. The magnetic behavior for the monodispersed and non-interacting single domain magnetic particles, assumed as ideal nanoparticles, is explained on the basis of the Néel relaxation and the Bean-Livingston approaches. In the case of temperature dependence of the coercive field (HC), it decreases with the square root of temperature and then reaches zero at T > TB and is called Kneller’s law. On the other hand, the saturation magnetization (MS) decreases with the cube root of temperature; this is called Bloch’s law.
The temperature dependence of coercivity is expressed by Kneller’s law [29,30,31] as follows:
H c ( T ) = H o 1 ( T T B ) α K
Here, TB represents the superparamagnetic blocking temperature of the nanoparticles, αK is the Kneller’s exponent, and Ho is the coercivity at T = 0 K. This law was calculated in the temperature range from 0–TB, where the nanoparticles were assumed to be single-domain, non-interacting, and with uniaxial anisotropy. It was well known that for this system, αK was found be equal to 1/2.
Figure 5a–c represent the coercive field versus temperature under the ZFC protocol for samples S1, S2, and S3, respectively. The insets represent the modified Kneller’s law fitted with the experimental data for the corresponding samples. The coercive field was inferred by taking the average of the values between the negative and positive field axes of the hysteresis loop. Only the idealized particle system with monodispersed and non-interacting single domain magnetic particles follows the original Kneller’s law.
However, our experimental data for coercivity did not follow the original Kneller’s law; rather it followed a modified version of Kneller’s law. The fitted magnetic parameters are presented in Table 1. From the fitted data, we obtain the exponents (αK) which are 0.10, 0.20, and 0.40 for samples S1, S2, and S3, respectively. The deviation from the original Kneller’s law increases (Kneller’s exponent, αK, moves away from 1/2) with decreasing the particle size. The largest deviation is for the smaller sample, S1, where αK is 0.1. On the other hand, the coercive field increased with the decrease in particle size.
The temperature dependence of the saturation magnetization in bulk ferromagnetic or ferrimagnetic materials at low temperatures is expressed by Bloch’s law [32] as follows:
M S   ( T ) = M 0 [ 1 ( T T o ) α B ]
where, M0 represents the saturation magnetization at 0 K, and To is the temperature at which the MS becomes zero. The exponent αB is known as the Bloch’s exponent and the value of αB is 3/2 for bulk materials. Bloch suggested the T3/2 law by considering the magnon excitation of long wave-length spin-waves at low temperatures [23].
Figure 6 displays the temperature dependence MS, measured under the ZFC protocol for all the samples, and fitted to Bloch’s law. The fitted magnetic parameters are presented in Table 2. It must be noted that equation (2) is applicable at high temperature and for bulk materials. At the nanoscale level, large anisotropy leads to a deviation from the ideal Bloch’s equation. The fitted data shown in Figure 6 indicates that the modified exponent (αB) is larger than its bulk value, resulting in a modified Bloch’s law. The αB values, as inferred from the fitting, were 2.1, 1.7, and 1.65 for samples S1, S2, and S3, respectively. In several studies on nanoparticles, the values of αB were reported to vary from 1.5 to 2 [33,34,35,36,37,38,39].
At temperatures larger than the spin-wave energy gap, Bloch’s law seems to be applicable in nanoparticles. The MS (T) for nanoparticles was expected to deviate from Bloch’s law because of the discrete spectrum of spin-wave modes with a cut-off corresponding to wavelengths larger than the size of the system [23]. However, the modified Bloch’s law for nanoparticles was reported to be similar to the ideal Bloch’s law for bulk materials but with different values of Bloch’s exponent αB [40,41]. It was suggested that the experimental data decays exponentially at low temperatures [36]. Various nanoparticle systems reported the deviation of Bloch’s law in nanoparticles from the ideal law [42,43,44,45,46,47].
Our PEG-coated nanoparticles display significant size-dependent deviations from Bloch’s law. As the particle size decreases, the temperature dependence of the saturation magnetization deviates more from the original Bloch’s law (the Bloch’s exponent, αB, moves away from 3/2) and the deviation is maximum for the particle with the smallest volume (with αB larger than 2.1), as shown in Figure 7.
We believe that finite size effects are the main source for this deviation from the original Kneller’s and Bloch’s laws. As the particle size decreases, the effective role of the surface spins increases leading to departures of coercivity and magnetization from the original Kneller’s and Bloch’s laws. However, we show that this size-dependent deviation is not linear, hinting at other effects such as large size distributions, inter-particle interactions, and surface spin effects such as spin canting. However, the size distributions obtained from the TEM images and presented in the size histograms (Figure 2) were found to be small. To obtain an indication about the inter-particle dipolar interactions, we conducted zero-field-cooled (ZFC) and field-cooled (FC) temperature-dependent magnetization measurements on the three samples at the applied magnetic field value of 20 Oe. In the ZFC measurement, the sample was cooled from room temperature (300 K) to 2 K in the absence of any applied magnetic field. Once the temperature was stabilized at 2 K, a small magnetic field of 20 Oe was applied to the sample. The temperature of the sample was then raised to 300 K. The magnetic moment of the sample was recorded during the warming process. After the ZFC magnetization measurement was completed, the temperature was cooled again from 300 K to 2 K under an applied magnetic field of 20 Oe. The magnetic moment was recorded during this cooling process. This defines the FC protocol. To be more specific, this process is usually called field-cooled cooling (FCC), which indicates that the magnetic moment was recorded during the cooling process and thus distinguishes it from the field-cooled warming (FCW) process where the magnetic moment is usually recorded during the warming process.
Figure 8a–c displays the results of the ZFC and FCC temperature-dependent magnetization measurements for the three samples at the field of 20 Oe. The temperature at which the peak in the ZFC curve occurs is usually called the blocking temperature, TB, of the nanoparticles. A common feature of the three ZFC curves is the large TB and the broad peak region (around TB) which could indicate large sizes and large size distributions, respectively. However, the size histograms obtained from the TEM images show narrow size distributions. On the other hand, from the HRTEM images, the calculations of the XRD patterns, and the size histograms obtained from the TEM images, we can confirm that the average particle sizes are small and not large enough to cause these large blocking temperatures. Another common feature of all the ZFC and FCC magnetization curves is that the bifurcation between the ZFC and the FCC magnetization occurred at large temperatures (at nearly 300 K), indicating thermal irreversibility in all the samples below 300 K. All of the above mentioned features of the ZFC and FCC curves could also result because of significant inter-particle (dipolar and surface-surface spin exchange) interactions. However, since all of the samples were PEG coated, the surface-surface spin exchange interactions are absent. The FCC curves in all of the samples also display a common feature where the magnetization increases monotonically as the temperature is decreased from 300 K. However, this monotonic increase of magnetization stopped at nearly 100 K, below which the magnetization becomes nearly constant. This behavior of the FCC curve is usually considered to be a signature of spin-glass structures. The spin-glass behavior might result from frozen canted surface spins or frozen disordered surface spins [48,49,50,51].
The colloidal stability of these nanoparticles was probed by measuring the zeta potential (ZP) using a Zetasizer (Nano-ZS90, Malvern, UK). The ZP is a measure of the electrostatic repulsion forces between the nanoparticles. Figure 9 shows the ZP measurements of the PEG-coated Fe3O4 nanoparticles (sample S2) dissolved in deionized water. The ZP value for this sample was found to be +37.3 mV. This ZP value means that our sample has moderate stability [52], which means that some agglomerations exist in the sample due to the strong dipolar interactions. Hence, we suggest that particle agglomerations have influence on the magnetic properties of these nanoparticles. The bifurcation of the FC and ZFC curves at high temperature could be a signature of these interparticle interactions.
Hence all of the above mentioned common features of the ZFC and FCC curves could be attributed to the existence of surface spin-glass structures and some agglomerations. The inset of Figure 8a shows an enlargement of the magnetization in sample S1 at temperatures below 100 K, where a small dip in magnetization occurred at 80 K. This behavior was absent in the other two samples. This suggests that the surface spin-glass effects are more pronounced in this sample compared with the other two larger samples.
We have also investigated the effect of nanoparticle size on the saturation magnetization and coercivity in these samples. Figure 10a,b displays the magnetic hysteresis loops for all the samples at 2 K and 300 K.
Typical hysteresis curves were obtained at several other temperatures (50, 100, and 200 K). The saturation magnetization and coercivity were deduced from the magnetic hysteresis loops and are presented in Figure 11a,b as a function of particle size. As can be seen in Figure 11, both the coercivity and the saturation magnetization show non-monotonic behavior with size at nearly all temperatures. At 200 K and 300 K, the saturation magnetization show a decrease followed by an increase with increasing size. These non-monotonic behaviors of the coercivity and saturation magnetization could not be attributed to size effects. Hence, we suggest that such non-monotonic behavior of magnetic properties could be attributed to the existence of surface spin-glass effects.
To confirm the existence of the spin-glass behavior of these samples, we have conducted ac magnetic susceptibility measurements on one of the samples, S2.
The temperature and frequency-dependent ac susceptibility, χ ( T , f ) measurements were carried out using a vibrating sample magnetometer (VSM) down to 2 K with the frequency in the range from 17 Hz to 197 Hz. The probing field, Hac, was fixed to 10 Oe, and χ ( T , f ) was recorded with frequencies f = 17, 41, 97, and 197 Hz without any dc biasing field. During the ac susceptibility measurements, the sample was first zero-field cooled to the base temperature and χ ( T , f ) was recorded in the heating run. The real (in phase) χ ( T , f ) , and the imaginary (out of phase) χ ( T , f ) ac susceptibilities are shown in Figure 12. The data clearly show frequency dependence almost throughout the whole temperature region up to 300 K. This is one of the known signatures of spin-glass behavior [51]. As can be seen in Figure 12b, there are two peaks in χ ( T , f ) where the peaks and the temperatures at the peaks shift to larger values as the frequency increases. These two peaks could be due to two different behaviors; the freezing of surface spins (which results in the spin glass structure) and the blocking of the core moments [52].
Hence, we can attribute the deviations of the temperature-dependent coercivity and saturation magnetization from the Kneller’s and Block’s laws in these samples to finite size effect (small sizes) inter-particle interactions, and to the existence of surface spin-glass structures. Dipolar inter-particle interactions and the spin-glass structures (which resulted from the frozen canted spins at the surface) are suggested to cause the non-monotonic behavior of the size-dependent coercivity and saturation magnetization.

4. Conclusions

We have successfully synthesized several sizes of PEG-coated magnetic Fe3O4 nanoparticles by the co-precipitation method. The phase purity of the samples was confirmed by X-ray diffraction (XRD) analysis. Dc and ac magnetization measurements were conducted on these samples. The temperature-dependent of both the coercivity and saturation magnetization were found to significantly deviate from the original Kneller’s and Bloch’s laws. The size-dependence of both the coercivity and saturation magnetization were found to be non-monotonic. These findings were attributed mainly to finite size effects in addition to the existence of particle agglomerations and spin glass structures.

Acknowledgments

This work was financially supported by the UAEU Program for Advanced Research (UPAR) under Grant no. 31S162.

Author Contributions

I.M. Obaidat conceived and designed the experiments; Chiranjib Nayek synthesized the samples and carried out the XRD measurements; Kaustuv Manna conducted the magnetization measurements; Gourab Bhattacharjee performed the TEM measurements; Chiranjib Nayek and I.M. Obaidat analyzed the data; I.M. Obaidat and Chiranjib Nayek wrote the manuscript and I.M. Obaidat and P. Murugavel finalized the discussion of the findings.

Conflicts of Interest

The authors declare no conflict of interest.

References

  1. Gu, H.; Xu, K.; Xu, C.; Xu, B. Biofunctional magnetic nanoparticles for protein separation and pathogen detection. Chem. Comm. 2006, 6, 941–949. [Google Scholar] [CrossRef] [PubMed]
  2. Roger, J.; Pons, J.N.; Massart, R.; Halbreich, A.; Bacri, J.C. Some biomedical applications of ferrofluids. Eur. Phys. J. AP 1999, 5, 321–325. [Google Scholar] [CrossRef]
  3. Wunderbaldinger, P.; Josephson, L.; Weissleder, R. Tat peptide directs enhanced clearance and hepatic permeability of magnetic nanoparticles. Bioconjug. Chem. 2002, 13, 264–268. [Google Scholar] [CrossRef] [PubMed]
  4. Ota, S.; Yamazaki, N.; Tomitaka, A.; Yamada, T.; Takemura, Y. Hyperthermia using antibody—Conjugated magnetic nanoparticles and its enhanced effect with cryptotanshinone. Nanomaterials 2014, 4, 319–330. [Google Scholar] [CrossRef] [PubMed]
  5. Nairan, A.; Khan, U.; Iqbal, M.; Khan, M.; Javed, K.; Riaz, S.; Naseem, S.; Han, X. Structural and magnetic response in bimetallic core/shell magnetic nanoparticles. Nanomaterials 2016, 6, 72. [Google Scholar] [CrossRef] [PubMed]
  6. Matsui, M.; Todo, S.; Chikazumi, S. Magnetization of Low Temperature Phase of Fe3O4. J. Phys. Soc. Jpn. 1977, 43, 47–52. [Google Scholar] [CrossRef]
  7. Wei, Y.; Han, B.; Hu, X.; Lin, Y.; Wang, X.; Deng, X. Synthesis of Fe3O4 nanoparticles and their magnetic properties. Procedia Eng. 2012, 27, 632–637. [Google Scholar] [CrossRef]
  8. Sato, T.; Nagaoka, K.; Kobayashi, S.; Manjanna, J.; Murakami, T. Temperature dependence of magnetic hysteresis scaling for cubic Fe3O4 nanoparticles. AIP Adv. 2017, 7, 056319. [Google Scholar] [CrossRef]
  9. Anbarasu, M.; Anandan, M.; Chinnasamy, E.; Gopinath, V.; Balamurugan, K. Synthesis and characterization of polyethylene glycol (PEG) coated Fe3O4 nanoparticles by chemical co-precipitation method for biomedical applications. Spectrochim. Acta Mol. Biomol. Spectrosc. 2015, 135, 536–539. [Google Scholar] [CrossRef] [PubMed]
  10. Auzans, E.; Zins, D.; Blums, E.; Massart, R. Synthesis and properties of Mn-Zn ferrite ferrofluids. J. Mater. Sci. 1999, 34, 1253–1260. [Google Scholar] [CrossRef]
  11. Zaitsev, V.S.; Filimonov, D.S.; Presnyakov, I.A.; Gambino, R.J.; Chu, B. Physical and chemical properties of magnetite and magnetite-polymer nanoparticles and their colloidal dispersions. J. Colloid Interface Sci. 1999, 212, 49–57. [Google Scholar] [CrossRef] [PubMed]
  12. Orive, G.; Ali, O.A.; Anitua, E.; Pedraz, J.L.; Emerich, D.F. Biomaterial-based technologies for brain anti-cancer therapeutics and imaging. Biochim. Biophys. Acta 2010, 1806, 96–107. [Google Scholar] [CrossRef] [PubMed]
  13. Kateb, B.; Chiu, K.; Black, K.L.; Yamamoto, V.; Khalsa, B.; Ljubimova, J.Y.; Ding, H.; Patil, R.; Portilla-Arias, J.A.; Modo, M.; et al. Nanoplatforms for constructing new approaches to cancer treatment, imaging, and drug delivery: What should be the policy? NeuroImage 2011, 54, S106–S124. [Google Scholar] [CrossRef] [PubMed]
  14. Butterworth, M.D.; Illum, L.; Davis, S.S. Preparation of ultrafine silica- and PEG-coated magnetite Particles. Colloids Surf. A 2001, 179, 93–102. [Google Scholar] [CrossRef]
  15. Josephson, L.; Tung, C.H.; Moore, A.; Weissleder, R. High-efficiency intracellular magnetic labeling with novel superparamagnetic-tat peptide conjugates. Bioconjug. Chem. 1999, 10, 186–191. [Google Scholar] [CrossRef] [PubMed]
  16. Kim, D.K.; Mikhaylova, M.; Zhang, Y.; Muhammed, M. Protective coating of superparamagnetic iron oxide nanoparticles. Chem. Mater. 2003, 15, 1617–1627. [Google Scholar] [CrossRef]
  17. Liu, Q.; Xu, Z. Self-assembled monolayer coatings on nanosized magnetic particles using 16-mercaptohexadecanoic acid. Langmuir 1995, 11, 4617–4622. [Google Scholar] [CrossRef]
  18. Bautista, M.C.; Bomati-Miguel, O.; Zhao, X.; Morales, M.P.; González-Carreño, T.; de Alejo, R.P.; Ruiz-Cabello, J.; Veintemillas-Verdaguer, S. Comparative study of ferrofluids based on dextran-coated iron oxide and metal nanoparticles for contrast agents in magnetic resonance imaging. Nanotechnology 2004, 15, S154–S159. [Google Scholar] [CrossRef]
  19. Berry, C.C.; Wells, S.; Charles, S.; Aitchison, G.; Curtis, A.S.G. Cell response to dextran-derivatised iron oxide nanoparticles post internalization. Biomaterials 2004, 25, 5405–5413. [Google Scholar] [CrossRef] [PubMed]
  20. Portet, D.; Denizot, B.; Rump, E.; Lejeune, J.J.; Jallet, P. Nonpolymeric coatings of iron oxide colloids for biological use as magnetic resonance imaging contrast agents. J. Colloid Interface Sci. 2001, 238, 37–42. [Google Scholar] [CrossRef] [PubMed]
  21. Zhang, Y.; Sun, C.; Kohler, N.; Zhang, M.Q. Self-Assembled coatings on individual monodisperse magnetic nanoparticles for efficient intracellular uptake. Biomed. Microdevices 2004, 6, 33–40. [Google Scholar] [CrossRef] [PubMed]
  22. Gubin, S.P.; Koksharov, Y.A.; Khomutov, G.B.; Yurkov, G.Y. Magnetic nanoparticles: Preparation, structure and properties. Russ. Chem. Rev. 2005, 74, 489–520. [Google Scholar] [CrossRef]
  23. Guimarães, A.P. Principles of Nanomagnetism; Springer: Berlin/Heidelberg, Germany, 2009; ISBN 978-3-642-01482-6. [Google Scholar]
  24. Batlle, X.; Labarta, A. Finite-size effects in fine particles: Magnetic and transport properties. J. Phys. D Appl. Phys. 2002, 35, R15–R42. [Google Scholar] [CrossRef]
  25. Julia, A.; Paolo, A.; Paola, T.; Marco, S. Poly(ethyleneglycol)-coated Fe3O4 nanoparticles by UV-thiol-ene addition of PEG dithiol on vinyl-functionalized magnetite surface. Macromol. Chem. Phys. 2011, 212, 1629–1635. [Google Scholar] [CrossRef]
  26. Mukhopadhyay, A.; Joshi, N.; Chattopadhyay, K.; De, G. A facile synthesis of PEG-coated magnetite (Fe3O4) nanoparticles and their prevention of the reduction of cytochrome c. ACS Appl. Mater. Interfaces 2012, 4, 142–149. [Google Scholar] [CrossRef] [PubMed]
  27. Harandi, S.S.; Karimipour, A.; Afrand, M.; Akbari, M.; D’Orazio, A. An experimental study on thermal conductivity of F-MWCNTs–Fe3O4/EG hybrid nanofluid: Effects of temperature and concentration. Int. Commun. Heat Mass 2016, 76, 171–177. [Google Scholar] [CrossRef]
  28. Rabanel, J.-M.; Hildgen, P.; Banquy, X. Assessment of PEG on polymeric particles surface, a key step in drug carrier translation. J. Control. Release 2014, 185, 71–87. [Google Scholar] [CrossRef] [PubMed]
  29. Maaz, K.; Mumtaz, A.; Hasanain, S.K.; Bertino, M.F. Temperature dependent coercivity and magnetization of nickel ferrite nanoparticles. J. Magn. Magn. Mater. 2010, 322, 2199–2202. [Google Scholar] [CrossRef]
  30. Kneller, E.F.; Luborsky, F.E. Particle size dependence of coercivity and remanence of single-domain particles. J. Appl. Phys. 1963, 34, 656–658. [Google Scholar] [CrossRef]
  31. Batlle, X.; Garcia del Muro, M.; Tejada, J.; Pfeiffer, H.; Gornert, P.; Sinn, E. Magnetic study of M-type doped barium ferrite nanocrystalline powders. J. Appl. Phys. 1993, 74, 3333–3340. [Google Scholar] [CrossRef]
  32. Bloch, F. Zur theorie des ferromagnetismus. Z. Phys. 1931, 61, 206–219. [Google Scholar] [CrossRef]
  33. Della Torre, E.; Bennett, L.H.; Watson, R.E. Extension of the bloch T3/2 law to magnetic nanostructures: Bose-einstein condensation. Phys. Rev. Lett. 2005, 94, 147210. [Google Scholar] [CrossRef] [PubMed]
  34. Senz, V.; Röhlsberger, R.; Bansmann, J.; Leupold, O.; Meiwes-Broer, K.-H. Temperature dependence of the magnetization in Fe islands on W (110): Evidence for spin-wave quantization. New J. Phys. 2003, 5, 47. [Google Scholar] [CrossRef]
  35. Hendriksen, P.V.; Linderoth, S.; Lindgard, P.A. Finite-size effects in the magnetic properties of ferromagnetic clusters. J. Magn. Magn. Mater. 1992, 104–107, 1577–1579. [Google Scholar] [CrossRef]
  36. Hendriksen, P.V.; Linderoth, S.; Lindgard, P.A. Finite-size modifications of the magnetic properties of clusters. Phys. Rev. B 1993, 48, 7259–7273. [Google Scholar] [CrossRef]
  37. Linderoth, S.; Balcells, L.; Labarta, A.; Tejada, J.; Hendriksen, P.V.; Sethi, S.A. Magnetization and Mossbauer studies of ultrafine Fe-C particles. J. Magn. Magn. Mater. 1993, 124, 269–276. [Google Scholar] [CrossRef]
  38. Eggeman, A.S.; Petford-Long, A.K.; Dobson, P.J.; Wiggins, J.; Bromwich, T.; Dunin-Borkowski, R.; Kasama, T. Synthesis and characterisation of silica encapsulated cobalt nanoparticles and nanoparticle chains. J. Magn. Magn. Mater. 2006, 301, 336–342. [Google Scholar] [CrossRef]
  39. Cojocaru, S.; Naddeo, A.; Citro, R. Modification of the Bloch law in ferromagnetic nanostructure. Europhys. Lett. 2014, 106, 17001. [Google Scholar] [CrossRef]
  40. Ortega, D.; Vélez-Fort, E.; García, D.A.; García, R.; Litrán, R.; Barrera-Solano, C.; Ramírez-del-Solar, M.; Domínguez, M. Size and surface effects in the magnetic properties of maghemite and magnetite coated nanoparticles. Phil. Trans. R. Soc. A 2010, 368, 4407–4418. [Google Scholar] [CrossRef] [PubMed]
  41. Gubin, S.P. (Ed.) Magnetic Nanoparticles; Wiley-VCH: Berlin, Germany, 2009; ISBN 978-3-527-40790-3. [Google Scholar]
  42. Alves, C.R.; Aquino, R.; Sousa, M.H.; Rechenberg, H.R.; Goya, G.F.; Tourinho, F.A.; Depeyrot, J. Low temperature experimental investigation of finite-size and surface effects in CuFe2O4 nanoparticles of ferrofluids. J. Met. Nanocrys. Mater. 2004, 20–21, 694–699. [Google Scholar] [CrossRef]
  43. Mandal, K.; Mitra, S.; Kumar, P.A. Deviation from Bloch T3/2 law in ferrite nanoparticles. Europhys. Lett. 2006, 75, 618–623. [Google Scholar] [CrossRef]
  44. Kumar, P.A.; Mandal, K. Effect of spatial confinement on spin-wave spectrum: Low temperature deviation from Bloch T3/2 law in Co nanoparticles. arXiv, 2004; arXiv:cond-mat/0701152v1. [Google Scholar]
  45. Mathur, P.; Thakur, A.; Singh, M. Effect of nanoparticles on the magnetic properties of Mn-Zn soft ferrite. J. Magn. Magn. Mater. 2008, 320, 1364–1369. [Google Scholar] [CrossRef]
  46. Tung, L.D.; Kolesnichenko, V.; Caruntu, D.; Chou, N.H.; O’Connor, C.J.; Spinu, L. Magnetic properties of ultrafine cobalt ferrite particles. J. Appl. Phys. 2016, 93, 7486–7488. [Google Scholar] [CrossRef]
  47. Morup, S. Comment on “Deviation from the Bloch T3/2 law in ferrite nanoparticles” by K. Mandal et al. Europhys. Lett. 2007, 77, 27003. [Google Scholar] [CrossRef]
  48. Kodama, R.H.; Berkowitz, A.E.; Mcniff, E.J.; Foner, S. Surface spin disorder in ferrite nanoparticles (invited). J. Appl. Phys. 1997, 81, 5552–5557. [Google Scholar] [CrossRef]
  49. Kodama, R.H.; Berkowitz, A.E. Atomic-scale magnetic modeling of oxide nanoparticles. Phys. Rev. B 1999, 59, 6321–6336. [Google Scholar] [CrossRef]
  50. Alves, C.R.; Aquino, R.; Depeyrot, J.; Cotta, T.A.P.; Sousa, M.H.; Tourinho, F.A.; Rechenberg, H.R.; Goya, G.F. Surface spin freezing of ferrite nanoparticles evidenced by magnetization Measurements. J. Appl. Phys. 2006, 99, 08M905. [Google Scholar] [CrossRef]
  51. Mørup, S.; Brok, E.; Frandsen, C. Spin Structures in Magnetic Nanoparticles. J. Nanomater. 2013, 2013, 720629. [Google Scholar] [CrossRef]
  52. Greenwood, R.; Kendall, K. Selection of Suitable Dispersants for Aqueous Suspensions of Zirconia and Titania Powders using Acoustophoresis. J. Eur. Ceram. Soc. 1999, 19, 479–488. [Google Scholar] [CrossRef]
Figure 1. XRD patterns of sample (a) S1; (b) S2; and (c) S3.
Magnetochemistry 03 00019 g001
Figure 2. (a) TEM image and (b) high resolution transmission electron microscopy (HRTEM) image of sample S1; (c) TEM image and (d) HRTEM image of sample S2; (e) TEM image and (f) HRTEM image of sample S3. The insets show the size histograms and the selected area electron diffraction (SAED) patterns confirming the polycrystalline nature of the samples.
Magnetochemistry 03 00019 g002
Figure 3. The FTIR spectra of the Polyethylene glycol (PEG) coatings of the samples, (a) for sample S1, (b) for sample S2, and (c) for sample S3.
Magnetochemistry 03 00019 g003
Figure 4. Magnetic field (H) dependence magnetization (M) for samples (a) S1; (b) S2; (c) S3. The insets show the low filed region around the center of the loops.
Magnetochemistry 03 00019 g004
Figure 5. Temperature-dependent coercivity (HC) under zero field-cooling conditions for samples (a) S1; (b) S2; and (c) S3. The insets show the fitted data corresponding to each sample.
Magnetochemistry 03 00019 g005
Figure 6. Temperature-dependent saturation magnetization (MS) for samples S1 (open circle), for S2 (solid triangle), and S3 (solid square), respectively, under zero field-cooling conditions.
Magnetochemistry 03 00019 g006
Figure 7. The Kneller’s exponent (αK) and the Bloch’s (αB) exponent versus particle diameter. The inset shows the absolute differences of the Kneller’s and Bloch’s exponents from the exponents in the original laws.
Magnetochemistry 03 00019 g007
Figure 8. (ac) represents the temperature-dependent magnetization measurements under ZFC and field-cooled cooling (FCC) conditions for all the samples measured at the field of 20 Oe. The inset in (a) is the FCC curve below 90 K.
Magnetochemistry 03 00019 g008
Figure 9. Zeta potential distribution of PEG-coated Fe3O4 nanoparticles of sample S2 using deionized water as the dispersant.
Magnetochemistry 03 00019 g009
Figure 10. Magnetic hysteresis loops for all samples at 2 K and 300 K. The insets show initial magnetization curves up to 3 T. (a) at 2 K, and (b) at 300 K.
Magnetochemistry 03 00019 g010
Figure 11. (a) Saturation magnetization and (b) coercivity as a function of the particle diameter at several temperatures.
Magnetochemistry 03 00019 g011
Figure 12. (a) The real χ ( T , f ) ; and (b) the imaginary χ ( T , f ) components of the ac susceptibility as a function of temperature at several frequencies.
Magnetochemistry 03 00019 g012
Table 1. The fitted magnetic parameters to the modified Kneller’s law.
SampleParticle Diameter (nm)Fitted Parameters at ZFC
From XRDFrom TEMH0 (emu/g)TB (K)αK
S112.1 ± 0.612 ± 0.9687 (±3.0)145 (±1.9)0.10
S214.7 ± 0.715 ± 0.7409 (±9.0)109 (±5.0)0.20
S316.1 ± 0.816 ± 0.7310 (±2.7)128 (±2.1)0.40
Table 2. The fitted magnetic parameters to the modified Bloch’s law.
Sample Fitted Parameters at ZFC
Particle Diameter (nm)M0 (emu/g)To (K)αB
S11277.6 (±0.2)905 (±15)2.1
S21577.8 (±0.19)964 (±15)1.7
S31683.3 (±0.1)1235 (±20)1.65

