Article

Crystal Structure and Magnetic Properties of Peacock–Weakley Type Polyoxometalates Na9[Ln(W5O18)2] (Ln = Tm, Yb): Rare Example of Tm(III) SMM

by
Oleksandra Yu. Mariichak
1,
Sandra Kaabel
2,†,
Yevgen A. Karpichev
2,
Georgiy M. Rozantsev
1,
Serhii V. Radio
1,*,
Céline Pichon
3,
Hélène Bolvin
4 and
Jean-Pascal Sutter
3,*
1
Department of Inorganic, Organic and Analytical Chemistry, Faculty of Chemistry, Biology and Biotechnology, Vasyl’ Stus Donetsk National University, 21021 Vinnytsia, Ukraine
2
Department of Chemistry and Biotechnology, Division of Chemistry, School of Science, Tallinn University of Technology, 19086 Tallinn, Estonia
3
Laboratoire de Chimie de Coordination (LCC-CNRS), Université de Toulouse, CNRS, 31077 Toulouse, France
4
Laboratoire de Chimie et de Physique Quantiques, Université de Toulouse, CNRS, 31400 Toulouse, France
*
Authors to whom correspondence should be addressed.
Present address: Department of Chemistry, McGill University, 801 Sherbrooke Street West, Montreal, QC H3A 0B8, Canada.
Magnetochemistry 2020, 6(4), 53; https://doi.org/10.3390/magnetochemistry6040053
Submission received: 1 October 2020 / Revised: 14 October 2020 / Accepted: 16 October 2020 / Published: 21 October 2020
(This article belongs to the Special Issue From Magnetic Anisotropy to Molecular Magnets: Theory and Experiments)

Abstract

:
We report Peacock–Weakley complexes, Na9[Ln(W5O18)2]∙35H2O, formed with Tm(III), 1, and Yb(III), 2. Their syntheses, physico-chemical characterizations, crystal structures, and magnetic properties are described. Ab initio calculations are also reported. These polyoxometalate (POM) complexes were obtained using original synthetic conditions where acidification was performed with a stoichiometric amount of nitric acid to an acidity of Z = ν(H+)/ν(WO42–) = 8/10 = 0.80. Both the Tm(III) and Yb(III) derivatives were found to exhibit field-induced slow relaxation of their magnetization likely controlled by Raman and Orbach relaxation processes. 1 is a rare example of a Tm(III)-based single-molecule magnet (SMM) and is a consequence of the oblate tetragonal anti-prismatic symmetry of the coordination sphere.

Graphical Abstract

1. Introduction

Single-molecule magnets (SMMs) are paramagnetic molecules exhibiting a slow relaxation of the magnetization and magnetic hysteresis akin to bulk magnets [1]. The first observation of magnet-like behavior in mononuclear lanthanide complexes in 2003 [2] stimulated tremendous interest. This unique magnetic behavior results from the strong spin-orbit coupling (SOC) and large magnetic moment of Ln(III) ions when the appropriate electronic configuration and geometry are selected. Indeed, first-order SOC leads to quite large and unquenched orbital contributions to the magnetic moment (except for 1S0 and 8S7/2 ground electronic terms) while the ligand field acts as a weaker perturbation. The lanthanide symmetry and coordination sphere control the local magnetic anisotropy and the relaxation properties as evidenced by numerous magneto-structural studies [3,4,5,6].
The performances of mononuclear Ln(III) SMMs are enhanced in compounds with highly axial symmetry by the suppression of quantum tunneling of magnetization (QTM), a situation that applies in sandwich-type complexes. The best lanthanide single-center SMM to date is an organometallic Dy(III) complex, [(CpiPr5)Dy(Cp*)]+ (where CpiPr5 = penta-iso-propylcyclopentadienyl and Cp* = pentamethylcyclopentadienyl) with a record energy barrier of Ueff/kB = 2217 K resulting in a blocking of the magnetization below 80 K [7]. Polyoxometalates have also been considered as ligands for controlling the coordination geometry of Ln ions. For instance, Peacock–Weakley structures have been shown to impose highly symmetric square antiprism geometry to lanthanides as illustrated with Nd, Tb, Dy, Ho, and Er ions, some of which were found to behave as SMMs [8,9,10]. Herein, the Tm(III) and Yb(III) homologues were also shown to exhibit slow relaxation of their magnetization.
The syntheses, physico-chemical characterizations, crystal structures, and magnetic properties of Peacock–Weakley complexes, Na9[Ln(W5O18)2]∙35H2O, formed with Tm(III), 1, and Yb(III), 2, are described. In-field slow relaxation of the magnetization was observed for both derivatives, which is discussed considering the results of ab initio calculations. While examples of Yb-based SMMs are well documented [11], only very few Tm derivatives were found to exhibit SMM behaviors, and all appear to be organometallic compounds [12,13,14].

2. Results and Discussion

2.1. Synthesis

The classical procedure to obtain lanthanide heteropoly anion salts [Ln(W5O18)2]9– is the protocol proposed by Peacock and Weakley in 1971 [15] in which acetic acid was used for acidification of the solution to pH 7.0–7.5. In the present work, acidification was instead conducted with a stoichiometric amount of nitric acid to an acidity of Z = ν(H+)/ν(WO42–) = 8/10 = 0.80. Acidity Z = 0.80 in the presence of stoichiometric amounts of initial ions corresponded to the formation of heteropoly decatungstolanthanidate(III) anions [16,17,18]:
Ln3+ + 10 WO42− + 8H+ ⇆ [Ln(W5O18)2]9− + 4 H2O.
The equilibria in the systems [Ln(W5O18)2]9– − H+(OH) − H2O (Ln = Nd, Gd, Ho) at various Z ranges were previously studied by pH–potentiometry and mathematical modeling [16,17,18]. This showed that, at Z = 0.80, the ions [Ln(W5O18)2]9– (50 mol.%) and H[Ln(W5O18)2]8– (35 mol.%), are predominant in the solution with molar amounts of the WO42– and [Ln(W5O18)(H2O)n]3– ions. A typical synthesis of Peacock–Weakley complexes in acetic acid acidified solution leads to the formation of a buffer solution, which facilitates both the formation of acid salts as well as the possible hydrolysis of high-charge anions.
This leads to the isolation of either neutral or acid salts. For example at pH 7.0–7.5, Hn[Ln(W5O18)2](9–n)– (n = 1–3) species are predominant, whereas the acid salts are stabilized at lower pH values and [Ln(W5O18)2]9– salts favored at higher pH values. Thus, salts with different numbers of hydrogen atoms (0–3) were obtained at very close pH values: Na9[Ln(W5O18)2]∙35H2O (Ln = Tb, Dy; pH 7.4–7.5) [19,20], Na9[Ln(W5O18)2]∙35H2O (Ln = Nd, Tb, Dy, Ho, Er; pH 7.2) [8,9], Na9[Eu(W5O18)2]∙nH2O (n = 32 [21], n = 35 [22]; pH 7.0–7.5), Na8H[Gd(W5O18)2]∙30H2O (pH 7.3) [23], K3Na4H2[Gd(W5O18)2]∙21H2O (pH 7.3) [24], Na7H2[Ln(W5O18)2]∙nH2O (Ln = La, Ce, Pr, Nd, Sm, Eu, Gd, Dy, Ho, Er, Yb; pH 7.2) [25], and Na6H3[Sm(W5O18)2]∙28H2O (pH 7.0) [26].
Such a situation does not apply with nitric acid. HNO3 does not lead to the formation of a buffer solution and allows us to consider the H+ ions introduced as a reactant that is completely consumed in the self-assembly reaction of the anion [Ln(W5O18)2]9–. Following this approach, the heteropoly anions [Ln(W5O18)2]9– with Ln = Tm (1) or Yb (2) were crystallized by slow evaporation.
Solid state infrared spectra of the two complexes have been collected showing the characteristic O-W-O bands of the POM (See Experimental section). Scanning electron microscopy (SEM) suggested single-phases for the synthesized salts 1 and 2 as SEM-images of triturated samples showed no zones with different surface morphology (Supporting Information, Figures S12–S15). This was confirmed by X-ray powder diffraction data (Figure S3).

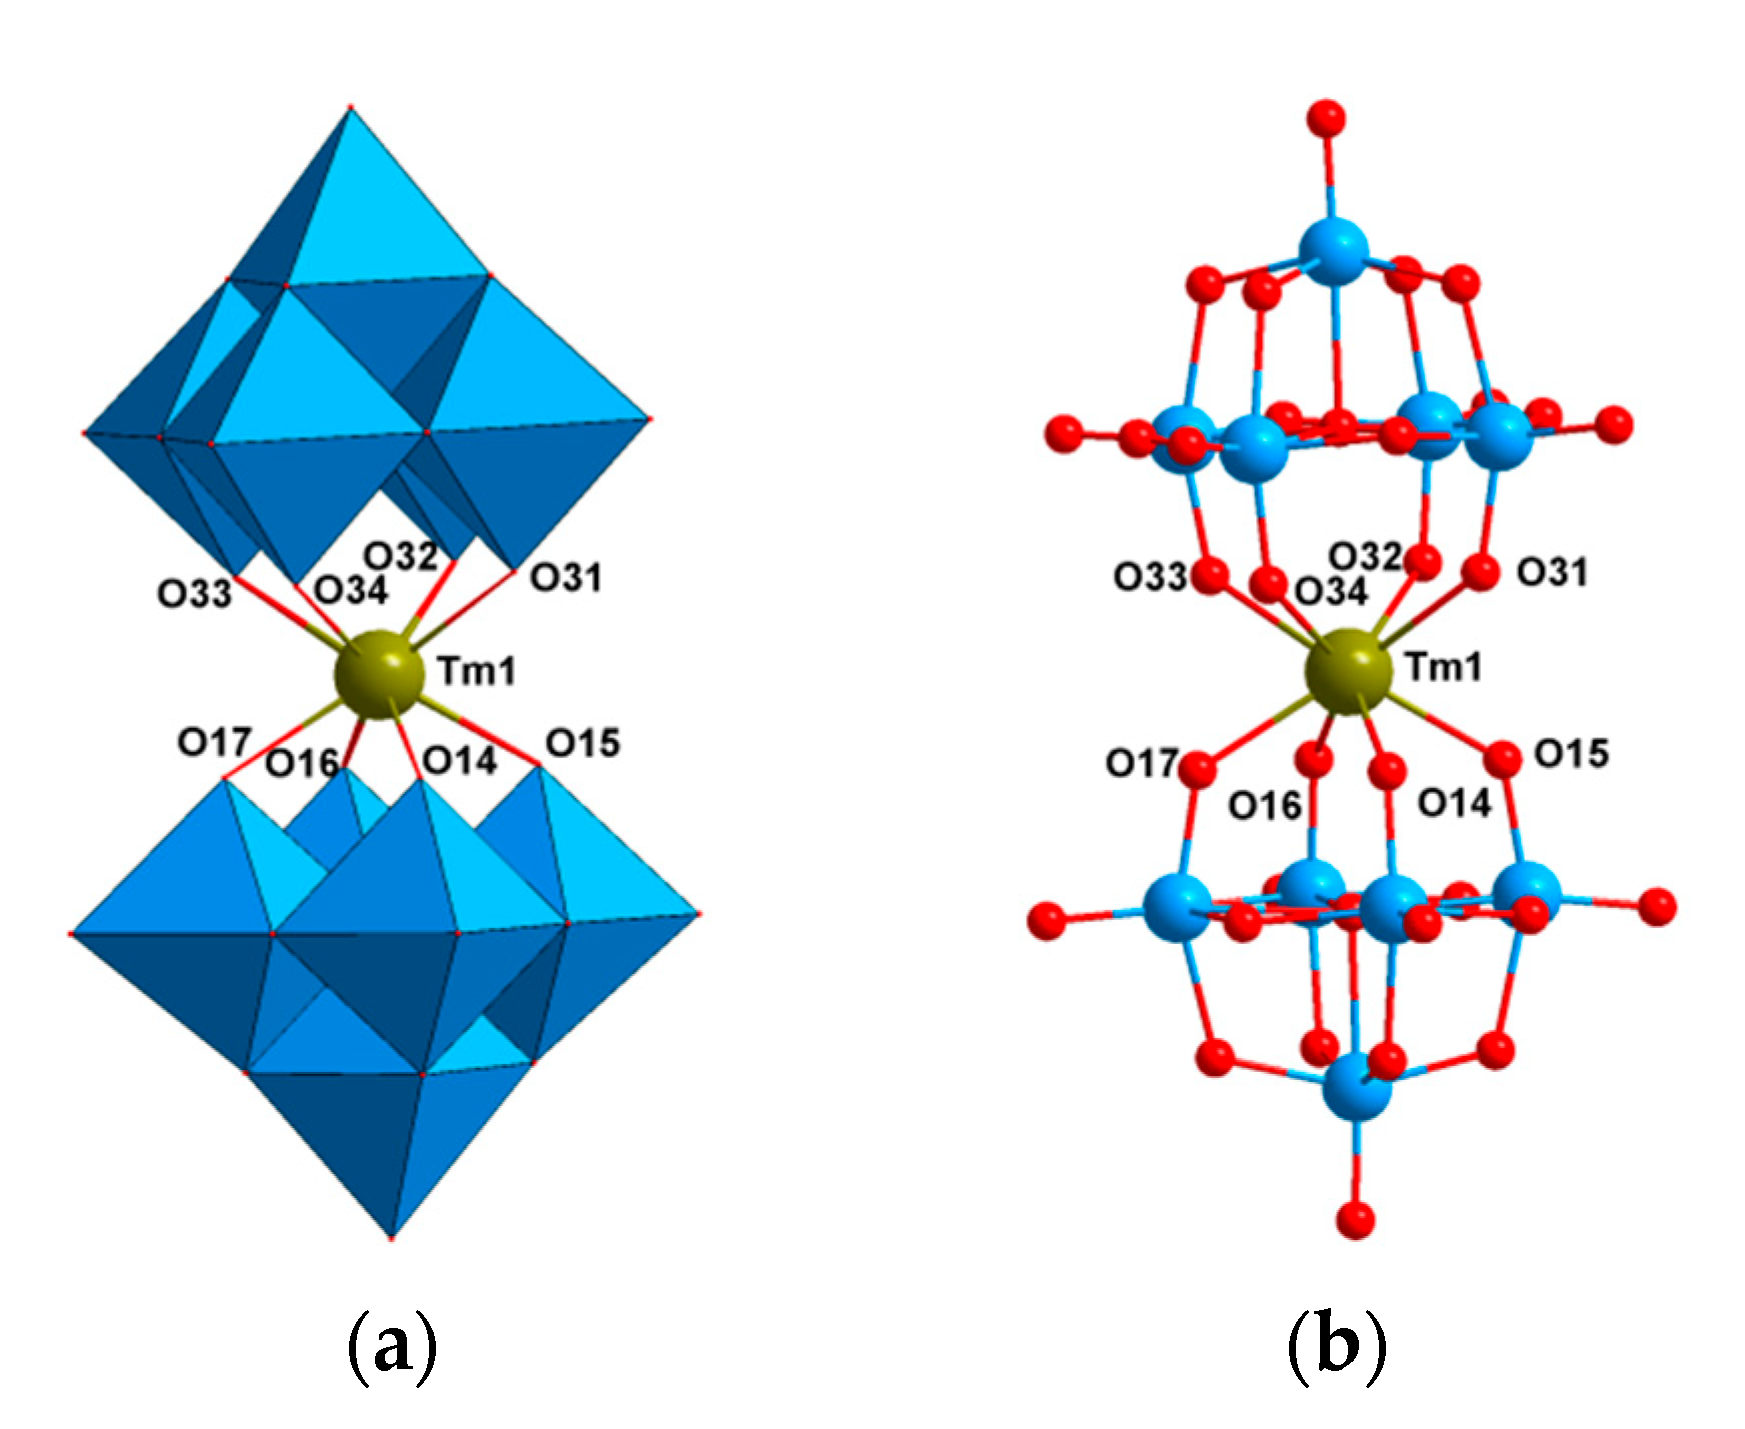
2.2. Crystal Structures

The structures for 1 and 2 were solved using single crystal X-ray diffraction. The main crystallographic data and refinement parameters are given in Table 1. Compounds 1 and 2 crystallize in the triclinic P-1 space group and their crystal structures are shown in Figure 1, Figures S1 and S2. The lanthanide atoms are sandwiched between two [W5O18]6− units, which behave as tetradentate ligands and may be regarded as derived by the removal of one terminal WO4+ group from the Lindqvist anion [W6O19]2– (Figure 1).
The central Ln(III) cation is coordinated by eight terminal oxygen atoms adopting a square antiprism geometry with a D4d pseudosymmetry. The evaluation of the polyhedral shapes by continuous shape measures [27,28] performed with SHAPE [29] indicated that the geometry around the lanthanide is highly symmetric and extremely close to an ideal square antiprism (Figure 1 and Table S1; shape value of 0.066 (1) and 0.063 (2) compared to 0 for an ideal geometry). The Ln–O bond lengths (Table 2) are in the range 2.31–2.38 Å (mean value 2.35 Å) for 1, and 2.33–2.36 Å (mean value 2.34 Å) for 2; the related bond angles are gathered in Table 3. The heteropoly anions are surrounded by a network of H2O-coordinated Na+ cations balancing their anionic charge and introducing 35 H2O molecules in the lattice, as was previously observed for other sodium salts with decatungstolanthanidate anions [8,9,10,19,20]. This complex system of hydrogen bonds and the bulkiness of the POM ligands resulted in an excellent isolation of the Ln(III) ions in the solid state with shortest lanthanide–lanthanide distances of 11.21 and 12.46 Å for 1 and 2, respectively (Figures S1c and S2d).

2.3. Magnetic Properties

The temperature dependence of the molar magnetic susceptibility, χM, for 1 and 2 between 2 and 300 K is depicted as χMT = f(T) in Figure 2. The values of 7.03 (1) and 2.50 (2) cm3 K mol−1 at 300 K are consistent with anticipated contributions for isolated ions (7.15 cm3 K mol−1 for Tm(III) with a 3H6, S = 1, L = 5, g6 = 7/6 ground state, and 2.57 cm3 K mol−1 for Yb(III) with 2H7/2, S = 1/2, L = 3, g7/2 = 8/7 ground state). When the temperature decreased, χMT continuously diminished for both compounds with a more rapid decrease below 10 K, reaching 5.8 cm3 K mol−1 for 1 and 1.26 cm3 K mol−1 for 2 at 2 K. These thermal dependences of χMT are due to the depopulation of the excited electronic (Stark) levels due to the crystal field effect. The field dependence of the magnetization recorded at 2 K (Figure 2) showed a rapid increase for low fields, and, above ca. 15 kOe, a very smooth augmentation to reach of 3.6 µB (1) and 2.0 µB (2) at 50 kOe; no hysteresis was observed. These values are similar to those reported for Tm(III) [12,14] and Yb(III) [30,31] systems, and they confirm that there is an important splitting of the ground J manifold by the ligands [32,33]. For the ground state with a pure MJ term, the saturation magnetization is given by MS = ½ × J × gJ. The MS values found for 1 and 2 suggest that the doublets with largest MJ (±6 for Tm(III) and between ±7/2 and ±5/2 for Yb(III)) are the ground states.
AC susceptibility studies were performed to probe the presence of slow magnetic relaxation in 1 and 2. In a zero field, an onset of the out-of-phase susceptibility χM”) component was found for the complexes, while, with the applied DC field, this emerged for all AC frequencies (Figures S4 and S8). Fast quantum tunneling of the magnetization (QTM) was likely operating at zero field and was reduced/suppressed with the field that lifted the energy level degeneracy of the mJ states. For 1, the longest relaxation time was found for HDC = 3 kOe, which was selected as the optimal field. For 2, while the maximum of the χM” = f(ν) curves shifted to lower frequencies with the field, a decrease of intensity was observed for HDC > 1.2 kOe (Figure S8); therefore, 1.2 kOe was chosen as the optimal field for 2. These respective fields were applied for the subsequent AC studies.

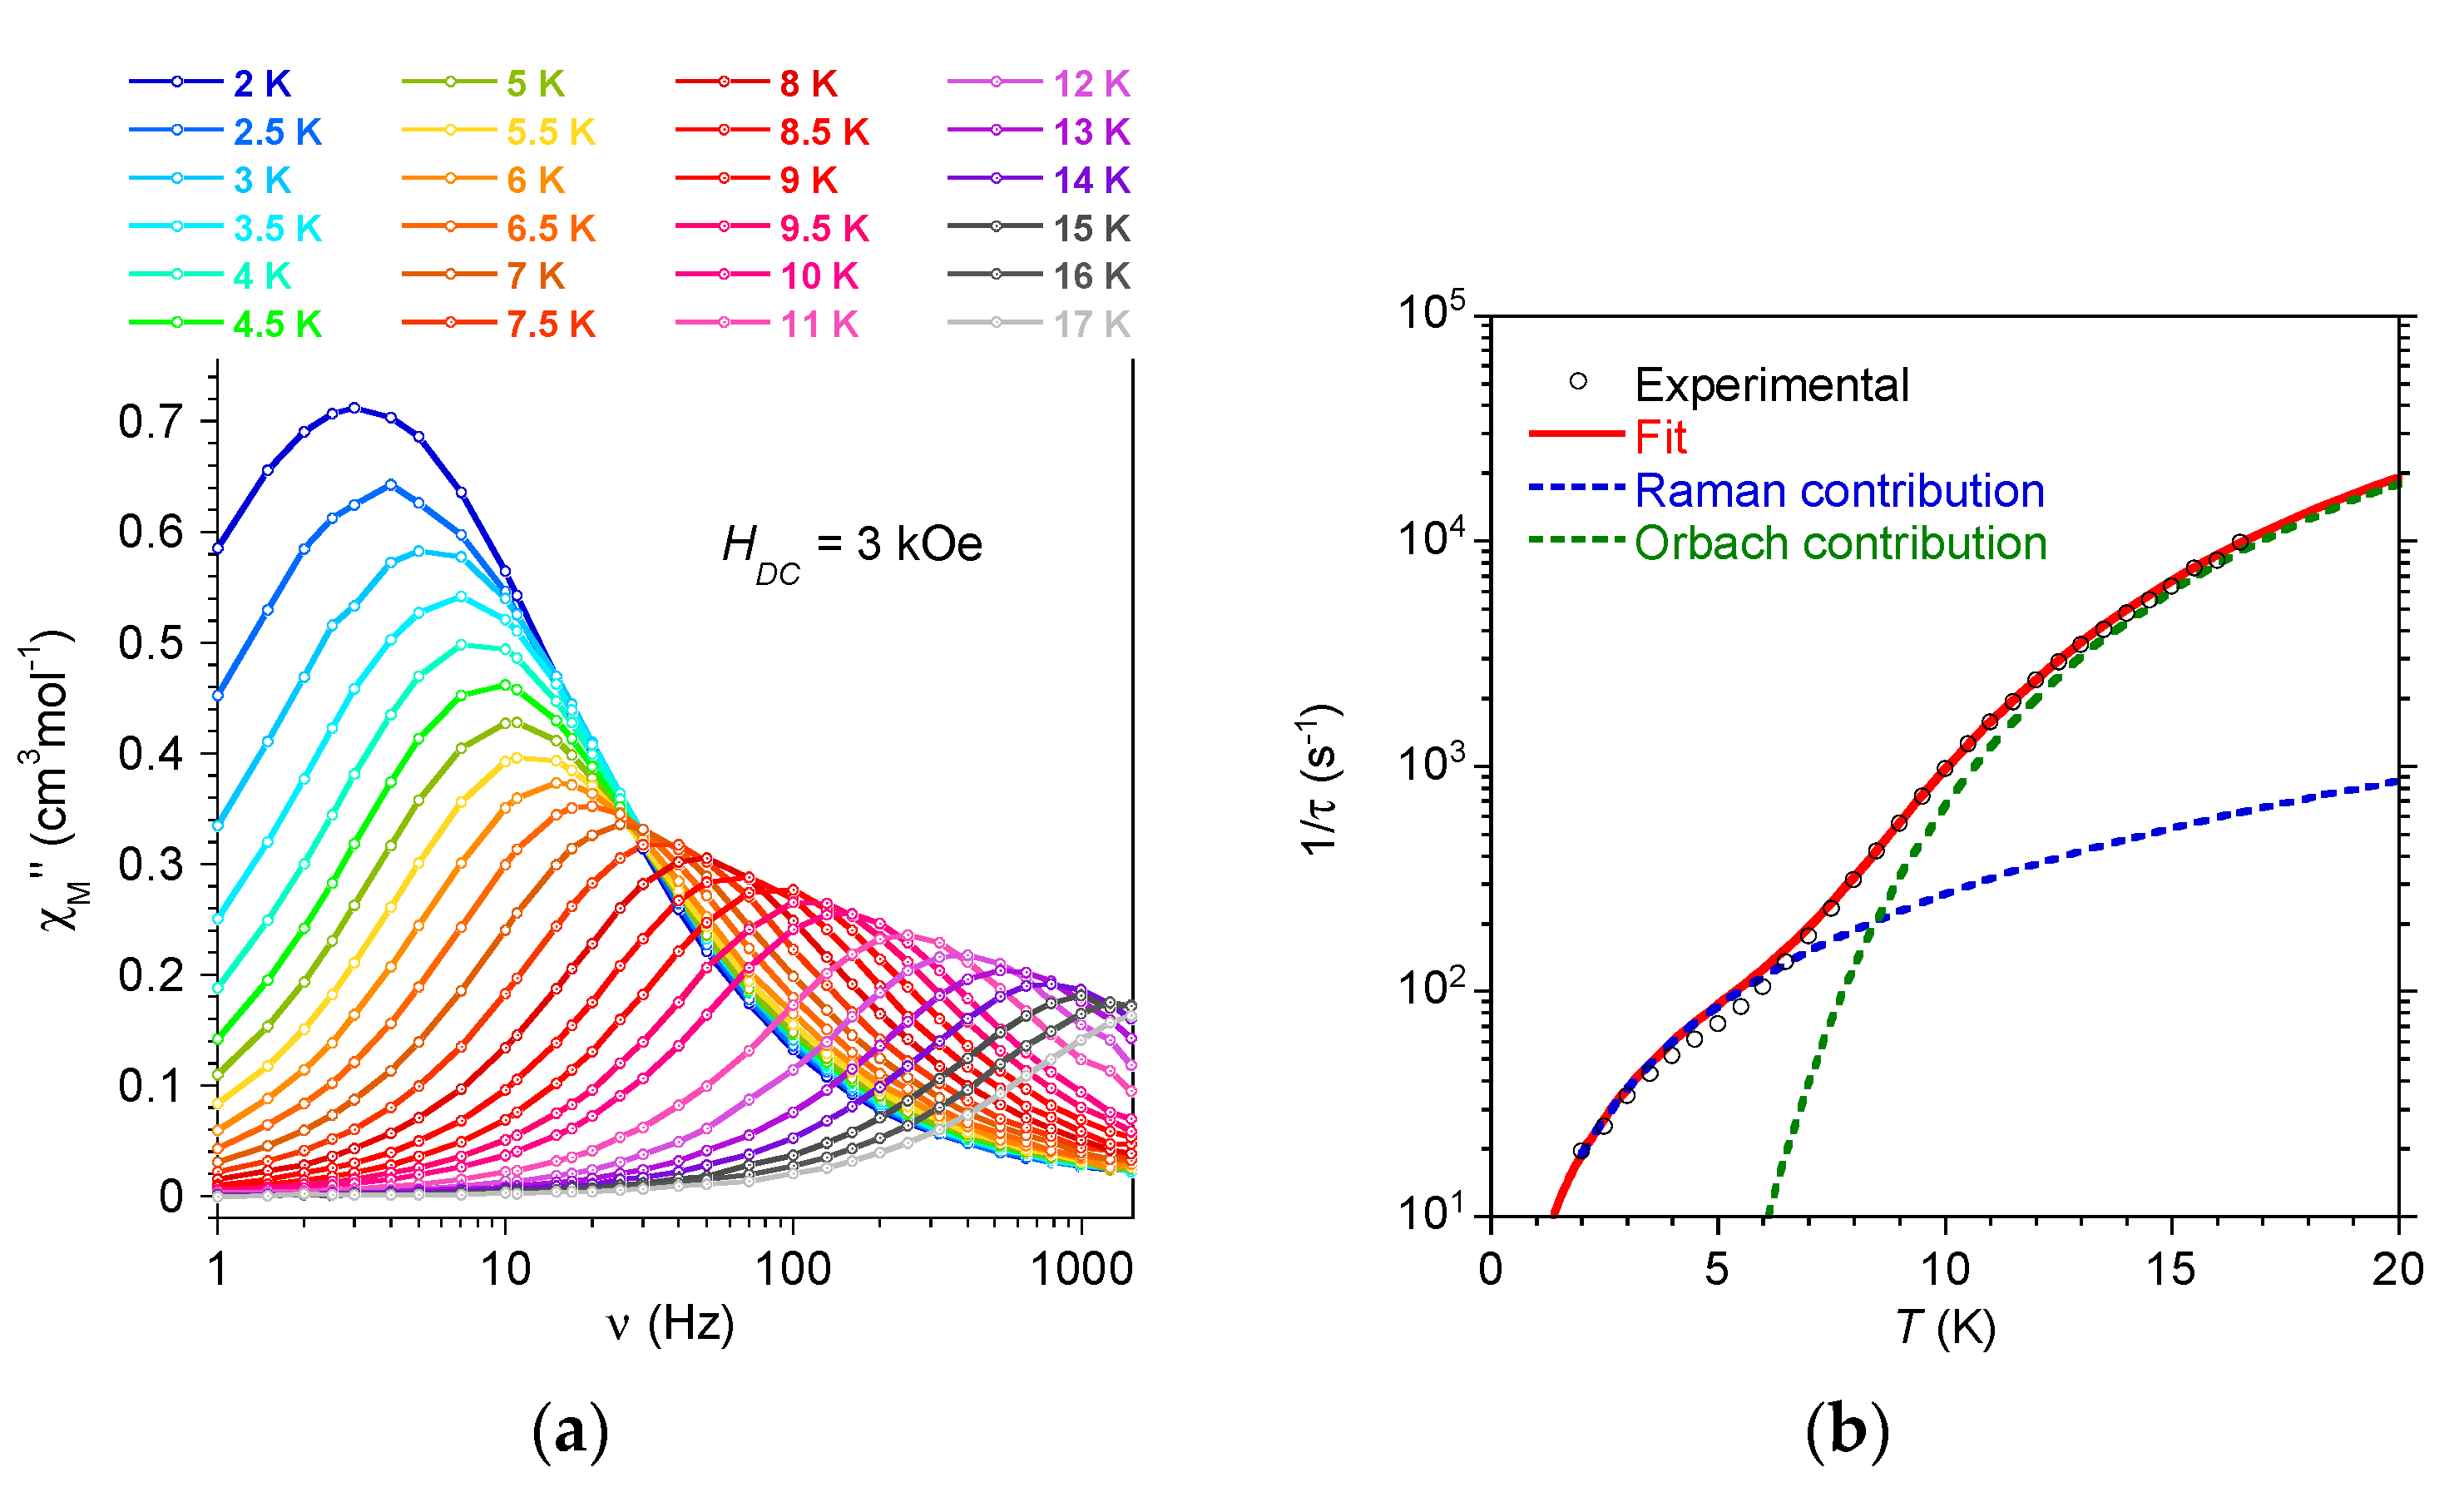
2.3.1. AC Behavior for Na9[Tm(W5O18)2], 1:

The frequency dependence of the AC signals for 1 was collected between 2 and 30 K for the frequency range 1–1500 Hz in a field of 3 kOe (Figure 3 and Figure S5). The data were fitted at each temperature using a generalized Debye model affording the relaxation time τ [34]. The thermal dependence of τ (Figure 3) clearly indicated the contribution of at least two relaxation mechanisms. This is supported by the distribution width, α, of the relaxation times deduced at each temperature by the analysis of the Cole–Cole plots (χM” = f(χM’), Figure S6) [35]. The values ranged between 0.01 for the high T domain to 0.28 at low T suggesting several contributions to the relaxation at lower temperatures. Spin-phonon processes, such as Raman, Orbach, and field-induced direct pathways, as well as QTM, may concomitantly be operating in the relaxation of mononuclear complexes [36,37]. In the expression of τ−1, given in equation 1, the terms from left to right account, respectively, for the direct, QTM, Raman, and Orbach process, where A, B, C, and n are coefficients and H is the magnetic field, T is the temperature, Ueff is the energy barrier, and τ is the pre-exponential time.
τ 1 = A H 2 T + B 1 + B 2 H 2 + C T n + τ 0 1 exp ( U e f f k B T )
Since the AC signal was collected in field, the QTM is expected to be cancelled; conversely, a degree of relaxation by a direct pathway might be expected. Therefore, direct, Raman, and Orbach pathways were considered to model the relaxation behavior of 1. The variation of τ over the whole temperature range was best reproduced for a combination of Raman and Orbach contributions (Figure 3b) with the following set of parameters: C = 6 ± 16 s−1K−n, n = 2 ± 1, τ0 = 2.1 ± 0.3 × 10⁻⁶ s, and Ueff/kB = 66 ± 3 K. However, the obtained Ueff is far smaller than the energy gap between the ground and first excited level by theoretical calculations (vide infra). Fairly good modeling was also obtained when the Raman and direct processes were considered (Figure S7a). Tentative modeling with other combinations of relaxation pathways gave poor results (see Figure S7). It appears, therefore, likely that the relaxation for 1 is mainly driven by a Raman pathway.
To date, the only reported POM-based Tm(III) complex is [TmP5W30O110]12− polyoxometalate but no SMM properties were found in this case [38]. Four organometallic Tm(III) compound incorporating the COT ligand were also reported to exhibit slow relaxation of the magnetization governed by several relaxation pathways. For [(Tp*)Tm0.05Y0.95(COT)], the analysis of the relaxation behavior by the Raman and Orbach processes gave an energy barrier of 111 K while for the homologous [(Tp)Tm0.05Y0.95(COT)], an energy barrier of 46 K was reported [12]. [K(18-crown-6)(THF)2][Tm(COT)2] was reported with an energy barrier Ueff/kB = 53.3 K whereas [Tm(COT)(THF)2], showed SMM behaviors exclusively under applied fields with a small energy barrier around 8 K [14]. [TmIII(DMF)4(H2O)3CoIII(CN)6] is another example of a Tm(III) complex with field-induced slow relaxation of the magnetization induced by the QTM, Raman, and Orbach pathways (Ueff/kB = 25 K) [13]. Thus, compound 1 belongs to a very short-list of Tm(III)-based SMMs (Table 4).

2.3.2. AC Behavior for Na9[Yb(W5O18)2], 2

The AC susceptibility behavior recorded for Yb-derivative 2 between 2 and 10 K with HDC = 1.2 kOe is depicted in Figure 4 and Figure S9. Analysis of the Cole–Cole plots (Figure S10) revealed a distribution width of the relaxation times ranging from α = 0.09 at 6.5 K to 0.23 at 2 K. The larger α value at lower temperatures again suggest that different processes contribute to the relaxation of the magnetization. As for 1, the best modeling of the variation of τ with temperature was obtained for a relaxation driven by Raman and Orbach pathways with best-fit parameters C = 85 ± 42 s−1 K−n, n = 1.8 ± 0.4, τ0 = 7.1 ± 1 × 10⁻⁸ s and Ueff/kB = 47 ± 5 K (33 ± 3 cm−1). The obtained effective energy barrier Ueff is about half the energy gap between ground and first excited Kramers doublet by theoretical calculations (vide infra). Tentative modeling with other combinations of relaxation pathways can be found in Figure S11.
Slow relaxation of the magnetization is common for Yb(III) complexes [11]; however, only one POM-based Yb(III) compound, [Yb(β2-SiW11O39)2]13−, was reported to show such a behavior [9], but its SMM characteristics were not established due to temperature limitations. Complex 2 appears to be the first example of a POM-based Yb derivative with well-defined in-field SMM behavior.

2.4. Ab Initio Calculations

The energies of 1 and 2 were determined using the ab initio SO-CASSCF method, as given in Table S2. The ground terms of the free ions, 3H6 for Tm(III) and 2H7/2 for Yb(III), are split by about 400 cm−1 by the ligands. The symmetry of the coordination sphere in [Ln(W5O18)2]9− complexes is remarkably close from D4d, and, in this symmetry, MJ is a good quantum number for an axial symmetry. In the following, the pseudo C4 axis will be denoted as the z and quantification axis. The states of complex 2 are Kramers doublets (KDs), with an almost pure composition in terms of MJ, the ±5/2 being the ground doublet. The ± 7/2 doublet lies 65 cm−1 above. The χMT deduced from this SO-CASSCF calculations fits well the experimental curve, but the magnetization at 2 K is too small. We checked whether a ground MJ = ± 7/2 KD would better fit the experimental data: this would provide a plateau slightly too high for the magnetization, and the χMT values at low temperature would be much higher. This confirms that the ±5/2 doublet is the ground one. g factors are given in Table S3. They are as expected for pure MJ doublets: all KDs denote an axial magnetic moment, except the ±1/2 one, and the 2nd KD is more magnetic than the ground one.
For complex 1, the states form non-Kramers doublets (NKDs) with small energy gaps, except state number 7. The ground NKD is almost a pure MJ = ±6 doublet, but the other states denote strong mixings between different MJ values. This might be due to their energetic vicinity. The ground NKD is well separated from the excited states by an energy of more than 300 cm−1, while all the other states issued from the ground J are grouped together. The g factors deduced from the NKDs are given in Table S3. We remind here that only one principal value of the g tensor is worth non-zero for an NKD.
The direction of the magnetic moment of the ground NKD is along the z axis, while it takes an oblique direction for other doublets, for finally lying in the equatorial plane for the last doublet. The magnetic properties of the ground NKDs are favorable to slow relaxation of its magnetic moment: the energy gap of the NKD is very tiny, 0.012 cm−1, which quenches the tunneling between the two directions and the doublet is well separated from the other states with an energy gap of 330 cm−1 with the first excited state. Such a large barrier could not be evidenced in the analysis of the temperature dependence of τ. This strongly suggests that the relaxation of the magnetization in 1 is not driven by an Orbach pathway but by a faster process, such as a vibrionic (Raman) process.
The crystal field parameters (CFPs) were deduced from the ground J manifold using the ITO technique and are given in Table S4. They are similar in the two complexes, with a small decrease along the series, as is usually the case [39]. The strength parameters are of the same order of magnitude as other late-lanthanide complexes with O-donor ligands. This is dominated by 2nd and 4th orders, and only the parameters of index 0, B 0 k (k = 2, 4, 6), are important, due to the quasi D4d symmetry. Consequently, S0 S0is by far dominant, and S4 would be important in a D4h. B 0 2 is negative as expected from an axially compressed O8 coordination core leading to an oblate environment (Figure S1d). This type of coordination sphere stabilizes the states with a prolate electron density, and these states have large values of |MJ| for the late lanthanides [40]. In 1 and 2, the oblate O8 core results in ground states with the largest |MJ| for Tm(III) and the second largest for Yb(III), and the pseudo D4d symmetry leads to doublets that are pure in terms of MJ. The magnetic moments are consequently large and axial, along the C4 axis.

3. Materials and Methods

3.1. Syntheses

All reagents and solvents were used as received from commercial sources. Nitric acid solution (C = 0.4832 mol L−1) was prepared from concentrated HNO3 (chemically pure grade). The exact concentration was determined by titration of a weighed amount of sodium tetraborate (methyl red indicator) (δ = 0.5 %) [41]. Recrystallized sodium tetraborate decahydrate Na2B4O7∙10H2O was used for standardization; the H2O content was determined gravimetrically based on the weight loss after isothermal calcination (773 K) [41]. Tm(NO3)3 (C = 0.2933 mol L−1) and Yb(NO3)3 (0.2351 mol L−1) solutions were prepared by dissolving Tm2O3 and Y2O3 in HNO3. Excess amounts of HNO3 were removed by two-fold evaporation until wet residues were formed, which were then dissolved in distilled water. The concentrations of Tm(III) and Yb(III) were determined by direct complexometric titration using Trilon B solution (analytically pure grade) in acetate buffer solution with pH 5.5 (xylenol orange indicator) (δ = 0.8 %) [42].
Na9[Tm(W5O18)2]·35H2O, 1: Na2WO4∙2H2O (3.2980 g, 10.00 mmol) was dissolved in distilled water (80.03 mL). Then, HNO3 solution (16.56 mL, C = 0.4832 mol L−1, 8 mmol) was added dropwise with vigorous stirring. A solution of Tm(NO3)3 (3.41 mL, C = 0.2933 mol L−1, 1 mmol) was added dropwise and very slowly to the acidified tungstate solution with vigorous stirring. The final volume of the solution was 100 mL. The solution was stored for 2 weeks at room temperature leading to the formation of a needle-like crystalline precipitate of 1. The solid was filtered, washed with cold water, and air dried. The yield was 48%. IR (KBr, cm−1): 3449 (br, (ν(O–H)), 1637 (s, δ(H2O)), 933 (s, ν(W=O)), 849 (s, ν(O–W–O)), 791 (m), 715(s), 582 (w), 544 (w), 492 (w), 480 (w), 422 (w, δ(O–W–O)). Raman (cm−1): 947 (s), 889 (s), 838 (m), 712 (w), 544 (w), 427 (w), 343 (m), 175 (s). Elemental analysis (%) calcd. for Na9[Tm(W5O18)2]·35H2O: Na 6.05, Tm 4.94, W 53.74, H 2.06; found: Na 6.1, Tm 4.8, W 53.5, H 2.0.
Na9[Yb(W5O18)2]·35H2O, 2: Na2WO4∙2H2O (3.2980 g, 10.00 mmol) was dissolved in distilled water (80.03 mL). Then, a HNO3 solution (16.56 mL, C = 0.4832 mol L−1, 8 mmol) was added dropwise with vigorous stirring. A solution of Yb(NO3)3 (4.25 mL, C = 0.2351 mol L−1, 1 mmol) was added dropwise and very slowly to the acidified tungstate solution with vigorous stirring. The final volume of the solution was 79.19 mL. The solution was stored for 2 weeks at room temperature leading to the formation of a needle-like crystalline precipitate of 1. The solid was filtered, washed with cold water, and air dried. Yield 52%. IR (KBr, cm−1): 3444 (br, ν(O–H)), 1636 (s, δ(H2O)), 934 (s, ν(W=O)), 848 (s, ν(O–W–O)), 792 (m), 710(s), 585 (w), 547 (w), 490 (w), 421 (w, δ(O–W–O)). Raman, cm−1: 948 (s), 889 (s), 830 (m), 720 (w), 544 (w), 427 (w), 343 (m), 200 (s). Elemental analysis (%) calcd. for Na9[Yb(W5O18)2]·35H2O: Na 6.04, Yb 5.05, W 53.68, H 2.06; found: Na 6.2, Tm 5.0, W 53.6, H 2.1.

3.2. Fourier Transform Infrared (FT-IR)

FT-IR spectroscopy was performed on air-dried samples in a KBr matrix (content of the sample in KBr matrix was 0.5 wt%) using the Perkin-Elmer FTIR Spectrum BXII infrared spectrometer (Waltham, MA, USA) from 400 to 4000 cm−1. The Raman spectra were obtained at room temperature using CARS confocal laser scanning microscopes (SOL Instruments, Minsk, Belarus). The spectra were excited using a He-Ne laser (632.8 nm). The radiation power on the sample was 4.7 mWt. The time of signal accumulation was one second. The Raman spectra were recorded from 100 to 3100 cm−1. All measurements were conducted with a Perkin–Elmer spectrum GX 2000 FT-IR spectrometer three times and averaged.

3.3. Single-Crystal X-ray Diffraction

Single crystals suitable for X-ray diffraction were coated with Fomblin® Y oil and mounted onto the goniometer. Single crystal X-ray diffraction data was collected at 100 K on a Rigaku Compact HomeLab diffractometer equipped with a Saturn 944 HG CCD camera, and using monochromatic Cu-Kα-radiation (λ = 1.54184 Å) from a MicroMaxTM-003 sealed tube microfocus X-ray source. The data were collected using ω-scans. CrysAlisPro [43] was used for the data collection and processing, and numerical absorption correction [44] was performed based on a multifaceted crystal model. The structures were solved using SHELXT program and refined by the full-matrix least-squares method against F2 with SHELXL-2016 through OLEX2 program package [45,46,47]. The positions of hydrogen atoms were not determined. All non-hydrogen atoms were refined with anisotropic atomic displacement parameters.

3.4. Scanning Electron Microscopy

The investigations of the surface morphology of triturated samples of 1 and 2 by scanning (raster) electron microscopy and X-ray microanalysis were conducted using a complex analytical scanning electron microscope JSM 6490 LV (JEOL) and energy dispersive X-ray (EDX) spectrometer INCA PentaFETx3 (OXFORD Instruments). Imaging of the samples deposited on a conductive graphite tape were carried out in two modes: backscattered electron imaging (BEI) mode for the elemental analysis of phases constituting the samples and secondary electron imaging (SEI) mode for the study of surface micromorphology of obtained salts. The cathode material was lanthanum hexaboride (LaB6). The used accelerating voltage was between 10 and 20 kV.
The obtained salts had the composition of 1 and 2, which was confirmed by the results of EDX performed in different parts of the samples (Figure S12). X-ray spectral microanalysis was carried out for various points of the powder surface. The size of the excitation area at points was up to 5 μm in diameter and up to 5 μm in depth. The obtained atomic fractions of the elements indicated the preservation of the molar ratio Na:Ln:W = 9:1:10 (Ln = Tm (1), Yb (2)) at each point of the studied samples, which agrees with the data of the chemical analysis.
The determination of the chemical composition, surface scanning, and imaging in backscattered electrons (BEC) were performed at an accelerating voltage of 20 kV. Imaging with secondary electrons was carried out at an accelerating voltage of 10 kV. During the scanning, uneven sample surfaces caused an insignificant masking effect on the recorded signal. The uniform contrast of the sample surface, which was recorded in the backscattered electron mode, also indicates its single-phase nature. This was also confirmed by the survey of the samples surface area in the characteristic X-ray emission. Figures S8 and S9 show the uniform distribution of elements (O, Na, Tm, and W for 1; O, Na, Yb, and W for 2) over the sample surface without any segregations.
Microscopic analysis showed that the surfaces of the grains of 1 and 2 salts after grinding in an agate mortar had fuzzy blurred edges; the surface of the salt was made of spherical grains whose size was within the range of 100–500 nm for 1 and 200–300 nm for 2 (Figure S10).

3.5. Magnetic Properties

Magnetic studies were carried out with a Quantum Design MPMS-5S SQUID magnetometer (San Diego, CA, USA) with freshly isolated polycrystalline powders mixed with grease and put in gelatin capsules. The data were collected between 300 and 2 K with an applied field of 1 kOe (1) and 10 kOe (2) and corrected for the diamagnetic contribution sample by using Pascal’s tables [32] and for the sample holder. The field dependences of the magnetization were measured at 2 K with the DC magnetic field up to 5 T. The absence of ferromagnetic impurities was checked by the measurement of M vs. H at 100 K. AC susceptibility data were collected in the frequency range 1–1500 Hz with HAC = 3 Oe in zero and with an applied static field.

3.6. Computational Details

The calculations were performed on the [Ln(W5O18)2]9− complexes (Ln = Tm, Yb) based on the X-ray structures using the MOLCAS-7.8 suite of software (www.molcas.org). Relativistically contracted ANO-RCC basis sets of TZP quality were used for Tm, Yb, and O atoms [48,49]. W atoms were described using relativistic AIMP (ab initio model potentials) with the corresponding basis sets 3s3p4d2f for the 12 valence electrons [50]. First, a SF-CASSCF (spin-free CASSCF) calculation was performed [51] with an active space composed of the seven 4f orbitals of the lanthanide ion and associated electrons, that is, CAS(n,7). Spin–orbit (SO) coupling was included by a state interaction with the RASSI (restricted active space state interaction) method [52]. We considered 21 triplets and 28 singlets for Tm and 7 doublets for Yb for the state interaction. Scalar relativistic effects were considered by means of the Douglas–Kroll–Hess transformation [53], and the SO integrals were calculated using the AMFI (atomic mean-field integrals) approximation [54]. The g-values were calculated according to reference [55], and the CFPs were calculated with a local program written in Mathematica as described in [39,56].

4. Conclusions

Two Peacock–Weakley lanthanide complexes (Ln = Tm for 1 and Yb for 2) were synthesized using an original procedure involving HNO3 in a stoichiometric ratio. This permitted us to circumvent the high sensitivity to pH of the reaction outcome.
In these complexes, the Ln(III) ion sits in a quasi-perfect square antiprism polyhedron and is efficiently isolated from a point view of the magnetic interactions. The two (W5O18)6− ligands exert a lateral crystal field on the central Ln ion which is well suited to stabilize electrostatically a state with a prolate charge density [9,40,57]. The symmetrical and axially compressed coordination sphere favored large and axial magnetic moments. The high symmetry was even more necessary for the non-Kramer Tm(III) ion, where the ground state was found to be an almost degenerate doublet. The ground doublets were well separated in energy from the excited states (330 and 65 cm−1 for complexes 1 and 2, respectively). This situation is likely to result in single-molecule magnet behavior [10,58], which was indeed found in 1 and 2. Finally, we stress that compound 1 is a rare example of a thulium-based SMM.

Supplementary Materials

The following are available online at https://www.mdpi.com/2312-7481/6/4/53/s1, additional views of the crystal structures and crystal packing; additional magnetic data for 1 and 2. Crystallographic data for the structural analysis have been deposited at the ICSD Database under depository numbers CSD-1960251 and CSD-1960252 for compounds 1 and 2, respectively. This information may be obtained at http://www.fiz-karlsruhe.de/obtaining_crystal_structure_data.html. Figure S1: Molecular structure views for Na9[Tm(W5O18)2]·35H2O, 1; Figure S2: Molecular structure views for Na9[Yb(W5O18)2]·35H2O, 2; Figure S3: Powder X-Ray diffractograms of 1 and 2; Figure S4: Compound 1: (a) Frequency dependence of the out-of-phase ac signal (χΜ″) at 5 K with applied fields ranging from 0 and 1 T; (b) Field dependence of the relaxation time (τ) at 5 K; Figure S5: Frequency and temperature dependence of the in-phase (χΜ′) and out-of-phase (χΜ″) ac signals for 1; Figure S6: Cole-Cole plots for 1; Figure S7: Temperature dependence of τ−1 of 1 with the best fit considering different processes; Figure S8: Compound 2: Temperature dependence of the out-of-phase ac signal (χΜ″) at 2 K for different DC fields; Figure S9: Compound 2: Temperature and frequency dependence of the in-phase (χ′) and out-of-phase (χ″) ac susceptibilities recorded at 1.2 kOe dc field with a 3 Oe ac field; Figure S10: Cole-Cole (χΜ″ = f(χΜ′)) plots for 2 between 2 and 6.25 K with the best fits to the generalized Debye model; Figure S11: Temperature dependence of τ−1 of 2 with the best fit supposing direct and Raman processes; Figure S12: SEM images of the morphology of triturated samples of 1 and 2; Figure S13: SEM images of the powder of 1 in the characteristic X-ray emission; Figure S14: SEM images of the powder of 2 in the characteristic X-ray emission; Figure S15: SEM image of the surface of triturated samples of 1 and 2; Table S1: Continuous Shape Measures calculations performed on 1 and 2; Table S2: SF-CASSCF and SO-CASSCF energies for the [Ln(W5O18)2]9− complexes; Table S3: g factors of for the [Ln(W5O18)2]9− complexes deduced from SO-CASSCF calculations; Table S4: Crystal field and strength parameters (in cm−1) for the [Ln(W5O18)2]9− complexes deduced from SO-CASSCF calculations.

Author Contributions

Conceptualization, investigation, S.V.R.; investigation, O.Y.M.; discussion of ideas and the results, commenting on the manuscript, G.M.R.; crystal structure investigations, S.K. and Y.A.K.; magnetic studies, C.P. and J.-P.S.; Ab-initio calculations, H.B.; writing—original draft preparation, C.P., O.M., S.V.R., and H.B.; writing—review and editing, J.P.S. All authors have read and agreed to the published version of the manuscript.

Funding

This work was carried out within the Fundamental Research Programme funded by the Ministry of Education and Science of Ukraine (grant ID 0119U100025), with support from Estonian Ministry of Education and Research through Grants IUT19-32, IUT19-3 and PUT692.

Acknowledgments

S.V.R. is grateful to Erasmus+ Université Toulouse III Paul Sabatier for a visiting grant.

Conflicts of Interest

The authors declare no conflict of interest.

References

  1. Milios, C.; Winpenny, R.P. Cluster-Based Single-Molecule Magnets. In Molecular Nanomagnets and Related Phenomena; Gao, S., Ed.; Springer: Berlin/Heidelberg, Germany, 2015; Volume 164, pp. 1–109. [Google Scholar]
  2. Ishikawa, N.; Sugita, M.; Ishikawa, T.; Koshihara, S.-y.; Youkoh, K. Lanthanide Double-Decker Complexes Functioning as Magnets at the Single-Molecular Level. J. Am. Chem. Soc. 2003, 125, 8694–8695. [Google Scholar] [CrossRef]
  3. Rinehart, J.D.; Meihaus, K.R.; Long, J.R. Observation of a Secondary Slow Relaxation Process for the Field-Induced Single-Molecule Magnet U(H2BPz2)3. J. Am. Chem. Soc. 2010, 132, 7572–7573. [Google Scholar] [CrossRef]
  4. Woodruff, D.N.; Winpenny, R.E.P.; Layfield, R.A. Lanthanide Single-Molecule Magnets. Chem. Rev. 2013, 113, 5110–5148. [Google Scholar] [CrossRef] [PubMed]
  5. Layfield, R.A. Organometallic Single-Molecule Magnets. Organometallics 2014, 33, 1084–1099. [Google Scholar] [CrossRef]
  6. Guo, F.-S.; Bar, A.K.; Layfield, R.A. Main Group Chemistry at the Interface with Molecular Magnetism. Chem. Rev. 2019, 119, 8479–8505. [Google Scholar] [CrossRef] [PubMed]
  7. Guo, F.-S.; Day, B.M.; Chen, Y.-C.; Tong, M.-L.; Mansikkamäki, A.; Layfield, R.A. Magnetic hysteresis up to 80 kelvin in a dysprosium metallocene single-molecule magnet. Science 2018, 362, 1400–1403. [Google Scholar] [CrossRef] [PubMed] [Green Version]
  8. Vonci, M.; Giansiracusa, M.J.; Van den Heuvel, W.; Gable, R.W.; Moubaraki, B.; Murray, K.S.; Yu, D.; Mole, R.A.; Soncini, A.; Boskovic, C. Magnetic Excitations in Polyoxotungstate-Supported Lanthanoid Single-Molecule Magnets: An Inelastic Neutron Scattering and ab Initio Study. Inorg. Chem. 2017, 56, 378–394. [Google Scholar] [CrossRef] [Green Version]
  9. AlDamen, M.A.; Cardona-Serra, S.; Clemente-Juan, J.M.; Coronado, E.; Gaita-Ariño, A.; Martí-Gastaldo, C.; Luis, F.; Montero, O. Mononuclear Lanthanide Single Molecule Magnets Based on the Polyoxometalates [Ln(W5O18)2]9− and [Ln(β2-SiW11O39)2]13− (Ln(III) = Tb, Dy, Ho, Er, Tm, and Yb). Inorg. Chem. 2009, 48, 3467–3479. [Google Scholar] [CrossRef]
  10. AlDamen, M.A.; Clemente-Juan, J.M.; Coronado, E.; Martí-Gastaldo, C.; Gaita-Ariño, A. Mononuclear Lanthanide Single-Molecule Magnets Based on Polyoxometalates. J. Am. Chem. Soc. 2008, 130, 8874–8875. [Google Scholar] [CrossRef]
  11. Jia, J.-H.; Li, Q.-W.; Chen, Y.-C.; Liu, J.-L.; Tong, M.-L. Luminescent single-molecule magnets based on lanthanides: Design strategies, recent advances and magneto-luminescent studies. Coord. Chem. Rev. 2019, 378, 365–381. [Google Scholar] [CrossRef]
  12. Meng, Y.-S.; Qiao, Y.-S.; Zhang, Y.-Q.; Jiang, S.-D.; Meng, Z.-S.; Wang, B.-W.; Wang, Z.-M.; Gao, S. Can Non-Kramers TmIII Mononuclear Molecules be Single-Molecule Magnets (SMMs)? Chem. Eur. J. 2016, 22, 4704–4708. [Google Scholar] [CrossRef]
  13. Amjad, A.; Figuerola, A.; Sorace, L. Tm(III) complexes undergoing slow relaxation of magnetization: Exchange coupling and aging effects. Dalton Trans. 2017, 46, 3848–3856. [Google Scholar] [CrossRef] [Green Version]
  14. Harriman, K.L.M.; Korobkov, I.; Murugesu, M. From a Piano Stool to a Sandwich: A Stepwise Route for Improving the Slow Magnetic Relaxation Properties of Thulium. Organometallics 2017, 36, 4515–4518. [Google Scholar] [CrossRef]
  15. Peacock, R.D.; Weakley, T.J.R. Heteropoly tungstate complexes of the lanthanide elements. Part I. Preparation and reactions. J. Chem. Soc. A 1971, 1836. [Google Scholar] [CrossRef]
  16. Rozantsev, G.M.; Ignatyeva, V.V. Mathematical modeling of equilibria and the state of holmium heteropoly tungstate ions. Russ. J. Inorg. Chem. 2006, 51, 1509–1515. [Google Scholar] [CrossRef]
  17. Rozantsev, G.M.; Ignatyeva, V.V. Ionic equilibria for hetero-10-tungstoneodimates: Study and modeling. Russ. J. Coord. Chem. 2007, 33, 641–647. [Google Scholar] [CrossRef]
  18. Rozantsev, G.M.; Ignatyeva, V.V. Study of ionic equilibria and computation of thermodynamic characteristics of heteropoly anion formation in GdW10O369− solution. Russ. J. Inorg. Chem. 2014, 59, 1045–1054. [Google Scholar] [CrossRef]
  19. Sawada, K.; Yamase, T. Nonasodium decatungstodysprosate pentatriacontahydrate. Acta Cryst. C 2002, 58, i149–i151. [Google Scholar] [CrossRef]
  20. Vonci, M.; Giansiracusa, M.J.; Gable, R.W.; Van den Heuvel, W.; Latham, K.; Moubaraki, B.; Murray, K.S.; Yu, D.; Mole, R.A.; Soncini, A.; et al. Ab initio calculations as a quantitative tool in the inelastic neutron scattering study of a single-molecule magnet analogue. Chem. Commun. 2016, 52, 2091–2094. [Google Scholar] [CrossRef] [Green Version]
  21. Moriyasu, S.; Toshihiro, Y. Crystal Structure and Luminescence Site of Na9[EuW10O36]·32H2O. Bull. Chem. Soc. Jpn. 1993, 66, 444–449. [Google Scholar] [CrossRef]
  22. Ozeki, T.; Yamase, T. Effect of lanthanide contraction on the structures of the decatungstolanthanoate anions in K3Na4H2[LnW10O36].nH2O (Ln = Pr, Nd, Sm, Gd, Tb, Dy) crystals. Acta Cryst. B 1994, 50, 128–134. [Google Scholar] [CrossRef]
  23. Yamase, T.; Ozeki, T.; Tosaka, M. Octasodium hydrogen decatungstogadolinate triacontahydrate. Acta Cryst. C 1994, 50, 1849–1852. [Google Scholar] [CrossRef] [Green Version]
  24. Yamase, T.; Ozeki, T. Structure of K3Na4H2[GdW10O36].21H2O. Acta Cryst. C 1993, 49, 1577–1580. [Google Scholar] [CrossRef]
  25. Shiozaki, R.; Inagaki, A.; Ozaki, A.; Kominami, H.; Yamaguchi, S.; Ichihara, J.; Kera, Y. Catalytic behavior of a series of lanthanide decatungstates [Ln(III)W10O369−; Ln: La-Yb] for H2O2-oxidations of alcohols and olefins. Some chemical effects of the 4fn-electron in the lanthanide(III) ion on the catalyses. J. Alloys Comp. 1997, 261, 132–139. [Google Scholar] [CrossRef]
  26. Ozeki, T.; Yamase, T. Hexasodium trihydrogen decatungstosamarate octacosahydrate. Acta Cryst. C 1994, 50, 327–330. [Google Scholar] [CrossRef]
  27. Casanova, D.; Alemany, P.; Bofill, J.M.; Alvarez, S. Shape and Symmetry of Heptacoordinate Transition-Metal Complexes: Structural Trends. Chem. Eur. J. 2003, 9, 1281. [Google Scholar] [CrossRef]
  28. Alvarez, S.; Alemany, P.; Casanova, D.; Cirera, J.; Llunell, M.; Avnir, D. Shape maps and polyhedral interconversion paths in transition metal chemistry. Coord. Chem. Rev. 2005, 249, 1693–1708. [Google Scholar] [CrossRef]
  29. Llunell, M.C.; Cirera, J.; Alemany, P.; Alvarez, S. SHAPE, V2; Universitat de Barcelona: Barcelona, Spain, 2010. [Google Scholar]
  30. Huang, W.; Xu, J.; Wu, D.; Huang, X.; Jiang, J. Rhodamine-based field-induced single molecule magnets in Yb(iii) and Dy(iii) series. New J. Chem. 2015, 39, 8650–8657. [Google Scholar] [CrossRef]
  31. Gavrikov, A.V.; Koroteev, P.S.; Efimov, N.N.; Dobrokhotova, Z.V.; Ilyukhin, A.B.; Kostopoulos, A.K.; Ariciu, A.-M.; Novotortsev, V.M. Novel mononuclear and 1D-polymeric derivatives of lanthanides and (η6-benzoic acid)tricarbonylchromium: Synthesis, structure and magnetism. Dalton Trans. 2017, 46, 3369–3380. [Google Scholar] [CrossRef] [PubMed] [Green Version]
  32. Kahn, O. Molecular Magnetism; VCH: Weinheim, Germany, 1993. [Google Scholar]
  33. Benelli, C.; Gatteschi, D. Introduction to Molecular Magnetism: From Transition Metals to Lanthanides; Wiley: Hoboken, NJ, USA, 2015. [Google Scholar]
  34. Dekker, C.; Arts, A.F.M.; de Wijn, H.W.; van Duyneveldt, A.J.; Mydosh, J.A. Activated dynamics in a two-dimensional Ising spin glass. Phys. Rev. B 1989, 40, 11243–11251. [Google Scholar] [CrossRef] [Green Version]
  35. Cole, K.S.; Cole, R.H. Dispersion and Absorption in Dielectrics I. Alternating Current Characteristics. J. Chem. Phys. 1941, 9, 341–351. [Google Scholar] [CrossRef] [Green Version]
  36. Pescia, J. La Relaxation des spins électroniques avec le réseau (Théorie élémentaire et méthodes de mesure du temps T1). J. Phys. France 1966, 27, 782–800. [Google Scholar] [CrossRef] [Green Version]
  37. Rechkemmer, Y.; Breitgoff, F.D.; van der Meer, M.; Atanasov, M.; Hakl, M.; Orlita, M.; Neugebauer, P.; Neese, F.; Sarkar, B.; van Slageren, J. A four-coordinate cobalt(II) single-ion magnet with coercivity and a very high energy barrier. Nat. Commun. 2016, 7, 10467. [Google Scholar] [CrossRef] [Green Version]
  38. Cardona-Serra, S.; Clemente-Juan, J.M.; Coronado, E.; Gaita-Ariño, A.; Camón, A.; Evangelisti, M.; Luis, F.; Martínez-Pérez, M.J.; Sesé, J. Lanthanoid Single-Ion Magnets Based on Polyoxometalates with a 5-fold Symmetry: The Series [LnP5W30O110]12– (Ln3+ = Tb, Dy, Ho, Er, Tm, and Yb). J. Am. Chem. Soc. 2012, 134, 14982–14990. [Google Scholar] [CrossRef]
  39. Jung, J.; Islam, M.A.; Pecoraro, V.L.; Mallah, T.; Berthon, C.; Bolvin, H. Derivation of Lanthanide Series Crystal Field Parameters From First Principles. Chem. Eur. J. 2019, 25, 15112–15122. [Google Scholar] [CrossRef]
  40. Rinehart, J.D.; Long, J.R. Exploiting single-ion anisotropy in the design of f-element single-molecule magnets. Chem. Sci. 2011, 2, 2078. [Google Scholar] [CrossRef]
  41. Korostelev, P.P. Preparation of Solutions for Chemical Analysis. Nauka Mosc. 1964, 401. [Google Scholar]
  42. Shvartsenbakh, G.; Flashka, G. Complexometric Titration [Russian translation]. Khimiya Mosc. 1970, 360. [Google Scholar]
  43. CrysAlisPro; Agilent Technologies Ltd.: Oxfordshire, UK, 2014; Available online: https://journals.iucr.org/e/services/stdswrefs.html (accessed on 1 October 2020).
  44. Clark, R.C.; Reid, J.S. The analytical calculation of absorption in multifaceted crystals. Acta Cryst. A 1995, 51, 887–897. [Google Scholar] [CrossRef]
  45. Dolomanov, O.V.; Bourhis, L.J.; Gildea, R.J.; Howard, J.A.K.; Puschmann, H. OLEX2: A complete structure solution, refinement and analysis program. J. Appl. Cryst. 2009, 42, 339–341. [Google Scholar] [CrossRef]
  46. Sheldrick, G. Crystal structure refinement with SHELXL. Acta Cryst. C 2015, 71, 3–8. [Google Scholar] [CrossRef]
  47. Sheldrick, G. SHELXT—Integrated space-group and crystal-structure determination. Acta Cryst. A 2015, 71, 3–8. [Google Scholar] [CrossRef] [Green Version]
  48. Roos, B.O.; Lindh, R.; Malmqvist, P.A.; Veryazov, V.; Widmark, P.O. Main group atoms and dimers studied with a new relativistic ANO basis set. J. Phys. Chem. A 2004, 108, 2851–2858. [Google Scholar] [CrossRef]
  49. Roos, B.O.; Lindh, R.; Malmqvist, P.-Å.; Veryazov, V.; Widmark, P.-O. New relativistic ANO basis sets for actinide atoms. Chem. Phys. Lett. 2005, 409, 295–299. [Google Scholar] [CrossRef]
  50. Casarrubios, M.; Seijo, L. The ab initio model potential method: Third-series transition metal elements. J. Chem. Phys. 1999, 110, 784–796. [Google Scholar] [CrossRef] [Green Version]
  51. Roos, B.O.; Taylor, P.R.; Sigbahn, P.E.M. A complete active space SCF method (CASSCF) using a density matrix formulated super-CI approach. Chem. Phys. 1980, 48, 157–173. [Google Scholar] [CrossRef]
  52. Malmqvist, P.Å.; Roos, B.O.; Schimmelpfennig, B. The restricted active space (RAS) state interaction approach with spin–orbit coupling. Chem. Phys. Lett. 2002, 357, 230–240. [Google Scholar] [CrossRef]
  53. Hess, B.A. Relativistic electronic-structure calculations employing a two-component no-pair formalism with external-field projection operators. Phys. Rev. A 1986, 33, 3742–3748. [Google Scholar] [CrossRef] [PubMed] [Green Version]
  54. Heß, B.A.; Marian, C.M.; Wahlgren, U.; Gropen, O. A mean-field spin-orbit method applicable to correlated wavefunctions. Chem. Phys. Lett. 1996, 251, 365–371. [Google Scholar] [CrossRef]
  55. Bolvin, H. An Alternative Approach to the g-Matrix: Theory and Applications. Chem. Phys. Chem. 2006, 7, 1575–1589. [Google Scholar] [CrossRef]
  56. Ungur, L.; Chibotaru, L.F. Ab Initio Crystal Field for Lanthanides. Chem. Eur. J. 2017, 23, 3708–3718. [Google Scholar] [CrossRef] [PubMed]
  57. Martínez-Pérez, M.J.; Cardona-Serra, S.; Schlegel, C.; Moro, F.; Alonso, P.J.; Prima-García, H.; Clemente-Juan, J.M.; Evangelisti, M.; Gaita-Ariño, A.; Sesé, J.; et al. Gd-Based Single-Ion Magnets with Tunable Magnetic Anisotropy: Molecular Design of Spin Qubits. Phys. Rev. Lett. 2012, 108, 247213. [Google Scholar] [CrossRef] [PubMed] [Green Version]
  58. Baldoví, J.J.; Clemente-Juan, J.M.; Coronado, E.; Duan, Y.; Gaita-Ariño, A.; Giménez-Saiz, C. Construction of a General Library for the Rational Design of Nanomagnets and Spin Qubits Based on Mononuclear f-Block Complexes. The Polyoxometalate Case. Inorg. Chem. 2014, 53, 9976–9980. [Google Scholar] [CrossRef] [PubMed]
Figure 1. The molecular structure for [Tm(W5O18)2]9−, 1: (a) Polyhedra and (b) ball and stick views. Color scheme: WO6 = blue polyhedral, W = blue, Tm = bronze and O = red.
Magnetochemistry 06 00053 g001
Figure 2. (a) Temperature dependence of χMT and (b) magnetization at 2 K for the complexes 1 (in blue) and 2 (in black). Full lines correspond to the ab initio calculated behaviors.
Magnetochemistry 06 00053 g002
Figure 3. (a) Frequency dependence of the out-of-phase component of the AC susceptibility of 1 with an applied field of 3 kOe, and (b) temperature dependence of its relaxation time with the best fit () for a combination of Raman, and Orbach contributions, and (---) their calculated individual contributions.
Magnetochemistry 06 00053 g003
Figure 4. (a) The frequency dependence of the out-of-phase component of the AC susceptibility of 2 with an applied field of 1.2 kOe, and (b) temperature dependence of its relaxation time with the best fit () for a combination of Raman and Orbach contributions, and (---) their calculated individual contributions.
Magnetochemistry 06 00053 g004
Table 1. Selected crystallographic data and refinement parameters of 1 and 2.
12
Formula aNa9TmW10O71 aNa9YbW10O71 a
Mw (g mol−1)3350.343354.45
Crystal systemtriclinictriclinic
Space groupP-1P-1
T (K)100(2)100(2)
a (Å)12.7285(2)12.7285(2)
b (Å)13.0501(3)13.0447(3)
c (Å)20.4565(6)20.4508(5)
α (°)82.870(2)82.836(2)
β (°)74.392(3)74.478(2)
γ (°)88.718(3)88.747(2)
V (Å3)3247.2(2)3246.0(1)
Z22
ρ calcd. (g cm−3)3.4273.432
µ (mm−1)1.541841.54184
Collected reflns11,32411,373
Unique reflns10,56311,096
Rint0.06270.0318
Final R1, wR2
(I ≥ 2σ) b,c
0.0533, 0.15100.0261, 0.0677
R1, wR2 (all data)0.0567, 0.15550.0277, 0.0689
GOF on F2 d1.0971.107
ICSD ref.1,960,2511,960,252
a Excluding the hydrogen atoms on the water molecules that were not located, b R1 = ∑‖Fo| − |Fc‖/∑|Fo|, c wR2 = [∑ (w(Fo2Fc2)2)/∑([w(Fo2)2]1/2 where w = 1/(σ2(Fo2) + (aP)2 + bP) with P = (2Fc2 + max(Fo2,0))/3. d GOF = [∑w(Fo2Fc2)2/(np)]1/2, where n is the number of reflections and p is the number of parameters.
Table 2. Selected bond lengths of 1 and 2 (Å).
Compound 1
Tm1–O162.348(7)Tm1–O322.385(8)Tm1–O332.347(7)
Tm1–O312.355(8)Tm1–O152.338(7)Tm1–O142.309(8)
Tm1–O172.348(8)Tm1–O342.364(8)
Compound 2
Yb1–O342.348(4)Yb1–O312.363(4)Yb1–O172.316(4)
Yb1–O142.336(4)Yb1–O332.356(4)Yb1–O322.348(4)
Yb1–O152.330(4)Yb1–O162.342(4)
Table 3. Selected bond angles of 1 and 2 (°).
Compound 1
O16–Tm1–O3275.9(3)O16–Tm1–O31140.8(3)
O16–Tm1–O1773.8(3)O16–Tm1–O34143.0(2)
O33–Tm1–O1677.3(3)O33–Tm1–O3273.7(3)
O33–Tm1–O31115.1(3)O33–Tm1–O1773.8(3)
O33–Tm1–O3473.3(3)O31–Tm1–O3273.0(3)
O31–Tm1–O3473.6(3)O15–Tm1–O1673.8(3)
O15–Tm1–O3277.5(3)O15–Tm1–O33143.2(2)
O15–Tm1–O3173.6(3)O15–Tm1–O17118.0(3)
O15–Tm1–O34141.4(2)O14–Tm1–O16117.5(3)
O14–Tm1–O32144.1(2)O14–Tm1–O33139.7(3)
O14–Tm1–O3178.3(3)O14–Tm1–O1575.2(3)
O14–Tm1–O1775.2(3)O14–Tm1–O3475.1(3)
O17–Tm1–O32139.4(2)O17–Tm1–O31144.4(2)
O17–Tm1–O3476.9(4)O34–Tm1–O32115.5(3)
Compound 2
O14–Yb1–O3476.5(1)O14–Yb1–O3177.5(1)
O14–Yb1–O33141.4(1)O14–Yb1–O32142.9(1)
O14–Yb1–O16117.9(1)O33–Yb1–O31115.6(1)
O32–Yb1–O34115.2(1)O32–Yb1–O3173.3(1)
O32–Yb1–O3373.5 (1)O15–Yb1–O34140.5(1)
O15–Yb1–O3175.6(1)O15–Yb1–O1473.7(1)
O15–Yb1–O33143.2(1)O15–Yb1–O3277.2(1)
O15–Yb1–O1673.9(1)O16–Yb1–O34144.4(1)
O16–Yb1–O31139.2(1)O16–Yb1–O3377.1(1)
O16–Yb1–O3274.1(1)O17–Yb1–O3478.3(1)
O17–Yb1–O31144.3(1)O17–Yb1–O1475.1(1)
O17–Yb1–O3375.3(1)O17–Yb1–O32140.0(1)
O17–Yb1–O15117.3(1)O17–Yb1–O1675.1(1)
O34–Yb1–O3173.2(14)O34–Yb1–O3373.6(1)
Table 4. TmIII-based SMMs reported in the literature and their characteristics.
CompoundHdc (Oe)τ0 (s)Ueff (K)C (s−1)nτQTM (s)Ref.
[Tp(Tm)(COT)]20004.7(9) × 10−7111(2)
130(1)
4.21(3) Meng [12]
[Tp*(Tm)(COT)]20002.4(2) × 10−646(1)n.c.3.91(6) Meng [12]
[Tm(COT)I(THF)2]8001.18 × 10−47.930.0596.22.68 × 10−3Harriman [14]
[K(18-C-6)(THF)2][Tm(COT)2]2001.28 × 10−453.30.0103.660.371Harriman [14]
[Tm(dmf)4(H2O)3Co(CN)6]10003.2(2) × 10−722(1)6.8(1)5.4(2) Amjad [13]
Na9[Tm(W5O18)2] (1)30002.1(1) × 10−666(3)6(16)2(1) this work
Publisher’s Note: MDPI stays neutral with regard to jurisdictional claims in published maps and institutional affiliations.

