
Recent Applications of Benchtop Nuclear Magnetic Resonance Spectroscopy


Department of Chemistry, Chung-Ang University, Seoul 06974, Korea
*
Author to whom correspondence should be addressed.
Magnetochemistry 2021, 7(9), 121; https://doi.org/10.3390/magnetochemistry7090121
Submission received: 5 August 2021
/
Revised: 21 August 2021
/
Accepted: 27 August 2021
/
Published: 1 September 2021
(This article belongs to the Section Magnetic Resonances)
Abstract
:Benchtop nuclear magnetic resonance (NMR) spectroscopy uses small permanent magnets to generate magnetic fields and therefore offers the advantages of operational simplicity and reasonable cost, presenting a viable alternative to high-field NMR spectroscopy. In particular, the use of benchtop NMR spectroscopy for rapid in-field analysis, e.g., for quality control or forensic science purposes, has attracted considerable attention. As benchtop NMR spectrometers are sufficiently compact to be operated in a fume hood, they can be efficiently used for real-time reaction and process monitoring. This review introduces the recent applications of benchtop NMR spectroscopy in diverse fields, including food science, pharmaceuticals, process and reaction monitoring, metabolomics, and polymer materials.
1. Introduction
Nuclear magnetic resonance (NMR) spectroscopy has a broad application scope (e.g., organic chemistry, pharmaceuticals, biochemistry, food science, and material science), as it is non-destructive, requires small sample amounts, provides both structural and dynamic information, and is intrinsically quantitative (the integrated area of the NMR signal is directly proportional to the number of the corresponding resonant nuclei) [1,2]. However, the minute energy difference between the nuclear spin states responsible for the exploited transitions results in relatively low sensitivity and resolution [3]. Generally, higher sensitivity and resolution are achieved by increasing the strength of the magnetic field in NMR instruments, which currently rely on cryogenically cooled superconducting magnets to generate a high magnetic field and are therefore very expensive in terms of components, maintenance, and operation.
Low-field NMR spectrometers use permanent magnet-created fields with strengths of several T (1H resonance frequency = 43–100 MHz), are sufficiently compact to be mounted on a desk (hence the name “benchtop NMR spectrometers”), and do not require expensive maintenance procedures such as cryogenic exchange, thus presenting an attractive alternative to expensive high-field NMR spectrometers [4,5]. Magritek, Nanalysis, Oxford, Bruker, and Thermo Scientific are the manufacturers of commercial benchtop NMR spectrometers. Generally, low-field benchtop NMR devices are used in scenarios where the operation of expensive high-field NMR instruments is difficult or not required, e.g., for educational and quality control purposes [6,7,8]. In the early days of benchtop NMR spectroscopy, the magnetic field homogeneity was insufficient to distinguish small differences in chemical shifts, which resulted in the development of time-domain NMR techniques to measure relaxation times or diffusion coefficients [9]. As the information inferred from the time-domain NMR data reflects the physical properties of the sample, it has been used to probe the rheological or morphological properties of materials such as oils, foods, polymers, and fuels [4,5,9].
The development of technologies allowing one to increase field homogeneity in small permanent magnets has inspired interest in benchtop NMR spectroscopy since 2010 [10]. This review focuses on the recent technologies associated with benchtop NMR spectroscopy, discusses its applications in various fields (e.g., foods, pharmaceuticals, monitoring tools, and polymer materials), and briefly introduces the newly developed advanced methodologies.
2. Applications of Benchtop NMR Spectroscopy
2.1. Foods
Food science is a highly complex field at the interface of chemistry, biochemistry, agricultural science, nutrition, engineering, and other disciplines. This complexity stems from the nature of foods, which feature very complex matrices and contain water, colorants, flavorings, and minerals in addition to major nutrients such as carbohydrates, fats, and proteins. Moreover, these substances feature broadly variable concentration ranges and physicochemical properties (e.g., molecular weight and solubility). Finally, the possibility of physiochemical changes due to chemical or enzymatic reactions and interactions with microorganisms adds another level of complexity. Consequently, the scope and target of food analysis are very diverse, including raw material verification and determination of (i) food composition, (ii) changes due to processing, and (iii) interactions with packaging materials. NMR spectroscopy is one of the most powerful analytical techniques used in food analysis, allowing simultaneous qualitative and quantitative analyses of food ingredients and handling of various types of samples (solids and/or liquids) without complex pretreatments [11]. In general, because of the complexity of the food matrix, high-field NMR spectroscopy is preferred because of its ability to reduce signal overlap. However, even high-field NMR spectroscopy fails to achieve perfect signal separation, and signal patterns or spectral profiles called “fingerprints” are therefore often used for the identification/authentication of food products and detection of their adulteration [12,13]. These fingerprints are used in numerous applications, especially in benchtop NMR spectroscopy, which has lower sensitivity and resolution than high-field NMR spectroscopy. In such cases, the results of high-field NMR studies are often used as reference data [14,15,16,17].
As summarized in Table 1, benchtop NMR spectroscopy has been actively used for the authentication of oils/fats and the detection of their adulteration [18,19], with main objectives including confirming the authenticity of expensive oils and the detection of their adulteration through mixing with cheap oils [14,15,20,21]. Edible oils and fats almost entirely consist of triglycerides, which are the products of glycerol esterification with fatty acids and therefore contain up to three different fatty acid residues (in terms of the number of carbons and double bonds). The differences in these triglycerides and their compositions appear as those in oil NMR spectra, which can be used to determine the authenticity or the relative contents of mixture components [22].
Figure 1 shows a low-field benchtop NMR spectrum of a representative triglyceride, revealing that the saturated fatty acid signals at 1–2 ppm are severely overlapped, whereas no such overlap is observed in the corresponding high-field NMR spectrum. However, in the former spectrum, some unsaturated fatty acid signals above 2.5 ppm are rather broad but identifiable and can therefore be used for oil discrimination [17]. Signal overlap due to the similarity between samples may cause more serious problems in low-field NMR spectroscopy but is often unavoidable even in high-field NMR spectroscopy. For both high-field and benchtop NMR spectroscopy, these difficulties can be overcome using ancillary tools such as statistical analysis or combination with other techniques [14,15,23]. Moreover, as triglycerides are commonly found in foods other than oils, the corresponding spectral profile-based analytical methods can be expanded to other foods. For example, beef can be distinguished from horse meat by comparing the 60 MHz NMR spectra of the extracted triglycerides [24].
The remarkable development of related technologies has inspired the application of benchtop NMR spectroscopy to beverage quality control, as this technique does not require special pretreatment and offers the benefit of operational simplicity. Coffee is one of the world’s most traded crops and is therefore expected to benefit from the effective application of benchtop NMR spectroscopy-based quality control. The main issue of coffee quality control is the discrimination between the more expensive Arabica and the cheaper Robusta. Kemsley and co-workers realized this discrimination using a key marker compound (16-O-methylcafestol) present in Robusta but absent or present in trace amounts in Arabica [16,25]. Subsequent studies showed that the detection limit of 10–20% w/w can be improved to 1–2% w/w using the sample concentration [25]. The amount of ethanol in alcoholic beverages was determined using a 45 MHz benchtop NMR spectrometer and internal standards [17]. Simple ethanol quantitation methods based on benchtop NMR spectroscopy allow the rapid quality control of alcoholic beverages and can also be used for the real-time monitoring of fermentation processes, as they produce ethanol [28].
Benchtop NMR spectroscopy can also be applied to the analysis of dairy products, which have been probed by time-domain NMR techniques to determine fat/moisture content and authenticity as well as to perform quality control [29]. Recently, benchtop NMR spectroscopy has been used to investigate the production conditions of lactose-free milk [26], which is produced by the lactase-catalyzed breakdown of lactose into galactose and glucose. In this case, traditional analytical techniques such as polarimetry, mid-IR spectroscopy, and high-performance liquid chromatography (HPLC) are poorly suited for the online monitoring of hydrolysis in flow mode via lactose content determination [30]. Soyler et al. demonstrated the applicability of benchtop NMR spectroscopy as a tool for online lactose hydrolysis monitoring in a model system for the production of lactose-free milk [26]. Milk samples were also classified based on processing type, milk source, and geographic origin. To this end, benchtop NMR spectroscopy has been used to obtain chemical information such as glycerol, fat, and sugar contents. The data obtained for different milk samples were processed using statistical techniques, and an artificial neutral network model was used to discriminate between milk samples.
The ultimate limitation of benchtop NMR spectroscopy is its low resolution. In particular, as the coupling constant is independent of the magnetic field strength, spectral distortion due to the overlapping multiplets of adjacent signals is often observed, and quantitative analysis is often hindered by the absence of clear integration boundaries. To overcome these problems, an effective quantitation approach capable of analyzing data at any field strength has been established using parametric modeling instead of peak integration [27,31] and has been successfully applied to the analysis of a model sugar mixture comprising glucose, fructose, and sucrose. The concentration of the major sugar was determined with an accuracy of 0.2 mol/mol for natural fruit juice and model samples (sugar mixtures in water). Moreover, the results obtained using the 43 MHz and 400 MHz spectrometers were in good agreement with each other and the reference values from nutrition databases [27].
2.2. Pharmaceuticals and Drugs
As in the case of food analysis, the applications of benchtop NMR spectroscopy in pharmaceutical research primarily focus on quality control related to adulteration, because spectral fingerprints recorded by benchtop NMR spectroscopy are powerful tools for molecular identification. The increasing popularity of dietary supplements has resulted in the emergence of quality issues such as the introduction of unauthorized substances to increase effectiveness. Accordingly, benchtop NMR spectroscopy has gradually been introduced as a means of detecting such substances. Comparison with the high-field NMR spectra of adulterants and their combination with chemometric analysis are often used to increase the efficiency of benchtop NMR techniques [32,33]. A recent study confirmed the potential of benchtop NMR spectroscopy (specifically, 60 MHz 1H NMR spectroscopy) to reveal drug falsification through the identification of characteristic active pharmaceutical ingredient (API) signals [34]. Erectile dysfunction and antimalarial medicines were screened to reveal falsification and quantified using internal standards. In addition, benchtop NMR spectroscopy was confirmed to hold great promise as a routine screening tool through verification in terms of accuracy, repeatability, detection limit, and quantitation [34].
Forensic drug analysis is one of the most anticipated applications of benchtop NMR spectroscopy, and many related studies have already been conducted (Table 2). In these cases, the benchtop NMR spectra of drugs are most often compared with the related high-field NMR spectra in a library, as high-field NMR spectroscopy has been extensively applied in forensic drug analysis, especially to characterize addictive, toxic, fraud, and fake drugs [35,36]. Furthermore, studies have been conducted on the screening of various drugs such as smokable herbal mixtures (known to have the same effects as cannabis) [37] and derivatives of morphine, amphetamine, and ketamine [38]. For some drugs, component quantitation was performed through quantitative NMR (qNMR) spectroscopy using appropriate internal standards (Figure 2) [39], and the results were compared with those of HPLC to confirm the appropriateness of the qNMR technique. qNMR is used to determine the concentration of one or more chemicals present in a solution, which is made possible because not only is the intensity of the NMR signal directly proportional to the number of corresponding resonant nuclei, but all signals that appear in the spectrum are equally sensitive, irrespective of the type of molecule.
To reduce the number/duration of sample preparation processes, quantitative analysis can be performed without internal standards using statistical means such as linear or partial least squares regression to obtain values similar to those of gas-chromatographic (GC) analysis [40]. Moreover, both benchtop NMR spectroscopy and chemometric methods can be used to determine the presence and amount of active substances in falsified or substandard medical products [41]. This method was validated in terms of identification, linearity, sensitivity, reproducibility, and recovery using reference active substances such as acetaminophen, acetylsalicylic acid, caffeine, diclofenac sodium salt, and ibuprofen, and the results indicated that the API content can be determined with an uncertainty of 10% [41].
Studies to overcome the disadvantage of low resolution in benchtop NMR spectroscopy for drug analysis have been conducted in a manner similar to that used for food analyses. The traditional method is to use other NMR-active nuclides such as 19F or 31P together with 1H [42,43,44]. In particular, as the heteronuclear NMR spectra are very simple, unlike 1H spectra, in which overlap often occurs, they may be useful for the identification of certain molecules containing the corresponding nuclides. The introduction of statistical data processing is becoming essential for all applications [40,41]. Statistical tools are often used to compare two types of substances with similar components or to quantify the desired substance. Moreover, efforts have been made to build libraries of low-field NMR spectra. Antonides et al. built a library using more than 300 low-field NMR spectra and automated the process of comparing the obtained spectra with the library using a pattern recognition algorithm [45]. Meanwhile, instead of constructing a library with measured spectra, one can convert high-field NMR data into low-field data using quantum mechanical spin system analysis [27,31]. The related studies confirmed the feasibility of building field-invariant 1H NMR spectral libraries and showed that benchtop NMR spectroscopy can be used for routine analysis in forensic laboratories.
2.3. Polymer Materials
The applications of benchtop NMR spectroscopy in the polymer industry mainly involve composition analysis for quality control and polymerization monitoring (Table 3). To obtain adequate mechanical and physiochemical properties, polymers are usually supplemented with small amounts of (in)organic additives, blended with other polymers, or prepared by the copolymerization of two or more monomers. As the composition and microstructure of a given polymer are closely related to its properties, an understanding of polymer chemical information is of utmost importance [46]. High-field 1H NMR spectroscopy is a routine method used for the molecular characterization of polymers, as it does not require additional calibration. High-temperature NMR techniques can also be used to analyze polymers with high chemical resistance [47]. However, as high-field NMR spectroscopy is difficult to operate in industrial sites, there is a demand for benchtop NMR spectrometers to be used as routine equipment for quality control. Recently, several studies have confirmed that benchtop NMR spectroscopy has the potential to directly verify materials in industrial sites lacking advanced measurement facilities [48,49].
A benchtop NMR spectrometer was used for the quantitative molecular characterization of polystyrene-containing polymer blends and block copolymers [50]. In general, styrene moiety-containing rubbers are amenable to quality analysis using benchtop NMR spectroscopy, as the characteristic aromatic signals of polystyrene can be easily distinguished from those of other components even in low-resolution NMR spectra [49,50,51]. Additionally, benchtop NMR spectroscopy was successfully used for the classification of polymers (oil-extended solution–polymerized SBR and emulsion–polymerized SBR) produced by different processes [49,51]. As shown in Figure 3, the NMR spectra of the two SBR polymers were similar to each other, with manufacturing process-related differences in microstructure resulting in differences in the aliphatic-region patterns of the 1H NMR signals. Although their acquisition was time-consuming because of low sensitivity, the related 13C NMR spectra provided more information on the repeating unit statistics of copolymer chains [51]. In a follow-up study, a method for the quantitative analysis of monomers was developed by applying a partial least squares regression (PLS-R) model to 43 MHz 1H NMR spectra. As a result, components that could not be analyzed because of signal overlap in the 1H NMR spectra (e.g., trans-1,4-butadiene) were quantified using 13C NMR spectroscopy [52]. In another study, the composition of the polyisoprene monomers (1,4-, 3,4-, and 1,2-isoprene) was quantified by benchtop NMR spectroscopy [52]. Specifically, changes of the signal-to-noise ratio (SNR) according to experimental parameters such as spectral width, relaxation delay, and number of scans were tested.
Benchtop NMR spectroscopy can be used for the analysis of organic additives in polymers. In a recent study, plasticizers in PVC were quantitatively analyzed using a 40 MHz 1H NMR spectrometer [48,53]. To lower the cost of analysis, NMR spectra were obtained using non-deuterated n-hexane as a solvent, as its signals minimally overlapped with those of the plasticizers. Signals below 3 ppm were overwhelmed by the large peak of the non-deuterated solvent, but signals above 3 ppm could be used for quantitative analysis [48].
Benchtop NMR spectroscopy has been also used for polymerization monitoring. Initially, it was found that meaningful information on kinetic parameters can be obtained by monitoring the emulsion polymerization of butyl acrylate using an online 20 MHz NMR spectrometer [54]. Polymerization monitoring was also carried out in a manner similar to that used for general content estimation mentioned in Section 2.4.1 [55,56]. As another interesting example, a benchtop NMR spectrometer was used as a size-exclusive chromatography detector by the Wilhelm group [57,58,59,60] to detect optically inactive polymers (Figure 4). As a solvent suppression technology was applied, non-deuterated solvents could be used [60].
2.4. Monitoring Tools
NMR spectroscopy, relaxometry, and diffusometry have been used for process and quality control in a number of industries [61]. In view of the recent technological advances, benchtop NMR spectroscopy is expected to be widely used for monitoring purposes in view of the portability and low cost of the corresponding devices and its ability to simultaneously provide both structural and quantitative information.
2.4.1. Process and Reaction Monitoring
Process/reaction monitoring technologies are very important for the chemical industry, as they enable a comprehensive understanding of the studied reaction and the optimization of reaction conditions in real-time based thereon. Above all, NMR spectroscopy as a monitoring tool allows simultaneous structural and quantitative analysis of chemical substances produced during the reaction. In particular, benchtop NMR spectrometers have remarkably high potential, as they are sufficiently compact and portable to be operated even in a fume hood (Table 4).
As real-time measurements using benchtop NMR spectroscopy become possible in “inline” or “online” methods, the number of related works and industrial applications gradually increases [61,83,84]. “Inline” means that the NMR probe and the reaction system are directly connected in series so that all reaction matrices are continuously analyzed by the NMR device (Figure 5), while “online” means that the NMR probe and the reaction system are not directly connected, with samples periodically collected during the reaction transmitted to the analysis system. Both methods do not require the manual transfer of samples [85].
In the early stages, research focused on the applicability of benchtop NMR spectroscopy for the monitoring of known simple reactions such as toluene hydrogenation [62], and the obtained results were validated by comparison with those of chromatographic [63] or offline [64] methods. The pros and cons of using benchtop NMR spectroscopy to monitor Fischer esterification, Suzuki cross-coupling, and oxime formation were studied for a 45 MHz spectrometer [65]. In addition to the known advantages of benchtop NMR spectroscopy, this study demonstrated that non-deuterated solvents can be used in devices without an internal locking system to save costs and increase operation convenience. However, if the signals of interest are disturbed by the solvent or its satellite signals, deuterated solvents should be used. In another work, spectra from semi-deuterated media were acquired by introducing a solvent switching system between the flow outlet and the benchtop NMR spectrometer [66]. In general, it is rather difficult to apply NMR spectroscopy as a monitoring tool for high-temperature and high-pressure reactions or processes. Dalitz et al. developed a flow probe with guaranteed robustness to pressures of up to 40 bar and temperatures of up to 130 °C [67]. In this case, the temperature of the NMR flow cell was kept constant using a bypass system preventing back- or side-reactions caused by cell temperature changes.
The search for ways of mitigating the problems posed by signal overlap and quantitation errors due to low resolution continues to enable the use of benchtop NMR spectroscopy for reaction and process monitoring. Multivariate analysis has been commonly applied to overcome errors in quantitative analysis during process monitoring [68]. For example, a combination of parametric modeling using Bayesian statistics (which effectively incorporates prior knowledge on the investigated system) and benchtop NMR spectroscopy was proposed, focusing on the fact that similar samples are routinely analyzed in industrial applications [69]. Moreover, many reports focused on enhancing monitoring performance, as exemplified by studies of appropriate acquisition parameters [70] and sample shifting [71,72]. The sample shifting technique is a method that mechanically shifts the position of the sample tube after each acquisition to create a new active volume, thereby ensuring short repetition times. The application of these techniques is expected to improve device performance in terms of SNR, quantitation limit, and resolution.
The ultimate goal of reaction or process monitoring might be the automation of a series of processes such as data acquisition, data analysis, and parameter optimization. Therefore, much interest has been drawn to the development of automated self-optimizing continuous production using benchtop NMR spectrometers. Nestle et al. described the requirements for the industrial applications of benchtop NMR spectroscopy and implemented a fully automated benchtop NMR system fulfilling these requirements [73]. In this study (Figure 6), benchtop NMR spectroscopy was used to monitor the chlorination of an alcohol into its alkyl chloride as a representative industrially relevant synthesis. Sans et al. developed a fully automated platform based on an inline benchtop NMR system and carried out various reactions such as imine formation, electrophilic fluorination, and Diels–Alder reactions [74]. The developed system included processes such as inline structure analysis using distortionless enhancement by polarization transfer (DEPT), 2D NMR, and 19F NMR as well as the self-optimization of reaction conditions using a modified version of the Nelder–Mead algorithm [86].
Kern et al. applied benchtop NMR spectroscopy to the monitoring of continuous processes instead of traditional batch processes [75,76], demonstrating that this technique can facilitate chemical process optimization and control in the field of pharmaceutical production. In these studies, indirect hard modeling (IHM) was used to analyze the overlapped signals. As presented in Figure 7, the chemical composition of an unknown mixture was determined by fitting the experimentally measured spectrum to the superposition of the spectra of pure components (reactants, products, and impurities). The IHM algorithm minimizes the residual between the measured data and the mixture model by adjusting the height, width, and position of the pure component signals within predefined model constraints [75,76]. The overall approach has been applied on laboratory to commercial pilot scales.
The application of in- and online approaches using benchtop NMR spectroscopy to various reactions and processes has been continuously studied [77,78,87], and this technique has also been used to study reactions related to various catalysts (from porous heterogeneous catalysts to biological catalysts) [79,80,81,82]. The utility of benchtop NMR spectroscopy for monitoring various industrial reactions is expected to further increase with the increasing maturity of this technique.
2.4.2. Bioprocess Monitoring
Although bioprocess monitoring is studied from a viewpoint similar to that used to study chemical processes or monitor reactions (see above), it fundamentally differs in that it targets processes occurring in a living system and its components with more complex structures [88]. Thus, more severe signal overlap is observed in the spectra acquired using low-field benchtop NMR monitoring systems. For this reason, research on the bioreactor + benchtop NMR spectroscopy combination is not yet as active as that on chemical process monitoring (Table 5).
Nevertheless, meaningful studies have been conducted on the use of benchtop NMR spectroscopy for fermentation or hydrolysis monitoring [89,90,91]. Fermentation is one of the key reactions in the production of a variety of food products, including alcoholic beverages. The first study of fermentation using 43 MHz benchtop NMR spectroscopy was performed on two (yeast and fungal) microbial systems with a bypass system [89]. The monitoring of yeast-induced fermentation was performed through the quantitation of glycerol consumption. Despite their overlap, the glycerol signals were sufficient to obtain the required quantitative information, losing intensity with progressing fermentation. Fungal fermentation was somewhat more complicated because of by-product (e.g., itaconic acid and glycolipid) formation. However, the concentrations of target compounds quantified by online benchtop NMR spectroscopy well agreed with those obtained by an offline method (HPLC; Figure 8).
Hydrolysis is widely used in many industries, as it allows one to convert low-value materials into high-value ones. For example, inverted sugar, obtained through the enzyme- or acid-catalyzed hydrolysis of sucrose, is sweeter than regular sugar and retains food moisture better. As inverted sugars are widely used in the beverage and bakery industries, the monitoring of sucrose hydrolysis in terms of quality control is a task of high importance. This hydrolysis reaction was monitored using online benchtop NMR spectroscopy in flow mode [90] to reveal that the sucrose signal lost intensity with increasing hydrolysis extent, while glucose and fructose signals concomitantly gained intensity. In addition, the kinetic constant determined using the fractional transformation model was similar to the values obtained elsewhere.
Another notable example is the monitoring of the enzymatic hydrolysis of marine food manufacture byproducts [91], as this hydrolysis can be used to obtain high-value-added products such as functional foods, health food supplements, pharmaceuticals, and raw materials for cosmetics. Both online and offline NMR measurements performed on the enzymatic hydrolysis of red cod, salmon and shrimp allowed reaction process monitoring and showed good agreement in the calculated reaction rates.
Solvent signal suppression is important for NMR spectroscopy, as large solvent signals negatively affect the quantitative interpretation of spectra. A recent study aimed to suppress the solvent signal by applying various pulse sequences in a benchtop NMR spectrometer equipped with gradient coils (Figure 9) [97]. In particular, water signal suppression is important for bioprocess monitoring, as water is produced in the target reactions or is contained in the matrix. Several experiments were conducted to effectively suppress water signals in studies on monitoring lipid production by microalgae [30,92]. Among the various water suppression pulse sequences used by Bouillaud et al., the W5 (WATERGATE-5: WATER suppression by GrAdient-Tailored Excitation) pulse sequence showed optimal results and was chosen for online monitoring [30]. Since the type of best-performing pulse sequence may depend on the sample, several pulse sequences should be tested. Comparison with high-field NMR and GC analysis techniques confirmed that benchtop NMR spectroscopy is suitable for the online monitoring of lipid production in bioprocesses [92].
The Blümich group focused on biodiesel-related research [93,94,95,96], revealing that although the interpretation of all signals in low-field NMR spectra was impossible, the amount of unsaturated fatty acid methyl esters could be estimated using multivariate calibration such as PLS-R, as in the case of edible fat and oil analyses. To increase production yield, a benchtop NMR spectrometer was used to monitor the reaction under various conditions (e.g., catalyst activity and temperature) and to study the related mechanisms and kinetics [96].
2.4.3. Disease Monitoring
NMR spectroscopy, along with mass spectrometry coupled with liquid chromatography or GC, is one of the main analytical techniques for metabolism and bioprocess monitoring because of its good reproducibility and quantitation performance and suitability for structural analysis. Additionally, the non-destructive nature of NMR spectroscopy allows for easy sample recovery, and the related sample preparation is very simple [98,99]. Studies on metabolism mainly focus on determining the types and contents of metabolites, which are low-molecular substances (<1 kDa) present in biological systems and are predominantly produced in response to external stimuli such as genetic factors, sex, lifestyle, diet, and drugs, providing comprehensive information on systemic fluctuations from the cellular level. Therefore, metabolite levels in human biofluids can be important indicators for the diagnosis, prognostic information, and prevention of diseases [100]. NMR spectroscopy has been frequently used to detect disease fingerprints and biomarkers in biofluids such as urine, blood plasma, and serum [101,102].
In particular, the demand for disease-related biofluid analysis is increasing in hospitals and medical institutes, as direct and rapid analysis is required in these facilities. In this sense, benchtop NMR spectroscopy is expected to allow convenient and high-performance biomedical and/or clinical chemistry analysis at low cost, as has been verified in related studies (Table 6).
The first study related to disease diagnosis and monitoring using benchtop NMR spectroscopy dealt with type 2 diabetes and relied on the analysis of metabolites in human urine [103,104]. Substances such as α-glucose and acetone in urine, which are common biomarkers of diabetes, could be detected in 60 MHz 1H NMR spectra. Despite metabolite signal overlap due to low resolution, the results were consistent with those of high-field NMR spectroscopy [103]. Moreover, 2D COSY allowed for an improved level of identification and sensitivity (Figure 10). A subsequent study focused on untargeted urinary biomarkers in patients with type 2 diabetes [106].
Stolz et al. demonstrated the feasibility of glucose quantitation in human whole blood using a 1 T (43 MHz) benchtop NMR spectrometer [106]. The authors employed a three-step approach, starting with the analysis of aqueous solutions of known glucose concentrations, going through bovine plasma analysis, and finally analyzing human whole blood samples. A deconvolution technique and optimized potentials for liquid simulation analysis were used to quantify the signals of interest.
3. Recent Advanced Methodologies in Benchtop NMR Spectroscopy
3.1. Techniques for Sensitivity and Resolution Enhancement
As already mentioned, the major drawback of benchtop NMR spectroscopy is the unavoidable signal overlap due to low (compared to that of high-field NMR spectroscopy) resolution. Many studies tried to overcome this limitation by applying techniques developed to handle the analysis of complex mixtures by high-field NMR spectroscopy to benchtop NMR spectroscopy (Table 7). One of the most important techniques is field-gradient-based solvent suppression [97,107], which reduces the overlap between the solvent signal and the signals of interest and thus helps to obtain the desired information. In addition, this approach allows the use of non-deuterated solvents and thus helps to reduce costs. Water suppression techniques are particularly essential when benchtop NMR spectroscopy is used for bioprocess monitoring [30,90,91,92].
Figure 11 shows that spectral resolution can be increased using various pulse sequences and the homo-decoupling method, which is another technique commonly used in high-field NMR spectroscopy. Moreover, benchtop NMR spectrometers with gradient coils can be used to increase signal sensitivity through the programming of various pulse sequences [108]. As the spectral patterns according to the pulse sequence can vary from sample to sample, it is important to choose an appropriate pulse sequence with optimal resolution and sensitivity. The addition of lanthanide-based shift agents is also used to improve the resolution of overlapping signals. For example, the resolution of a 60 MHz benchtop NMR spectrum of a peptide was improved through the addition of salts as chemical shift agents [109]. In this study, improved resolution resulted in more accurate quantitative analysis, which allowed the researchers to better understand peptide reaction kinetics.
Although they are not universally applicable to all samples, hyperpolarization methods can be used for the enhancement of low-field NMR signals [110,111,112,113,114]. Hyperpolarization generates a population distribution that is significantly larger than that dictated by the Boltzmann distribution at thermal equilibrium. Among the hyperpolarization methods such as dynamic nuclear polarization, spin-exchange optical pumping, and parahydrogen-induced polarization (PHIP), PHIP is the one most commonly used to enhance the sensitivity of benchtop NMR spectroscopy. In particular, the reversible exchange (SABRE) method, a non-hydrogenation PHIP technique, has been exclusively used, as it does not induce the chemical changes of the target compound [111] and allows a sufficient SNR to be obtained in a very short time without additional sample concentration [113]. This also enables the implementation of useful techniques that are otherwise difficult to use in benchtop NMR spectroscopy due to its low sensitivity, e.g., 13C, 2D 1H-1H COSY, and 2D 1H-13C HETCOR [112].
3.2. Multidimensional NMR Spectroscopy
Multidimensional NMR spectroscopy can be used to effectively analyze overlapped signals in one-dimensional spectra caused by the low resolution of benchtop NMR spectroscopy [7,10]. Most of the studies introduced in this review have shown that benchtop NMR spectroscopy can be used as a spectroscopic fingerprint method or a simple molecular analysis method based on 1D spectra (Table 8). However, many researchers tried to show that benchtop NMR spectroscopy can be used as a complete analytical tool for molecular structures through the application of 2D techniques [4,115]. For example, the structure of strychnine, a natural compound used as a doping agent in sports, was analyzed using a 1-T benchtop NMR spectrometer using all techniques fundamentally necessary for structural analysis, namely 1H NMR, 13C NMR, DEPT, COSY, HETCOR, HSQC, HMBC, and J-resolved spectroscopy [116].
An ultrafast 2D NMR technique suitable for the efficient and rapid authentication of edible oil has been proposed [117]. In general, 2D techniques are not suitable for process and reaction monitoring because of their long acquisition time. However, much effort has been made to apply ultrafast techniques, which allow one to obtain a 2D spectrum with a single scan using strong gradient coils, to benchtop NMR spectroscopy [115]. In particular, as these technologies have been applied to reaction and process monitoring, the availability of real-time structural analysis differentiated from other monitoring equipment has greatly increased (Figure 12). Almost all available high-field NMR techniques such as COSY, HETCOR, HSQC, HMBC, and J-resolved spectroscopy have been implemented [66,74,115,118,119,120]. The application of these 2D techniques is expected to make benchtop NMR spectroscopy a tool that can partially replace high-field NMR spectroscopy in chemical structure analysis or reaction mechanism research.
3.3. Heteroatom NMR Spectroscopy
Despite the availability of other NMR-active nuclei, 1H NMR spectroscopy remains a routine technique for both high- and low-field spectrometers. In particular, the high natural abundance and sensitivity of 1H compared to those of other nuclides makes this nucleus widely used in low-field benchtop NMR spectroscopy. However, the development of magnetic field stabilization and signal measurement techniques has inspired studies on observing heteroatoms by benchtop NMR spectroscopy (Table 9). Although 13C is one of the less sensitive nuclides, the related signals can be measured even by benchtop NMR spectroscopy using sufficiently long measurement times [49,51]. 13C NMR spectroscopy is essential for the structural analysis of organics, as their backbone is generally made of carbon. Therefore, techniques such as 13C 1D NMR as well as 13C-DEPT and 1H-13C 2D NMR are particularly useful for structural analysis [8,10,49]. 13C NMR signal enhancement techniques applying the sample shifting method [72] or the SABRE technique [111,112] have also been studied.
19F is a very useful nuclide for benchtop NMR spectroscopy, as its relatively high sensitivity and a resonant frequency similar to that of to 1H allow signals to be measured in the same coil. Low-field 19F NMR spectroscopy has been used for pharmaceutical and drug identification [43,44], reaction monitoring [121], and organic compound analysis [122,123]. 19F NMR spectroscopy can also be used as an auxiliary method for 1H NMR spectral analysis, especially in cases of severe signal overlap [10]. 31P has a relatively good sensitivity and 100% natural abundance, and is a very important nuclide for food and pharmaceutical analyses [42,124]. Figure 13 shows a good example of 1H-31P 2D NMR spectroscopy usage for phospholipid analysis. Recently, benchtop NMR spectroscopy methods targeting special nuclides such as 7Li [125], 129Xe [126], and 207Pb [127] have also been developed.
Currently, as most benchtop NMR spectrometers are manufactured to be suitable for the observation of specific nuclides, it is difficult to analyze various nuclides simultaneously. However, the increasing demand for multi-nuclide analysis is expected to inspire the development of a technology allowing the simultaneous measurement of multi-nuclides (as in the case of high-magnetic field NMR spectroscopy) using benchtop NMR spectroscopy.
4. Conclusions
In view of the fact that permanent magnets currently provide fields sufficiently homogeneous for the observation of small differences in chemical shifts even in low-field NMR instruments, the recent years have witnessed a surge in the number of studies related to the applications of benchtop NMR spectroscopy. These studies have shown that benchtop NMR spectroscopy can be used as a powerful technique in combination with advanced signal enhancement technologies or conventional techniques such as chromatography, mass spectrometry, and FT-IR spectroscopy. Advantageously benchtop NMR spectroscopy provides not only structural, but also quantitative information without the need for additional calibration while offering the benefits of low cost and operational simplicity. However, the fundamental drawbacks of benchtop NMR spectroscopy, namely low resolution and sensitivity, complicate the intuitive interpretation of the related signals. Traditional methods of overcoming these disadvantages include the application of statistical means, pulse sequences with gradient coils, NMR-active heteroatom (13C, 19F and 31P) analysis, and multidimensional experiments.
As a result of these studies, the utilization of benchtop NMR spectroscopy is increasing, and its application scope is expanding. More recently, researchers have attempted to overcome the intrinsic limitations of low-field NMR spectroscopy through the introduction of artificial intelligence, which is expected to result in a breakthrough in benchtop NMR spectroscopy. In addition, based on the current state-of-the-art benchtop NMR technology, it is anticipated that NMR devices using permanent magnets will be further miniaturized to be hand-carried in the near future.
Author Contributions
Conceptualization, H.-Y.Y. and S.A.; methodology, H.-Y.Y.; validation, S.M. and S.A.; investigation, H.-Y.Y.; resources, S.A.; data curation, S.M.; writing—original draft preparation, H.-Y.Y.; writing—review and editing, S.A.; visualization, S.M.; supervision, S.A.; project administration, S.A.; funding acquisition, H.-Y.Y. and S.A. All authors have read and agreed to the published version of the manuscript.
Funding
This research was supported by the Chung-Ang University Graduate Research Scholarship in 2017.
Institutional Review Board Statement
Not applicable.
Informed Consent Statement
Not applicable.
Data Availability Statement
Not applicable.
Conflicts of Interest
The authors declare no conflict of interest.
References
- Gunther, H.; Gunther, H. NMR Spectroscopy: Basic Principles, Concepts, and Applications in Chemistry; John Wiley & Sons: Chichester, UK, 1994. [Google Scholar]
- Claridge, T.D. High-Resolution NMR Techniques in Organic Chemistry; Elsevier: Amsterdam, The Netherlands, 2016; Volume 27. [Google Scholar]
- James, T.L. Fundamentals of NMR; Online Textbook; Department of Pharmaceutical Chemistry, University of California: San Francisco, CA, USA, 1998; pp. 1–31. [Google Scholar]
- Blumich, B. Introduction to compact NMR: A review of methods. Trac-Trend Anal. Chem. 2016, 83, 2–11. [Google Scholar] [CrossRef]
- Blümich, B. Low-field and benchtop NMR. J. Magn. Reson. 2019, 306, 27–35. [Google Scholar] [CrossRef] [PubMed]
- Zalesskiy, S.S.; Danieli, E.; Blumich, B.; Ananikov, V.P. Miniaturization of NMR systems: Desktop spectrometers, microcoil spectroscopy, and “NMR on a chip” for chemistry, biochemistry, and industry. Chem. Rev. 2014, 114, 5641–5694. [Google Scholar] [CrossRef] [PubMed]
- Blümich, B.; Singh, K. Desktop NMR and its applications from materials science to organic chemistry. Angew. Chem. Int. Ed. 2018, 57, 6996–7010. [Google Scholar] [CrossRef]
- Grootveld, M.; Percival, B.; Gibson, M.; Osman, Y.; Edgar, M.; Molinari, M.; Mather, M.L.; Casanova, F.; Wilson, P.B. Progress in low-field benchtop NMR spectroscopy in chemical and biochemical analysis. Anal. Chim. Acta 2019, 1067, 11–30. [Google Scholar] [CrossRef] [Green Version]
- Blümich, B.; Perlo, J.; Casanova, F. Mobile single-sided NMR. Prog. Nucl. Magn. Reson. Spectrosc. 2008, 52, 197–269. [Google Scholar] [CrossRef]
- Singh, K.; Blumich, B. NMR spectroscopy with compact instruments. Trac-Trend Anal. Chem. 2016, 83, 12–26. [Google Scholar] [CrossRef]
- Hatzakis, E. Nuclear Magnetic Resonance (NMR) spectroscopy in food science: A comprehensive review. Compr. Rev. Food Sci. F 2019, 18, 189–220. [Google Scholar] [CrossRef] [Green Version]
- Defernez, M.; Colquhoun, I.J. Factors affecting the robustness of metabolite fingerprinting using 1H NMR spectra. Phytochemistry 2003, 62, 1009–1017. [Google Scholar] [CrossRef]
- Sobolev, A.P.; Thomas, F.; Donarski, J.; Ingallina, C.; Circi, S.; Marincola, F.C.; Capitani, D.; Mannina, L. Use of NMR applications to tackle future food fraud issues. Trends Food Sci. Technol. 2019, 91, 347–353. [Google Scholar] [CrossRef] [Green Version]
- McDowell, D.; Defernez, M.; Kemsley, E.K.; Elliott, C.T.; Koidis, A. Low vs. high field 1h Nmr spectroscopy for the detection of adulteration of cold pressed rapeseed oil with refined oils. LWT 2019, 111, 490–499. [Google Scholar] [CrossRef]
- Kim, J.H.; Lee, H.J.; Kwon, K.; Chun, H.S.; Ahn, S.; Kim, B.H. A 43 MHz low-field benchtop 1H nuclear magnetic resonance method to discriminate perilla oil authenticity. J. Oleo Sci. 2018, 67, 507–513. [Google Scholar] [CrossRef] [Green Version]
- Defernez, M.; Wren, E.; Watson, A.D.; Gunning, Y.; Colquhoun, I.J.; Le Gall, G.; Williamson, D.; Kemsley, E.K. Low-field 1H NMR spectroscopy for distinguishing between arabica and robusta ground roast coffees. Food Chem. 2017, 216, 106–113. [Google Scholar] [CrossRef] [PubMed] [Green Version]
- Isaac-Lam, M.F. Determination of alcohol content in alcoholic beverages using 45 MHz benchtop NMR spectrometer. Int. J. Spectrosc. 2016, 2016, 1–8. [Google Scholar] [CrossRef] [PubMed]
- Rudszuck, T.; Foerster, E.; Nirschl, H.; Guthausen, G. Low-field NMR for quality control on oils. Magn. Reson. Chem. 2019, 57, 777–793. [Google Scholar] [CrossRef] [PubMed]
- Van Beek, T.A. Low-field benchtop NMR spectroscopy: Status and prospects in natural product analysis. Phytochem. Anal. 2021, 32, 24–37. [Google Scholar] [CrossRef] [Green Version]
- Parker, T.; Limer, E.; Watson, A.D.; Defernez, M.; Williamson, D.; Kemsley, E.K. 60 MHz 1H NMR spectroscopy for the analysis of edible oils. Trends Anal. Chem. 2014, 57, 147–158. [Google Scholar] [CrossRef] [PubMed] [Green Version]
- Krause, A.; Wu, Y.; Tian, R.; van Beek, T.A. Is low-field NMR a complementary tool to GC-MS in quality control of essential oils? A case study: Patchouli essential oil. Planta Med. 2018, 84, 953–963. [Google Scholar] [CrossRef] [Green Version]
- Gerdova, A.; Defernez, M.; Jakes, W.; Limer, E.; McCallum, C.; Nott, K.; Parker, T.; Rigby, N.; Sagidullin, A.; Watson, A. 60 MHz 1H NMR spectroscopy of triglyceride mixtures. In Magnetic Resonance in Food Science: Defining Food by Magnetic Resonance; Capozzi, F., Laghi, L., Belton., P.S., Eds.; Royal Society of Chemistry: London, UK, 2015; pp. 17–30. [Google Scholar]
- Gunning, Y.; Jackson, A.J.; Colmer, J.; Taous, F.; Philo, M.; Brignall, R.M.; El Ghali, T.; Defernez, M.; Kemsley, E.K. High-throughput screening of argan oil composition and authenticity using benchtop 1H NMR. Magn. Reson. Chem. 2020, 58, 1177–1186. [Google Scholar] [CrossRef] [Green Version]
- Jakes, W.; Gerdova, A.; Defernez, M.; Watson, A.; McCallum, C.; Limer, E.; Colquhoun, I.; Williamson, D.; Kemsley, E. Authentication of beef versus horse meat using 60 MHz 1H NMR spectroscopy. Food Chem. 2015, 175, 1–9. [Google Scholar] [CrossRef] [Green Version]
- Gunning, Y.; Defernez, M.; Watson, A.D.; Beadman, N.; Colquhoun, I.J.; Le Gall, G.; Philo, M.; Garwood, H.; Williamson, D.; Davis, A.P. 16-O-methylcafestol is present in ground roast Arabica coffees: Implications for authenticity testing. Food Chem. 2018, 248, 52–60. [Google Scholar] [CrossRef]
- Soyler, A.; Cikrikci, S.; Cavdaroglu, C.; Bouillaud, D.; Farjon, J.; Giraudeau, P.; Oztop, M.H. Multi-scale benchtop 1H NMR spectroscopy for milk analysis. LWT 2021, 139, 1–10. [Google Scholar] [CrossRef]
- Matviychuk, Y.; Yeo, J.; Holland, D.J. A field-invariant method for quantitative analysis with benchtop NMR. J. Magn. Reson. 2019, 298, 35–47. [Google Scholar] [CrossRef]
- Burkhardtsmaier, P.; Pavlovskaja, K.; Maier, D.; Schäfer, S.; Salat, U.; Schmidt, M.S. Quantitative monitoring of the fermentation process of a barley malt mash by benchtop 1H NMR spectroscopy. Food Anal. Methods 2021, 1–7. [Google Scholar] [CrossRef]
- Santos, P.M.; Pereira-Filho, E.R.; Colnago, L.A. Detection and quantification of milk adulteration using time domain nuclear magnetic resonance (TD-NMR). Microchem. J. 2016, 124, 15–19. [Google Scholar] [CrossRef]
- Bouillaud, D.; Heredia, V.; Castaing-Cordier, T.; Drouin, D.; Charrier, B.; Goncalves, O.; Farjon, J.; Giraudeau, P. Benchtop flow NMR spectroscopy as an online device for the in vivo monitoring of lipid accumulation in microalgae. Algal Res. 2019, 43, 1–6. [Google Scholar] [CrossRef]
- Duffy, J.; Urbas, A.; Niemitz, M.; Lippa, K.; Marginean, I. Differentiation of fentanyl analogues by low-field NMR spectroscopy. Anal. Chim. Acta 2019, 1049, 161–169. [Google Scholar] [CrossRef]
- Pagès, G.; Gerdova, A.; Williamson, D.; Gilard, V.; Martino, R.; Malet-Martino, M. Evaluation of a benchtop cryogen-free low-field 1H NMR spectrometer for the analysis of sexual enhancement and weight loss dietary supplements adulterated with pharmaceutical substances. Anal. Chem. 2014, 86, 11897–11904. [Google Scholar] [CrossRef]
- Wu, N.; Balayssac, S.; Danoun, S.; Malet-Martino, M.; Gilard, V. Chemometric analysis of low-field 1H NMR spectra for unveiling adulteration of slimming dietary supplements by pharmaceutical compounds. Molecules 2020, 25, 193. [Google Scholar] [CrossRef] [Green Version]
- Assemat, G.; Balayssac, S.; Gerdova, A.; Gilard, V.; Caillet, C.; Williamson, D.; Malet-Martino, M. Benchtop low-field 1H Nuclear magnetic resonance for detecting falsified medicines. Talanta 2019, 196, 163–173. [Google Scholar] [CrossRef]
- Santos, A.D.C.; Dutra, L.M.; Menezes, L.R.A.; Santos, M.F.C.; Barison, A. Forensic NMR spectroscopy: Just a beginning of a promising partnership. Trac-Trend Anal. Chem. 2018, 107, 31–42. [Google Scholar] [CrossRef]
- Castaing-Cordier, T.; Ladroue, V.; Besacier, F.; Bulete, A.; Jacquemin, D.; Giraudeau, P.; Farjon, J. High-field and benchtop NMR spectroscopy for the characterization of new psychoactive substances. Forensic Sci. Int. 2021, 321, 1–8. [Google Scholar] [CrossRef]
- Assemat, G.; Dubocq, F.; Balayssac, S.; Lamoureux, C.; Malet-Martino, M.; Gilard, V. Screening of “spice” herbal mixtures: From high-field to low-field proton NMR. Forensic Sci. Int. 2017, 279, 88–95. [Google Scholar] [CrossRef]
- Zhong, Y.; Huang, K.; Luo, Q.; Yao, S.; Liu, X.; Yang, N.; Lin, C.; Luo, X. The application of a desktop NMR spectrometer in drug analysis. Int. J. Anal. Chem. 2018, 2018, 1–7. [Google Scholar] [CrossRef]
- Araneda, J.F.; Chu, T.; Leclerc, M.C.; Riegel, S.D.; Spingarn, N. Quantitative analysis of cannabinoids using benchtop NMR instruments. Anal. Methods-UK 2020, 12, 4853–4857. [Google Scholar] [CrossRef]
- Hussain, J.H.; Gilbert, N.; Costello, A.; Schofield, C.J.; Kemsley, E.K.; Sutcliffe, O.B.; Mewis, R.E. Quantification of MDMA in seized tablets using benchtop 1H NMR spectroscopy in the absence of internal standards. Forensic Chem. 2020, 20, 1–9. [Google Scholar] [CrossRef]
- Keizers, P.H.; Bakker, F.; Ferreira, J.; Wackers, P.F.; van Kollenburg, D.; van der Aa, E.; van Beers, A. Benchtop NMR spectroscopy in the analysis of substandard and falsified medicines as well as illegal drugs. J. Pharm. Biomed. Anal. 2020, 178, 1–10. [Google Scholar] [CrossRef]
- Bogun, B.; Moore, S. 1H and 31P benchtop NMR of liquids and solids used in and/or produced during the manufacture of methamphetamine by the HI reduction of pseudoephedrine/ephedrine. Forensic Sci. Int. 2017, 278, 68–77. [Google Scholar] [CrossRef]
- Gilbert, N.; Mewis, R.E.; Sutcliffe, O.B. Fast & fluorinated—Development and validation of a rapid benchtop NMR approach and other routine screening methods for the detection and quantification of synthesized fluorofentanyl derivatives. Forensic Chem. 2021, 23, 1–12. [Google Scholar] [CrossRef]
- Hulme, M.C.; Hayatbakhsh, A.; Brignall, R.M.; Gilbert, N.; Costello, A.; Schofield, C.J.; Williamson, D.C.; Kemsley, E.K.; Sutcliffe, O.B.; Mewis, R.E. Detection, discrimination and quantification of amphetamine, cathinone and nor-ephedrine regioisomers using benchtop 1H and 19F NMR spectroscopy. Magn. Reson. Chem. 2021, 1–10. [Google Scholar] [CrossRef]
- Antonides, L.H.; Brignall, R.M.; Costello, A.; Ellison, J.; Firth, S.E.; Gilbert, N.; Groom, B.J.; Hudson, S.J.; Hulme, M.C.; Marron, J. Rapid identification of novel psychoactive and other controlled substances using low-field 1H NMR spectroscopy. ACS Omega 2019, 4, 7103–7112. [Google Scholar] [CrossRef] [Green Version]
- Scheirs, J. Compositional and Failure Analysis of Polymers: A Practical Approach; John Wiley & Sons: Hoboken, NJ, USA, 2000. [Google Scholar]
- Ibbett, R.N. NMR Spectroscopy of Polymers; Springer Science & Business Media: Berlin/Heidelberg, Germany, 2012. [Google Scholar]
- Duchowny, A.; Adams, A. Compact NMR spectroscopy for low-cost identification and quantification of PVC plasticizers. Molecules 2021, 26, 1221. [Google Scholar] [CrossRef] [PubMed]
- Singh, K.; Blümich, B. Compact low-field NMR spectroscopy and chemometrics: A tool box for quality control of raw rubber. Polymer 2018, 141, 154–165. [Google Scholar] [CrossRef]
- Chakrapani, S.B.; Minkler, M.J.; Beckingham, B.S. Low-field 1H-NMR spectroscopy for compositional analysis of multicomponent polymer systems. Analyst 2019, 144, 1679–1686. [Google Scholar] [CrossRef]
- Singh, K.; Bluemich, B. Desktop NMR spectroscopy for quality control of raw rubber. Macromol. Symp. 2016, 365, 191–193. [Google Scholar] [CrossRef]
- Minkler, M.J., Jr.; Kim, J.M.; Shinde, V.V.; Beckingham, B.S. Low-field 1H NMR spectroscopy: Factors impacting signal-to-noise ratio and experimental time in the context of mixed microstructure polyisoprenes. Magn. Reson. Chem. 2020, 58, 1168–1176. [Google Scholar] [CrossRef] [PubMed]
- Adams, A. Non-destructive analysis of polymers and polymer-based materials by compact NMR. Magn. Reson. Imaging 2019, 56, 119–125. [Google Scholar] [CrossRef]
- Vargas, M.A.; Cudaj, M.; Hailu, K.; Sachsenheimer, K.; Guthausen, G. Online low-field 1H NMR spectroscopy: Monitoring of emulsion polymerization of butyl acrylate. Macromolecules 2010, 43, 5561–5568. [Google Scholar] [CrossRef]
- Knox, S.T.; Parkinson, S.; Stone, R.; Warren, N.J. Benchtop flow-NMR for rapid online monitoring of RAFT and free radical polymerisation in batch and continuous reactors. Polym. Chem. 2019, 10, 4774–4778. [Google Scholar] [CrossRef]
- Rubens, M.; Van Herck, J.; Junkers, T. Automated Polymer synthesis platform for integrated conversion targeting based on inline benchtop NMR. ACS Macro Lett. 2019, 8, 1437–1441. [Google Scholar] [CrossRef]
- Cudaj, M.; Guthausen, G.; Hofe, T.; Wilhelm, M. Online coupling of size-exclusion chromatography and low-field 1H NMR spectroscopy. Macromol. Chem. Phys. 2012, 213, 1933–1943. [Google Scholar] [CrossRef]
- Höpfner, J.; Ratzsch, K.F.; Botha, C.; Wilhelm, M. Medium resolution 1H-NMR at 62 MHz as a new chemically sensitive online detector for size-exclusion chromatography (SEC–NMR). Macromol. Rapid Commun. 2018, 39, 1–7. [Google Scholar] [CrossRef] [PubMed]
- Botha, C.; Hopfner, J.; Mayerhofer, B.; Wilhelm, M. On-line SEC-MR-NMR hyphenation: Optimization of sensitivity and selectivity on a 62 MHz benchtop NMR spectrometer. Polym. Chem. 2019, 10, 2230–2246. [Google Scholar] [CrossRef] [Green Version]
- Höpfner, J.; Mayerhöfer, B.; Botha, C.; Bouillaud, D.; Farjon, J.; Giraudeau, P.; Wilhelm, M. Solvent suppression techniques for coupling of size exclusion chromatography and 1H NMR using benchtop spectrometers at 43 and 62 MHz. J. Magn. Reson. 2021, 323, 1–13. [Google Scholar] [CrossRef]
- Meyer, K.; Kern, S.; Zientek, N.; Guthausen, G.; Maiwald, M. Process control with compact NMR. TrAC Trends Anal. Chem. 2016, 83, 39–52. [Google Scholar] [CrossRef]
- Guthausen, G.; von Garnier, A.; Reimert, R. Investigation of hydrogenation of toluene to methylcyclohexane in a trickle bed reactor by low-field nuclear magnetic resonance spectroscopy. Appl. Spectrosc. 2009, 63, 1121–1127. [Google Scholar] [CrossRef]
- Danieli, E.; Perlo, J.; Duchateau, A.; Verzijl, G.; Litvinov, V.; Blümich, B.; Casanova, F. On-line monitoring of chemical reactions by using bench-top nuclear magnetic resonance spectroscopy. ChemPhysChem 2014, 15, 3060–3066. [Google Scholar] [CrossRef]
- Goldbach, M.; Danieli, E.; Perlo, J.; Kaptein, B.; Litvinov, V.M.; Blümich, B.; Casanova, F.; Duchateau, A.L. Preparation of Grignard reagents from magnesium metal under continuous flow conditions and on-line monitoring by NMR spectroscopy. Tetrahedron Lett. 2016, 57, 122–125. [Google Scholar] [CrossRef]
- Silva Elipe, M.V.; Milburn, R.R. Monitoring chemical reactions by low-field benchtop NMR at 45 MHz: Pros and cons. Magn. Reson. Chem. 2016, 54, 437–443. [Google Scholar] [CrossRef]
- Ahmed-Omer, B.; Sliwinski, E.; Cerroti, J.P.; Ley, S.V. Continuous processing and efficient in situ reaction monitoring of a hypervalent iodine (III) mediated cyclopropanation using benchtop NMR spectroscopy. Org. Process Res. Dev. 2016, 20, 1603–1614. [Google Scholar] [CrossRef] [Green Version]
- Dalitz, F.; Kreckel, L.; Maiwald, M.; Guthausen, G. Quantitative medium-resolution NMR spectroscopy under non-equilibrium conditions, studied on the example of an esterification reaction. Appl. Magn. Reson. 2014, 45, 411–425. [Google Scholar] [CrossRef]
- Sagmeister, P.; Poms, J.; Williams, J.D.D.; Kappe, C.O. Multivariate analysis of inline benchtop NMR data enables rapid optimization of a complex nitration in flow. React. Chem. Eng. 2020, 5, 677–684. [Google Scholar] [CrossRef] [Green Version]
- Matviychuk, Y.; Steimers, E.; von Harbou, E.; Holland, D.J. Bayesian approach for automated quantitative analysis of benchtop NMR data. J. Magn. Reson. 2020, 319, 1–17. [Google Scholar] [CrossRef]
- Maschmeyer, T.; Prieto, P.L.; Grunert, S.; Hein, J.E. Exploration of continuous-flow benchtop NMR acquisition parameters and considerations for reaction monitoring. Magn. Reson. Chem. 2020, 58, 1234–1248. [Google Scholar] [CrossRef]
- Friebel, A.; Froscher, A.; Munnemann, K.; von Harbou, E.; Hasse, H. In situ measurement of liquid-liquid equilibria by medium field nuclear magnetic resonance. Fluid Phase Equilibr. 2017, 438, 44–52. [Google Scholar] [CrossRef]
- Romero, J.A.; Kazimierczuk, K.; Golowicz, D. Enhancing benchtop NMR spectroscopy by means of sample shifting. Analyst 2020, 145, 7406–7411. [Google Scholar] [CrossRef]
- Nestle, N.; Lim, Z.J.; Böhringer, T.; Abtmeyer, S.; Arenz, S.; Leinweber, F.C.; Weiß, T.; von Harbou, E. Taking compact NMR to monitoring real reactions in large-scale chemical industries—General considerations and learnings from a lab-scale test case. Magn. Reson. Chem. 2020, 58, 1213–1221. [Google Scholar] [CrossRef]
- Sans, V.; Porwol, L.; Dragone, V.; Cronin, L. A self optimizing synthetic organic reactor system using real-time in-line NMR spectroscopy. Chem. Sci. 2015, 6, 1258–1264. [Google Scholar] [CrossRef] [PubMed] [Green Version]
- Kern, S.; Meyer, K.; Guhl, S.; Grasser, P.; Paul, A.; King, R.; Maiwald, M. Online low-field NMR spectroscopy for process control of an industrial lithiation reaction-automated data analysis. Anal. Bioanal. Chem. 2018, 410, 3349–3360. [Google Scholar] [CrossRef]
- Kern, S.; Wander, L.; Meyer, K.; Guhl, S.; Mukkula, A.R.G.; Holtkamp, M.; Salge, M.; Fleischer, C.; Weber, N.; King, R. Flexible automation with compact NMR spectroscopy for continuous production of pharmaceuticals. Anal. Bioanal. Chem. 2019, 411, 3037–3046. [Google Scholar] [CrossRef] [PubMed] [Green Version]
- Picard, B.; Gouilleux, B.; Lebleu, T.; Maddaluno, J.; Chataigner, I.; Penhoat, M.; Felpin, F.X.; Giraudeau, P.; Legros, J. Oxidative neutralization of mustard-gas simulants in an on-board flow device with in-line NMR monitoring. Angew. Chem. Int. Ed. 2017, 56, 7568–7572. [Google Scholar] [CrossRef] [PubMed]
- Friebel, A.; von Harbou, E.; Munnemann, K.; Hasse, H. Online process monitoring of a batch distillation by medium field NMR spectroscopy. Chem. Eng. Sci. 2020, 219, 1–8. [Google Scholar] [CrossRef]
- Kim, K.H.; Choi, J.W.; Kim, C.S.; Jeong, K. Parahydrogen-induced polarization in the hydrogenation of lignin-derived phenols using Wilkinson’s catalyst. Fuel 2019, 255, 1–5. [Google Scholar] [CrossRef]
- Leutzsch, M.; Sederman, A.J.; Gladden, L.F.; Mantle, M.D. In situ reaction monitoring in heterogeneous catalysts by a benchtop NMR spectrometer. Magn. Reson. Imaging 2019, 56, 138–143. [Google Scholar] [CrossRef] [Green Version]
- Claaßen, C.; Mack, K.; Rother, D. Benchtop NMR for online reaction monitoring of the biocatalytic synthesis of aromatic amino alcohols. ChemCatChem 2020, 12, 1190–1199. [Google Scholar] [CrossRef] [Green Version]
- Nantogma, S.; Joalland, B.; Wilkens, K.; Chekmenev, E.Y. Clinical-scale production of nearly pure (>98.5%) parahydrogen and quantification by benchtop NMR spectroscopy. Anal. Chem. 2021, 93, 3594–3601. [Google Scholar] [CrossRef]
- Dalitz, F.; Cudaj, M.; Maiwald, M.; Guthausen, G. Process and reaction monitoring by low-field NMR spectroscopy. Prog. Nucl. Magn. Reson. Spectrosc. 2012, 60, 52–70. [Google Scholar] [CrossRef]
- Mitchell, J.; Gladden, L.F.; Chandrasekera, T.C.; Fordham, E.J. Low-field permanent magnets for industrial process and quality control. Prog. Nucl. Magn. Reson. Spectrosc. 2014, 76, 1–60. [Google Scholar] [CrossRef]
- Gomez, M.V.; de la Hoz, A. NMR reaction monitoring in flow synthesis. Beilstein J. Org. Chem. 2017, 13, 285–300. [Google Scholar] [CrossRef] [Green Version]
- Nelder, J.A.; Mead, R. A simplex method for function minimization. Comput. J. 1965, 7, 308–313. [Google Scholar] [CrossRef]
- Giraudeau, P.; Felpin, F.-X. Flow reactors integrated with in-line monitoring using benchtop NMR spectroscopy. React. Chem. Eng. 2018, 3, 399–413. [Google Scholar] [CrossRef]
- Bouillaud, D.; Farjon, J.; Goncalves, O.; Giraudeau, P. Benchtop NMR for the monitoring of bioprocesses. Magn. Reson. Chem. 2019, 57, 794–804. [Google Scholar] [CrossRef]
- Kreyenschulte, D.; Paciok, E.; Regestein, L.; Blumich, B.; Buchs, J. Online monitoring of fermentation processes via non-invasive low-field NMR. Biotechnol. Bioeng. 2015, 112, 1810–1821. [Google Scholar] [CrossRef] [PubMed]
- Soyler, A.; Bouillaud, D.; Farjon, J.; Giraudeau, P.; Oztop, M.H. Real-time benchtop NMR spectroscopy for the online monitoring of sucrose hydrolysis. LWT Food Sci. Technol. 2020, 118, 1–7. [Google Scholar] [CrossRef]
- Anderssen, K.E.; McCarney, E.R. Online monitoring of enzymatic hydrolysis of marine by-products using benchtop nuclear magnetic resonance spectroscopy. Food Control 2020, 112, 1–10. [Google Scholar] [CrossRef]
- Bouillaud, D.; Drouin, D.; Charrier, B.; Jacquemmoz, C.; Farjon, J.; Giraudeau, P.; Goncalves, O. Using benchtop NMR spectroscopy as an online non-invasive in vivo lipid sensor for microalgae cultivated in photobioreactors. Process Biochem. 2020, 93, 63–68. [Google Scholar] [CrossRef]
- Linck, Y.G.; Killner, M.; Danieli, E.; Blümich, B. Mobile low-field 1H NMR spectroscopy desktop analysis of biodiesel production. Appl. Magn. Reson. 2013, 44, 41–53. [Google Scholar] [CrossRef]
- Killner, M.H.M.; Linck, Y.G.; Danieli, E.; Rohwedder, J.J.R.; Blumich, B. Compact NMR spectroscopy for real-time monitoring of a biodiesel production. Fuel 2015, 139, 240–247. [Google Scholar] [CrossRef] [Green Version]
- Killner, M.; Danieli, E.; Casanova, F.; Rohwedder, J.; Blümich, B. Mobile compact 1H NMR spectrometer promises fast quality control of diesel fuel. Fuel 2017, 203, 171–178. [Google Scholar] [CrossRef]
- Singh, K.; Kumar, S.P.; Blümich, B. Monitoring the mechanism and kinetics of a transesterification reaction for the biodiesel production with low field 1H NMR spectroscopy. Fuel 2019, 243, 192–201. [Google Scholar] [CrossRef]
- Gouilleux, B.; Charrier, B.; Akoka, S.; Giraudeau, P. Gradient-based solvent suppression methods on a benchtop spectrometer. Magn. Reson. Chem. 2017, 55, 91–98. [Google Scholar] [CrossRef]
- Emwas, A.H.; Roy, R.; McKay, R.T.; Tenori, L.; Saccenti, E.; Gowda, G.A.N.; Raftery, D.; Alahmari, F.; Jaremko, L.; Jaremko, M.; et al. NMR spectroscopy for metabolomics research. Metabolites 2019, 9, 123. [Google Scholar] [CrossRef] [PubMed] [Green Version]
- Wishart, D.S. NMR metabolomics: A look ahead. J. Magn. Reson. 2019, 306, 155–161. [Google Scholar] [CrossRef]
- Holmes, E.; Wilson, I.D.; Nicholson, J.K. Metabolic phenotyping in health and disease. Cell 2008, 134, 714–717. [Google Scholar] [CrossRef] [PubMed] [Green Version]
- Beckonert, O.; Keun, H.C.; Ebbels, T.M.; Bundy, J.; Holmes, E.; Lindon, J.C.; Nicholson, J.K. Metabolic profiling, metabolomic and metabonomic procedures for NMR spectroscopy of urine, plasma, serum and tissue extracts. Nat. Protoc. 2007, 2, 2692–2703. [Google Scholar] [CrossRef]
- Emwas, A.-H.; Luchinat, C.; Turano, P.; Tenori, L.; Roy, R.; Salek, R.M.; Ryan, D.; Merzaban, J.S.; Kaddurah-Daouk, R.; Zeri, A.C. Standardizing the experimental conditions for using urine in NMR-based metabolomic studies with a particular focus on diagnostic studies: A review. Metabolomics 2015, 11, 872–894. [Google Scholar] [CrossRef] [PubMed] [Green Version]
- Percival, B.C.; Grootveld, M.; Gibson, M.; Osman, Y.; Molinari, M.; Jafari, F.; Sahota, T.; Martin, M.; Casanova, F.; Mather, M.L. Low-field, benchtop NMR spectroscopy as a potential tool for point-of-care diagnostics of metabolic conditions: Validation, protocols and computational models. High-Throughput 2019, 8, 2. [Google Scholar] [CrossRef] [PubMed] [Green Version]
- Leenders, J.; Grootveld, M.; Percival, B.; Gibson, M.; Casanova, F.; Wilson, P.B. Benchtop low-frequency 60 MHz NMR analysis of urine: A comparative metabolomics investigation. Metabolites 2020, 10, 155. [Google Scholar] [CrossRef] [Green Version]
- Edgar, M.; Percival, B.C.; Gibson, M.; Jafari, F.; Grootveld, M. Low-field benchtop NMR spectroscopy as a potential non-stationary tool for point-of-care urinary metabolite tracking in diabetic conditions. Diabetes Res. Clin. Pract. 2021, 171, 1–5. [Google Scholar] [CrossRef] [PubMed]
- Stolz, M.; Schlawne, C.; Hoffmann, J.; Hartmann, V.; Marini, I.; Fritsche, A.; Peter, A.; Bakchoul, T.; Schick, F. Feasibility of precise and reliable glucose quantification in human whole blood samples by 1 tesla benchtop NMR. NMR Biomed. 2020, 33, 1–11. [Google Scholar] [CrossRef]
- Gouilleux, B.; Farjon, J.; Giraudeau, P. Gradient-based pulse sequences for benchtop NMR spectroscopy. J. Magn. Reson. 2020, 319, 1–12. [Google Scholar] [CrossRef] [PubMed]
- Castaing-Cordier, T.; Bouillaud, D.; Bowyer, P.; Goncalves, O.; Giraudeau, P.; Farjon, J. Highly Resolved pure-shift spectra on a compact NMR spectrometer. ChemPhysChem 2019, 20, 736–744. [Google Scholar] [CrossRef]
- Febrian, R.; Ona, W.J.; Araneda, J.F.; Riegel, S.D.; Bracher, P.J. Benchtop NMR spectroscopy of prebiotically-relevant peptide reactions enabled by salt-induced chemical shift dispersion. ACS Earth Space Chem. 2020, 4, 499–505. [Google Scholar] [CrossRef]
- Chae, H.; Min, S.; Jeong, H.J.; Namgoong, S.K.; Oh, S.; Kim, K.; Jeong, K. Organic reaction monitoring of a glycine derivative using signal amplification by reversible exchange-hyperpolarized benchtop nuclear magnetic resonance spectroscopy. Anal. Chem. 2020, 92, 10902–10907. [Google Scholar] [CrossRef] [PubMed]
- Richardson, P.M.; Parrott, A.J.; Semenova, O.; Nordon, A.; Duckett, S.B.; Halse, M.E. SABRE hyperpolarization enables high-sensitivity 1H and 13C benchtop NMR spectroscopy. Analyst 2018, 143, 3442–3450. [Google Scholar] [CrossRef] [Green Version]
- Robinson, A.D.; Richardson, P.M.; Halse, M.E. Hyperpolarised 1H–13C benchtop NMR spectroscopy. Appl. Sci. 2019, 9, 173. [Google Scholar] [CrossRef] [Green Version]
- Semenova, O.; Richardson, P.M.; Parrott, A.J.; Nordon, A.; Halse, M.E.; Duckett, S.B. Reaction monitoring using SABRE-Hyperpolarized Benchtop (1 T) NMR spectroscopy. Anal. Chem. 2019, 91, 6695–6701. [Google Scholar] [CrossRef] [Green Version]
- Tennant, T.; Hulme, M.C.; Robertson, T.B.R.; Sutcliffe, O.B.; Mewis, R.E. Benchtop NMR analysis of piperazine-based drugs hyperpolarised by SABRE. Magn. Reson. Chem. 2020, 58, 1151–1159. [Google Scholar] [CrossRef]
- Gouilleux, B.; Charrier, B.; Akoka, S.; Felpin, F.X.; Rodriguez-Zubiri, M.; Giraudeau, P. Ultrafast 2D NMR on a benchtop spectrometer: Applications and perspectives. Trac-Trend Anal. Chem. 2016, 83, 65–75. [Google Scholar] [CrossRef]
- Singh, K.; Blumich, B. Desktop NMR for structure elucidation and identification of strychnine adulteration. Analyst 2017, 142, 1459–1470. [Google Scholar] [CrossRef]
- Gouilleux, B.; Marchand, J.; Charrier, B.; Remaud, G.S.; Giraudeau, P. High-throughput authentication of edible oils with benchtop Ultrafast 2D NMR. Food Chem. 2018, 244, 153–158. [Google Scholar] [CrossRef] [PubMed]
- Gouilleux, B.; Charrier, B.; Danieli, E.; Dumez, J.N.; Akoka, S.; Felpin, F.X.; Rodriguez-Zubiri, M.; Giraudeau, P. Real-time reaction monitoring by ultrafast 2D NMR on a benchtop spectrometer. Analyst 2015, 140, 7854–7858. [Google Scholar] [CrossRef]
- Friebel, A.; von Harbou, E.; Münnemann, K.; Hasse, H. Reaction monitoring by benchtop NMR spectroscopy using a novel stationary flow reactor setup. Ind. Eng. Chem. Res. 2019, 58, 18125–18133. [Google Scholar] [CrossRef]
- Weidener, D.; Singh, K.; Blumich, B. Synthesis of alpha-fluoro-alpha, beta-unsaturated esters monitored by 1D and 2D benchtop NMR spectroscopy. Magn. Reson. Chem. 2019, 57, 852–860. [Google Scholar] [CrossRef]
- Rehm, T.H.; Hofmann, C.; Reinhard, D.; Kost, H.J.; Lob, P.; Besold, M.; Welzel, K.; Barten, J.; Didenko, A.; Sevenard, D.V.; et al. Continuous-flow synthesis of fluorine-containing fine chemicals with integrated benchtop NMR analysis. React. Chem. Eng. 2017, 2, 315–323. [Google Scholar] [CrossRef]
- Heerah, K.; Waclawek, S.; Konzuk, J.; Longstaffe, J.G. Benchtop 19F NMR spectroscopy as a practical tool for testing of remedial technologies for the degradation of perfluorooctanoic acid, a persistent organic pollutant. Magn. Reson. Chem. 2020, 58, 1160–1167. [Google Scholar] [CrossRef] [PubMed]
- Sakla, R.; Jose, D.A. New fluorinated manganese carbonyl complexes for light controlled carbon monoxide (CO) release and the use of benchtop 19F-NMR spectroscopy. Inorg. Chim. Acta 2021, 516, 1–8. [Google Scholar] [CrossRef]
- Gouilleux, B.; Christensen, N.V.; Malmos, K.G.; Vosegaard, T. Analytical evaluation of low-field 31P NMR spectroscopy for lipid analysis. Anal. Chem. 2019, 91, 3035–3042. [Google Scholar] [CrossRef] [Green Version]
- Araneda, J.F.; Hui, P.; Leskowitz, G.M.; Riegel, S.D.; Mercado, R.; Green, C. Lithium-7 qNMR as a method to quantify lithium content in brines using benchtop NMR. Analyst 2021, 146, 882–888. [Google Scholar] [CrossRef]
- Chighine, K.; Léonce, E.; Boutin, C.; Desvaux, H.; Berthault, P. 129 Xe Ultrafast Z-spectroscopy enables micromolar detection of biosensors on a 1T benchtop spectrometer. Magn. Reson. Discuss. 2021, 1–21. [Google Scholar] [CrossRef]
- Bernard, G.M.; Michaelis, V.K. Lead-207 NMR spectroscopy at 1.4 T: Application of benchtop instrumentation to a challenging I = ½ nucleus. Magn. Reson. Chem. 2020, 58, 1203–1212. [Google Scholar] [CrossRef] [PubMed]
Figure 1.
1H nuclear magnetic resonance (NMR) spectra of authentic perilla oil acquired on a 43 MHz benchtop NMR spectrometer and a 600 MHz high-resolution NMR spectrometer. Adapted with permission from [15], J-STAGE, 2018.
Figure 1.
1H nuclear magnetic resonance (NMR) spectra of authentic perilla oil acquired on a 43 MHz benchtop NMR spectrometer and a 600 MHz high-resolution NMR spectrometer. Adapted with permission from [15], J-STAGE, 2018.

Figure 2.
Application of qNMR (60 MHz 1H NMR) spectroscopy to the quantitation of ∆9-tetrahydrocannabinol (THC) and cannabidiol (CBD) in cannabis concentrates. 1,4-Dinitrobenzene was used as an internal calibrant. The residual solvent (CDCl3) peak is indicated by an asterisk. Adapted with permission from [39], Royal Society of Chemistry, 2020.
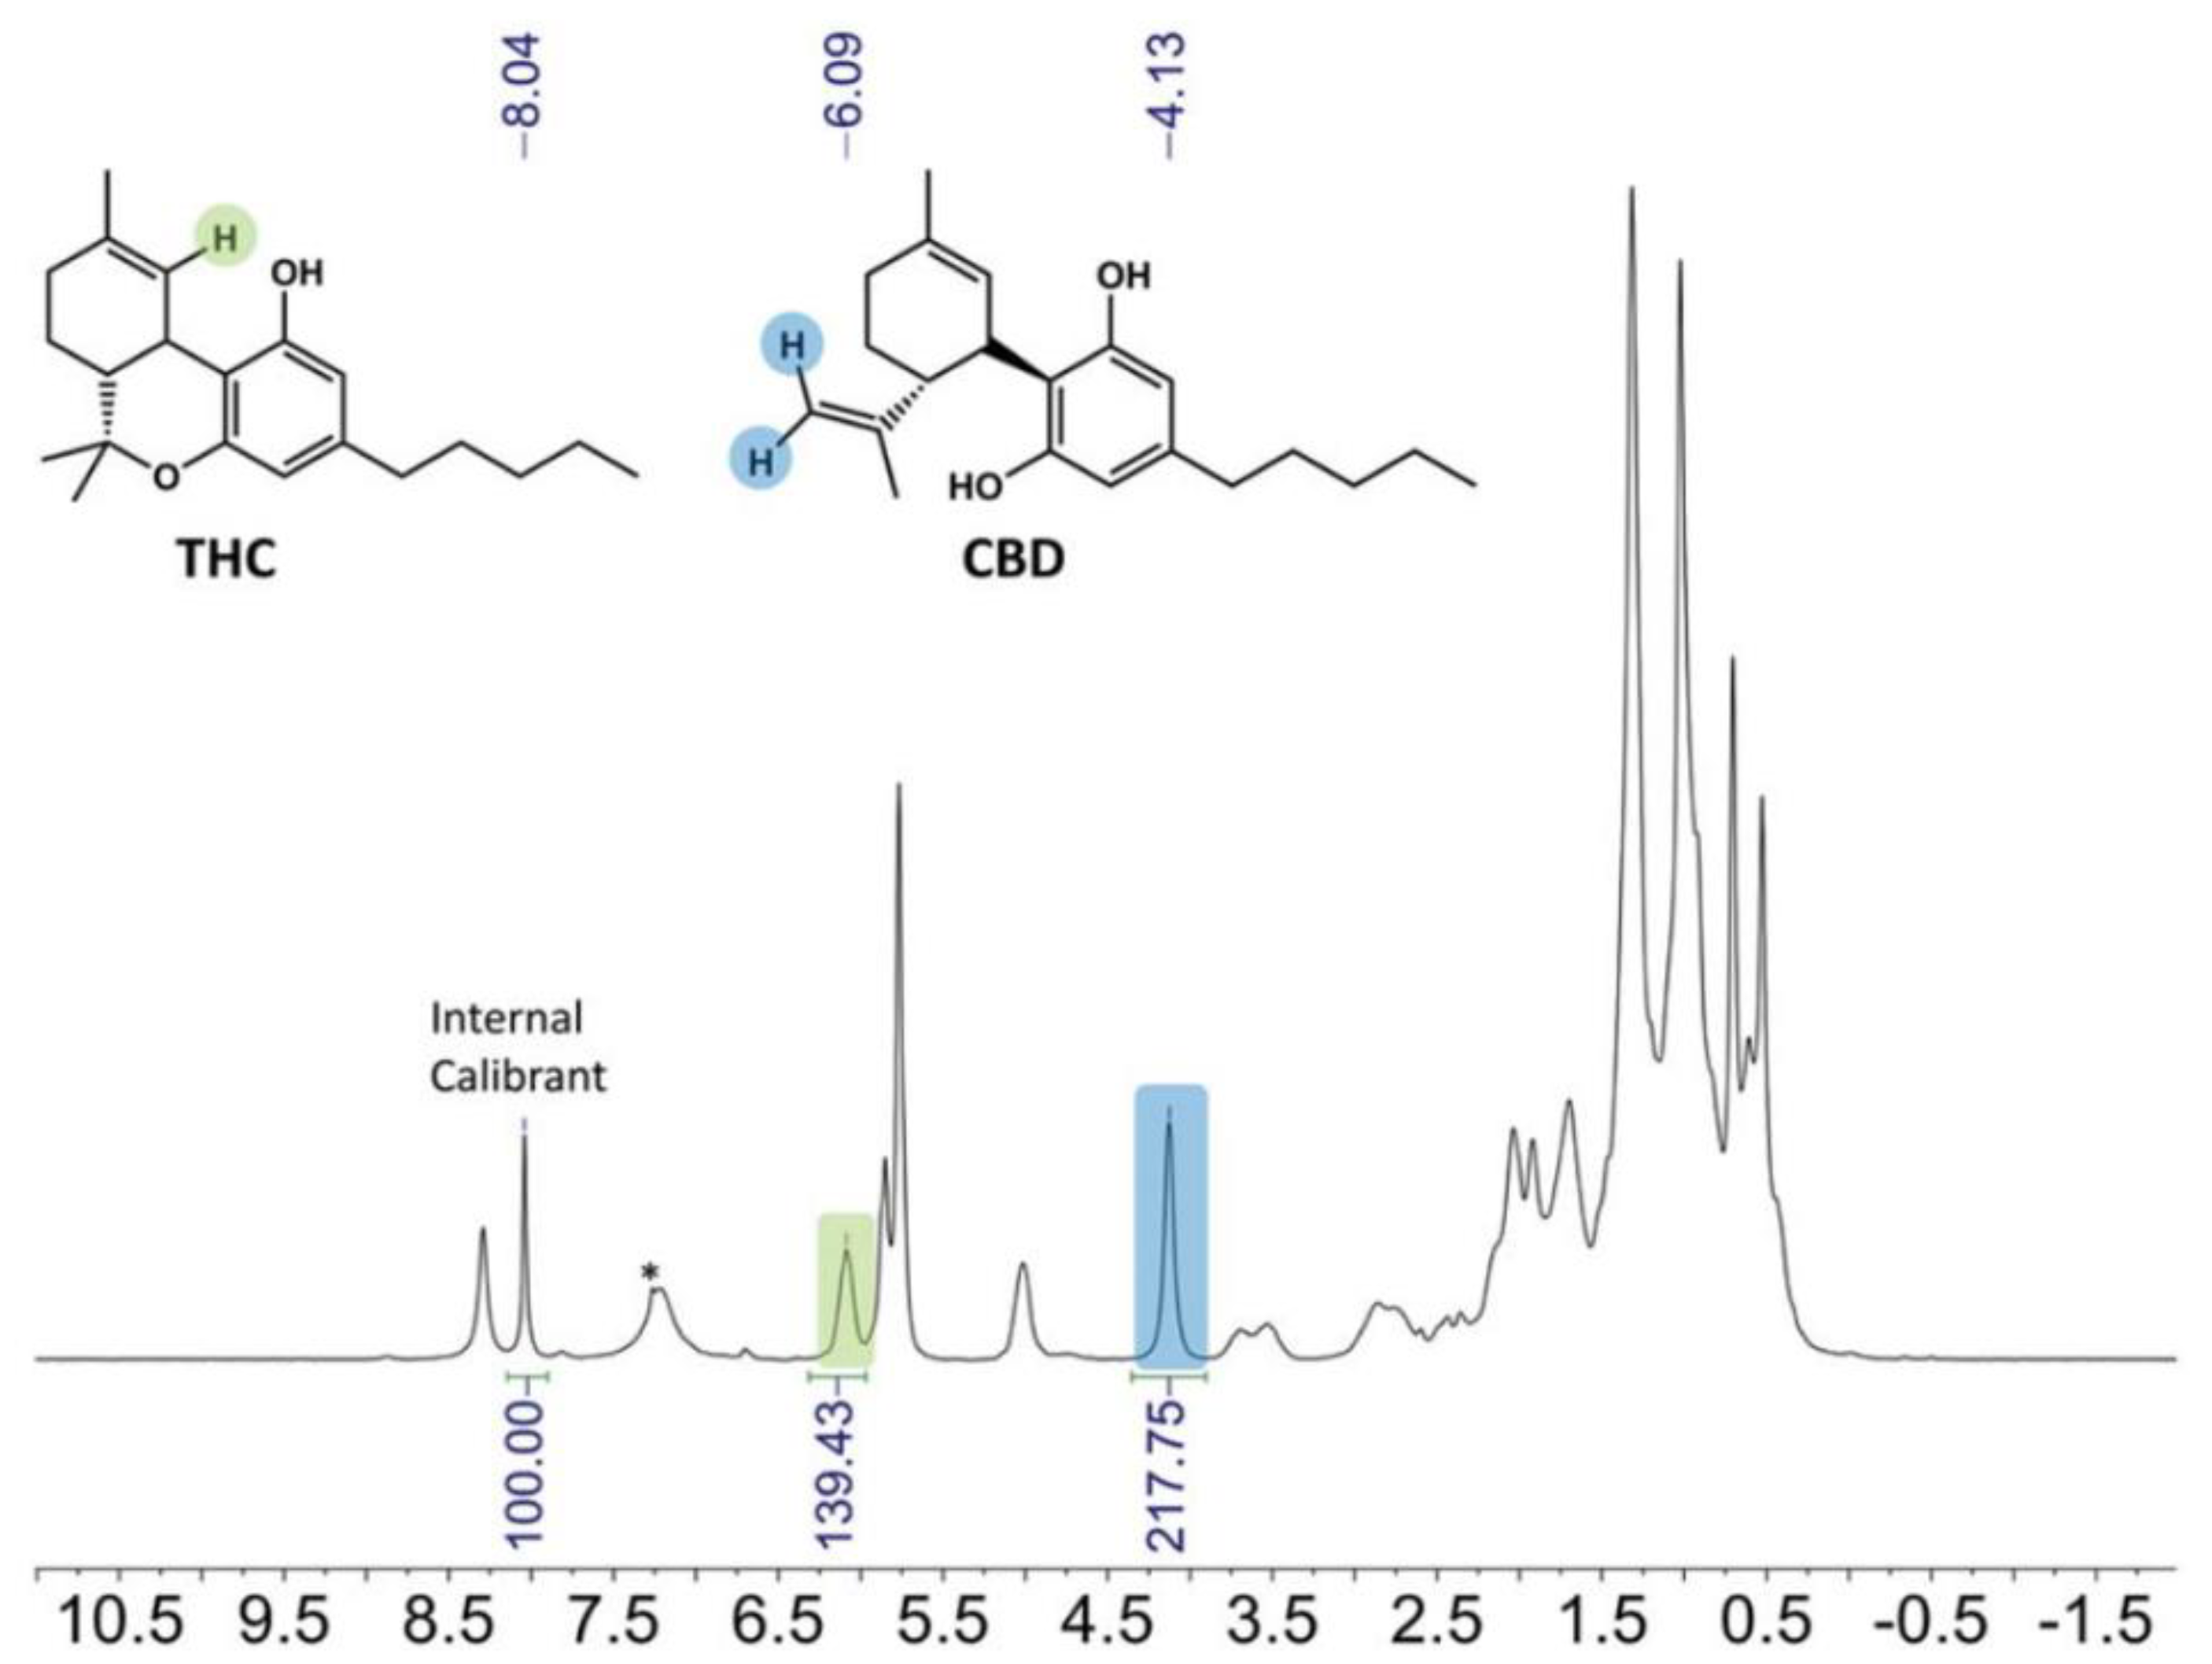
Figure 3.
1H and 13C NMR spectra of solution polymerization- and emulsion polymerization-prepared SBR recorded on a 1 T (43 MHz) benchtop NMR spectrometer. A 50 mg sample of each polymer was dissolved in 0.5 mL CDCl3. The polymerization process had an effect on both 1H and 13C spectra. Adapted with permission from [51], Wiley, 2016.
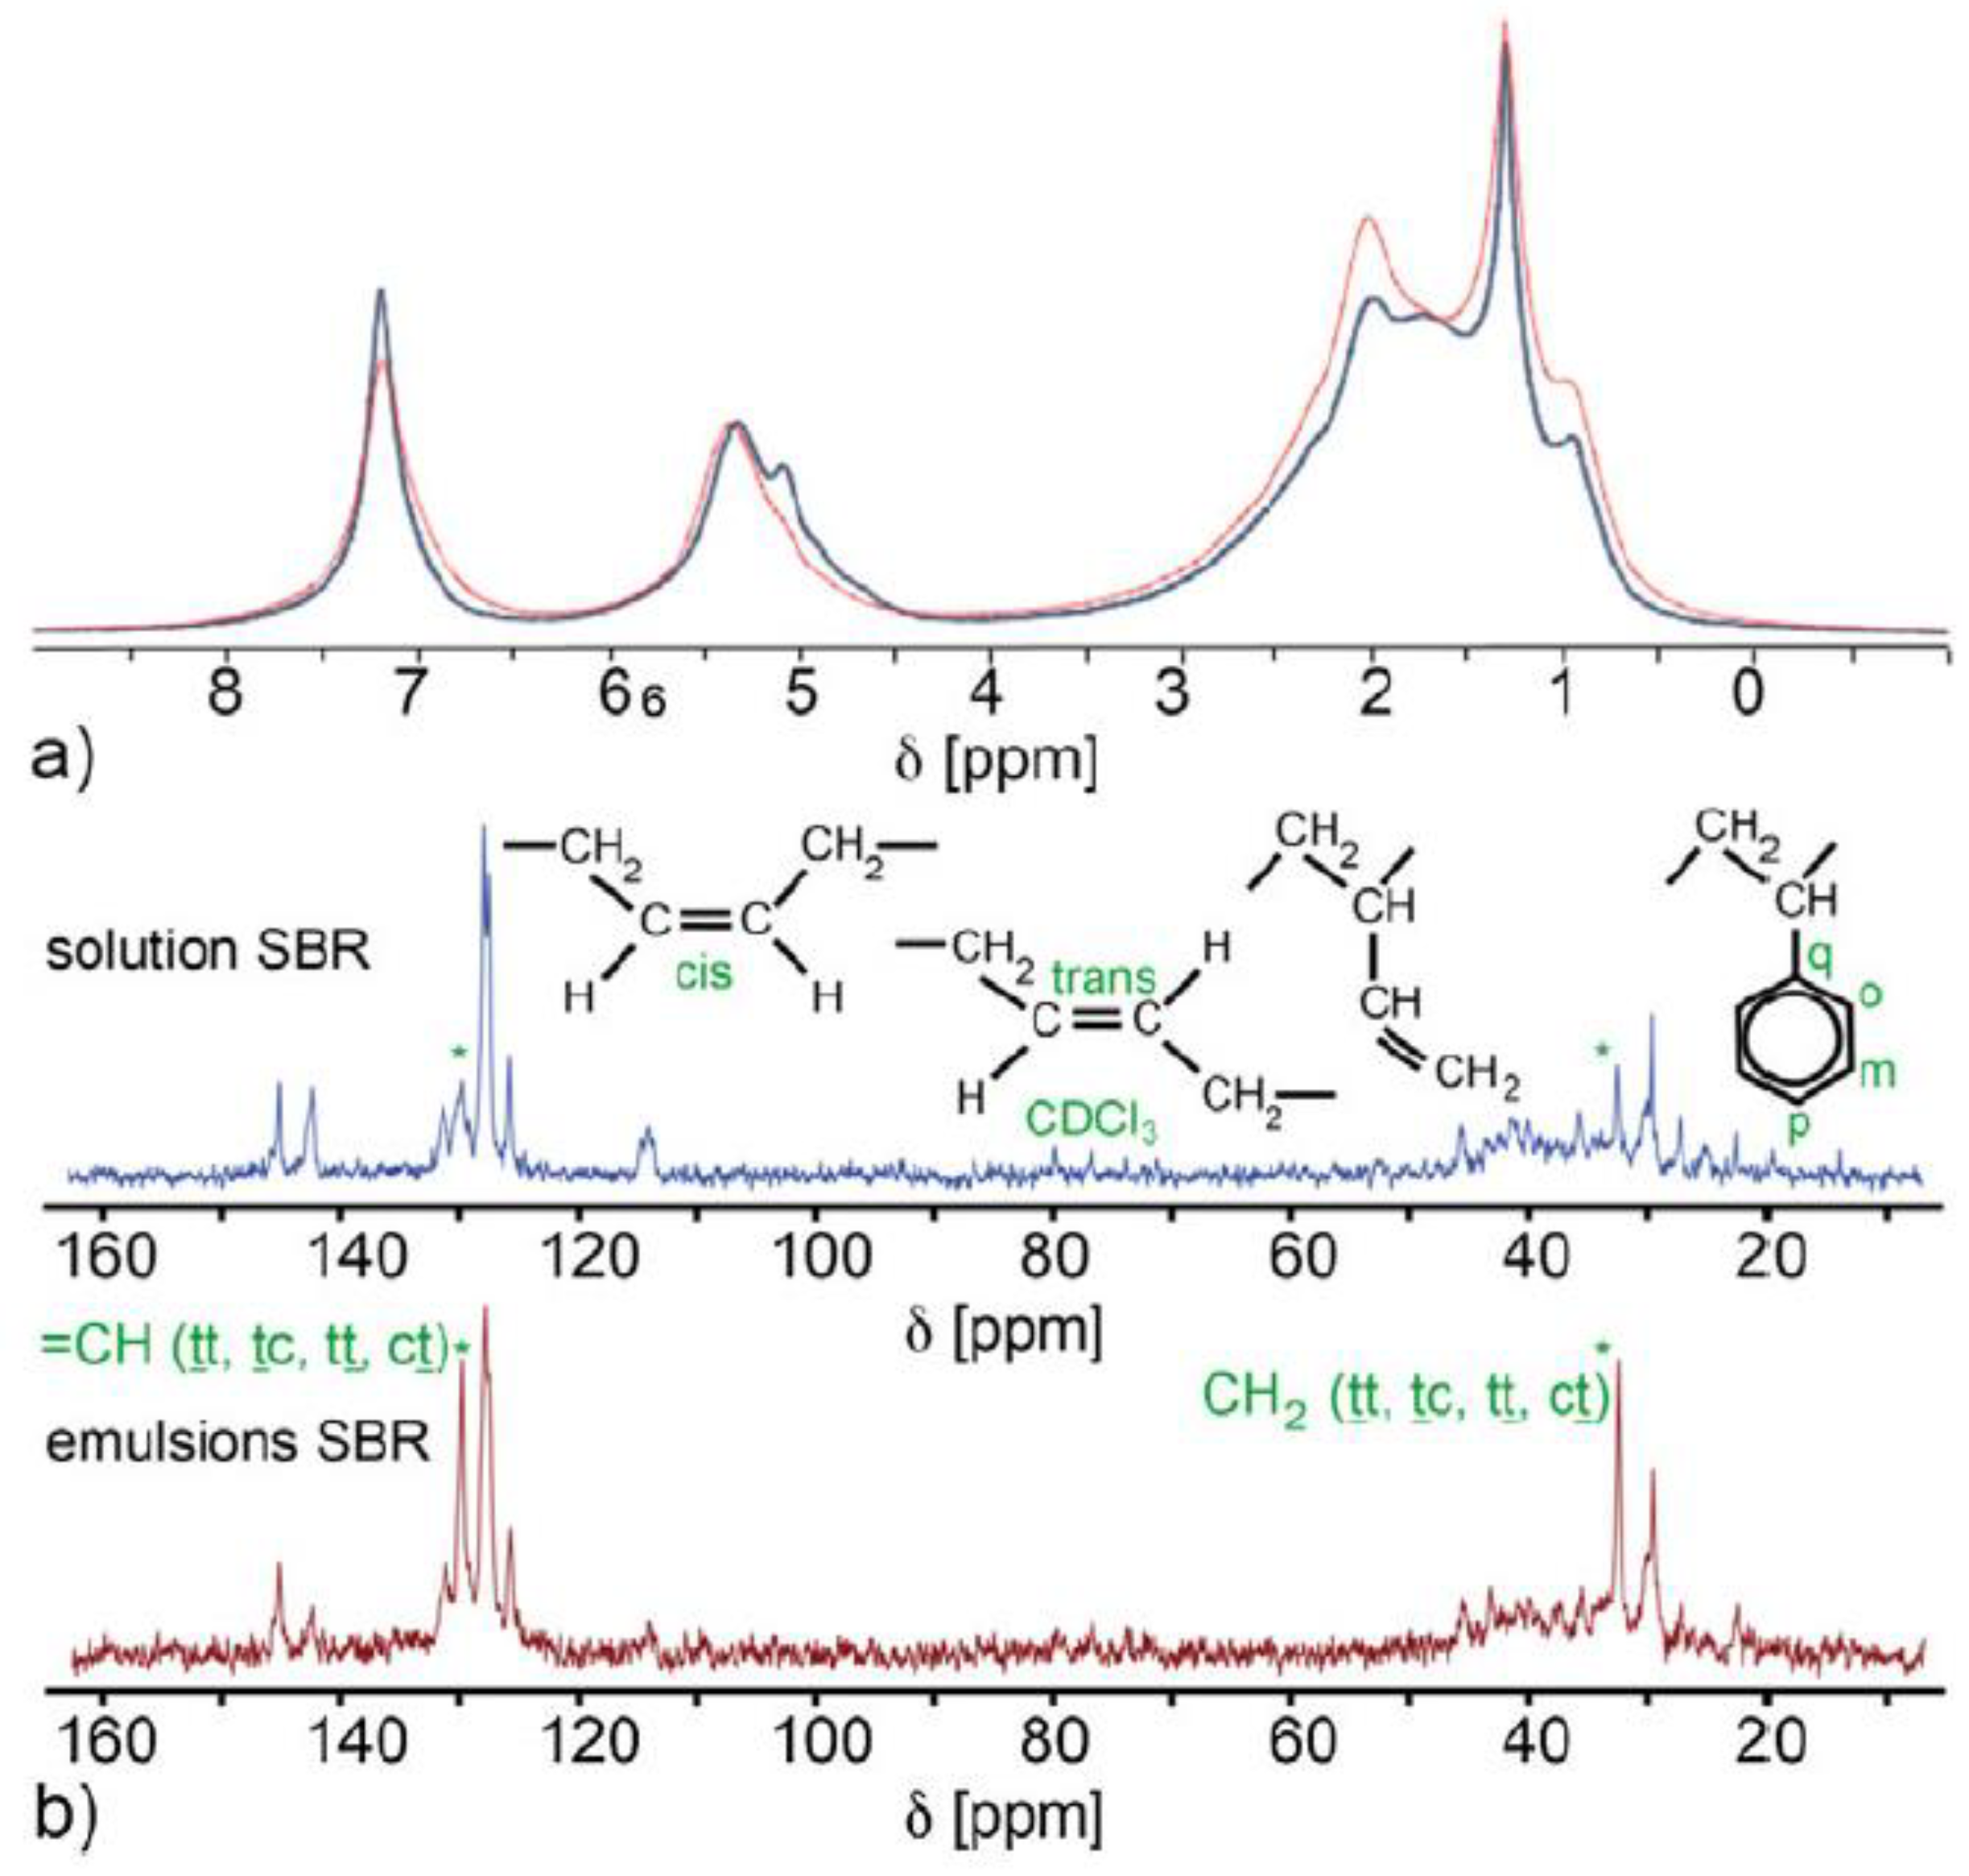
Figure 4.
Schematic illustration of the SEC-MR-NMR setup (left) and SEC-NMR result obtained for a 1:1 wt% polystyrene (PS)/poly(methyl methacrylate) (PMMA) blend (54,000/23,000 g mol−1) (right). Although incomplete SEC baseline separation between PS and PMMA was observed ((C) DRI trace), these polymers featured distinct signals in 1H NMR spectra (A) that was extracted from the 2D data at the peak maxima for each component (B). Adapted with permission from [59], Royal Society of Chemistry, 2019.
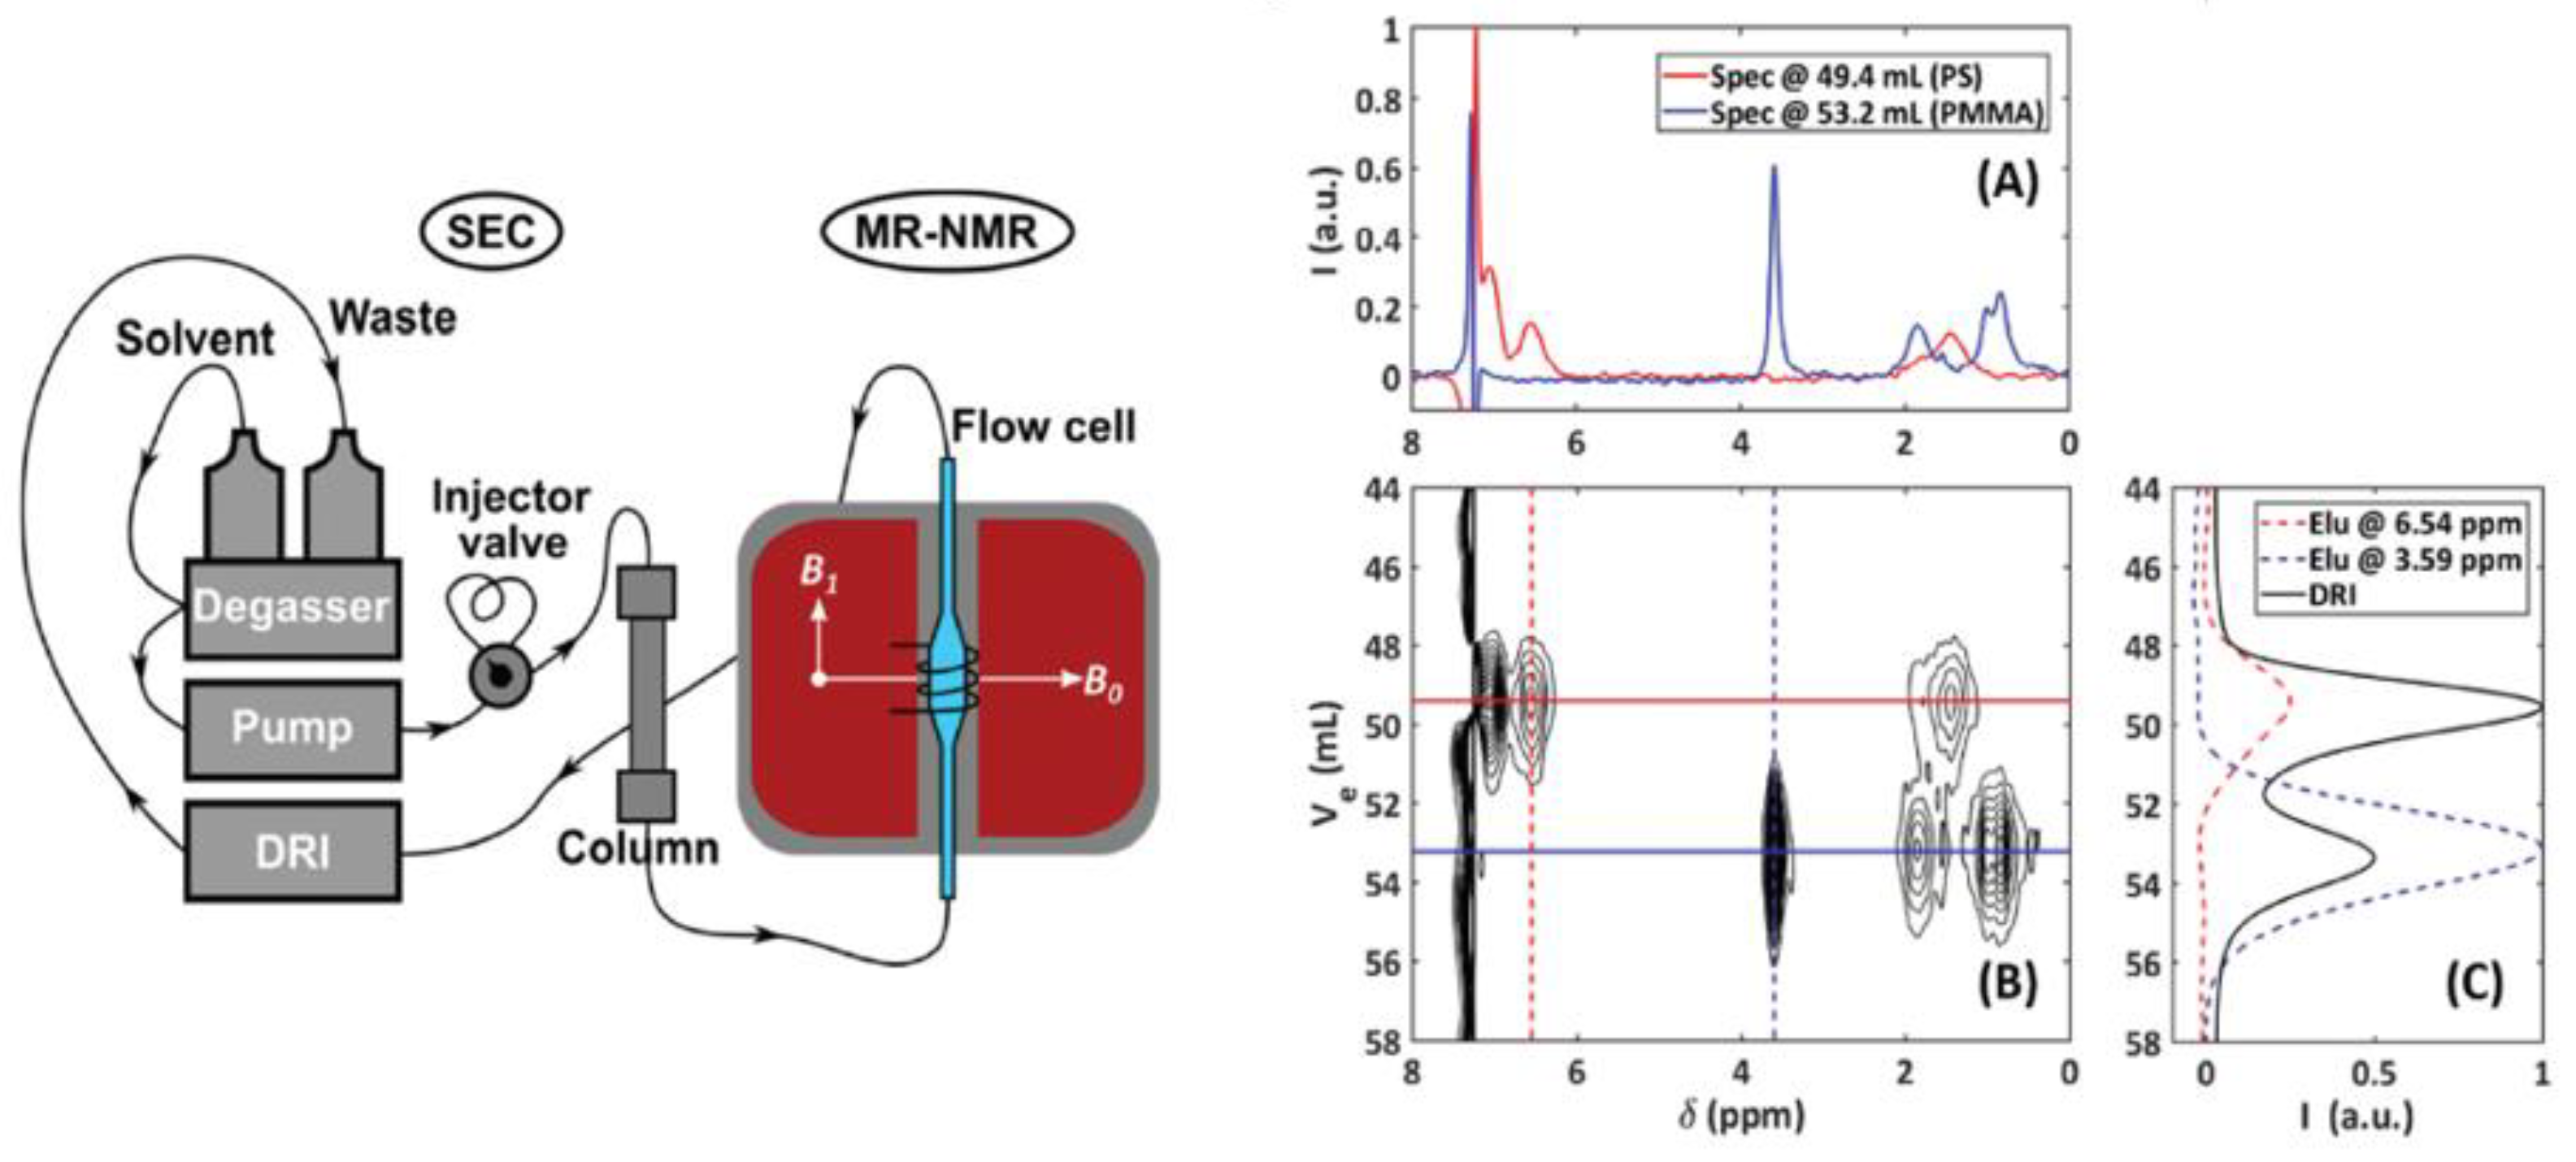
Figure 5.
Experimental setup used for process and reaction monitoring and showing a Spinsolve benchtop NMR spectrometer installed for reaction monitoring in a flow system. The middle image shows the glass NMR flow cell, while the right image presents an inline reaction monitoring configuration under continuous flow conditions. Adapted with permission from [66], ACS, 2016.

Figure 6.
(a) 1H NMR (60 MHz) spectra reflecting the progress of 1-octanol chlorination to afford 1-chlorooctane and (b) the related quantitative data. Adapted with permission from [73], Wiley, 2020.
Figure 6.
(a) 1H NMR (60 MHz) spectra reflecting the progress of 1-octanol chlorination to afford 1-chlorooctane and (b) the related quantitative data. Adapted with permission from [73], Wiley, 2020.


Figure 7.
Indirect hard modeling workflow. Measured NMR spectra (d) are fitted by building a mixture model (c). The relevant pure component models (b) for each process can be selected from a pure component model database (a). Adapted with permission from [76], Springer, 2019.
Figure 7.
Indirect hard modeling workflow. Measured NMR spectra (d) are fitted by building a mixture model (c). The relevant pure component models (b) for each process can be selected from a pure component model database (a). Adapted with permission from [76], Springer, 2019.

Figure 8.
(a) Comparison of high-field NMR (A,B) and low-field NMR (C,D) spectra used to monitor yeast-induced fermentation. The former spectra were obtained offline at 400 MHz, while the latter were obtained online at 43 MHz. (b) Online monitoring of glycerol consumption using benchtop NMR spectroscopy and comparison of the results with those obtained using high-performance liquid chromatography. Adapted with permission from [89], Wiley, 2015.
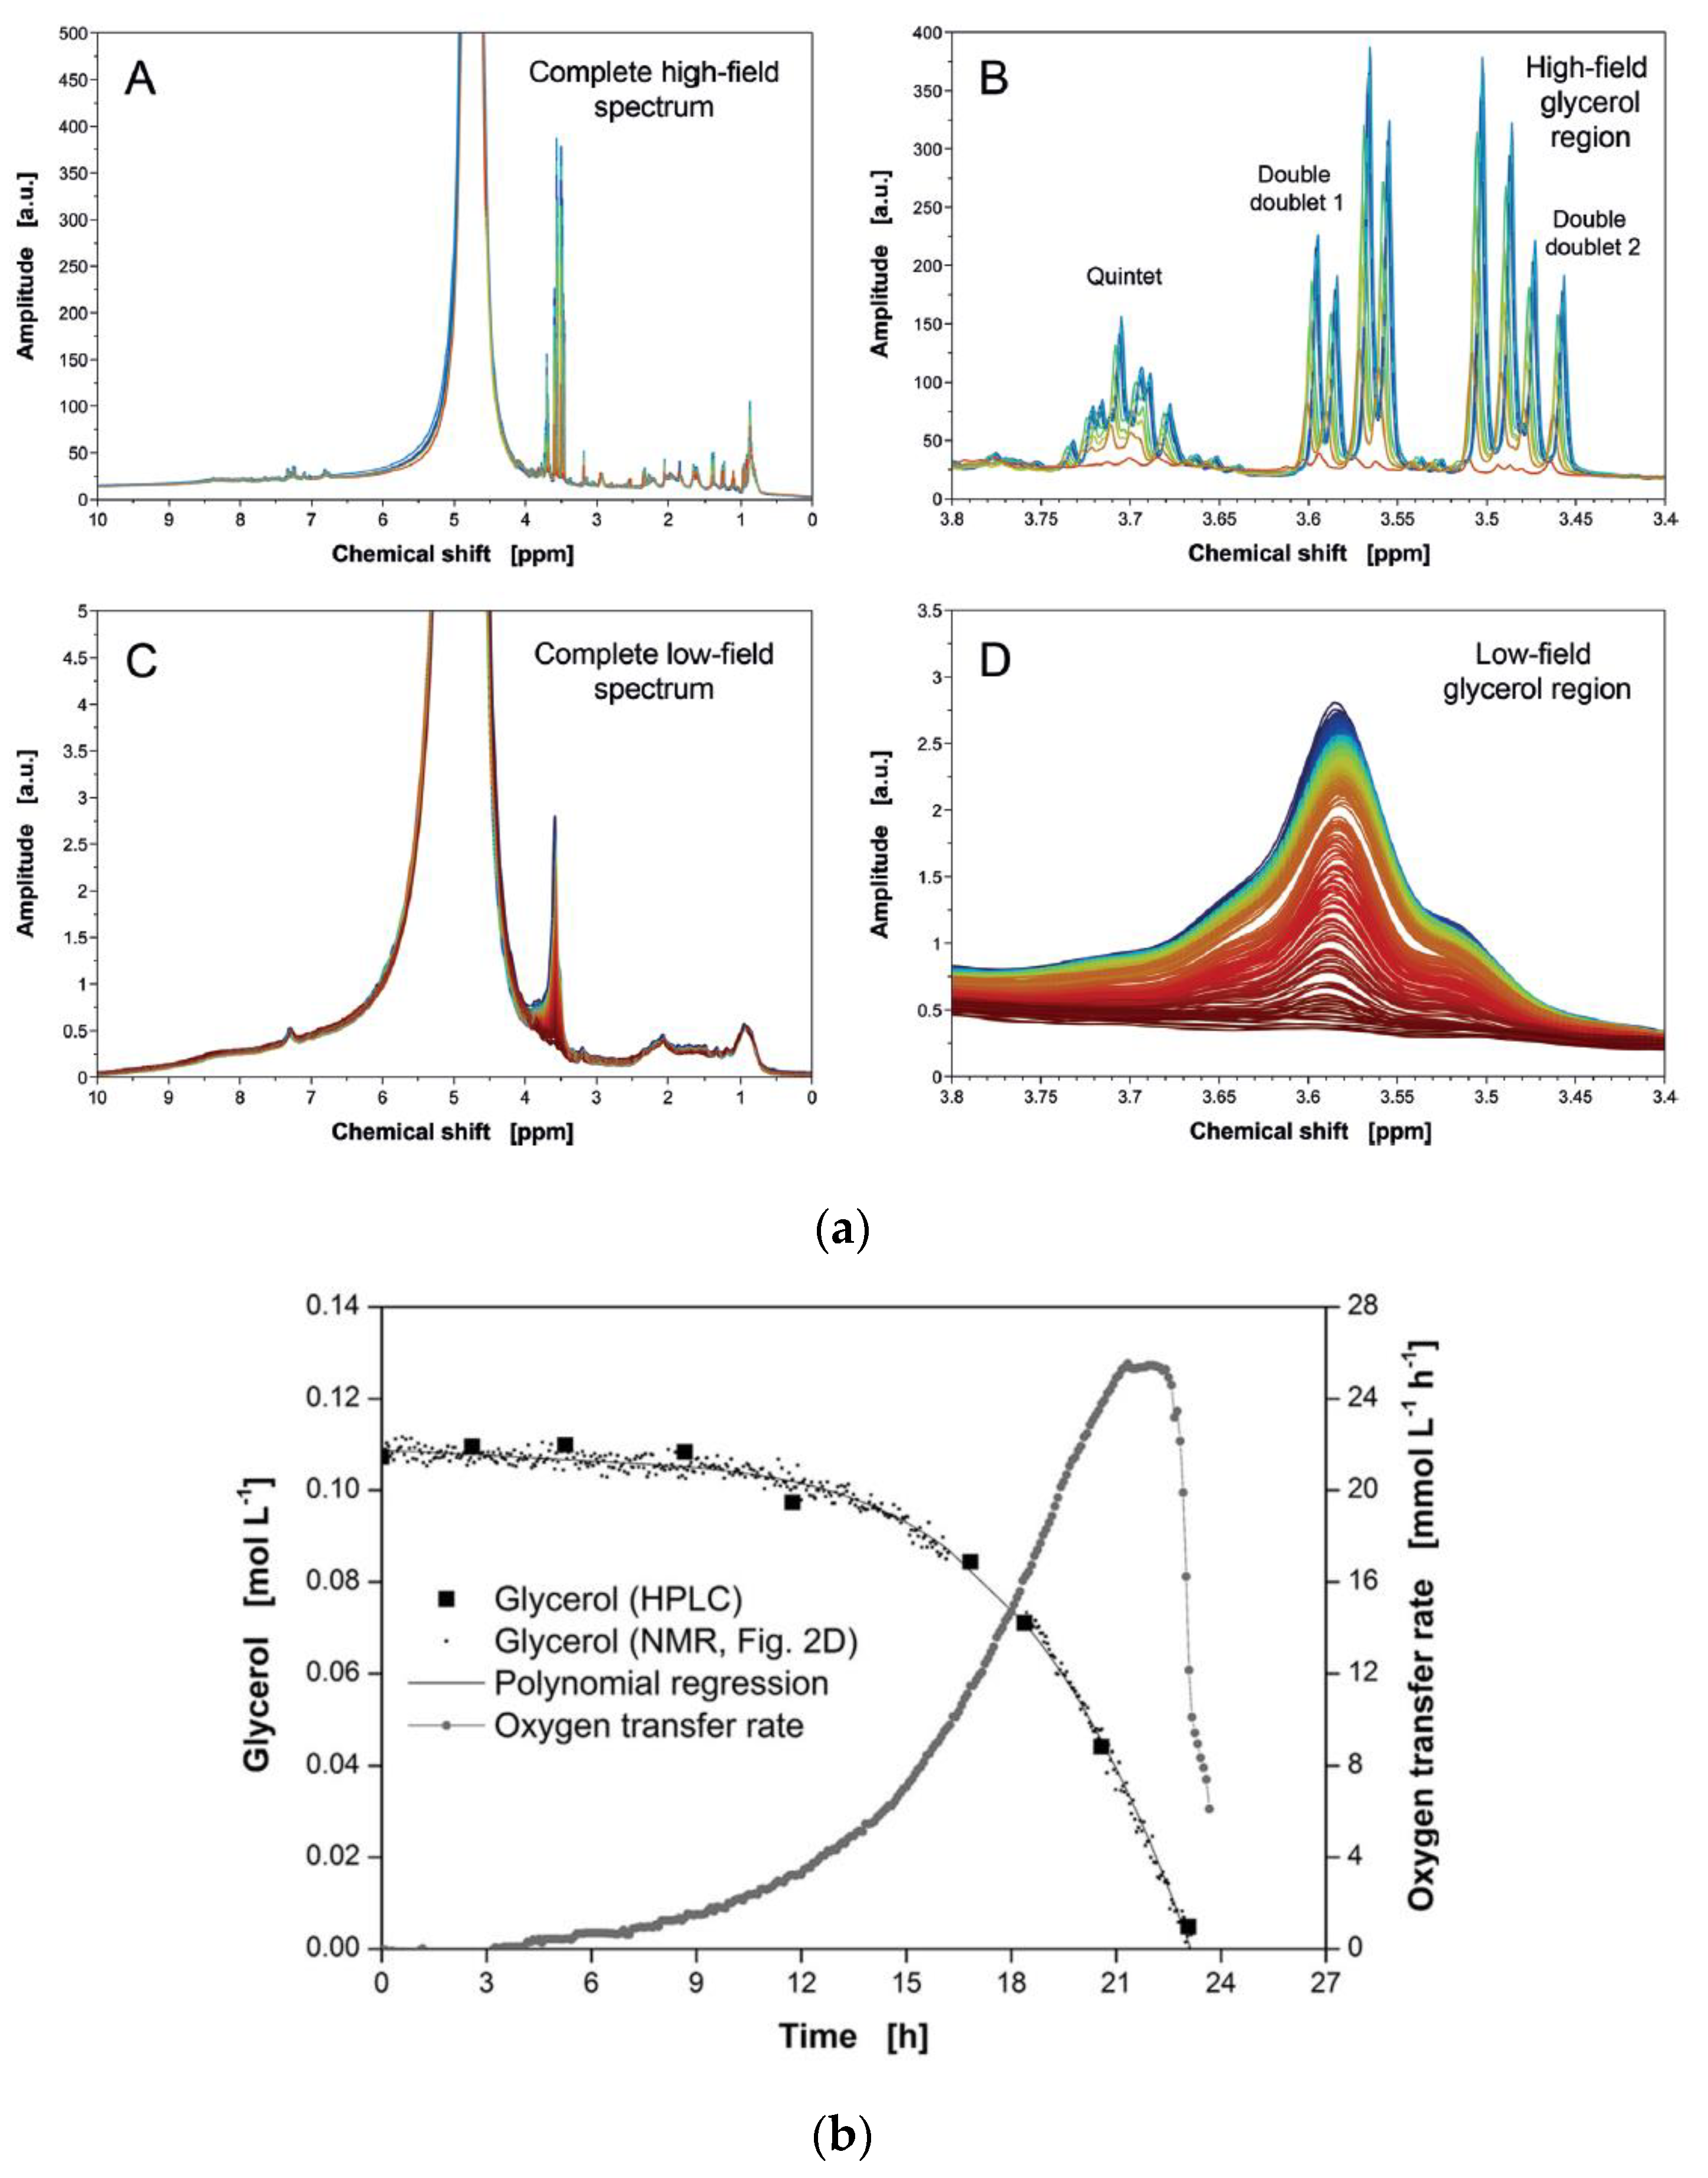
Figure 9.
Application of several pulse sequences for water signal suppression in 0.2 M aqueous lactate. The same receiver gain and vertical scale were used in all cases. Abbreviated pulse sequences: Sat (Saturation), CP (Cross-polarization), NOESY (Nuclear Overhauser Enhancement Spectroscopy), WET (Water suppression Enhanced through T1 effects), ES (Echo subtraction), Sel (Selective pulses), and PE (Phase encoding). Adapted with permission from [97], Wiley, 2017.
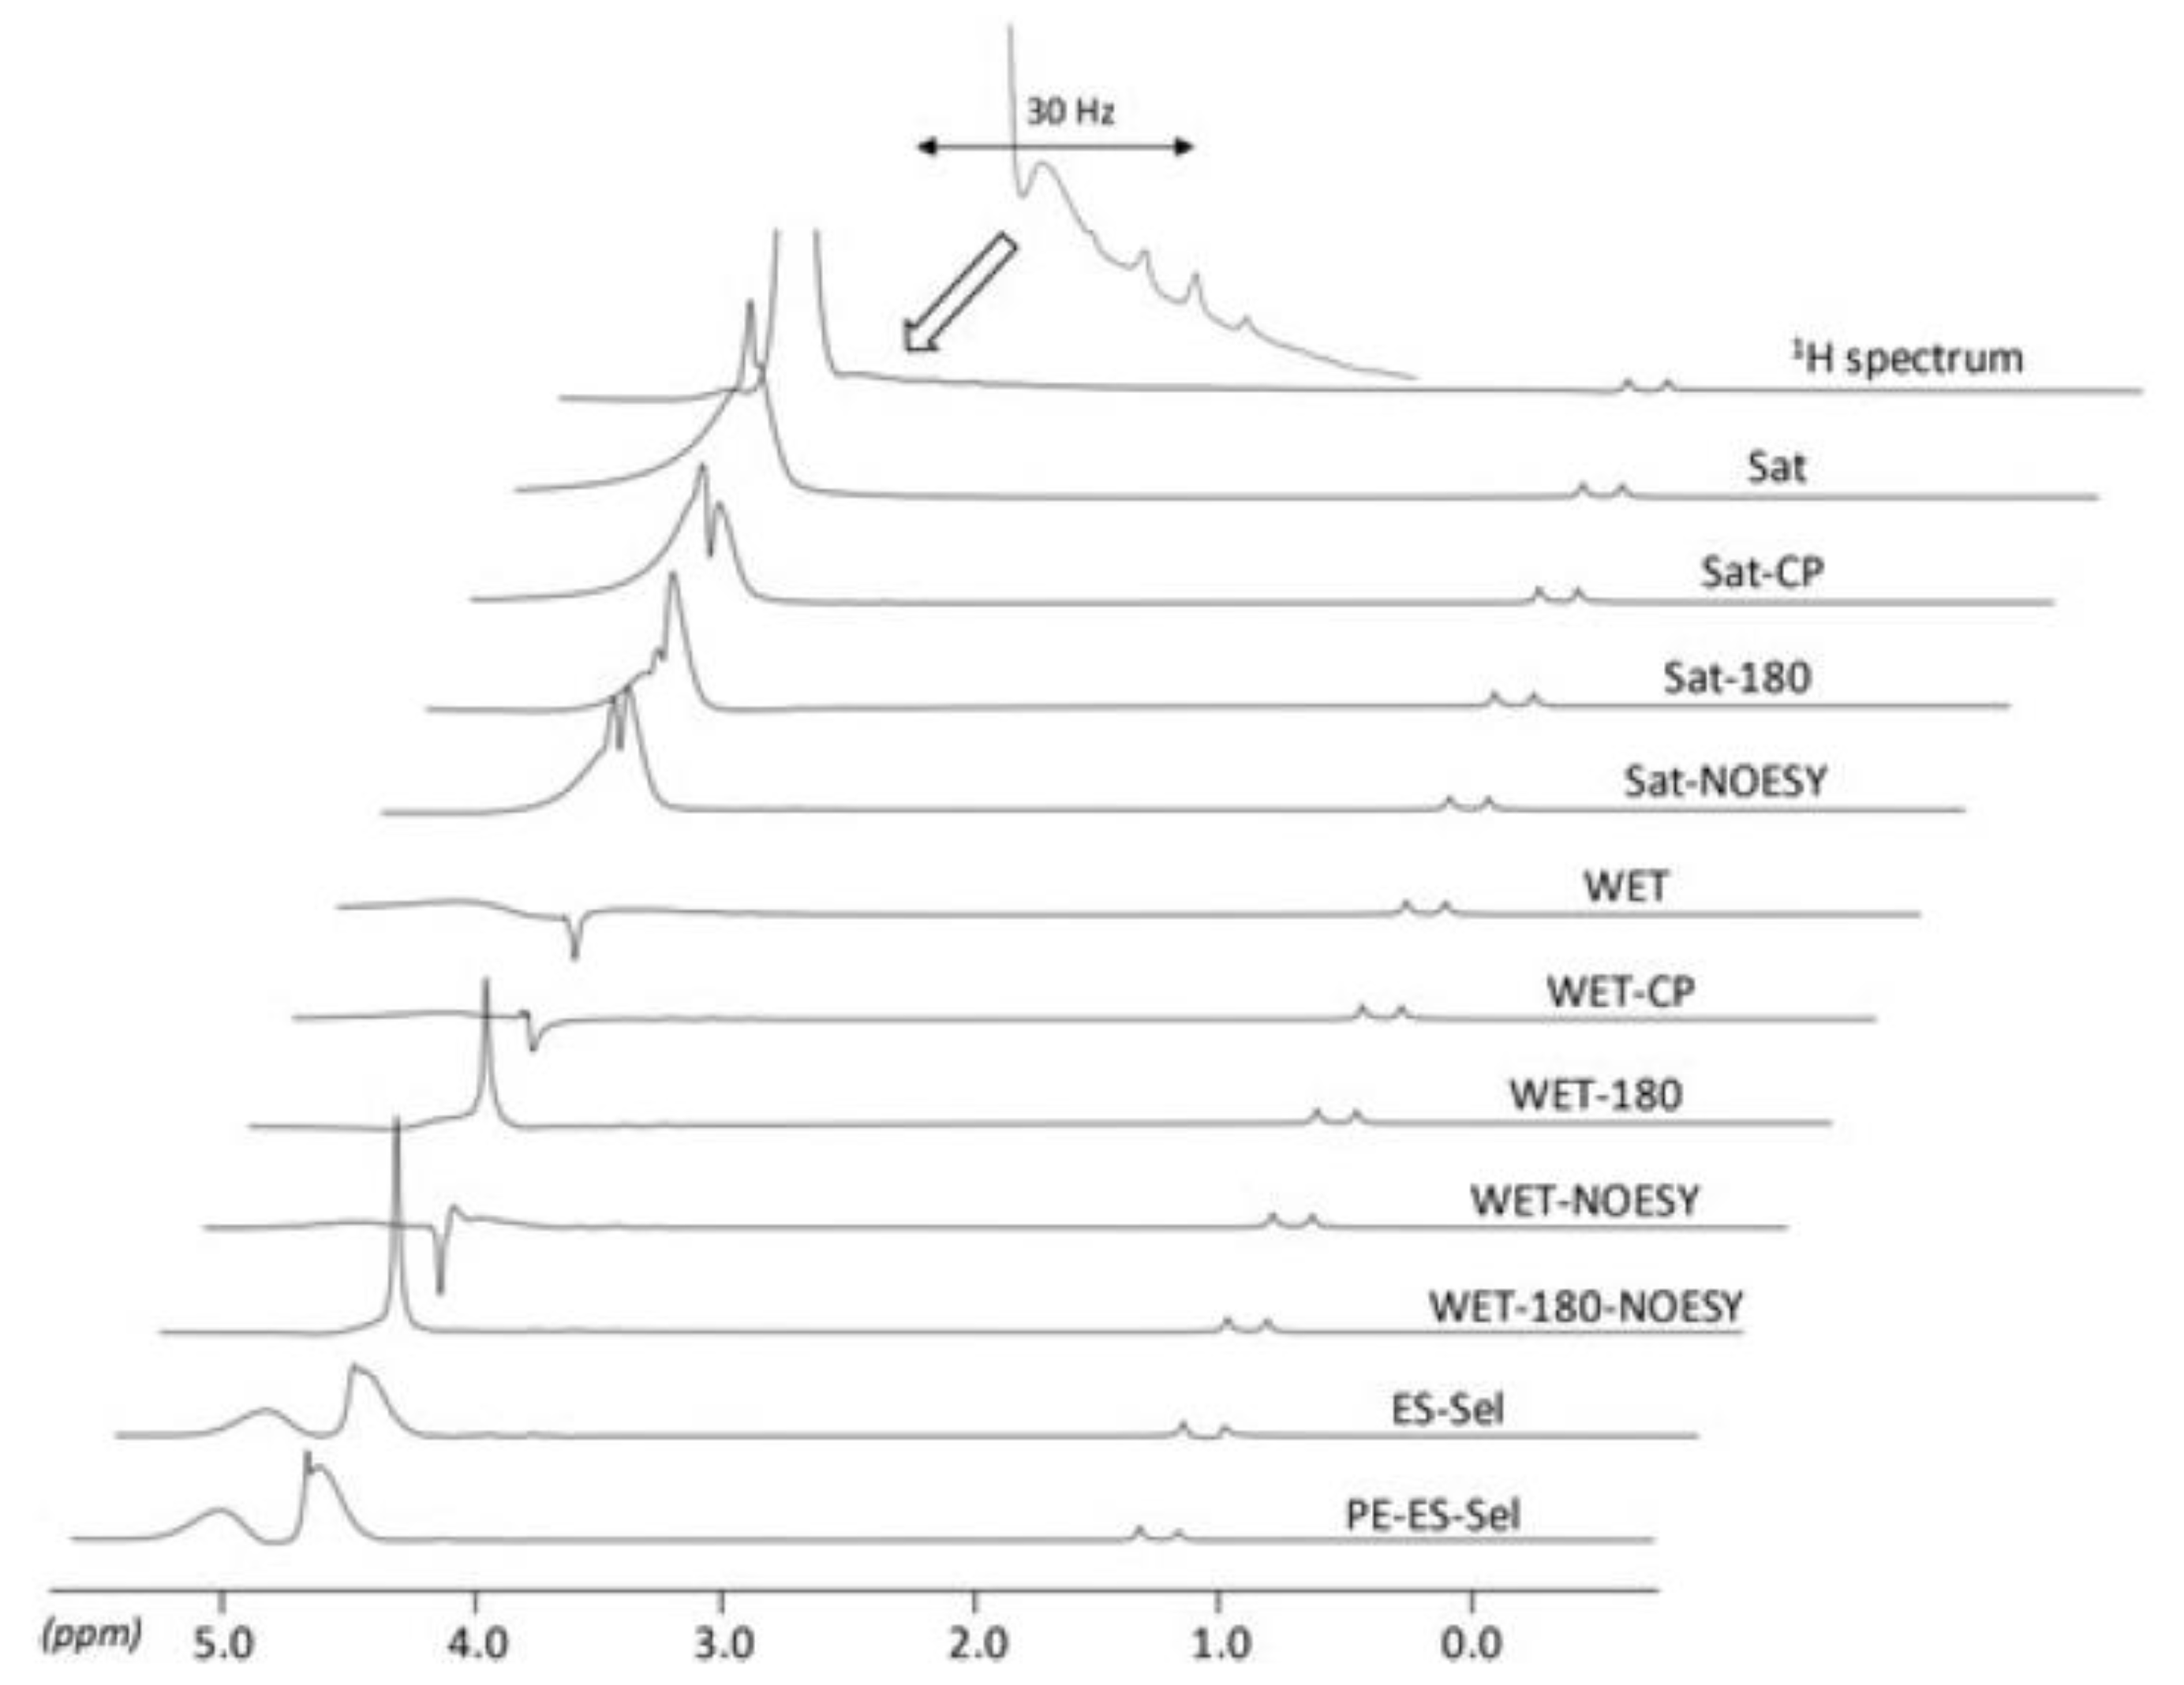
Figure 10.
The 2D COSY NMR spectrum of urine from a patient with type 2 diabetes obtained using a 60 MHz benchtop NMR spectrometer. In the 1D spectrum, the glucose signal was hard to confirm because of its overlap with the water signal, whereas a cross-peak related to glucose was clearly observed in the 2D spectrum. Adapted with permission from [104], MDPI, 2019.

Figure 11.
1H NMR spectra (43 MHz) of ibuprofen recorded using several pulse sequences for spectral resolution and sensitivity enhancement. The asterisk (*) denotes decoupling artifacts due to partially collapsed strong couplings. Adapted with permission from [108], Wiley, 2019.
Figure 11.
1H NMR spectra (43 MHz) of ibuprofen recorded using several pulse sequences for spectral resolution and sensitivity enhancement. The asterisk (*) denotes decoupling artifacts due to partially collapsed strong couplings. Adapted with permission from [108], Wiley, 2019.
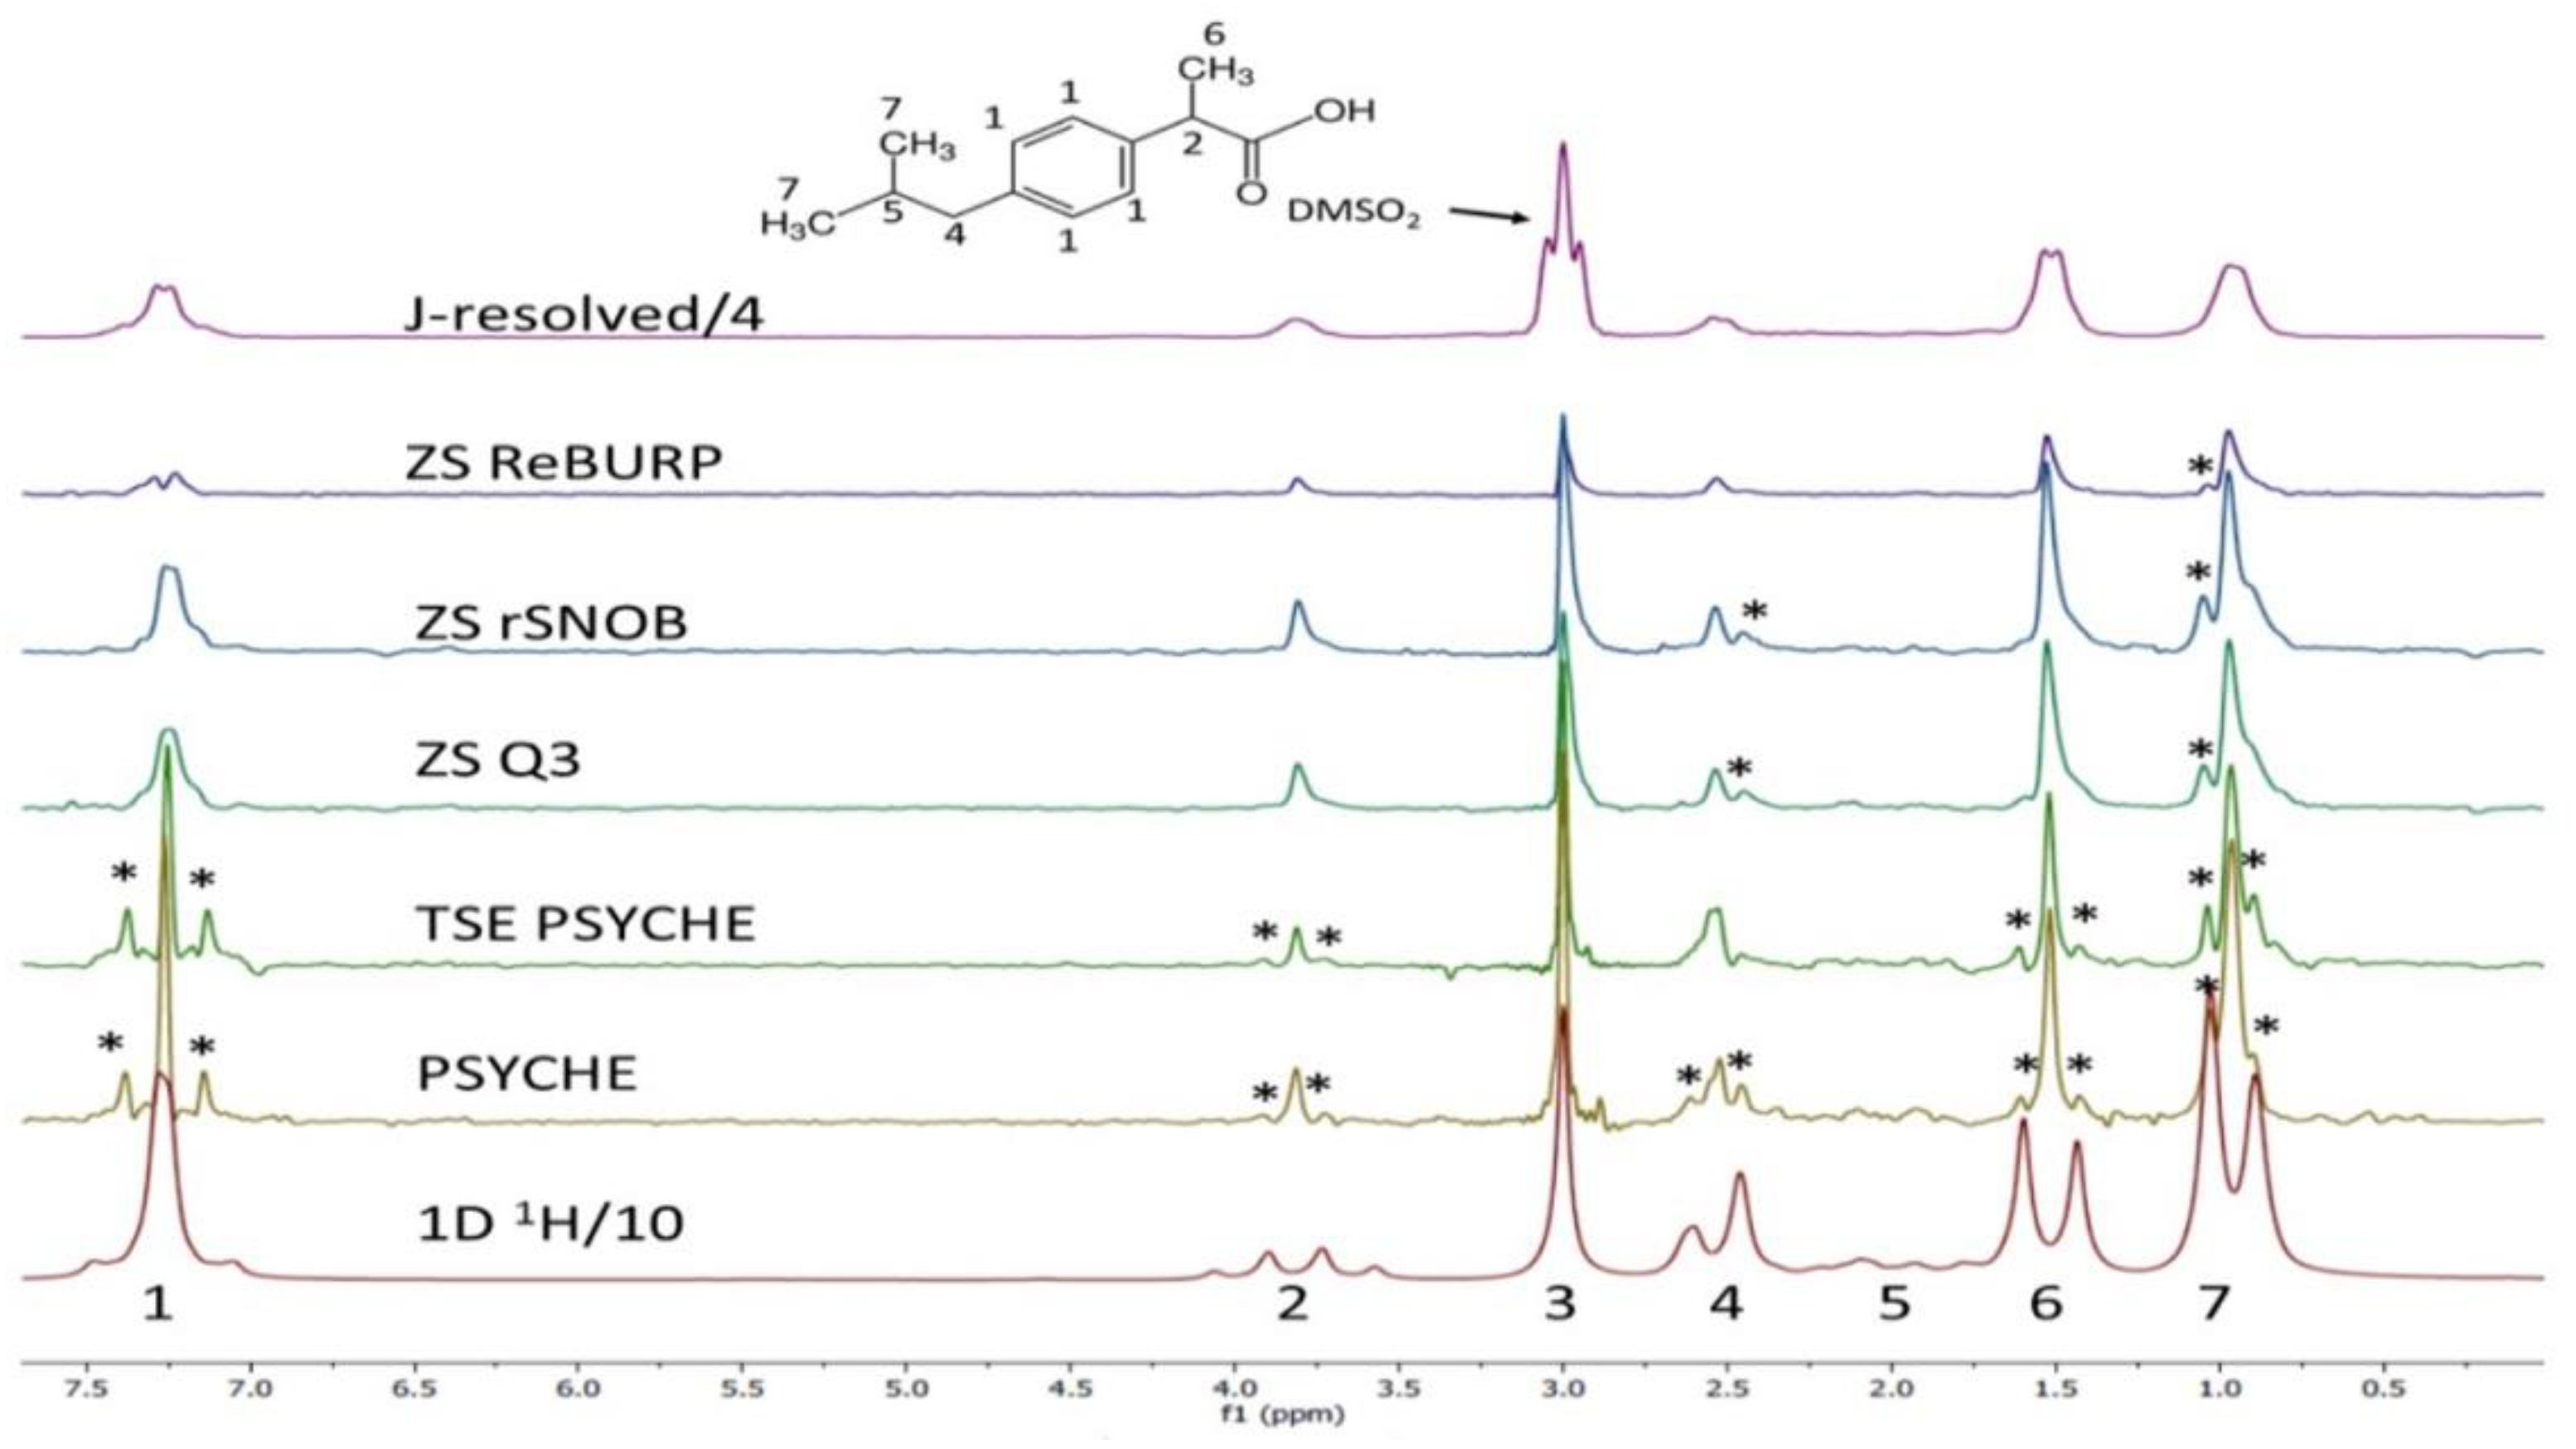
Figure 12.
Schematic application of benchtop NMR spectroscopy for process monitoring. Adapted with permission from [74], Royal Society of Chemistry, 2015.
Figure 12.
Schematic application of benchtop NMR spectroscopy for process monitoring. Adapted with permission from [74], Royal Society of Chemistry, 2015.
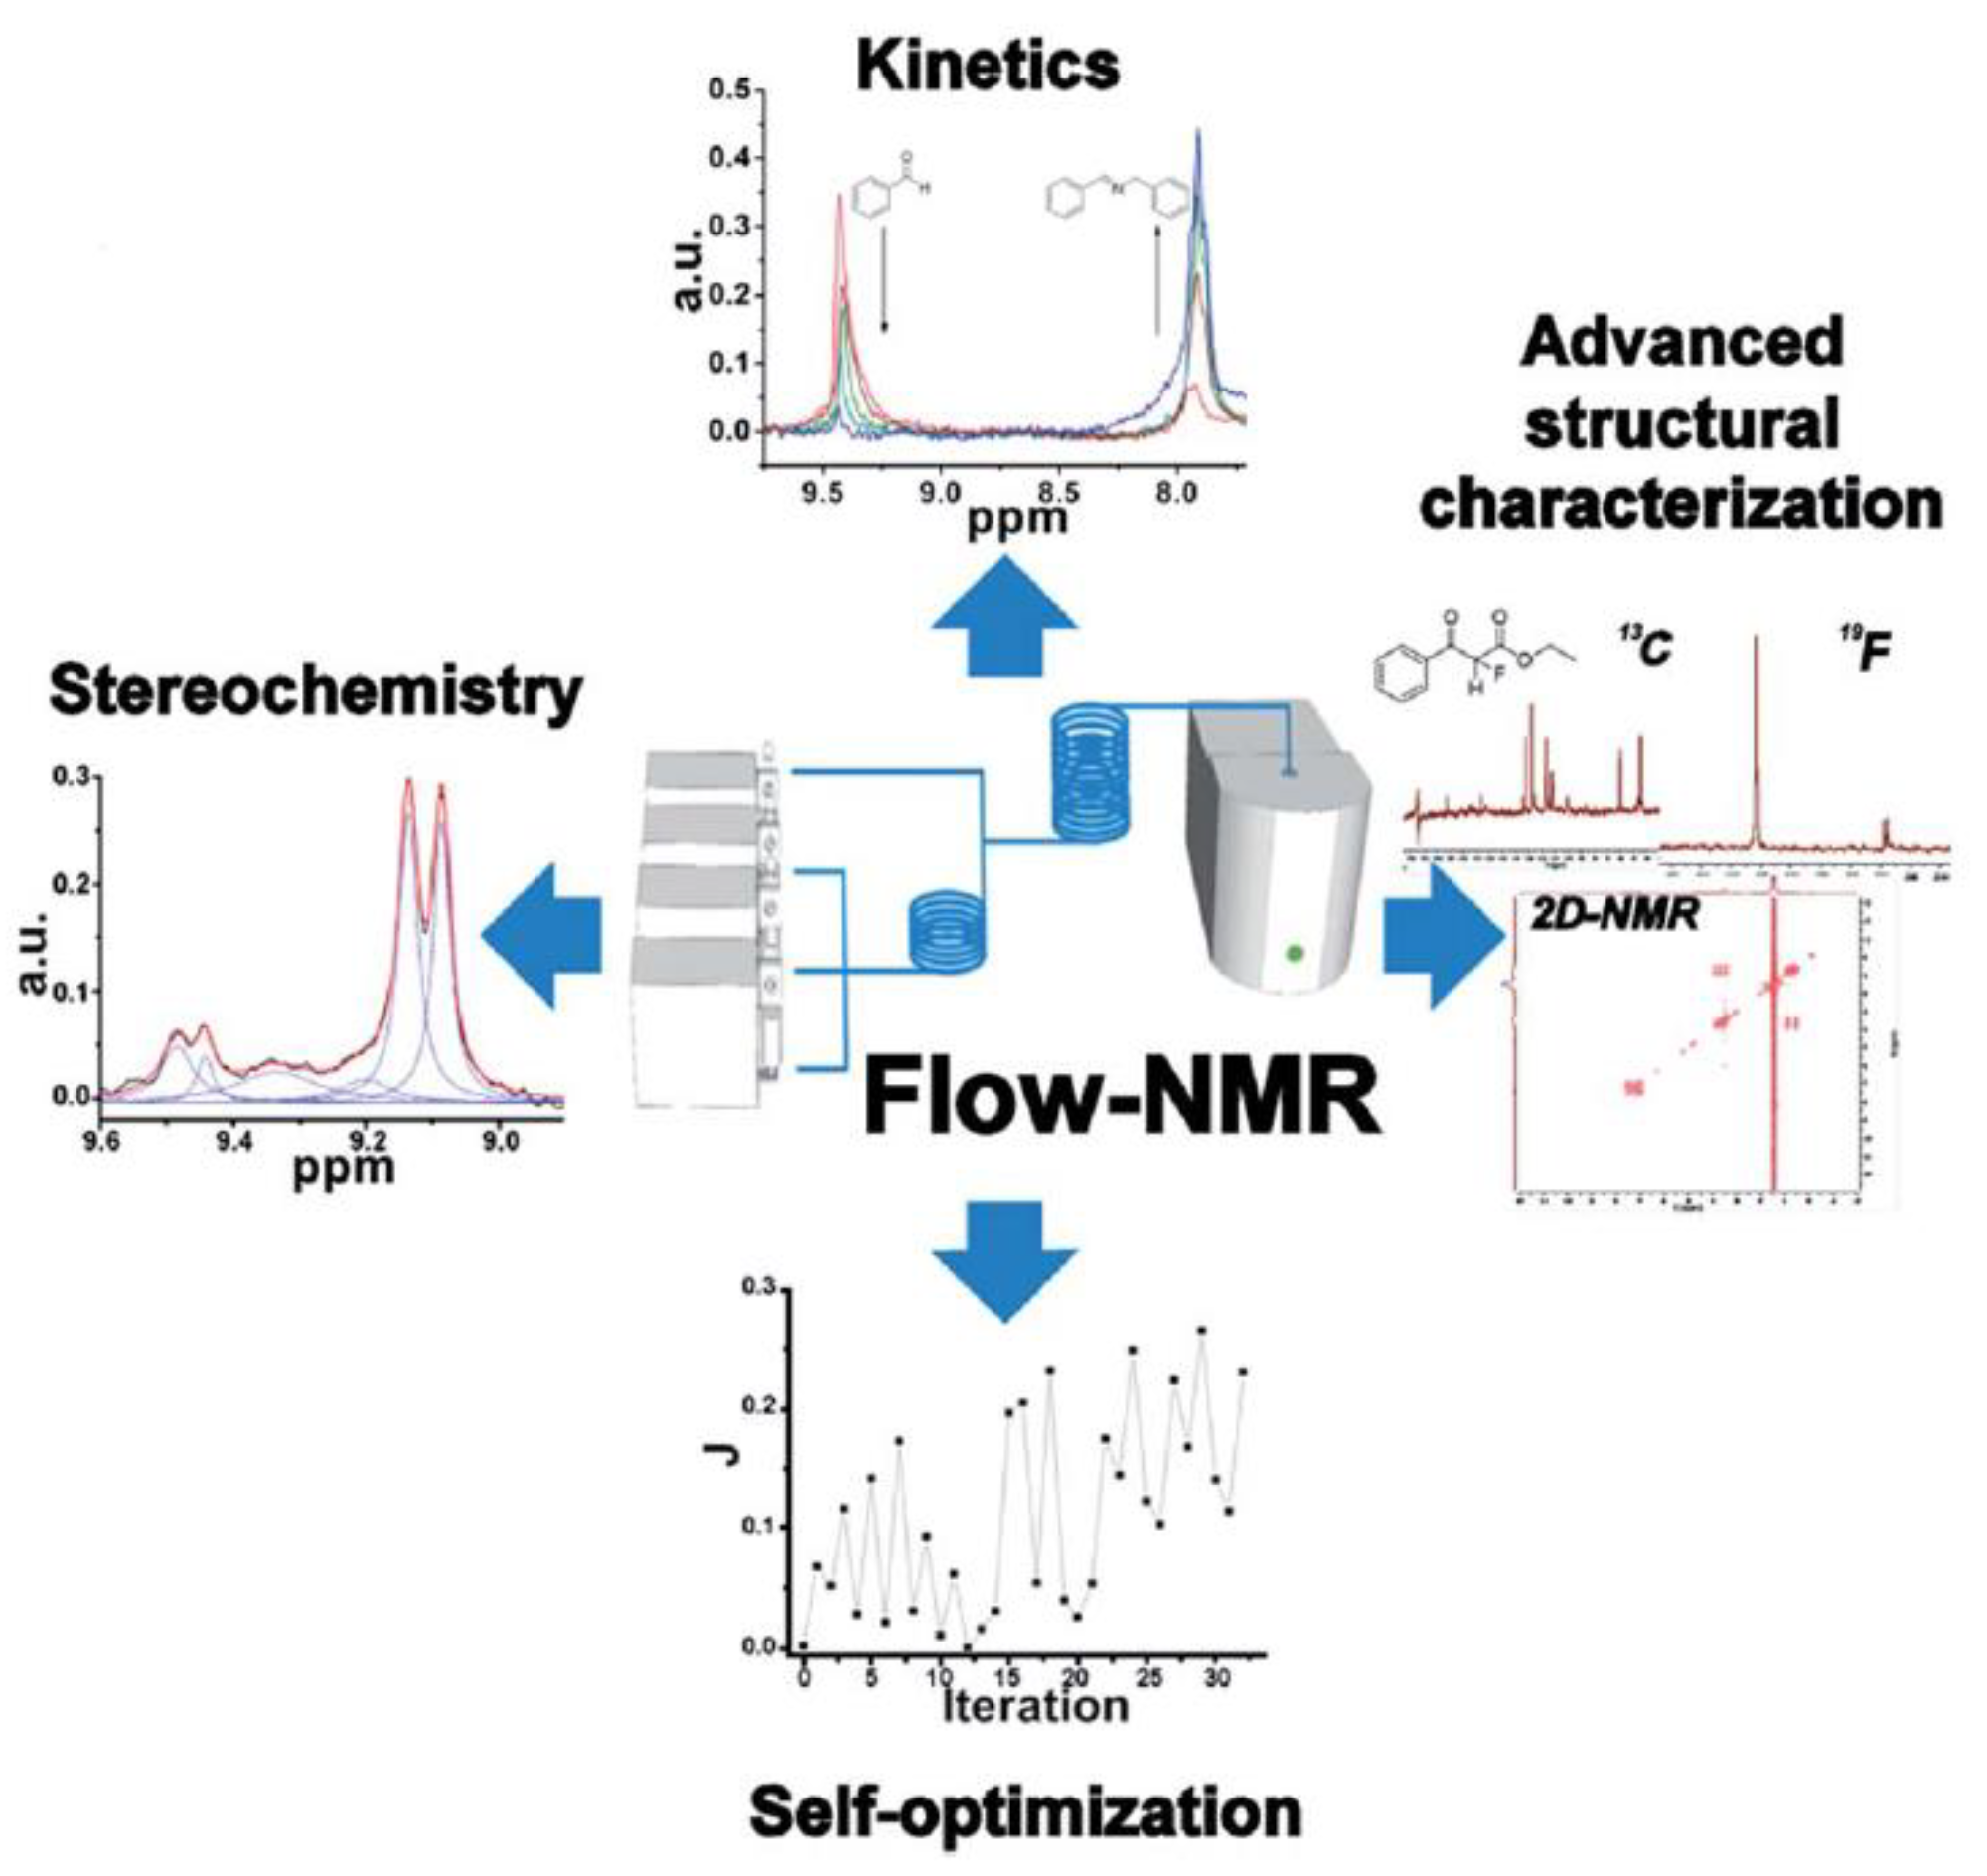
Figure 13.
Application of benchtop NMR spectroscopy to phospholipid (lecithin) analysis using 2D 1H-31P TOCSY at (a) 1 T, (b) 2 T; 31P{1H} spectra recorded at (c) 1 T and (d) 2 T. (e) 1H traces obtained at 1 T. Adapted with permission from [124], ACS, 2019.
Figure 13.
Application of benchtop NMR spectroscopy to phospholipid (lecithin) analysis using 2D 1H-31P TOCSY at (a) 1 T, (b) 2 T; 31P{1H} spectra recorded at (c) 1 T and (d) 2 T. (e) 1H traces obtained at 1 T. Adapted with permission from [124], ACS, 2019.


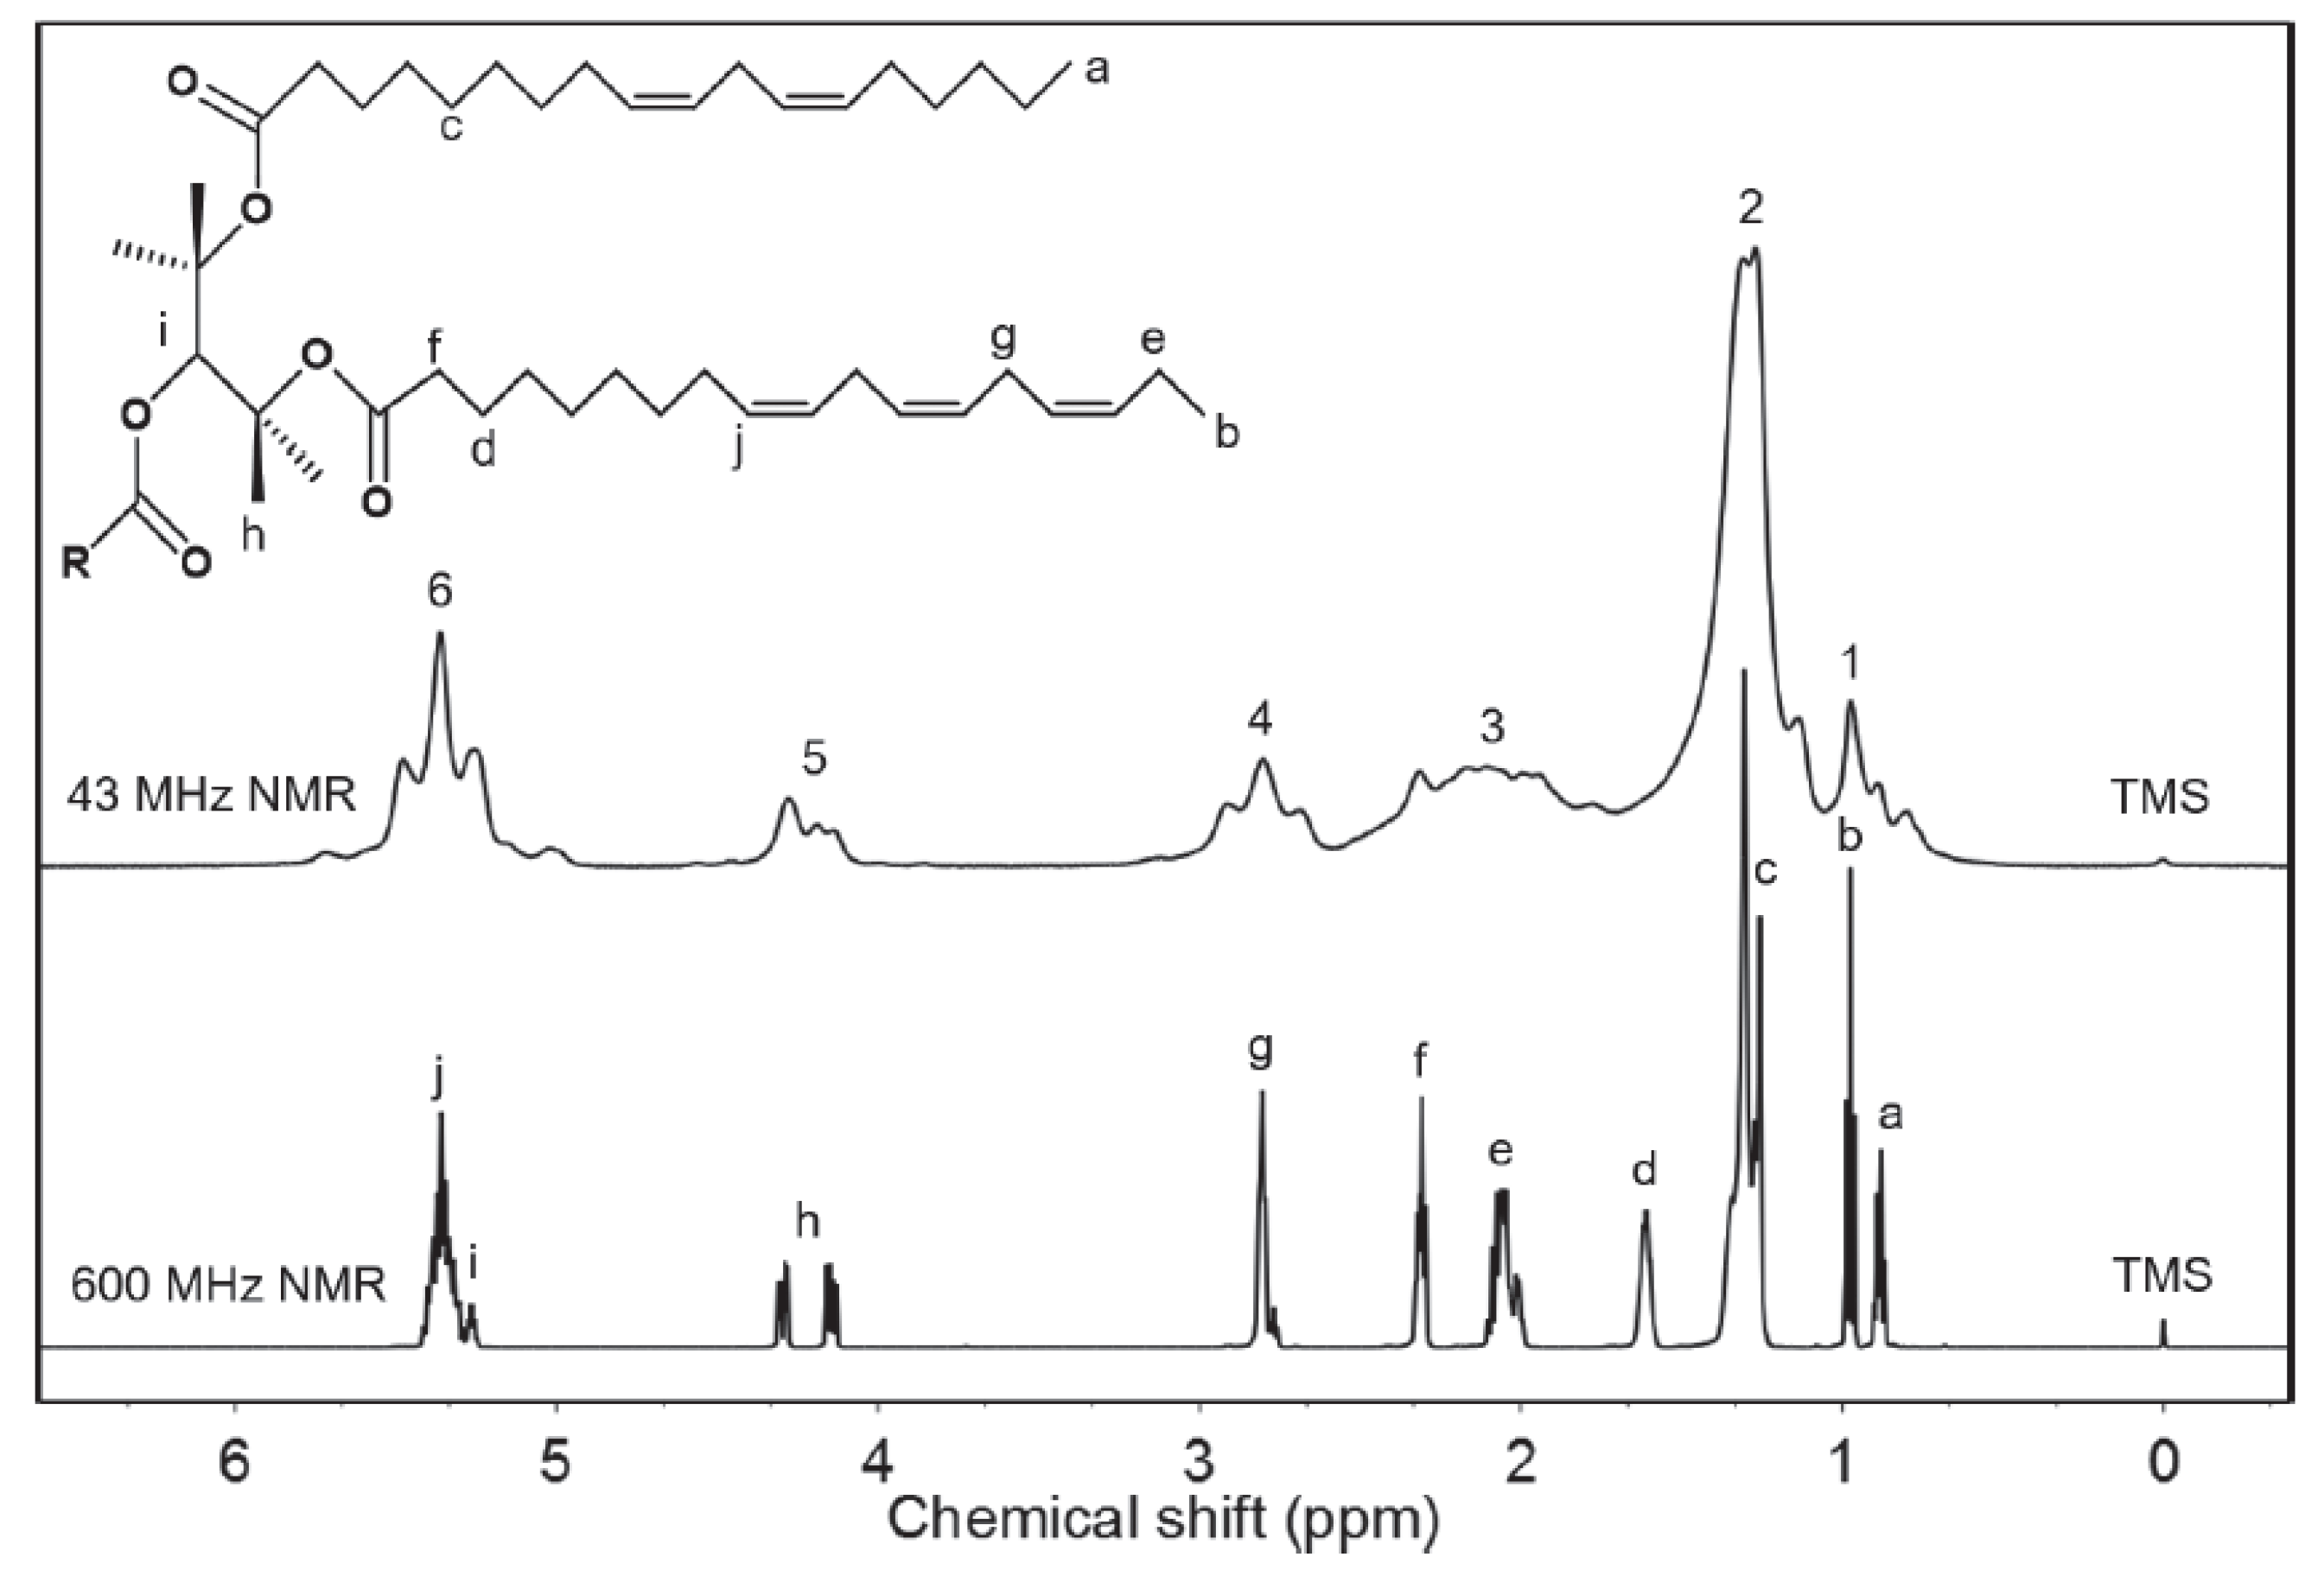
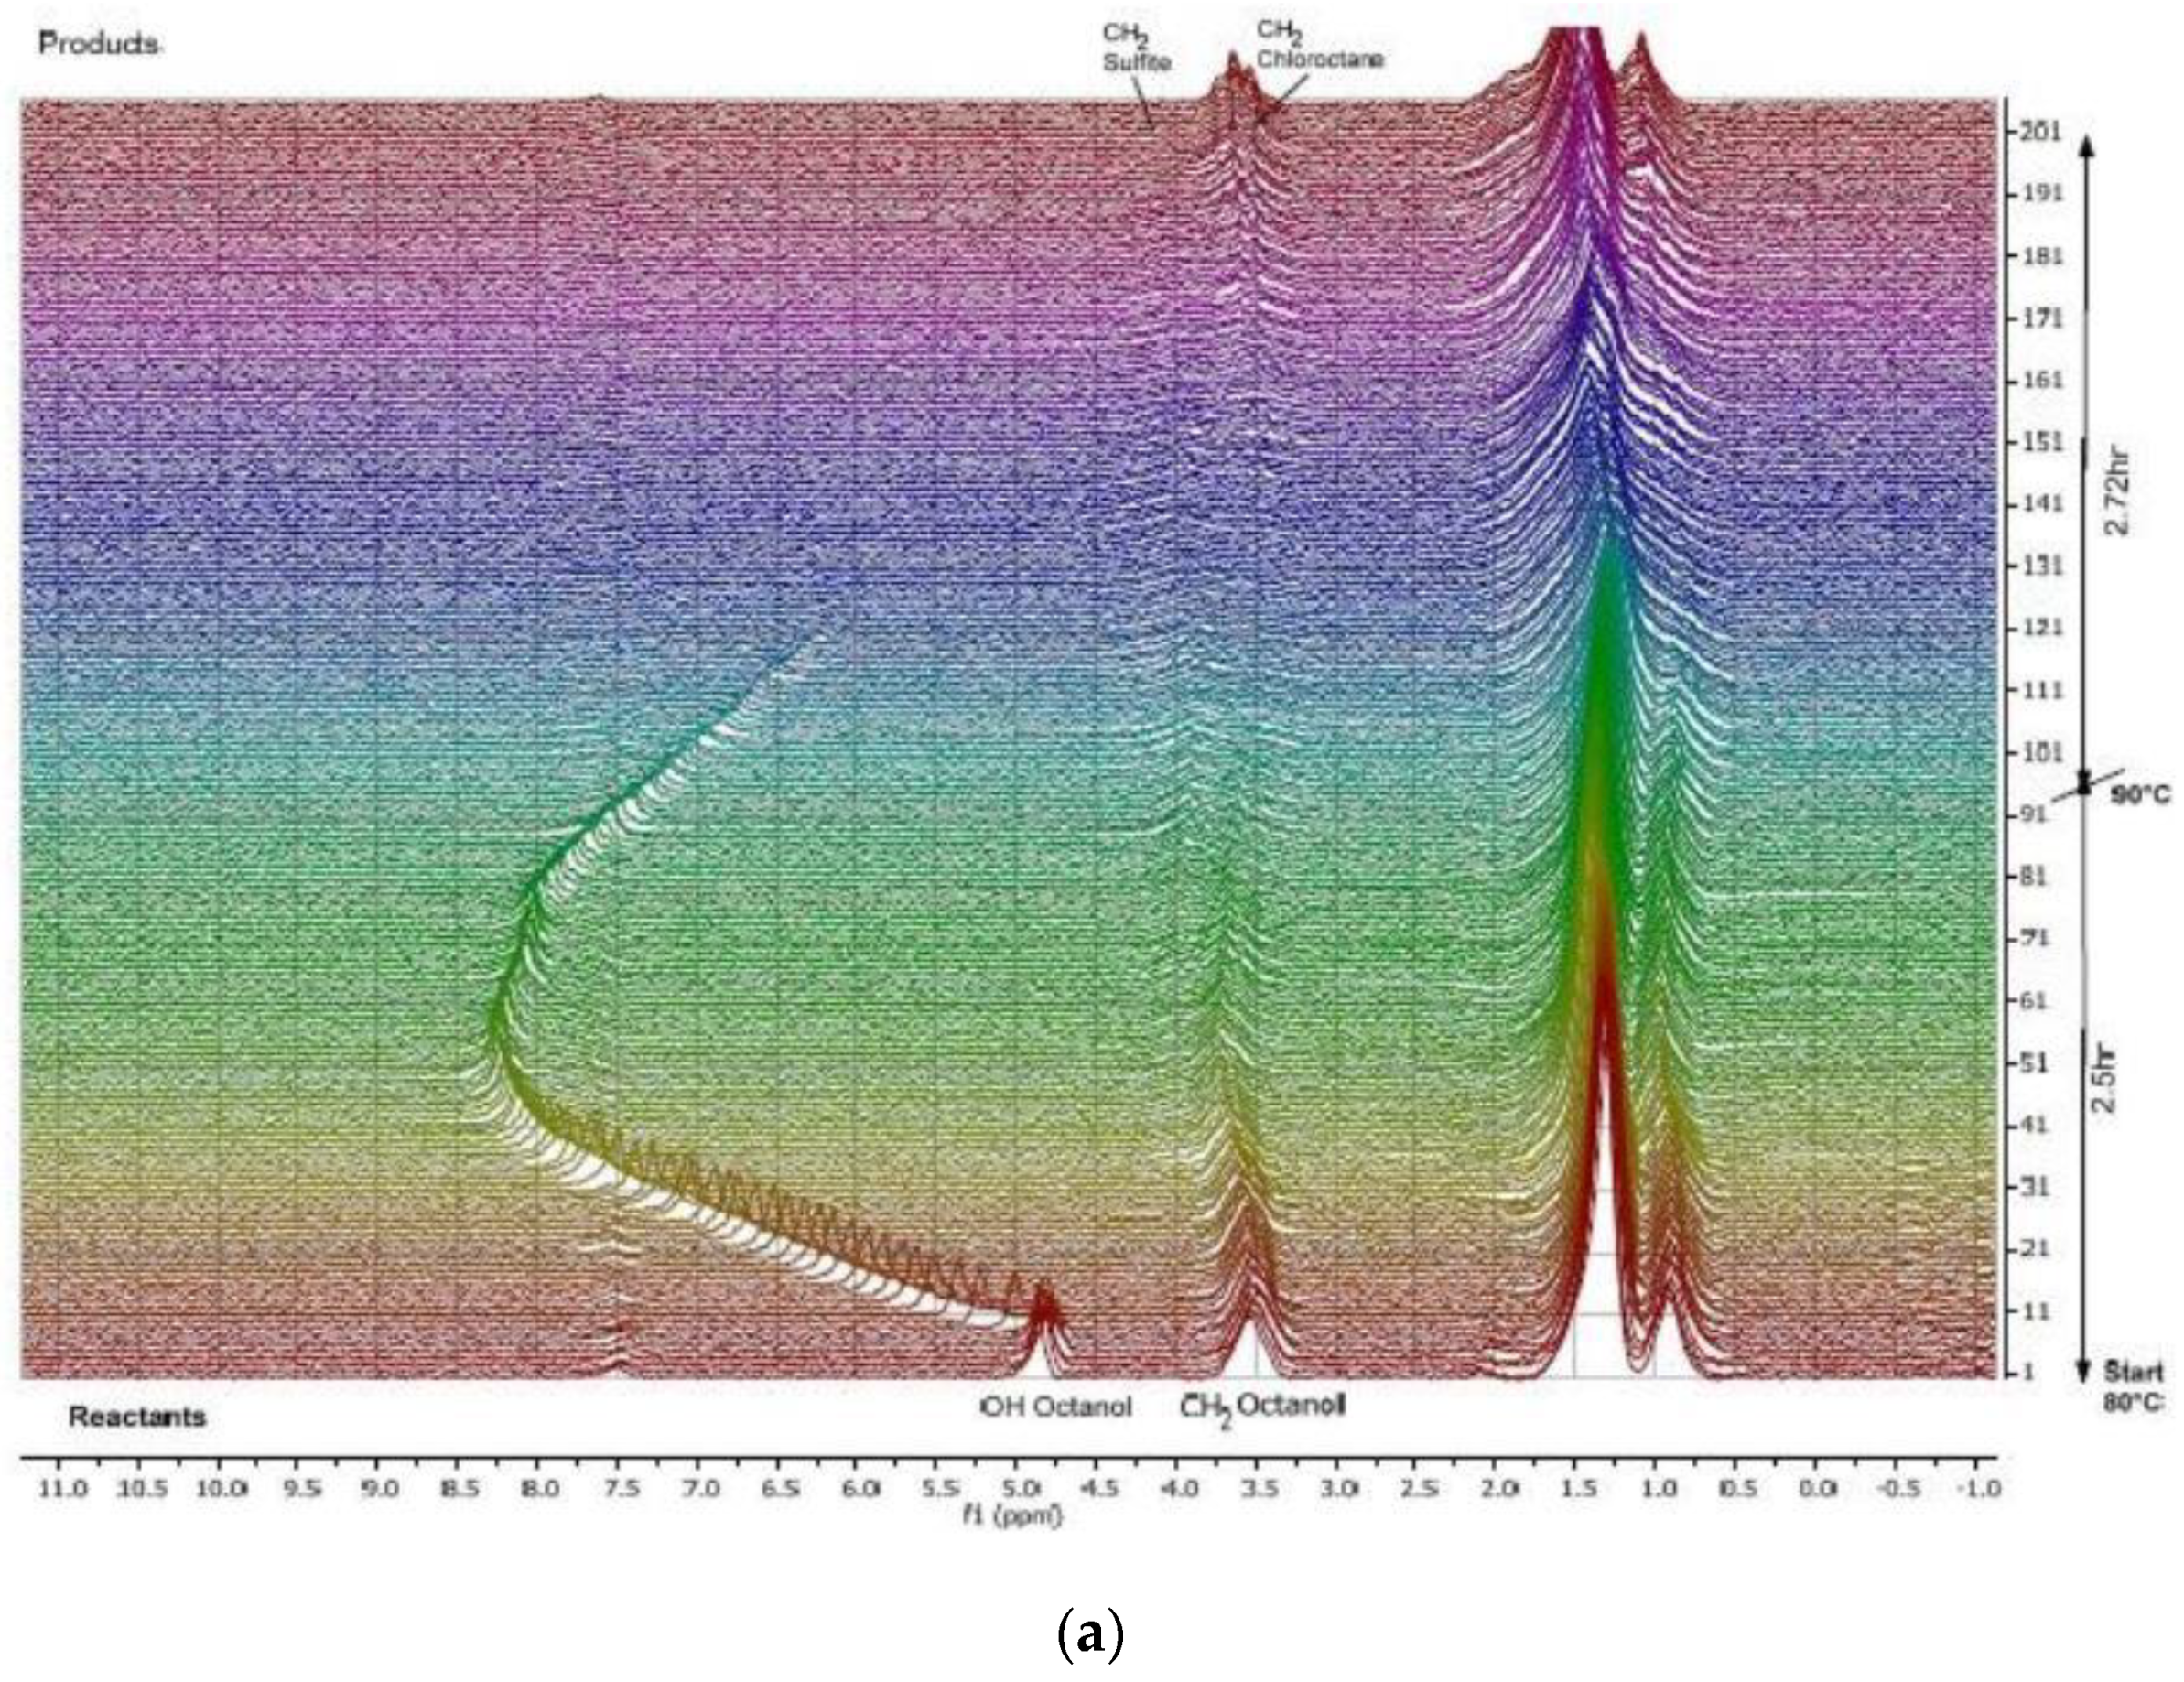
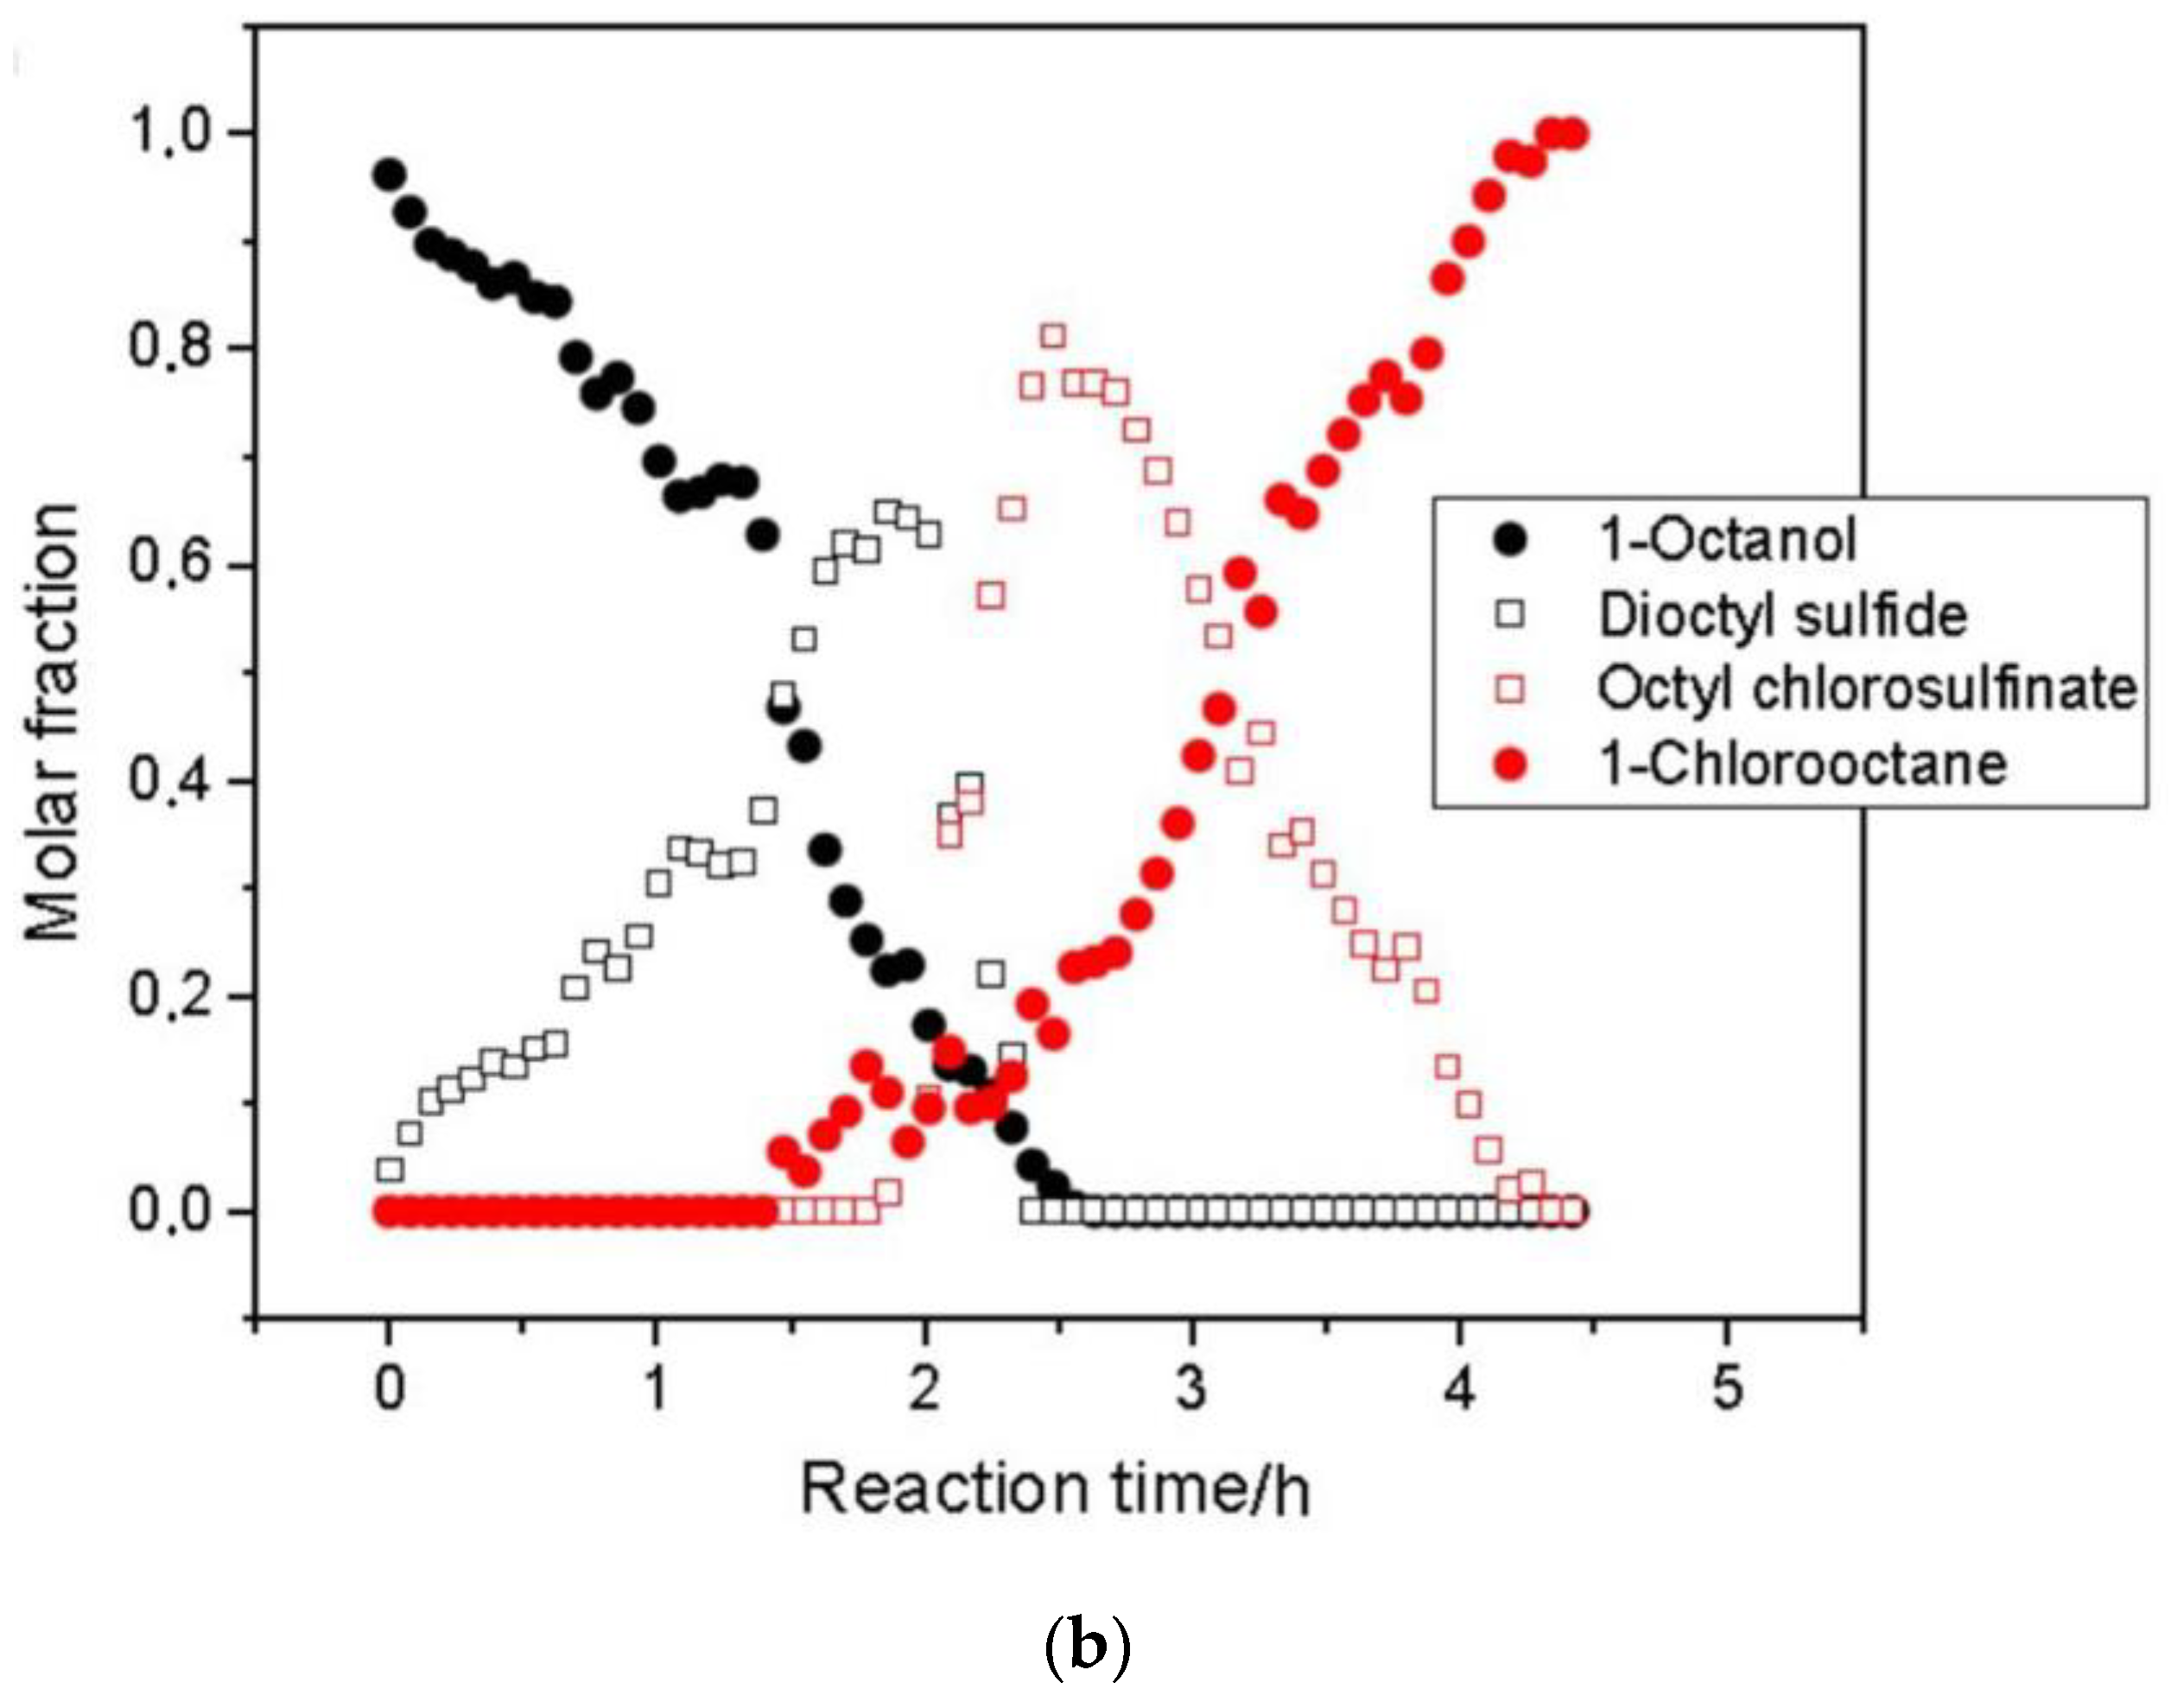
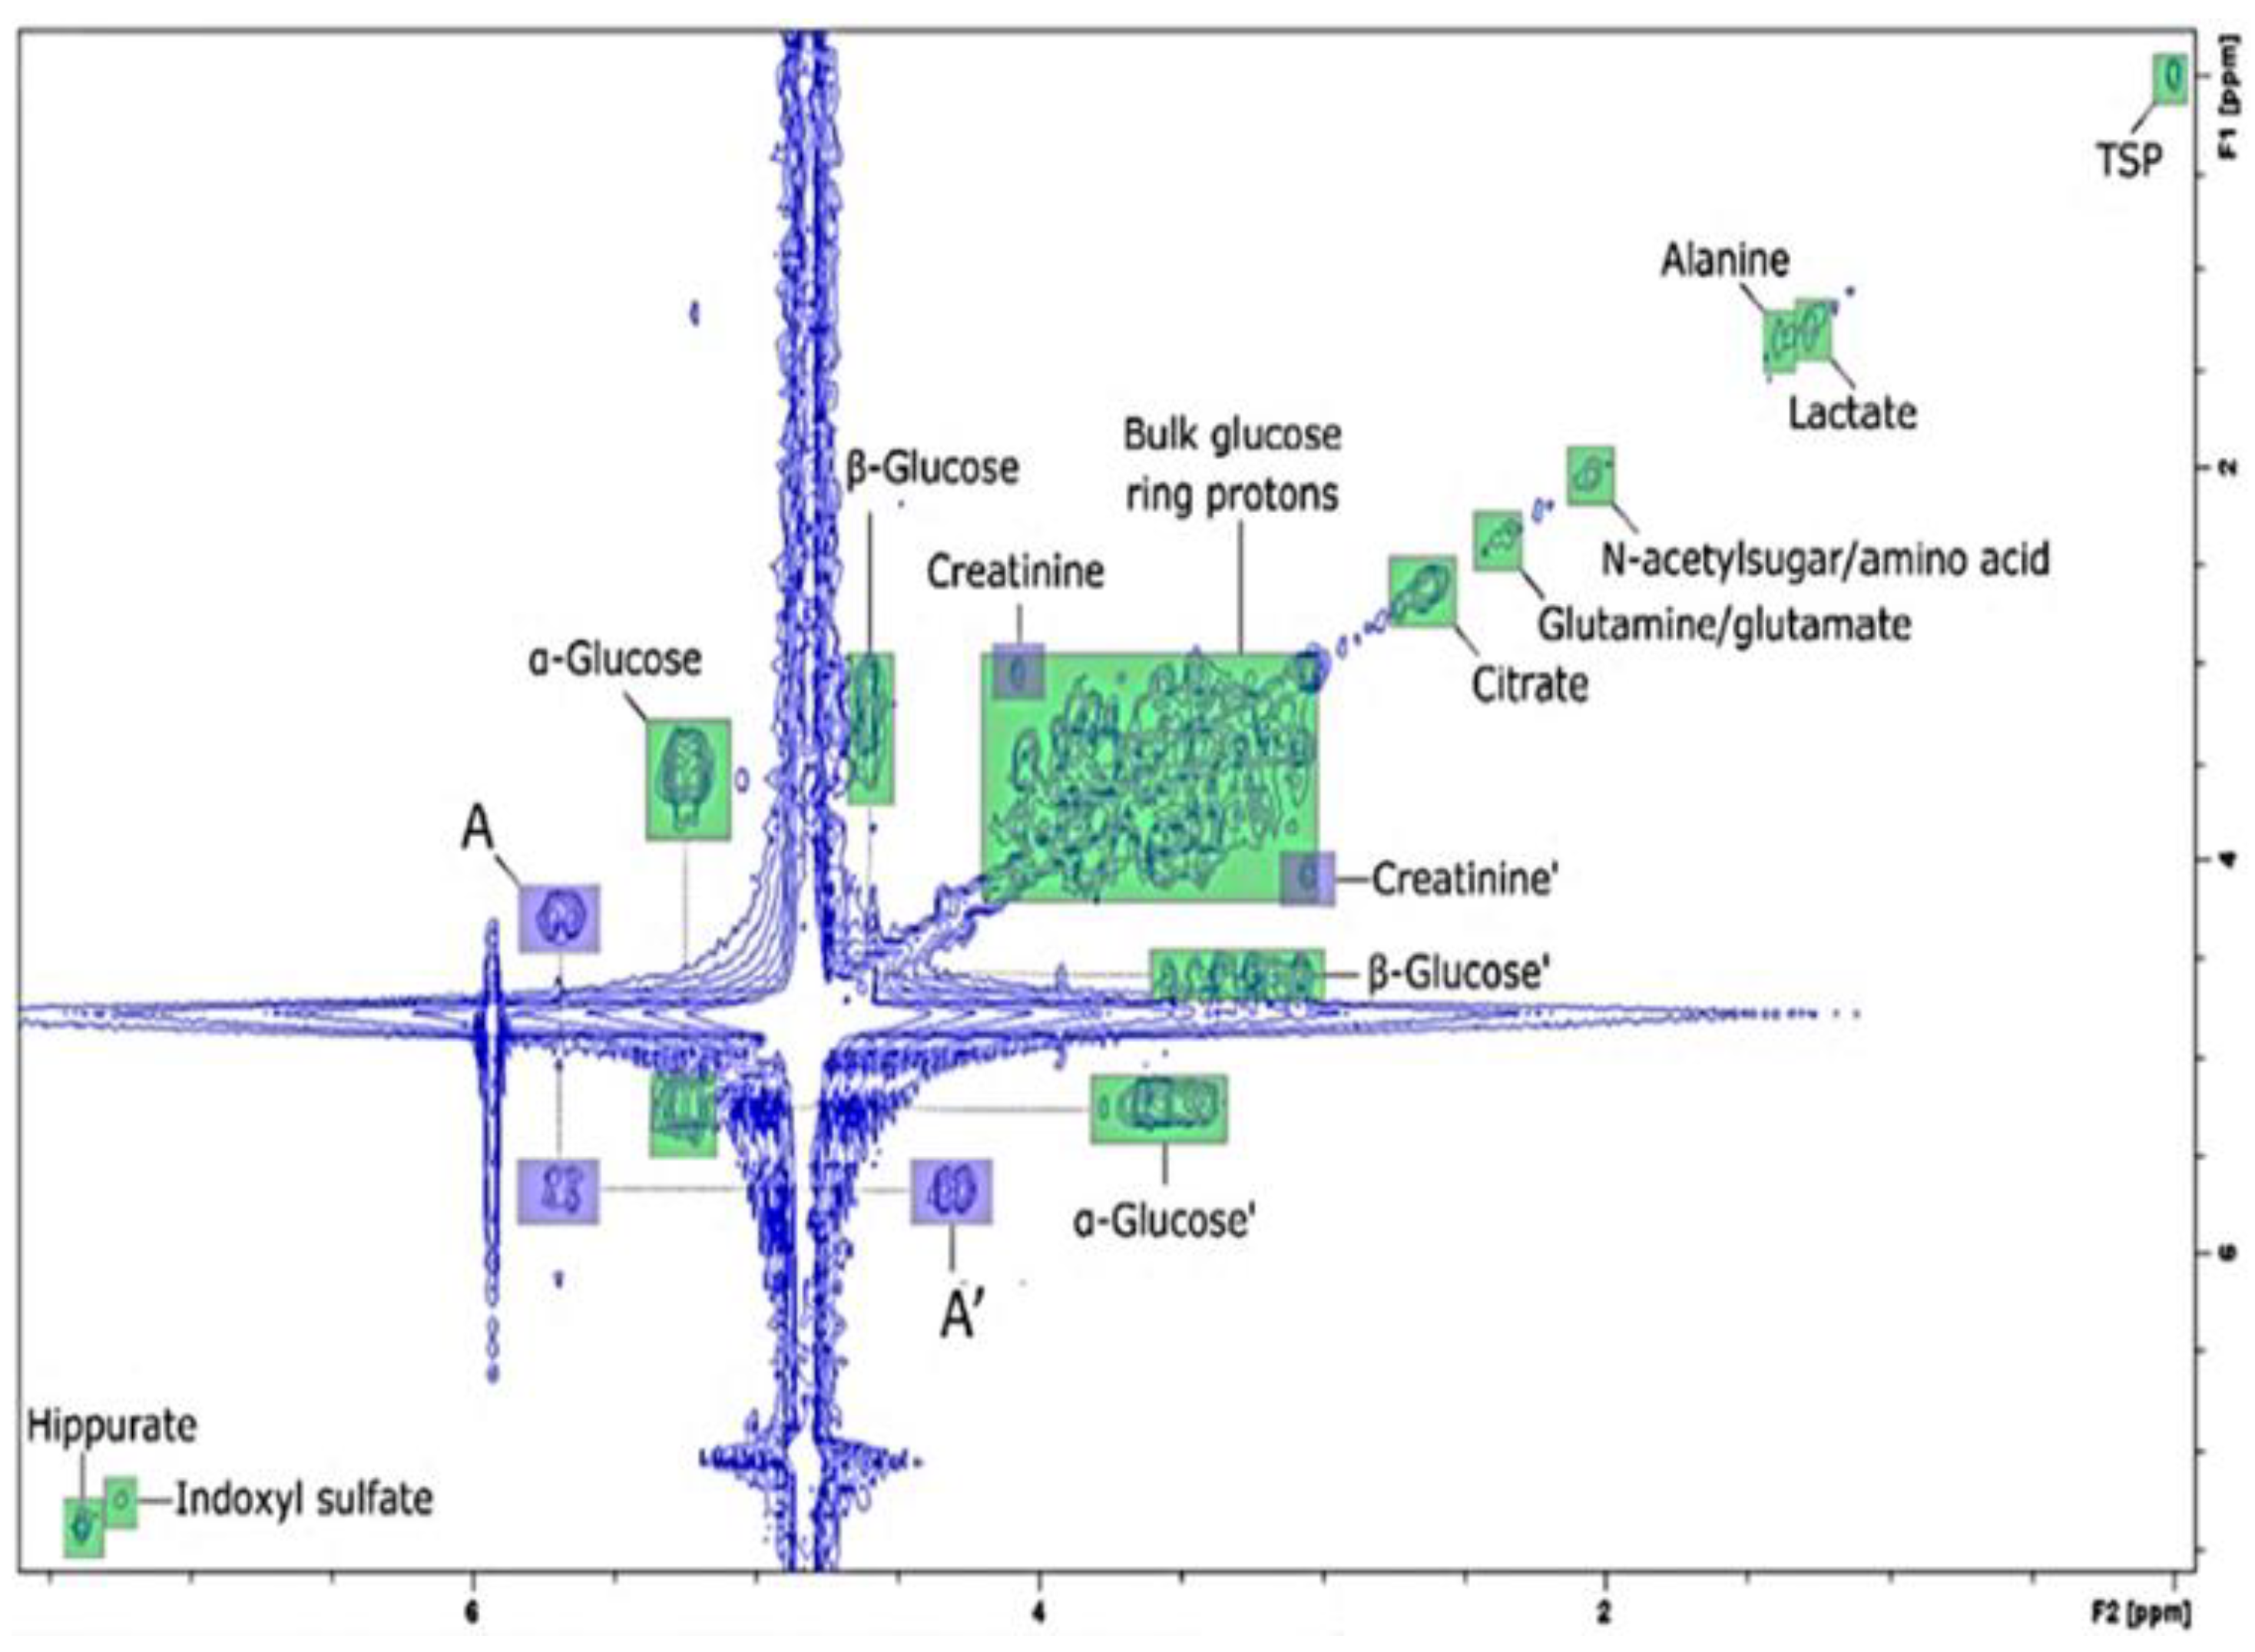
Table 1.
Applications of benchtop nuclear magnetic resonance (NMR) spectroscopy to the analysis of foods.
Table 1.
Applications of benchtop nuclear magnetic resonance (NMR) spectroscopy to the analysis of foods.
| Food | Analysis Goal | Technique | Ref. | |
|---|---|---|---|---|
| Oils | Olive oil | Adulteration | 60 MHz 1H NMR | [20] |
| Perilla oil | Authenticity | 43 MHz 1H NMR | [15] | |
| Patchouli essential oil | Adulteration | 60 MHz 1H NMR | [21] | |
| Rapeseed oil | Adulteration | 60 MHz 1H NMR | [14] | |
| Argan oil | Authenticity | 60 MHz 1H NMR | [23] | |
| Meat | Beef | Authentication | 60 MHz 1H NMR | [24] |
| Beverages | Coffee | Authenticity | 60 MHz 1H NMR | [16,25] |
| Wine | Alcohol content | 45 MHz 1H NMR | [17] | |
| Milk | Online monitoring Authenticity | 43 MHz 1H NMR | [26] | |
| Juice | Sugar content | 43 MHz 1H NMR | [27] | |
| Grains | Barley | Fermentation | 60 MHz 1H NMR | [28] |
Table 2.
Applications of benchtop NMR spectroscopy to the analyses of pharmaceuticals and drugs.
| Substance | Analysis Goal | Technique | Ref. |
|---|---|---|---|
| Sexual enhancement and sliming dietary supplements | Adulteration | 60 MHz 1H NMR | [32] |
| Sliming and dietary supplements | Adulteration | 60 MHz 1H NMR | [33] |
| Antimalarials and erectile dysfunction drugs | Detection of falsified medicines | 60 MHz 1H NMR | [34] |
| Smokable herbal mixture | Screening | 60 MHz 1H NMR | [37] |
| Derivatives of morphine, amphetamine, and ketamine | Screening | 80 MHz 1H NMR | [38] |
| Cannabinoids | Screening Quantitation | 60 MHz 1H NMR | [39] |
| Recreational MDMA/ecstasy | Screening Quantitation | 60 MHz 1H NMR | [40] |
| Substandard, falsified medicines Illegal drugs | Screening Quantitation | 60 MHz 1H NMR | [41] |
| (Pseudo)ephedrine | Identification | 43 MHz 1H NMR 17.5 MHz 31P NMR | [42] |
| Fluorofentanyl derivatives | Screening Quantitation | 60 MHz 1H NMR 54 MHz 19F NMR | [43] |
| Amphetamine, cathinone, norephedrine regioisomers | Screening Quantitation | 60 MHz 1H NMR 54 MHz 19F NMR | [44] |
| Psychoactive substances (cocaine and MDMA) | Identification | 60 MHz 1H NMR | [45] |
| Fentanyl analogues | Screening | 60 MHz 1H NMR | [31] |
Table 3.
Applications of benchtop NMR spectroscopy in the field of polymers.
| Reaction/Process Details | Technique | Ref. |
|---|---|---|
| Quantitative molecular characterization of copolymer and polymer blends containing polystyrene | 60 MHz 1H NMR | [50] |
| Quality control of SBR rubber | 43 MHz 1H NMR | [49,51] |
| Quantitative characterization of polyisoprene microstructure | 60 MHz 1H NMR | [52] |
| Quantitation of PVC plasticizers | 43 MHz 1H NMR | [48,53] |
| Online monitoring of emulsion polymerization of butyl acrylate | 20 MHz 1H NMR | [54] |
| Online monitoring of RAFT synthesis of poly(dimethyl acrylamide) | 60 MHz 1H NMR | [55] |
| Inline monitoring of polymerization of poly(methyl acrylate) | 60 MHz 1H NMR | [56] |
| Online detector for size-exclusion chromatography | 62 MHz 1H NMR | [57,58,59,60] |
Table 4.
Applications of benchtop NMR spectroscopy for process and reaction monitoring.
| Reaction/Process Details | Technique | Ref. |
|---|---|---|
| Comparison of offline gas-chromatographic method and online NMR method for monitoring toluene hydrogenation | 20 MHz 1H NMR | [62] |
| Online monitoring of transfer hydrogenation of acetophenone to phenylethanol | 43 MHz 1H NMR | [63] |
| Online monitoring of Grignard reagent preparation using fluid-bed Mg column | 60 MHz 1H NMR | [64] |
| Chemical reaction (Fischer esterification, Suzuki coupling, oxime reaction) monitoring using a flow cell | 45 MHz 1H NMR | [65] |
| In- and online monitoring of hypervalent I(III)–mediated cyclopropanation with solvent switching system | 43 MHz 1H NMR COSY | [66] |
| Continuous monitoring of esterification using bypass method in flow cell to control temperature and pressure | 20 MHz 1H NMR | [67] |
| Inline monitoring of complex nitration in flow using multivariate analysis | 43 MHz 1H NMR | [68] |
| Bayesian approach for automated quantitative analysis using mixtures of alcohols and acetates | 43 MHz 1H NMR | [69] |
| Exploration of data acquisition parameter selection such as flow and mixing behavior of continuous flow system | 60 MHz 1H NMR | [70] |
| Development of sample shifting method | 43 MHz 1H NMR | [71] [72] |
| Development of automation platform based on prototype benchtop NMR spectrometer using alcohol chlorination into corresponding alkyl chloride | 60 MHz 1H NMR | [73] |
| Development of fully automated platform based on inline benchtop NMR spectroscopy (imine formation, electrophilic fluorinations, and Diels–Alder reactions) | 43 MHz 1H NMR | [74] |
| Online monitoring of continuous lab-scale NDPA synthesis with automated data analysis using MATLAB, PLS-R, and indirect hard modeling | 43 MHz 1H NMR | [75] |
| Real-time process monitoring for continuous production of NDPA with NIR in pilot plant | 43 MHz 1H NMR | [76] |
| Inline monitoring of oxidative neutralization of mustard gas simulants | 43 MHz 1H NMR | [77] |
| Online process monitoring of batch distillation | 43 MHz 1H NMR | [78] |
| Inline monitoring of hydrogenation of lignin-derived phenols over Wilkinsons’s catalyst | 60 MHz H NMR | [79] |
| Reaction monitoring of porous heterogeneous catalysts using reduction of 1-octene over Pd/TiO2 as example reaction | 60 MHz 1H NMR T1/T2 NMR relaxometry | [80] |
| Online monitoring of biocatalytic synthesis of aromatic amino alcohols | 60 MHz 1H NMR | [81] |
| Real-time monitoring of highly enriched parahydrogen production | 60 MHz 1H NMR | [82] |
Table 5.
Applications of benchtop NMR spectroscopy to bioprocesses monitoring.
| Reaction/Process Details | Technique | Ref. |
|---|---|---|
| Online monitoring of fermentation processes using bypass system | 43 MHz 1H NMR | [89] |
| Online monitoring of sucrose hydrolysis using water suppression techniques | 43 MHz 1H NMR | [90] |
| Online monitoring of enzymatic hydrolysis of marine byproducts using water suppression techniques | 43 MHz 1H NMR | [91] |
| Online non-invasive in vivo monitoring of lipid production by microalgae | 43 MHz 1H NMR | [30,92] |
| Online monitoring of biodiesel production using transesterification | 43 MHz 1H NMR | [93,94,95,96] |
Table 6.
Applications of benchtop NMR spectroscopy to disease monitoring.
| Reaction/Process Details | Technique | Ref. |
|---|---|---|
| Biomarkers of diabetic disease such as α-glucose and acetone in human urine | 60 MHz 1H NMR COSY | [103,104] |
| 60 MHz 1H NMR | [105] | |
| Glucose quantitation in human whole blood | 43 MHz 1H NMR | [106] |
Table 7.
Techniques used to improve the sensitivity and resolution of benchtop NMR spectroscopy.
| Technique | Ref. |
|---|---|
| Solvent suppression based on gradient pulse sequence | [97,107] |
| Homo-decoupling method using different pure-shift methods | [108] |
| Addition of salts as chemical shift agents to peptide sample | [109] |
| Hyperpolarization methods (SABRE) | [110,111,112,113,114] |
Table 8.
Multidimensional techniques used in benchtop NMR spectroscopy.
| Reaction/Process Details | Technique | Ref. |
|---|---|---|
| Structural analysis of strychnine | 43 MHz 1H NMR, 13C NMR, DEPT, COSY, HETCOR, HSQC, HMBC, J-resolved spectroscopy | [116] |
| Authentication of edible oil | 43 MHz 1H NMR, COSY | [117] |
| Real-time monitoring of Heck-Matsuda coupling reaction | 43 MHz 1H NMR, COSY | [118] |
| Monitoring of esterification reactions | 43 MHz 1H NMR, COSY, HETCOR, HMBC | [119] |
| Monitoring of α-fluoro-α,β-unsaturated ester synthesis | 43 MHz 1H NMR, COSY, 19F NMR | [120] |
Table 9.
Heteroatom-based benchtop NMR spectroscopy methods.
| Heteroatom | Technique | Reaction/Process Details | Ref. |
|---|---|---|---|
| 13C | 43 MHz 1H NMR 13C 1D NMR | Quality control of SBR rubber | [49,51] |
| 43 MHz 1H NMR 13C 1D NMR | Quantitation of m-anisaldehyde and (R)-(+)-limonene | [72] | |
| 43 MHz 1H NMR 13C 1D NMR | Application of SABRE hyperpolarization | [111,112] | |
| 19F | 60 MHz 1H NMR 19F NMR | Detection and quantitation of fluorofentanyl derivatives | [43] |
| 60 MHz 1H NMR 19F NMR | Detection and quantitation of amphetamine, cathinone, norephedrine regioisomers | [44] | |
| 60 MHz 1H NMR 19F NMR | Reaction monitoring of fluorine-containing fine chemicals | [121] | |
| 60 MHz 1H NMR 19F NMR | Degradation of perfluorooctanoic acid | [122] | |
| 43 MHz 1H NMR 19F NMR | Monitoring of carbon monoxide release using fluorinated manganese carbonyl complexes | [123] | |
| 31P | 43 MHz 1H NMR 31P NMR | Identification of (pseudo)ephedrine | [42] |
| 43, 80 MHz 1H NMR 31P NMR 1H-31P TOCSY | Identification and quantitation of phospholipids | [124] | |
| 7Li | 7Li NMR(1.4 T) | Quantitation of lithium in real brine samples | [125] |
| 129Xe | 129Xe NMR(1 T) | Detection of caged Xe as a bioprobe | [126] |
| 207Pb | 207Pb NMR(1.4 T) | Detection of methylammonium lead chloride perovskite | [127] |
Publisher’s Note: MDPI stays neutral with regard to jurisdictional claims in published maps and institutional affiliations. |
© 2021 by the authors. Licensee MDPI, Basel, Switzerland. This article is an open access article distributed under the terms and conditions of the Creative Commons Attribution (CC BY) license (https://creativecommons.org/licenses/by/4.0/).
Share and Cite
MDPI and ACS Style
Yu, H.-Y.; Myoung, S.; Ahn, S. Recent Applications of Benchtop Nuclear Magnetic Resonance Spectroscopy. Magnetochemistry 2021, 7, 121. https://doi.org/10.3390/magnetochemistry7090121
AMA Style
Yu H-Y, Myoung S, Ahn S. Recent Applications of Benchtop Nuclear Magnetic Resonance Spectroscopy. Magnetochemistry. 2021; 7(9):121. https://doi.org/10.3390/magnetochemistry7090121
Chicago/Turabian StyleYu, Hyo-Yeon, Sangki Myoung, and Sangdoo Ahn. 2021. "Recent Applications of Benchtop Nuclear Magnetic Resonance Spectroscopy" Magnetochemistry 7, no. 9: 121. https://doi.org/10.3390/magnetochemistry7090121
Note that from the first issue of 2016, this journal uses article numbers instead of page numbers. See further details here.