
The Effect of Co-Doping on the Structural and Magnetic Properties of Single-Domain Crystalline Copper Ferrite Nanoparticles

Department of Physics, Faculty of Science, The Hashemite University, Zarqa 13133, Jordan
Magnetochemistry 2022, 8(12), 164; https://doi.org/10.3390/magnetochemistry8120164
Submission received: 26 October 2022
/
Revised: 10 November 2022
/
Accepted: 18 November 2022
/
Published: 22 November 2022
(This article belongs to the Special Issue Magnetic Nanoparticles: State of the Art and Future Perspectives)
Abstract
:Nanoparticles of Co-doped copper ferrite, , were successfully synthesized by hydrothermal method. The preparation conditions were optimized to produce small nanoparticles with crystallite size of 20 nm that fall into the single-domain regime. The influence of Co-doping on the structure and magnetic properties of pure copper ferrite, , was investigated. The prepared ferrite nanoparticles were found to be in a single structural phase with a spinel-type structure, according to the XRD and FT-IR measurements. When compared to pure Cu ferrite, the addition of Co increased the lattice constant and decreased the density. The TEM results confirmed the spherical morphology of the prepared ferrite nanoparticles. For the entire temperature range of the ferrite nanoparticles, the magnetization measurements showed a single ferrimagnetic phase. It was observed that the coercivity and remanent magnetization increased with decreasing temperature. Magnetic anisotropy was found to increase with Co-doping in comparison to pure Cu ferrite. The ZFC–FC magnetization curves showed that the blocking temperature () of the prepared nanoparticles is above room temperature, demonstrating that they are ferrimagnetic at room temperature and below. Additionally, it was found that decreasing the magnetic field lowers . The FC curves below were observed to be nearly flat, indicating spin-glass behavior that might be attributed to nanoparticle interactions and/or surface effects such as spin canting and spin disorder.
1. Introduction
Magnetic ferrite nanoparticles have been the focus of much research in recent decades, with the goal of using them in a variety of technological applications. Controlling their morphology and size, and thus tuning their magnetic properties, is the key to using these nanoparticles in a variety of industries and mass production. Copper ferrite (CF) is of particular interest among these magnetic ferrites because it has interesting magnetic properties that can be tuned using synthesis methods. Copper ferrites are widely used in a variety of applications, including photocatalysis [1], water purification [2], energy storage devices [3], drug delivery [4], and magnetic resonance imaging [5]. CF crystallizes into two phases, cubic and tetragonal, depending on synthesis method and annealing temperature [6]. For the cubic phase, it has an inverse spinel structure [7] with the chemical formula , with all Cu cations occupying the octahedral sites and Fe cations evenly spread in both the tetrahedral and octahedral sites.
Cobalt ferrite (), on the other hand, is a hard ferrimagnetic material with an inverse spinel structure [8]. Because the magnetic moment of Cu2+ (1) is less than that of Co2+ (3), the magnetic characteristics of () ferrite can be modified by substituting Cu2+ ions with Co2+ ions due to the strong magnetic anisotropy, moderate saturation magnetization, and high coercivity of ferrite [9,10]. Hydrothermal [11], coprecipitation [12], sol–gel [13], ceramic [14], and ball milling techniques [15] have all been used to produce mixed Cu–Co ferrites.
The magnetic properties of magnetic nanoparticles are strongly influenced by their size. A particle becomes a single-domain particle when its size falls below a critical size at which it can no longer be divided into domains. For magnetic spinel ferrites, the critical size is around 40 nm [16,17]. When the particle’s size is reduced below the critical size, it becomes superparamagnetic, with zero coercivity. Significant research on copper ferrite and its doped families has been conducted in recent decades. The majority of these studies were carried out on nanoparticles that were considerably larger than the critical size, leading toa little size dependence of their magnetic properties. This is due to the difficulty in preparing small monodisperse nanoparticles (less than 40 nm) with controlled shape due to the nanoparticles’ poor chemical stability. To our knowledge, systematic research on mixed Cu–Co ferrite nanoparticles with sizes lying within the single-domain regime is still insufficient. From an experimental perspective, obtaining pure copper ferrite with cubic phase using hydrothermal method is very problematic. The output phase of most studies on copper ferrite nanoparticles was often a combination of tetragonal and cubic phases. Experimentally, it has been established that adding a little amount of Co to copper ferrite helps in the formation of a stable cubic phase. That was the driving force for the selection of this composition (). The objective of this study is to investigate the effect of Co-doping on the magnetic properties of single-domain copper ferrite nanoparticles. To achieve this, small ferrite nanoparticles are hydrothermally prepared, and their structural and magnetic properties are thoroughly investigated. Recognizing the magnetic properties of these stable single-domain nanoparticles, together with obtaining a reproducible recipe for making them, is a fundamental first step toward their use in a wide range of applications [1,2,3,4,5].
2. Materials and Methods
The hydrothermal method was used in this study to produce ferrite nanoparticles from high-grade metal nitrates [10,18,19]. Cobalt (II) nitrate hexahydrate · (reagent grade, 98%), copper (II) nitrate trihydrate · (extra pure), iron (III) nitrate nonhydrate · (analytical reagent, ≥98%), sodium hydroxide (reagent grade, ≥98%), HPLC plus DI water, and ethanol absolute anhydrous (ACS reagent) were used as starting materials without further processing. All chemicals were bought from Sigma-Aldrich. According to the required stoichiometric proportions of the , various amounts of the starting materials were used. In this research, 140 mL of DI water was used to dissolve 10 mmol of Fe(III) nitrate, 3.75 mmol of Cu(II) nitrate, and 1.25 mmol of Co(II) nitrate. The mixture was then magnetically stirred at 500 rpm for 10 min. After that, while vigorously stirring the cationic solution at a speed of around 1500 rpm, a precipitating agent solution made up of 60 mmol of NaOH dissolved in 20 mL DI water was gradually added. The resultant solution was given 15 min to stir at about 1500 rpm. The subsequent step was to transfer the solution to a 200 mL Teflon-lined stainless steel autoclave, seal it, and heat it to 190 C for 12 h. Following this, the autoclave was removed from the vacuum oven and allowed to cool naturally to room temperature. After being rinsed few times with ethanol and DI water, the finished product of the nanoparticles was collected by a powerful magnet. The nanoparticles were then mixed with 15 mL of DI water, separated by centrifugation at 4800 rpm, dried in a vacuum oven at 105 C for 24 h, and then crushed, giving around 1 g of the material. The obtained ferrite nanoparticles’ crystallinity was increased by annealing at a high temperature for six hours at 700 C. X-ray diffraction (XRD) was used to examine the crystal structure of the ferrite nanoparticles. A Rigaku Ultima IV diffractometer with a Cu–K radiation source ( Å) was employed to acquire the XRD spectrum. The XRD data were collected in the range of = 16–70, with a step size of and a scanning rate of per minute, respectively. Surface morphology and particle size measurements were carried out by using a JEOL 1200 transmission electron microscope (TEM). A Bruker FT-IR spectrometer was used to record the FT-IR spectrum. The magnetic properties were studied at temperatures between 300 K and 10 K using a Quantum Design Physical Property Measurement System (PPMS) equipped with a vibrating sample magnetometer (VSM). Magnetization measurements were taken in a magnetic field spanning from −25 to 25 kOe.
3. Results and Discussion
3.1. XRD Analysis
The XRD pattern of the ferrite nanoparticles is displayed in Figure 1. The cubic spinel structure was confirmed to be a single phase with no impurity phases by the successful use of the space group Fd3m to index the XRD reflections. All reflections shown in the figure are consistent with the cubic spinel structure, which is illustrated by the bold-vertical black bars at the bottom [10,20]. The relatively high peak intensity suggests that the nanoparticles produced are highly crystalline.
The XRD spectrum was Rietveld refined using the FullProf software to reveal information about structural parameters such as grain size and X-ray density [21,22]. “Following each refinement trial, the Rietveld fitting quality was evaluated using the reliability R-factors (expected and weighted profile ) and goodness of fit ()” [10]. Figure 1 shows the Rietveld refinement of the ferrite nanoparticles. “The three essential refined quantities were the oxygen positional parameter u, the experimental lattice parameter , and the full width at half maximum (FWHM). The X-ray density and the crystallite size were computed using these values” [19]. In a perfect spinel structure, oxygen anions are arranged in a cubic close-packed (CCP) arrangement of anions with an ideal u value of 0.25 Å [10]. The u value determines the regularity of the CCP. The oxygen anions in actual spinel ferrites, on the other hand, are displaced from their ideal CCP sites [23], resulting in a considerable divergence from the ideal CCP structure and, as a consequence, a change in the u value. The measured value of u is 0.2599 Å as shown in Table 1, which is in agreement with published values of 0.2564 Å for [10] and of 0.2605 Å for [20]. The measured lattice constant () of the prepared ferrite () is 8.3708 Å, which is slightly higher than the pure Cu ferrite value of 8.311 Å [24]. The slight increase in is due to the replacement of smaller Cu2+ (0.72 Å) ions with larger Co2+ (0.74 Å) ions.
The measured value of X-ray density ( ) is less than the published value of () for pure Cu ferrite [25]. The density is expected to decrease when 25% of the higher-weight Cu atoms are replaced by lower-weight Co atoms. Utilizing the Debye–Scherrer equation [18], the average crystallite size of the ferrite sample was calculated from the strongest peak (311) of the X-ray diffraction spectrum. The obtained value of D is 20 nm, as shown in Table 1. The prepared ferrite nanoparticles are less than 40 nm in size, suggesting that these nanoparticles belong to the single-domain regime.
3.2. TEM Analysis
Figure 2 shows the morphology and particle size distribution of the ferrite nanoparticles. Most of the particles in the TEM image, as seen in the figure, seem to be spherical, clearly demonstrating that the preparation method was successful in creating spherical nanoparticles. The approximate average particle size inferred from TEM observations (∼40 nm) is roughly double the crystallite size derived from XRD measurements (20 nm). A similar effect has been seen in other ferrite systems [18,19,26]. In principle, crystallite size and particle size are not the same thing, despite the fact that they are commonly used interchangeably. The width of XRD peaks is usually utilized to calculate crystallite size using the Debye–Scherrer formula. Aside from particle size, a few other factors influence XRD peak broadening, including inhomogeneous strain, imperfections, and instrumental broadening. This means that additional peak broadening from these other sources is always present. If all of these other sources are zero, the crystallite size predicted by Debye–Sherrer formula will be similar to the particle size measured by TEM. However, because most of these sources are typically unavoidable, the crystallite size measured by XRD should always be smaller than the particle size determined by TEM. In other words, crystallite size can be considered as a lower limit of particle size.
3.3. FT-IR Analysis
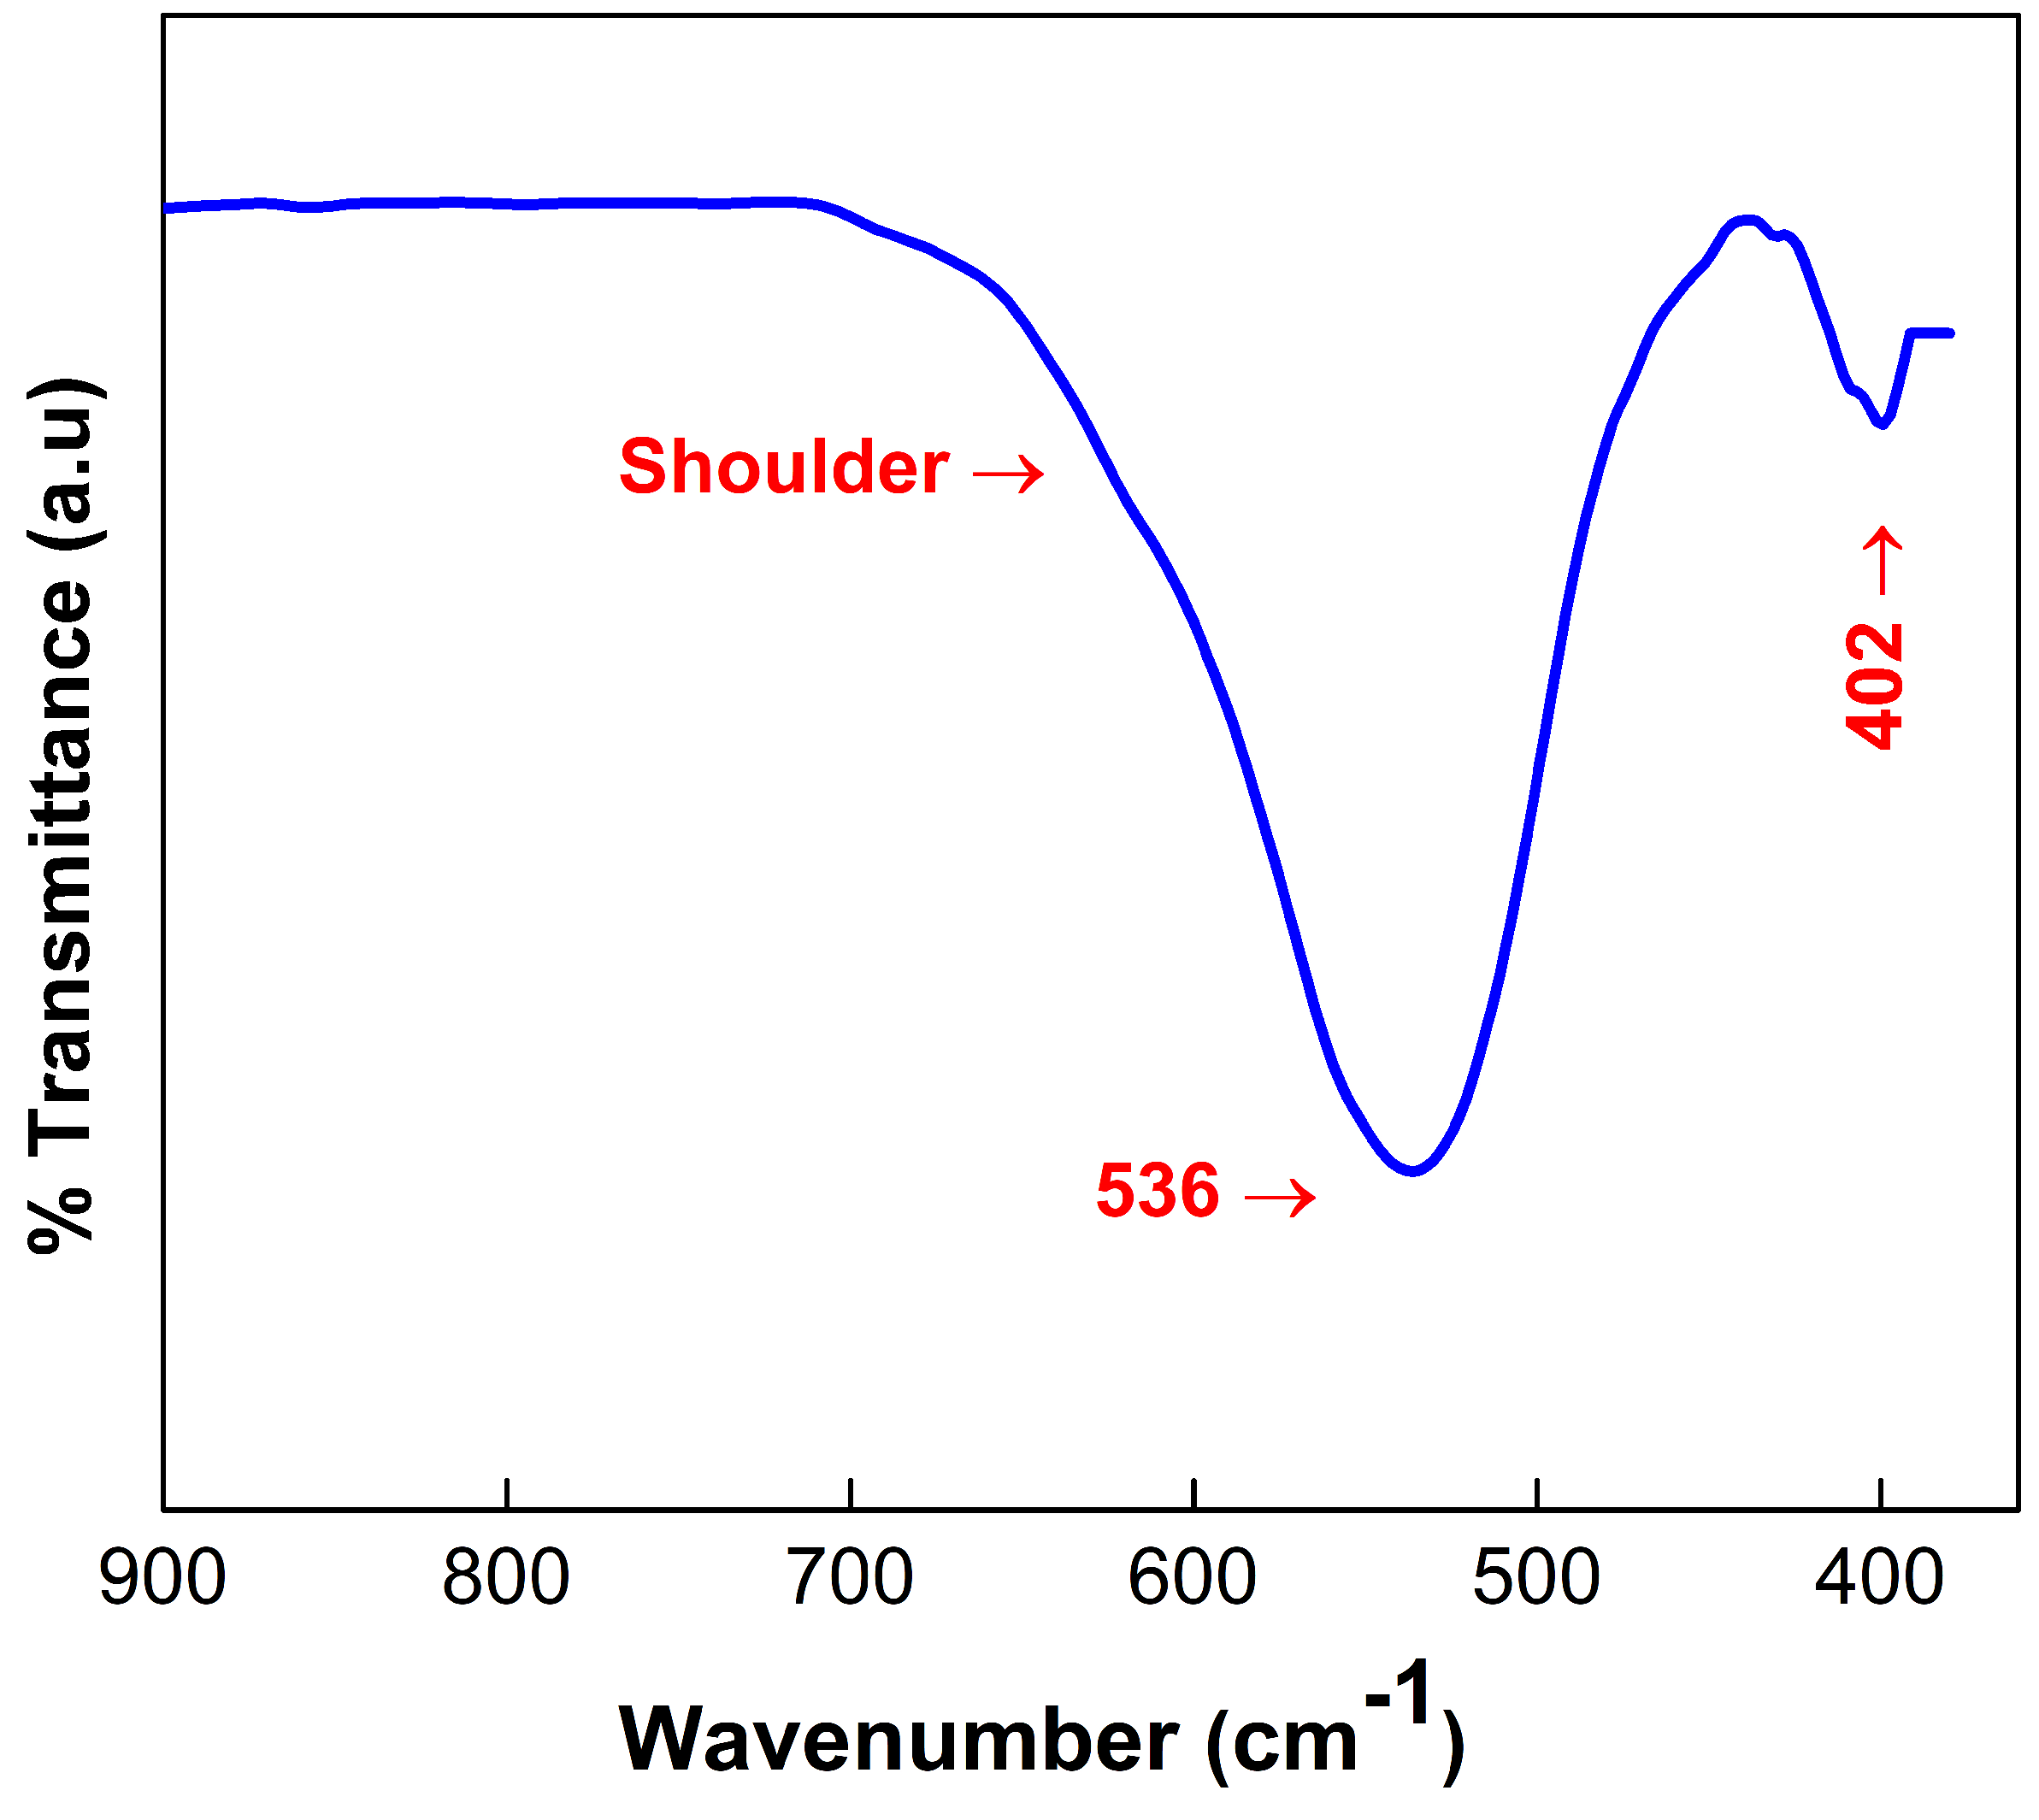
The recorded room temperature FT-IR spectrum of the ferrite nanoparticles measured between 370–900 is shown in Figure 3. “For spinel ferrites, four modes of vibration are expected to occur in the (650–550 cm), (525–390 cm), (380–335 cm) and (300–200 cm) regions” [18]. As shown in the figure, the two absorption bands detected at frequencies 536 and 402 represent stretching vibrations of the metal–oxygen (M–O) bond in tetrahedral and octahedral sites, respectively. The existence of these two bands confirms the creation of a spinel structure with two sub-lattices at tetrahedral and octahedral sites [17,18]. The broad and asymmetrical tetrahedral peak in the figure suggests that multiple cations frequently occupy the tetrahedral sites. Because of this, it is very likely that the ferrite nanoparticles produced may have mixed spinel-type structures. The and bands could not be detected since they were beyond the FT-IR machine’s measuring range.
3.4. Magnetic Properties
3.4.1. M vs. H Curves Analysis
Figure 4a shows the magnetization curves of the ferrite nanoparticles measured at various temperatures and with magnetic fields ranging from −25 to 25 kOe. The nanoparticles are ferrimagnetic over the whole temperature range, as seen in the figure. The hysteresis loop can be used to read the magnetic parameters such as saturation magnetization (), coercivity (), and remanent magnetization (). At RT, these values are 40.5 emu/g, 0.7 kOe, and 15.8 emu/g, respectively. In a 25 kOe applied field, the RT magnetization curve is found to be approximately saturated, while the 10 K magnetization curve is not. This can be explained by comparing thermal energy with the magnetic anisotropic energy barrier. At room temperature, thermal energy is close to the magnetic anisotropic energy barrier, so a small field will be sufficient to align all moments parallel to the applied field. However, at low temperatures, thermal energy is substantially less than the magnetic anisotropic energy barrier, and the moments of nanoparticles are trapped in the orientations of the closest easy axis, requiring a larger field to reach saturation.
Table 2 shows that both coercivity () and remanent magnetization () increase as temperature decreases, demonstrating a strong temperature dependence of the sample’s magnetic properties. The comparatively high value at room temperature (0.7 kOe) for the ferrite implies that the ferrite nanoparticles are single-domain. Kneller’s law describes how the coercivity of magnetic nanoparticles changes with temperature. This is given by [27]
where is the coercivity at T = 0 K, is the superparamagnetic blocking temperature of ferrite nanoparticles, and is the Kneller’s exponent. This law was derived in the temperature range , where the nanoparticles were assumed to be single-domain, noninteracting, and with uniaxial anisotropy. It was predicted that would be 0.5 for magnetic ferrites [27]. As illustrated in Figure 4b, the data are fitted to Kneller’s law with a fixed Kneller’s exponent (), leaving and to fit freely. The fit yielded values for and of 9.1 kOe and 376 K, respectively, with an adjusted R-square value of 0.96. It should be noted that the obtained value of K is considerably higher than room temperature. This value agrees with the results of the ZFC–FC measurements (which will be discussed further in the M vs. T section). The fit can be improved by making the Kneller’s exponent () a free-fitting parameter, as shown in Figure 4c. The refined , , and values are now 7.7 kOe, 328 K, and 0.8, respectively, with an adjusted R-square value of 0.98. The variation between the newly found value of () and the initially proposed value of Kneller’s exponent () can be associated with interactions between ferrite nanoparticles. The RT value of 15.8 emu/g agrees well with the previously published value of 15.1 emu/g for 21 nm ferrite nanoparticles synthesized by coprecipitation method and sintered at 700 [24].
3.4.2. Law of Approach to Saturation
Figure 4a shows that a strong field of 25 kOe was insufficient to fully saturate magnetization. As a result, the saturation magnetization () and the first anisotropy constant () were obtained using the law of approach to saturation (LA). This approach is typically good for describing magnetization near saturation and is valid at fields much higher than the coercive field () [18]. The magnetization (M) near the saturation is determined by [18]:
where , is the saturation magnetization, H is the applied field, is free-space magnetic permeability, and is the first anisotropy constant (also known as the cubic anisotropy constant). The last term, , is often referred to as a paramagnetism-like term [28]. This term was observed to be necessary in order to fit the data obtained. Figure 5 depicts the room temperature magnetization data for the ferrite nanoparticles as well as the corresponding LA fit. The fit was constrained to magnetization data with a range of 10 to 25 kOe because the LA model well describes magnetization accurately at high fields. The measured values of and are shown in Table 2. The obtained value of 40.5 emu/g appears to agree with the previously published value of 47.2 emu/g for the ferrite nanoparticles made by precipitation method and sintered at 800 C for 10 h [24]. The obtained value of is observed to be less than that of our previously reported value of for pure ferrite prepared under similar circumstances [10], suggesting that copper-doping reduces magnetic anisotropy. This is expected due to the lower value of magnetic moment of Cu2+ (1) as compared to Co2+ (3).
3.4.3. M vs. T Analysis
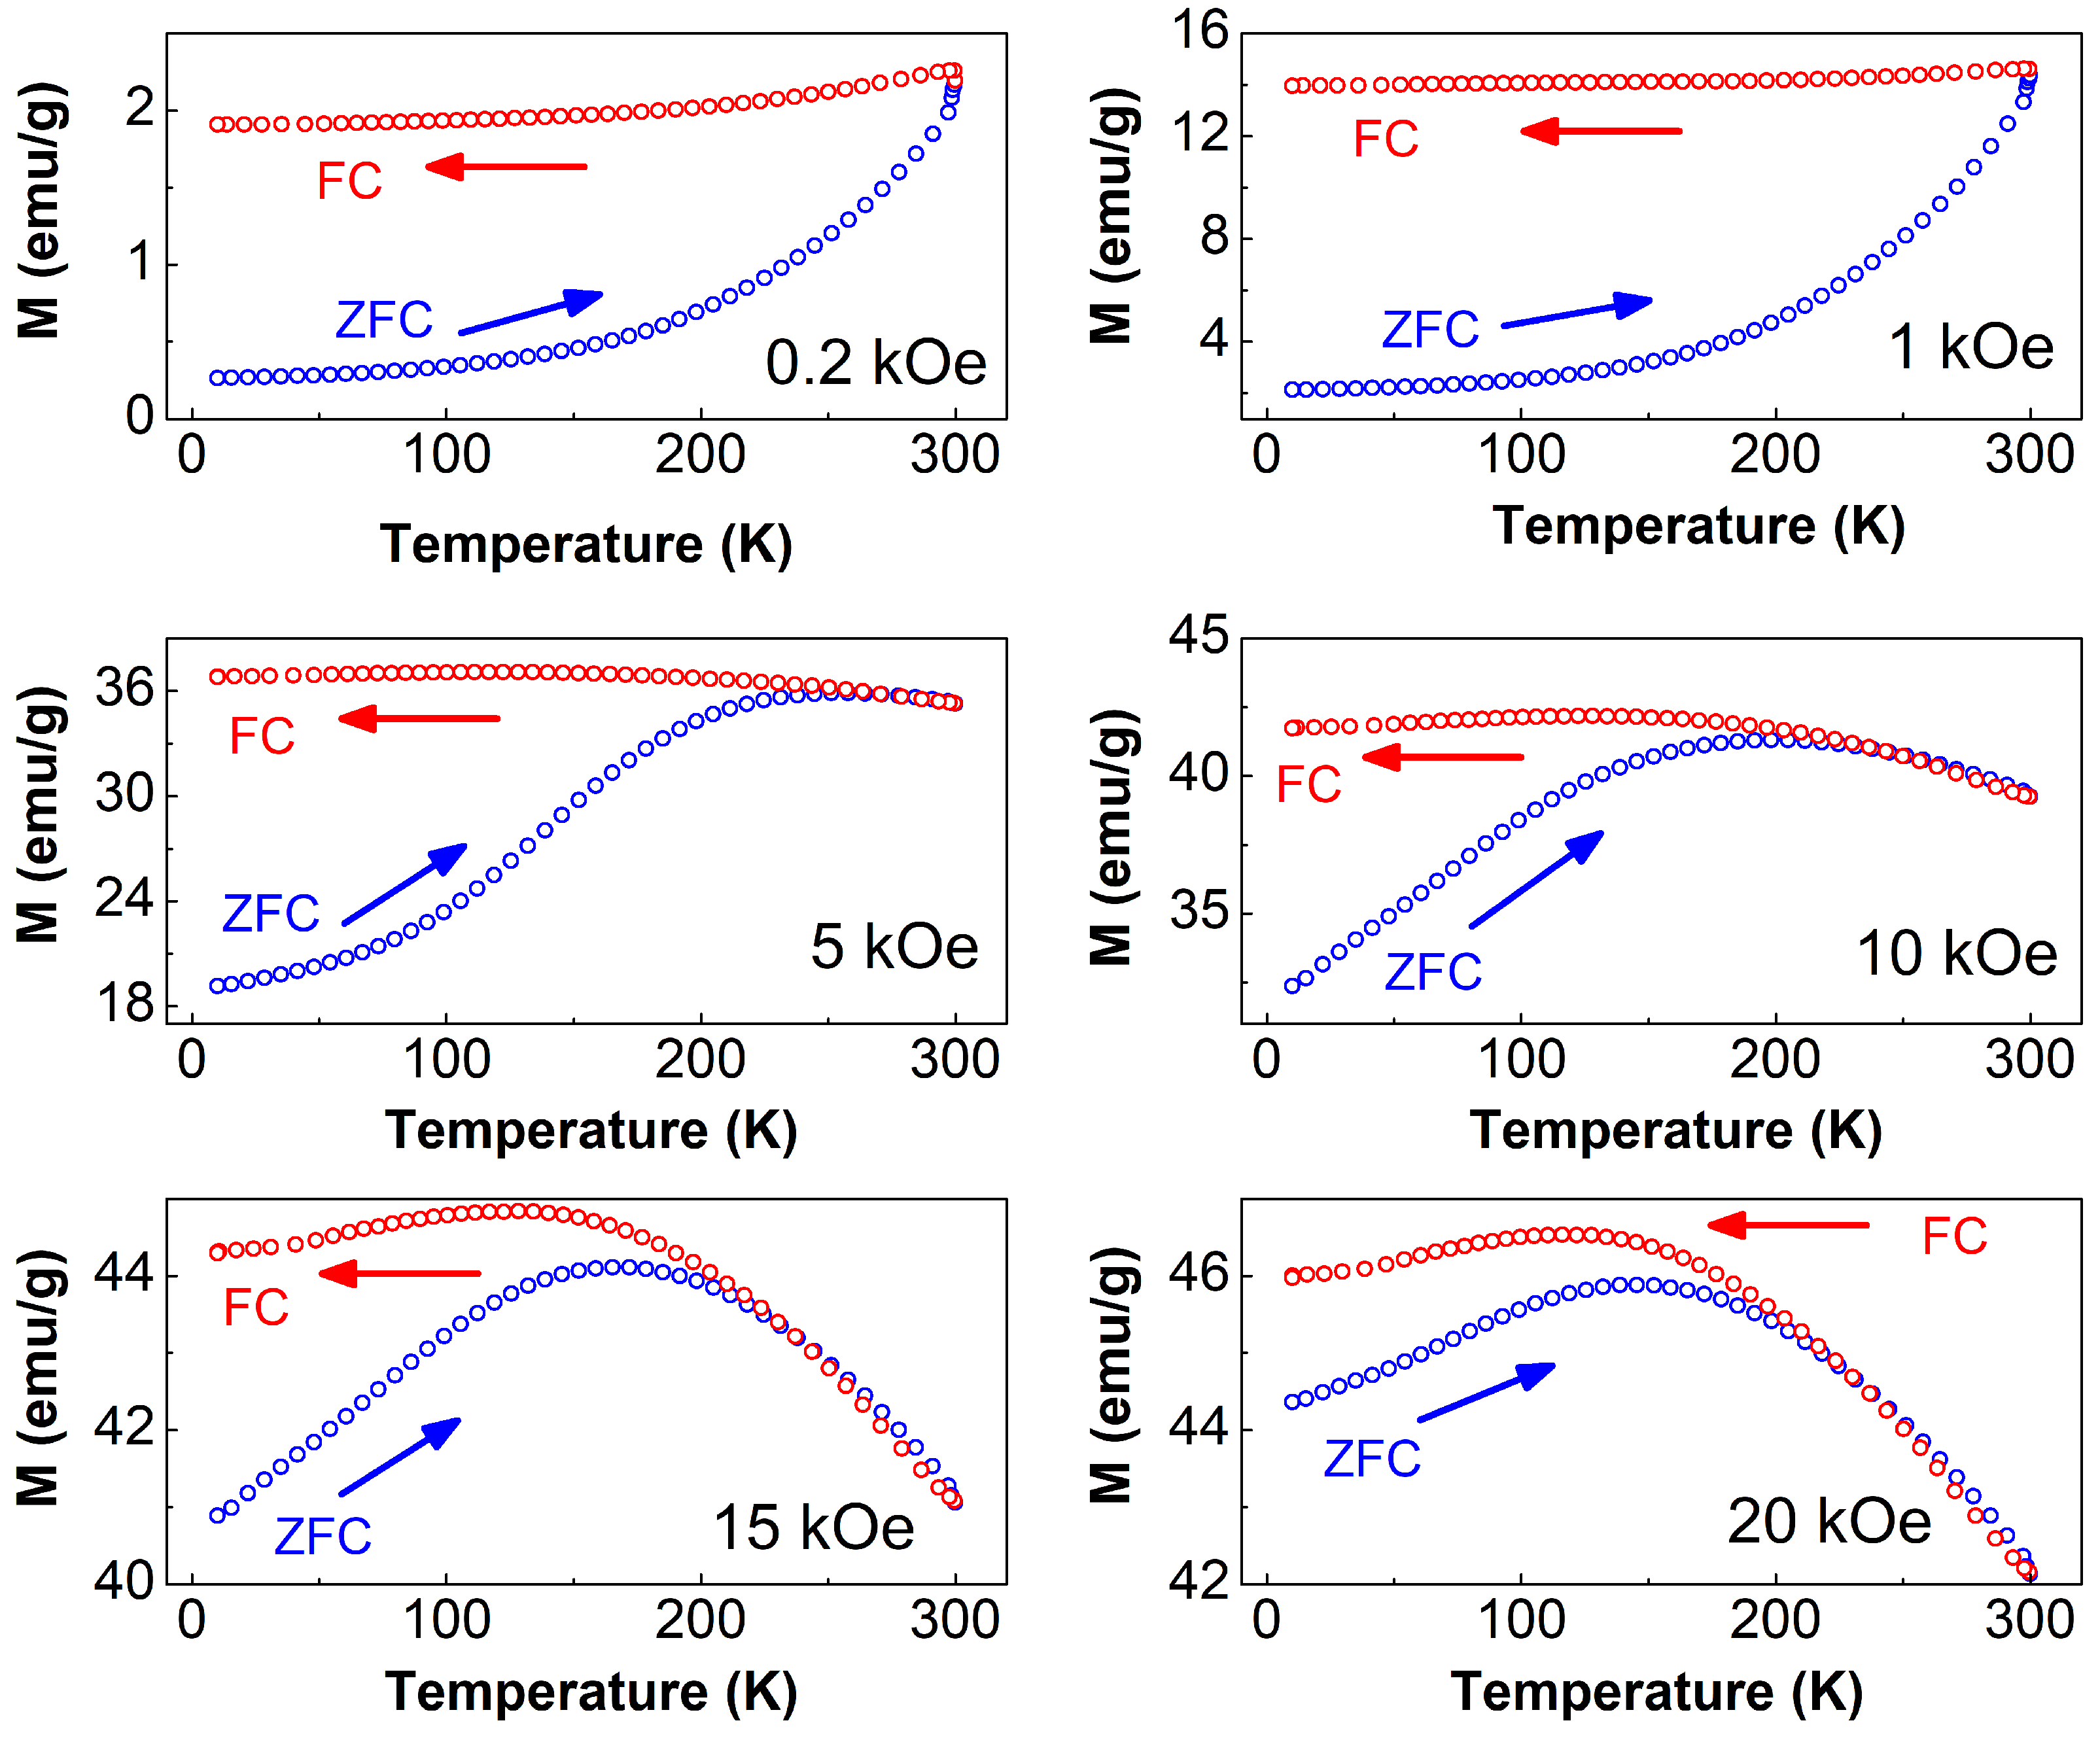
The temperature dependences of the zero-field cooling (ZFC) and the field cooling (FC) magnetization curves were measured in order to gain a better understanding of the magnetic behavior of the prepared ferrite nanoparticles. Figure 6 shows the magnetization response to temperature of the ferrite nanoparticles recorded at various applied magnetic fields. The ZFC–FC magnetization measurements were carried out using the method outlined in our earlier article [10]. The most intriguing feature of the ZFC–FC curves is the blocking temperature (), which is the temperature at which the ZFC curve achieves maximum magnetization. The lack of a peak in the ZFC curve for fields less than 1 kOe demonstrates that the nanoparticles are ferrimagnetic throughout the whole temperature range and that the synthesized nanoparticles exist in a blocked state with a blocking temperature () that is clearly higher than room temperature. This is in agreement with the corresponding hysteresis loops obtained at 300 K and below, as shown in Figure 4a. The ZFC magnetization curve begins to exhibit a broad peak under fields higher than 1 kOe and at temperatures below 300 K, indicating that stronger fields lower the blocking temperature (). This peak is a sign of a superparamagnetic transition. In other words, the prepared ferrite nanoparticles are ferrimagnetic at room temperature and fields less than 1 kOe, but superparamagnetic at higher magnetic fields. The FC curves, on the other hand, are nearly flat below , indicating spin-glass behavior. This might be attributed to magnetic interactions between ferrimagnetic nanoparticles [18,29] and/or surface effects. Surface atoms have a lower coordination number than atoms in the core of the nanoparticle, resulting in surface effects such as spin canting and spin disorder [19,30]. For magnetic ferrites, the origin of disordered surface spins is attributed to dangling bonds and high surface anisotropy.
4. Conclusions
The hydrothermal approach was utilized to produce single-domain ferrite nanoparticles. The average crystallite size of the generated nanoparticles was around 20 nm. The effect of partial Co-doping on the structural and magnetic properties of copper ferrite was investigated. The prepared ferrite nanoparticles were found to be in a single structural phase with a spinel-type structure, according to the XRD and FT-IR measurements. The introduction of Co into copper ferrite increases the lattice constant and decreases the density as compared with pure Cu ferrite. The magnetic measurements revealed that across the entire temperature range, the ferrite nanoparticles were in a single ferrimagnetic phase. It was found that as temperature is reduced, coercivity and remanent magnetization increase. Magnetic anisotropy was found to increase with Co-doping when compared to pure Cu ferrite. According to the ZFC–FC curves, the blocking temperature () is above room temperature, proving that the ferrite nanoparticles are ferrimagnetic at room temperature and below. Furthermore, it was found that increasing the magnetic field reduces . The flatness of the FC curves below suggests that these ferrite nanoparticles exhibit spin-glass behavior, which could be attributed to nanoparticle interactions and/or surface effects. Understanding the origins and mechanisms of ferrimagnetism in these single-domain nanoparticles, I believe, will have a considerable influence on their utilization in a variety of applications.
Funding
This research received no external funding.
Institutional Review Board Statement
Not applicable.
Informed Consent Statement
Not applicable.
Data Availability Statement
The data used to support the findings of this study are included within the article.
Conflicts of Interest
The author declares that he has no conflict of interest.
References
- Pirhashemi, M.; Habibi-Yangjeh, A.; Pouran, S.R. Review on the criteria anticipated for the fabrication of highly efficient ZnO-based visible-light-driven photocatalysts. J. Ind. Eng. Chem. 2018, 62, 1–25. [Google Scholar] [CrossRef]
- Masunga, N.; Mmelesi, O.K.; Kefeni, K.K.; Mamba, B.B. Recent advances in copper ferrite nanoparticles and nanocomposites synthesis, magnetic properties and application in water treatment. J. Environ. Chem. Eng. 2019, 7, 103179. [Google Scholar] [CrossRef]
- Wang, J.; Deng, Q.; Li, M.; Jiang, K.; Zhang, J.; Hu, Z.; Chu, J. Copper ferrites@ reduced graphene oxide anode materials for advanced lithium storage applications. Sci. Rep. 2017, 7, 8903. [Google Scholar] [CrossRef] [PubMed] [Green Version]
- Ponhan, W.; Maensiri, S. Fabrication and magnetic properties of electrospun copper ferrite (CuFe2O4) nanofibers. Solid State Sci. 2009, 11, 479–484. [Google Scholar] [CrossRef]
- Nikolić, V.N.; Vasić, M.; Milić, M.M. Observation of low-and high-temperature CuFe2O4 phase at 1100 °C: The influence of Fe3+ ions on CuFe2O4 structural transformation. Ceram. Int. 2018, 44, 21145–21152. [Google Scholar] [CrossRef]
- Desai, M.; Prasad, S.; Venkataramani, N.; Samajdar, I.; Nigam, A.; Krishnan, R. Annealing induced structural change in sputter deposited copper ferrite thin films and its impact on magnetic properties. J. Appl. Phys. 2002, 91, 2220–2227. [Google Scholar] [CrossRef] [Green Version]
- Hammad, T.M.; Kuhn, S.; Amsha, A.A.; Hempelmann, R. Investigation of structural, optical, and magnetic properties of Co2+ ions substituted CuFe2O4 spinel ferrite nanoparticles prepared via precipitation approach. J. Aust. Ceram. Soc. 2021, 57, 543–553. [Google Scholar] [CrossRef]
- Alzoubi, G.M. Observation of Spin-Glass-like Behavior over a Wide Temperature Range in Single-Domain Nickel-Substituted Cobalt Ferrite Nanoparticles. Nanomaterials 2022, 12, 1113. [Google Scholar] [CrossRef]
- Hashim, M.; Shirsath, S.E.; Meena, S.; Kotnala, R.; Kumar, S.; Bhatt, P.; Jotania, R.; Kumar, R. Study of structural and magnetic properties of (Co–Cu) Fe2O4/PANI composites. Mater. Chem. Phys. 2013, 141, 406–415. [Google Scholar] [CrossRef]
- Alzoubi, G.M.; Albiss, B.; Shatnawi, M.; Bsoul, I.; Alsmadi, A.; Salameh, B.; Alna’washi, G. Influence of High-Temperature Annealing on Structural and Magnetic Properties of Crystalline Cobalt Ferrite Nanoparticles in the Single-Domain Regime. J. Supercond. Nov. Magn. 2020, 33, 3179–3188. [Google Scholar] [CrossRef]
- Kumar, N.; Singh, D.; Nigam, A.; Rajpoot, O.; Yadav, M.; Singh, Y.P.; Prakash, P.S.; Singh, S. Structural and magnetic properties of zinc doped copper ferrite synthesized by sol-gel and hydrothermal route. Mater. Phys. Mech. 2021, 47, 306–314. [Google Scholar]
- Hammad, T.M.; Salem, J.K.; Amsha, A.A.; Hejazy, N.K. Optical and magnetic characterizations of zinc substituted copper ferrite synthesized by a co-precipitation chemical method. J. Alloys Compd. 2018, 741, 123–130. [Google Scholar] [CrossRef]
- Sang, C.; Jin, S.; Li, G.; Luo, Y. Preparation of copper ferrite by sol–gel method and the synergistic catalytic for the thermal decomposition of ammonium perchlorate. J. Sol-Gel Sci. Technol. 2021, 98, 559–567. [Google Scholar] [CrossRef]
- Surashe, V.; Waghule, N.; Raut, A.; Pandit, A.; Dorik, R.; Jadhav, K. Ceramic synthesis and X-ray diffraction characterization of copper ferrite. AIP Conf. Proc. 2021, 2369, 020209. [Google Scholar]
- Rajini, R.; Ferdinand, A.C. Structural, morphological and magnetic properties of (c-ZnFe2O4 and t-CuFe2O4) ferrite nanoparticle synthesized by reactive ball milling. Chem. Data Collect. 2022, 38, 100825. [Google Scholar] [CrossRef]
- Mathew, D.S.; Juang, R.S. An overview of the structure and magnetism of spinel ferrite nanoparticles and their synthesis in microemulsions. Chem. Eng. J. 2007, 129, 51–65. [Google Scholar] [CrossRef]
- Dippong, T.; Levei, E.A.; Deac, I.G.; Neag, E.; Cadar, O. Influence of Cu2+, Ni2+, and Zn2+ Ions Doping on the Structure, Morphology, and Magnetic Properties of Co-Ferrite Embedded in SiO2 Matrix Obtained by an Innovative Sol-Gel Route. Nanomaterials 2020, 10, 580. [Google Scholar] [CrossRef] [PubMed] [Green Version]
- Alzoubi, G.M.; Alsmadi, A.; Alna’washi, G.; Salameh, B.; Shatnawi, M.; Alnemrat, S.; Albiss, B.; Bsoul, I. Coexistence of superparamagnetism and spin-glass like behavior in zinc-substituted cobalt ferrite nanoparticles. Appl. Phys. A 2020, 126, 512. [Google Scholar] [CrossRef]
- Alzoubi, G.M. Probing the structural and magnetic properties of small crystalline nickel ferrite nanoparticles near the upper size limit of the single-domain regime. Adv. Appl. Ceram. 2020, 119, 224–232. [Google Scholar] [CrossRef]
- Chatterjee, B.K.; Bhattacharjee, K.; Dey, A.; Ghosh, C.K.; Chattopadhyay, K.K. Influence of spherical assembly of copper ferrite nanoparticles on magnetic properties: Orientation of magnetic easy axis. Dalton Trans. 2014, 43, 7930–7944. [Google Scholar] [CrossRef] [PubMed]
- Djerdj, I. Rietveld Refinement in the Characterization of Crystalline Materials; MDPI: Basel, Switzerland, 2019. [Google Scholar]
- Young, R.A. The Rietveld Method; International Union of Crystallography: Chester, UK, 1993; Volume 5. [Google Scholar]
- Sickafus, K.E.; Hughes, R. Spinel compounds: Structure and property relations. J. Am. Ceram. Soc. 1999, 82, 3277–3278. [Google Scholar]
- Samavati, A.; Mustafa, M.; Ismail, A.; Othman, M.; Rahman, M. Copper-substituted cobalt ferrite nanoparticles: Structural, optical and antibacterial properties. Mater. Express 2016, 6, 473–482. [Google Scholar] [CrossRef]
- Mahmood, N.B.; Saeed, F.R.; Gbashi, K.R.; Hamodi, A.; Jaffar, Z.M. Structural properties of CoxCu1- xFe2O4 solid solution. J. Mech. Behav. Mater. 2021, 30, 220–227. [Google Scholar] [CrossRef]
- Nikam, D.S.; Jadhav, S.V.; Khot, V.M.; Bohara, R.; Hong, C.K.; Mali, S.S.; Pawar, S. Cation distribution, structural, morphological and magnetic properties of Co1- xZnxFe2O4 (x = 0–1) nanoparticles. RSC Adv. 2015, 5, 2338–2345. [Google Scholar] [CrossRef]
- Nayek, C.; Manna, K.; Bhattacharjee, G.; Murugavel, P.; Obaidat, I. Investigating size-and temperature-dependent coercivity and saturation magnetization in PEG coated Fe3O4 nanoparticles. Magnetochemistry 2017, 3, 19. [Google Scholar] [CrossRef] [Green Version]
- Zhang, H.; Zeng, D.; Liu, Z. The law of approach to saturation in ferromagnets originating from the magnetocrystalline anisotropy. J. Magn. Magn. Mater. 2010, 322, 2375–2380. [Google Scholar] [CrossRef]
- Nairan, A.; Khan, M.; Khan, U.; Iqbal, M.; Riaz, S.; Naseem, S. Temperature-dependent magnetic response of antiferromagnetic doping in cobalt ferrite nanostructures. Nanomaterials 2016, 6, 73. [Google Scholar] [CrossRef] [PubMed] [Green Version]
- Nadeem, K.; Krenn, H.; Traußnig, T.; Würschum, R.; Szabó, D.; Letofsky-Papst, I. Effect of dipolar and exchange interactions on magnetic blocking of maghemite nanoparticles. J. Magn. Magn. Mater. 2011, 323, 1998–2004. [Google Scholar] [CrossRef]
Figure 1.
XRD pattern as well as Rietveld refinement of the ferrite nanoparticles. The experimental data are represented by black circles, the calculated data by a red line, and the difference between the two by a blue line. Bragg positions are represented by black vertical bars. The star at might be the result of a trace amount of unknown contaminants.
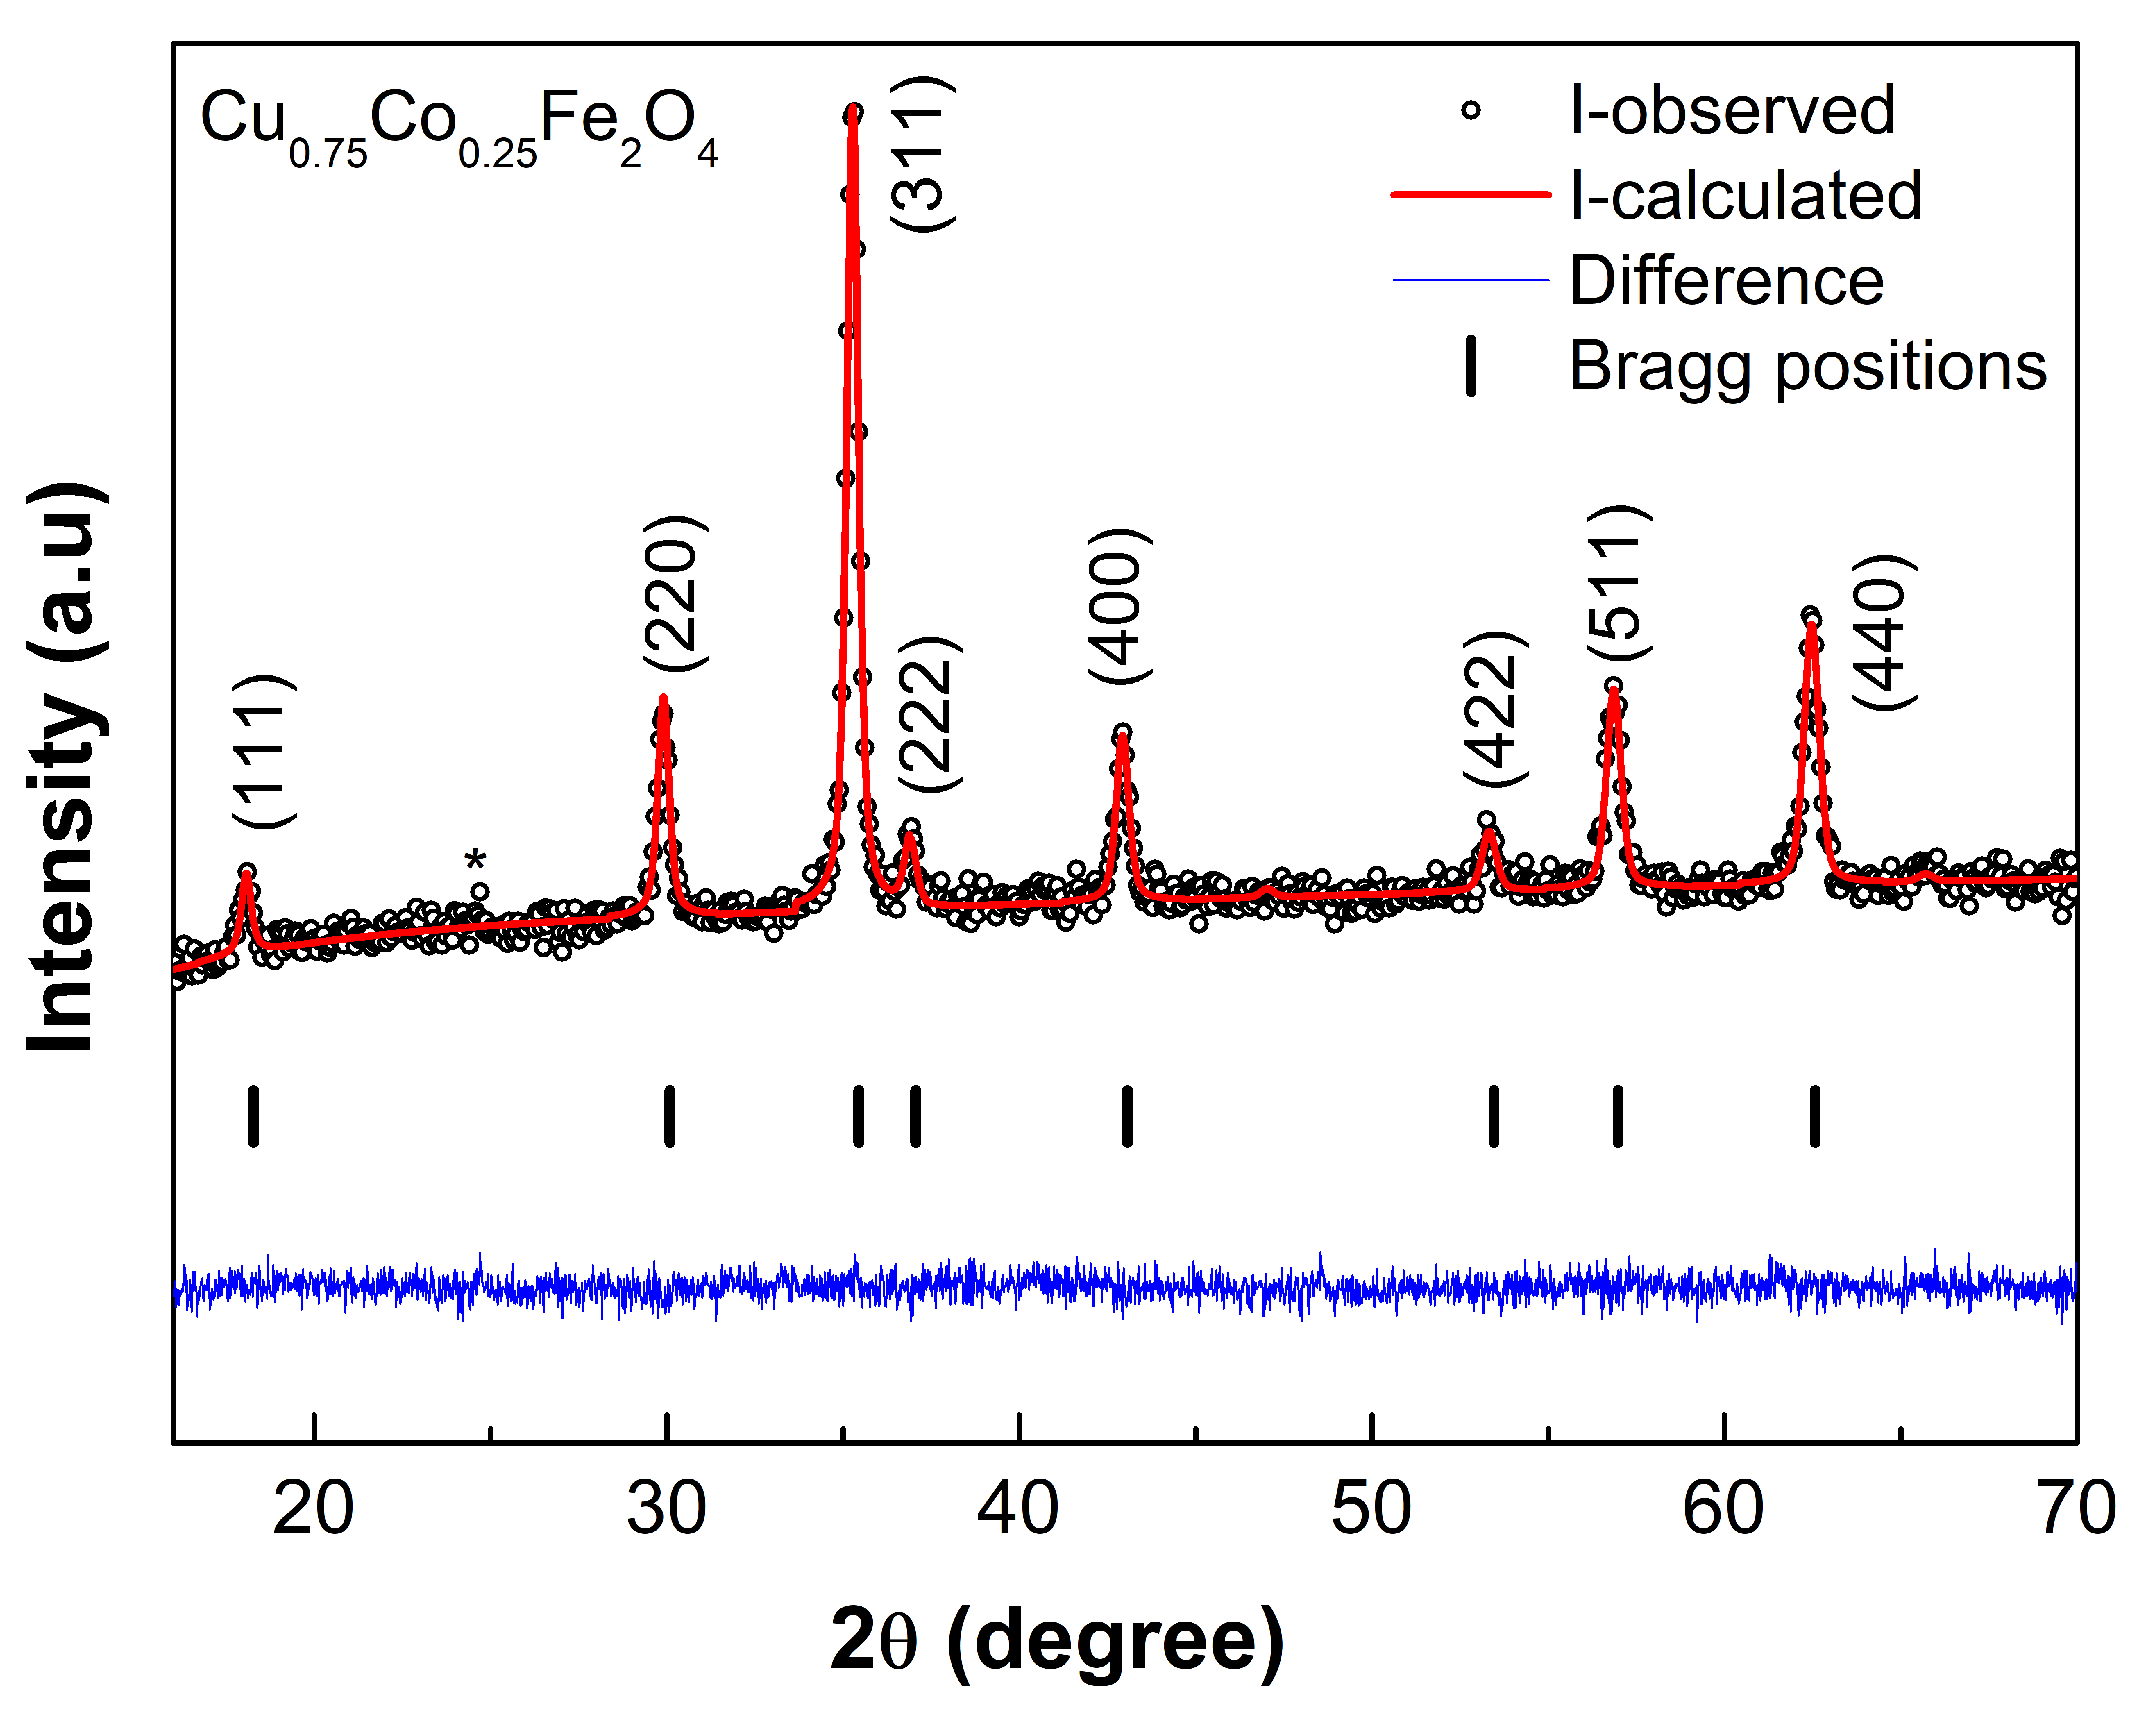
Figure 2.
TEM image and particle size distribution histogram for the nanoparticles.
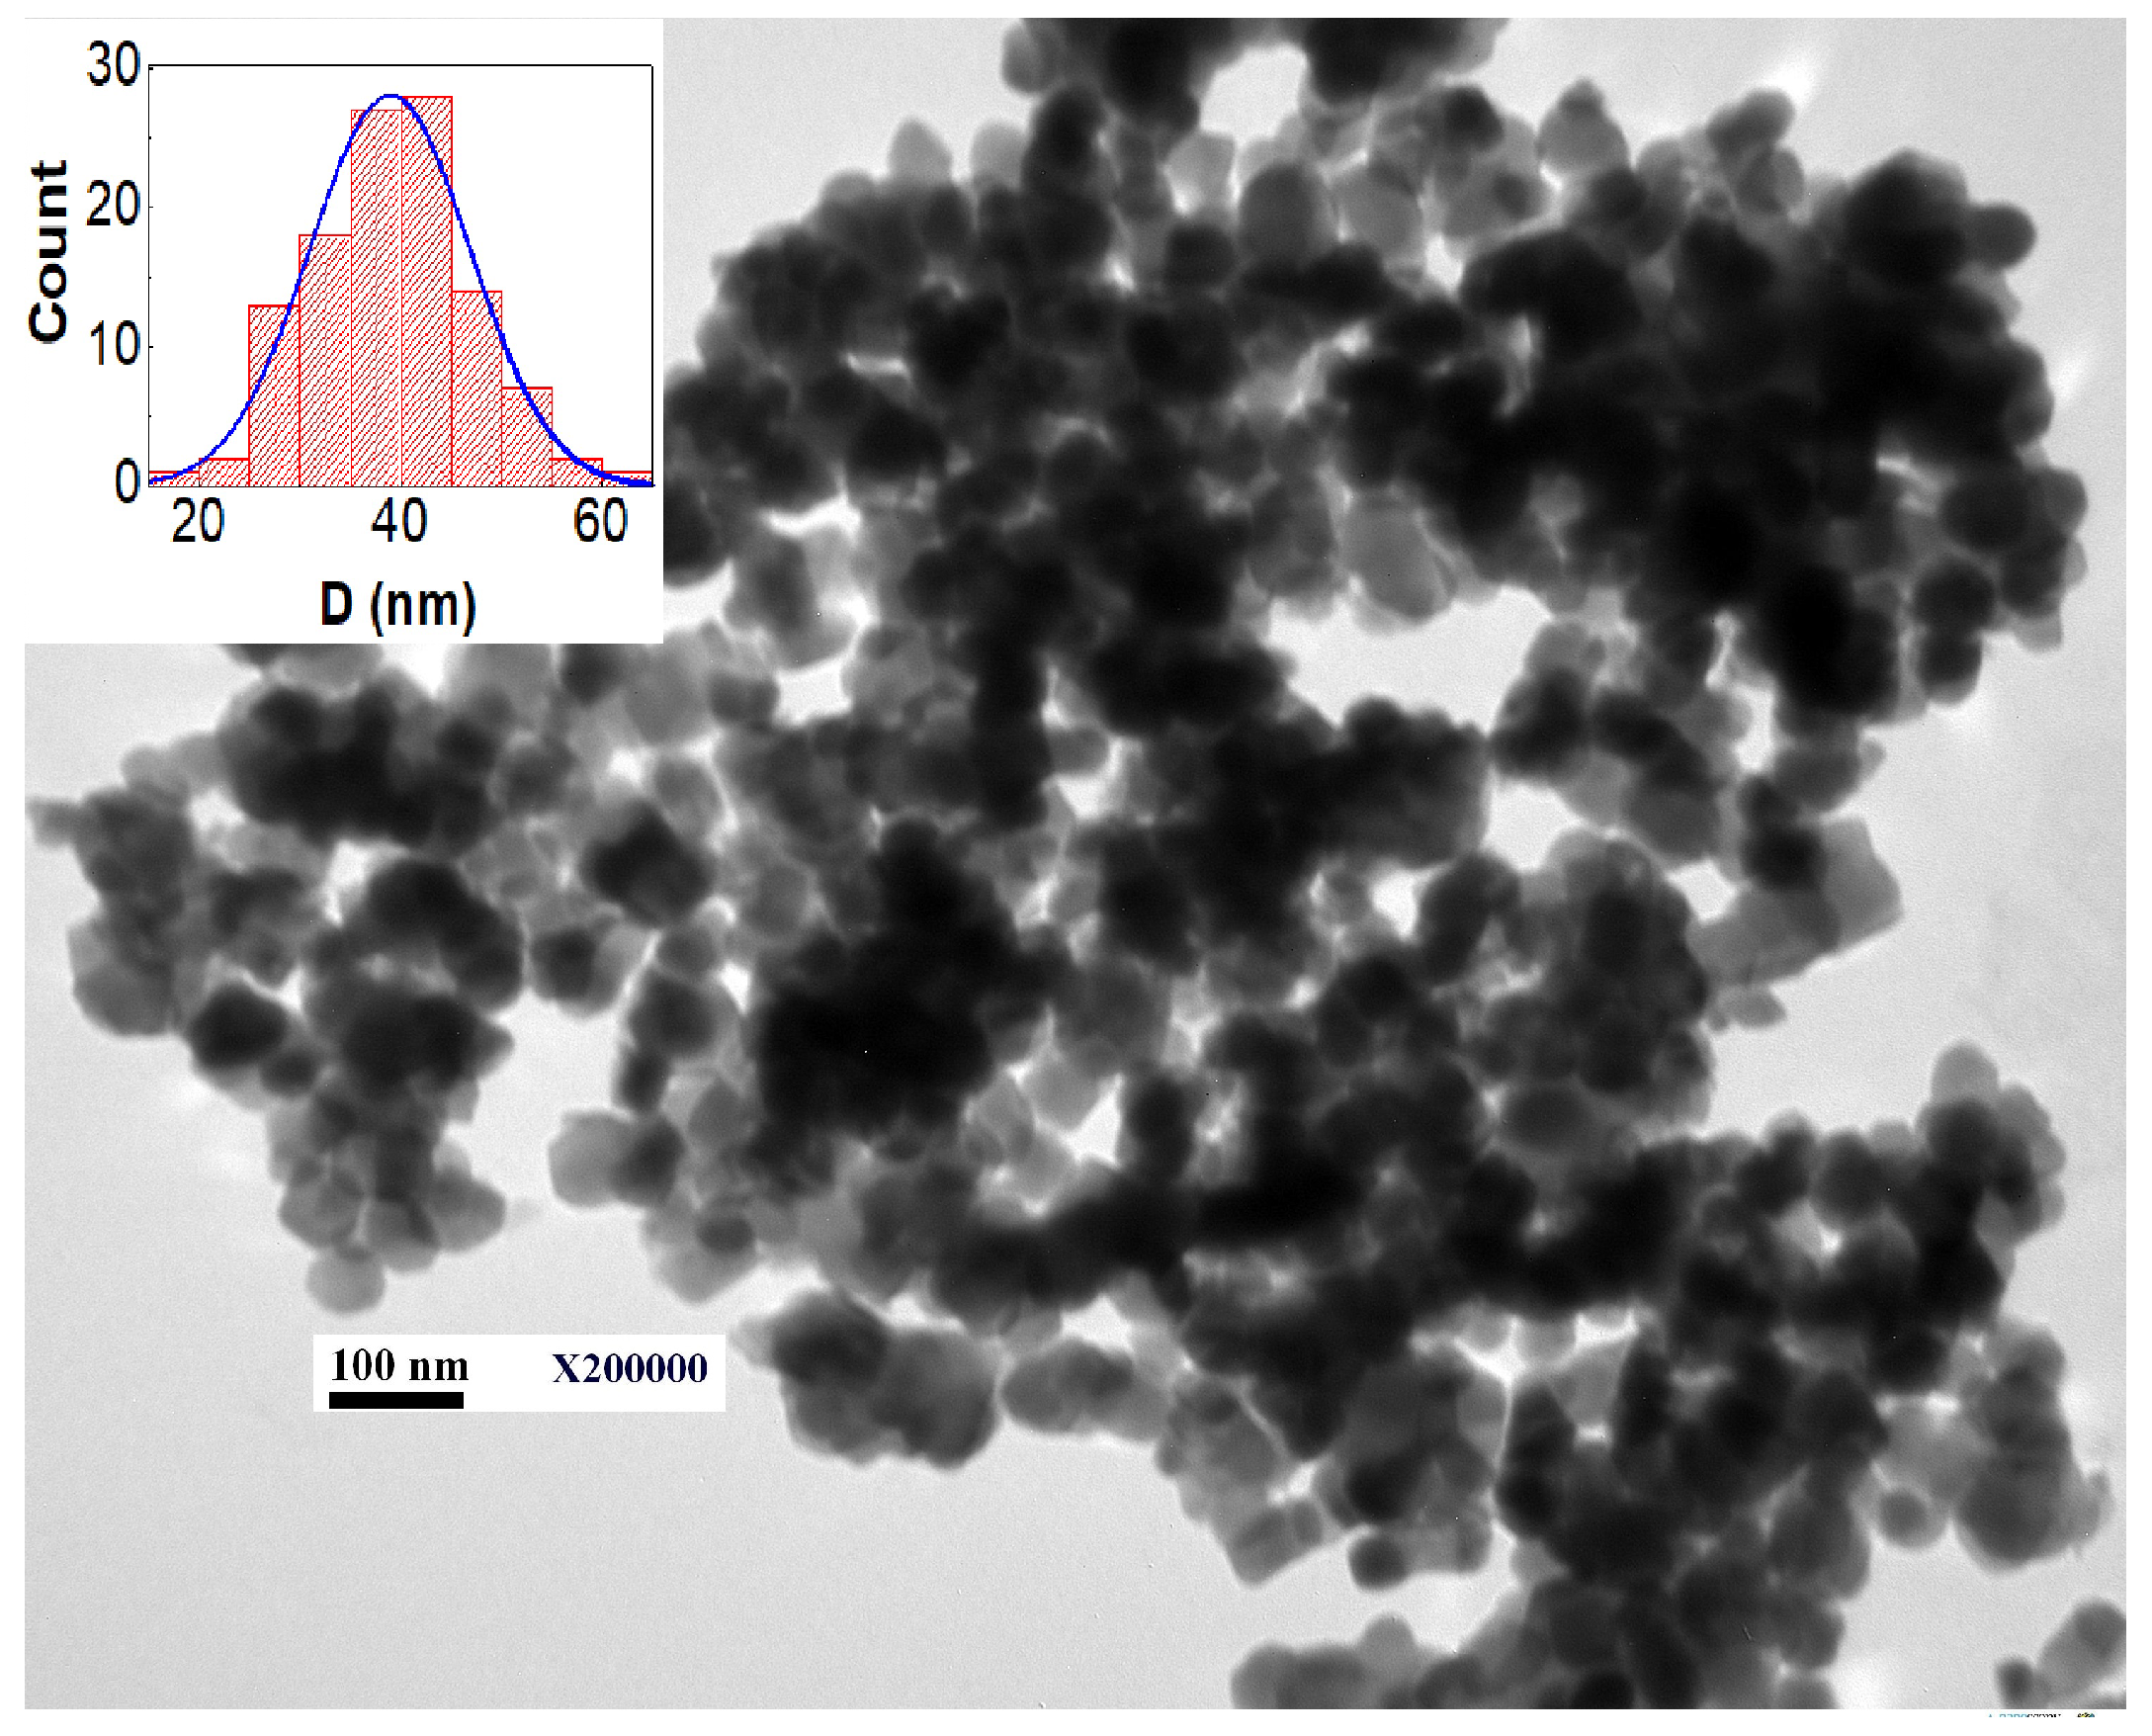
Figure 3.
FT-IR absorption spectrum for the ferrite nanoparticles recorded at RT and in the range of 370–900 cm.
Figure 3.
FT-IR absorption spectrum for the ferrite nanoparticles recorded at RT and in the range of 370–900 cm.
Figure 4.
(a) Magnetization curves of the ferrite nanoparticles recorded at different temperatures. (b) “ data fitted to the original Kneller’s law with a fixed Kneller’s exponent (). (c) data fitted to the modified Kneller’s law with a free Kneller’s exponent ()”.
Figure 4.
(a) Magnetization curves of the ferrite nanoparticles recorded at different temperatures. (b) “ data fitted to the original Kneller’s law with a fixed Kneller’s exponent (). (c) data fitted to the modified Kneller’s law with a free Kneller’s exponent ()”.
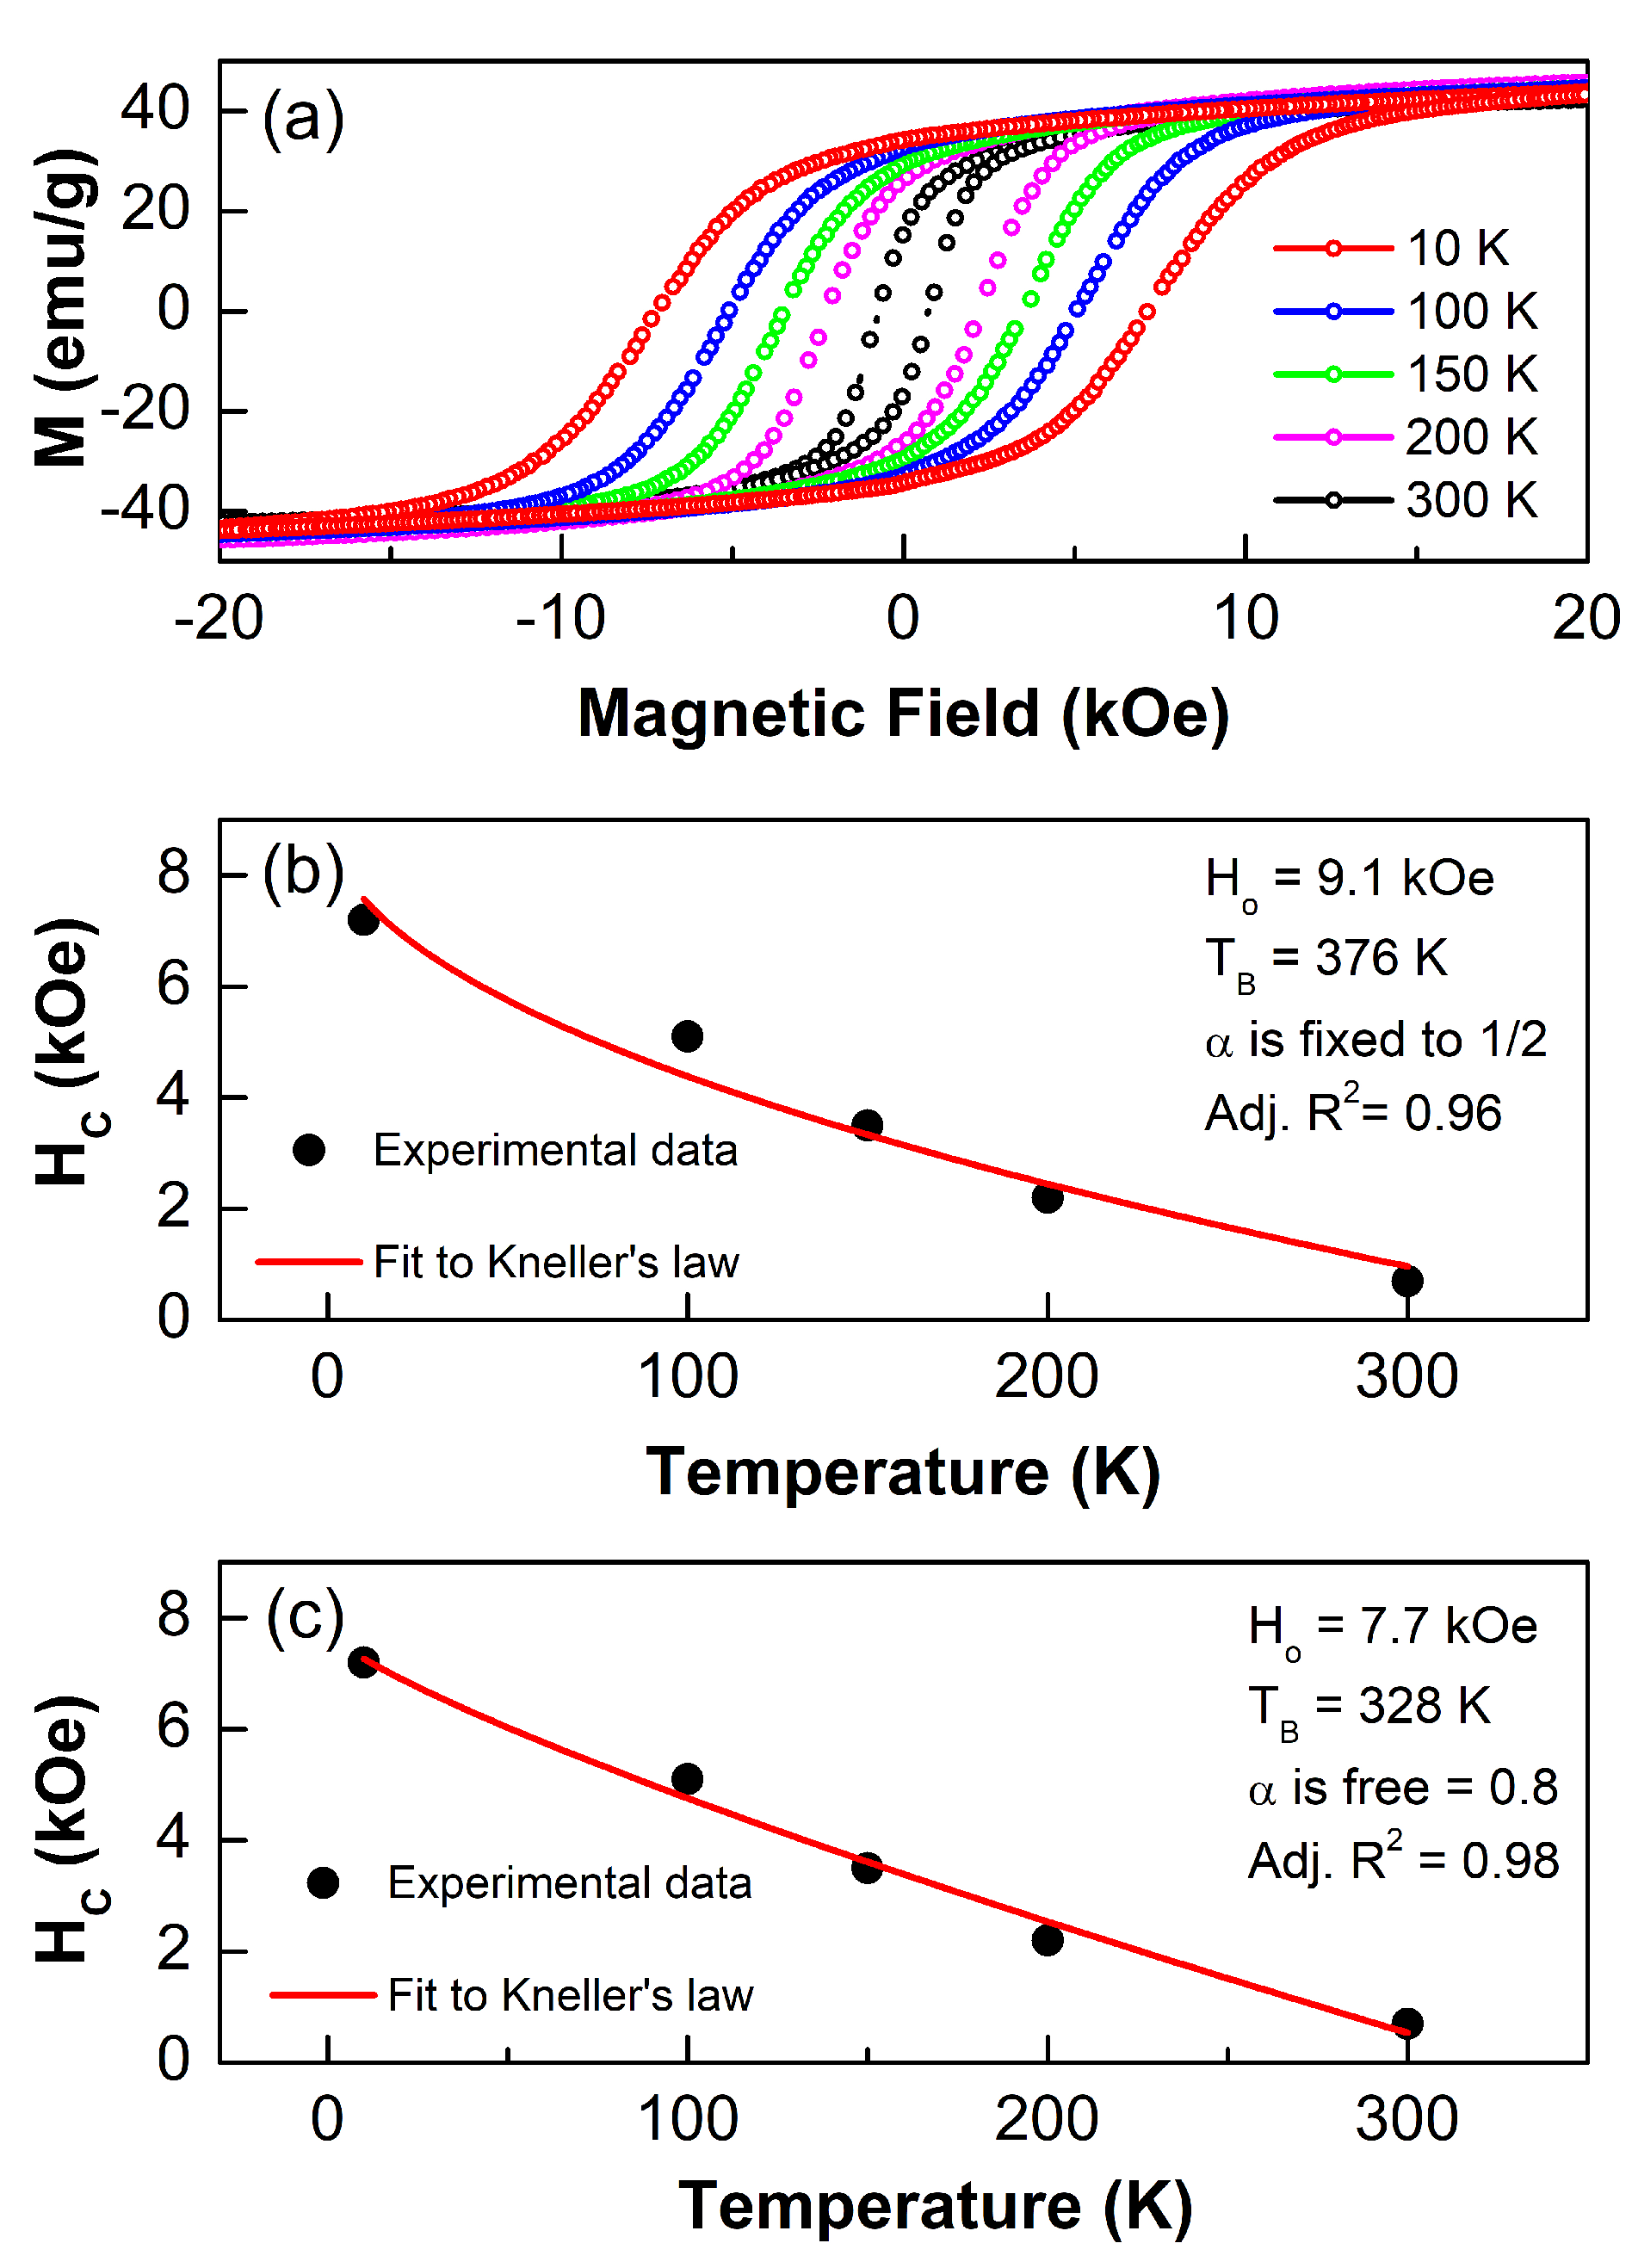
Figure 5.
The magnetization curve (positive branch) at RT for the ferrite nanoparticles fitted to the LA model.
Figure 5.
The magnetization curve (positive branch) at RT for the ferrite nanoparticles fitted to the LA model.
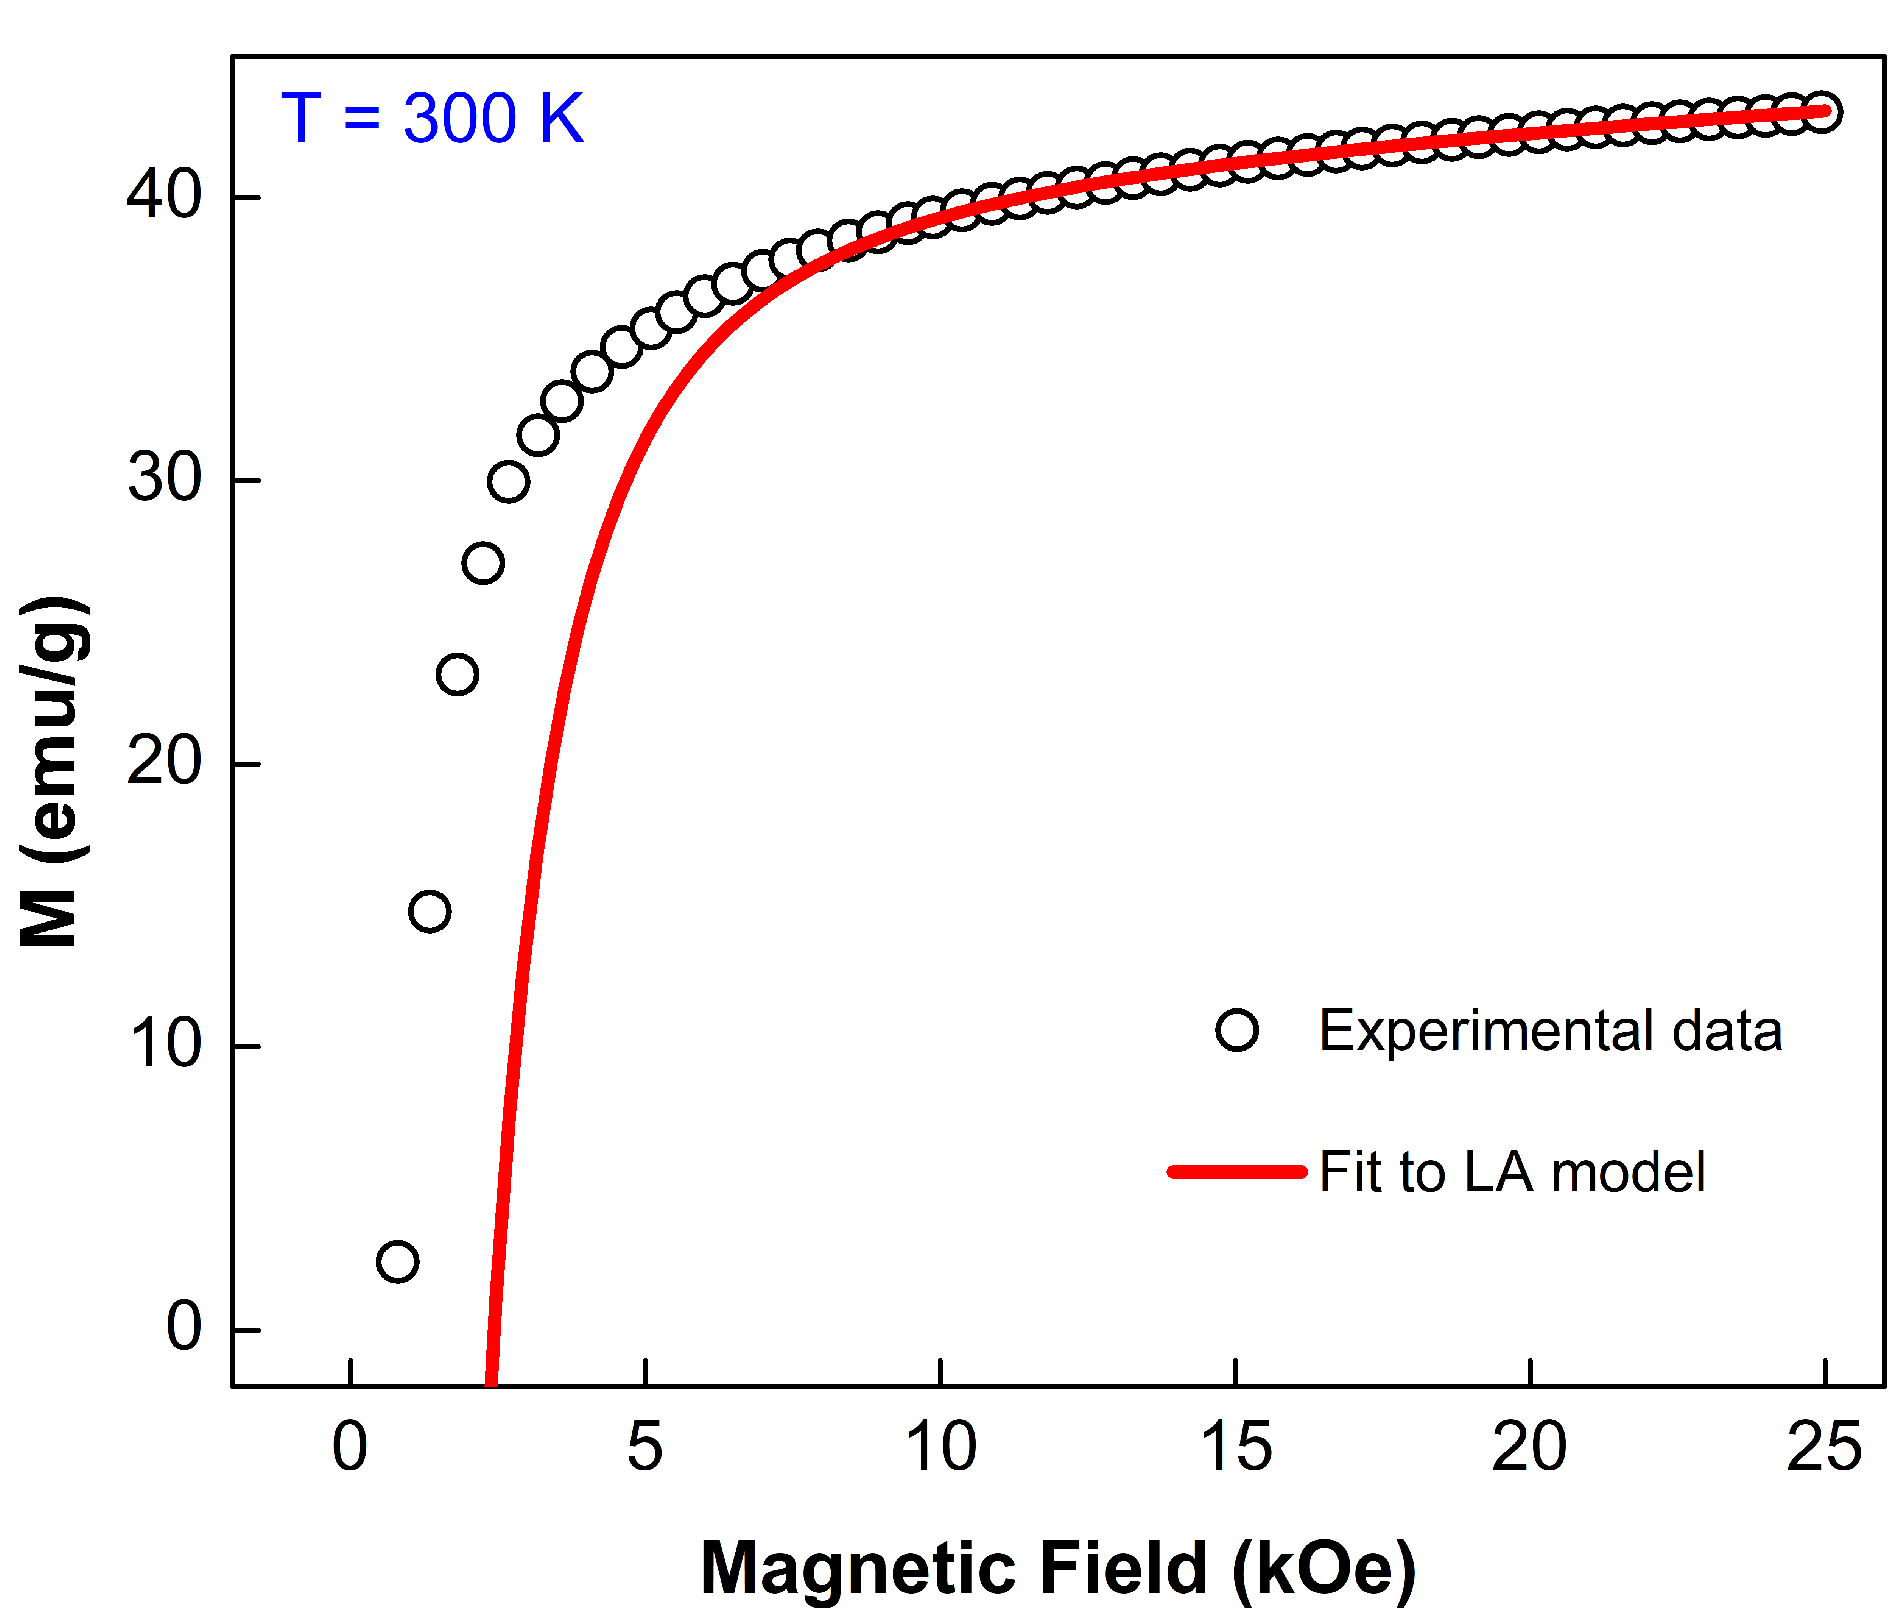
Figure 6.
ZFC–FC magnetization curves of the nanoparticles recorded at different applied magnetic fields.
Figure 6.
ZFC–FC magnetization curves of the nanoparticles recorded at different applied magnetic fields.

Table 1.
Structural parameters for ferrite nanoparticles. The parameters are described in the text.
| Quantity | Refined Value |
|---|---|
| D(nm) | 20 |
| 5.39 | |
| R-factors (%) | |
| 1.4755 | |
| 1.5232 | |
| () | 1.06 |
| Cell parameters (Å) | |
| 8.3708 | |
| u | 0.2599 |
Table 2.
Magnetic parameters for the ferrite nanoparticles measured at various temperatures. The description of the parameters is given in the text.
Table 2.
Magnetic parameters for the ferrite nanoparticles measured at various temperatures. The description of the parameters is given in the text.
| Temperature | ||||
|---|---|---|---|---|
| (K) | (emu/g) | (kOe) | (emu/g) | (erg/cm) |
| 300 | ||||
| 200 | − | − | ||
| 150 | − | − | ||
| 100 | − | − | ||
| 10 | − | − |
Publisher’s Note: MDPI stays neutral with regard to jurisdictional claims in published maps and institutional affiliations. |
© 2022 by the author. Licensee MDPI, Basel, Switzerland. This article is an open access article distributed under the terms and conditions of the Creative Commons Attribution (CC BY) license (https://creativecommons.org/licenses/by/4.0/).
Share and Cite
MDPI and ACS Style
Alzoubi, G.M. The Effect of Co-Doping on the Structural and Magnetic Properties of Single-Domain Crystalline Copper Ferrite Nanoparticles. Magnetochemistry 2022, 8, 164. https://doi.org/10.3390/magnetochemistry8120164
AMA Style
Alzoubi GM. The Effect of Co-Doping on the Structural and Magnetic Properties of Single-Domain Crystalline Copper Ferrite Nanoparticles. Magnetochemistry. 2022; 8(12):164. https://doi.org/10.3390/magnetochemistry8120164
Chicago/Turabian StyleAlzoubi, Gassem M. 2022. "The Effect of Co-Doping on the Structural and Magnetic Properties of Single-Domain Crystalline Copper Ferrite Nanoparticles" Magnetochemistry 8, no. 12: 164. https://doi.org/10.3390/magnetochemistry8120164
Note that from the first issue of 2016, this journal uses article numbers instead of page numbers. See further details here.