
High-Field Raman Scattering in an Antiferromagnet Fe3BO6
by
 , and
, and
Mikhail A. Prosnikov
1,2,3,*,
Sergei N. Barilo
4,
Nadzeya A. Liubochko
4,
Roman V. Pisarev
1 and
Peter C. M. Christianen
2,3 1
Ioffe Institute, Russian Academy of Sciences, 194021 St. Petersburg, Russia
2
High Field Magnet Laboratory (HFML–EMFL), Radboud University, Toernooiveld 7, 6525 ED Nijmegen, The Netherlands
3
Institute for Molecules and Materials, Radboud University, Heyendaalseweg 135, 6525 AJ Nijmegen, The Netherlands
4
Institute of Solid State and Semiconductor Physics, National Academy of Sciences, 220072 Minsk, Belarus
*
Author to whom correspondence should be addressed.
Magnetochemistry 2022, 8(8), 77; https://doi.org/10.3390/magnetochemistry8080077
Submission received: 2 July 2022
/
Revised: 19 July 2022
/
Accepted: 20 July 2022
/
Published: 24 July 2022
(This article belongs to the Special Issue Spectroscopy of Multiferroic Materials)
Abstract
:The detailed Raman scattering investigation of the lattice and spin dynamics of a single crystal of the antiferromagnet is reported. Azimuthally resolved polarization measurements provided an unambiguous determination of the symmetry of observed excitations. Low-temperature experiments at K allowed us to reduce anharmonic contribution and deconvolute several overlapping phonon modes. Low-frequency measurements have made it possible to find two excitations at 13.1 and 16.6 cm, which were assigned to quasi-ferromagnetic and quasi-antiferromagnetic magnon excitations, respectively. The magnetic field applied along the hard-magnetization axis causes energy shifts of these excitations, but no spin-flip transition was observed up to T.
1. Introduction
Several boron oxides were proposed as alternative and promising cathode materials for batteries over traditional lithium ones [1], and among those are several iron–boron oxides. One of them, namely , has been synthesized in different forms by using various technologies and demonstrated potentially interesting electrochemical properties [2,3,4,5,6]. However, the interest in lies beyond potential practical applications, e.g., due to its chemical similarity to a well-known and thoroughly studied easy-plane antiferromagnet iron borate [7]. Magnetic properties of both these materials are defined by ions
in distorted octahedral coordination with the electronic shell and the spin and in the ground electronic and magnetic state.
is an antiferromagnet with a weak ferromagnetic moment and a high Néel temperature K, which has been investigated using different techniques, mainly focusing on magnetic and magneto-optical properties. Surprisingly, it was found that the magneto-optical Faraday rotation in antiferromagnetic is of the same order of magnitude as that in a model ferrimagnetic material yttrium iron garnet (YIG), even though the net magnetic moment in is approximately two orders of magnitude smaller than in YIG [8]. Compared to the , the local inversion symmetry on the iron ions in is broken, thus strongly enhancing the intensity of crystal field transitions due to parity selection rules violation, as was suggested in optical absorption studies [9]. The difference in the local symmetry of iron ions in and results in notably different colors of single crystals of these two iron borates—while the former is of green color, the latter is black and has dark red coloring only in thin layers. The investigation of the magnon sidebands of an optical exciton in the absorption spectrum of in a magnetic field applied along the c-axis ([001]) showed that there is a spin-flop transition at 14.9 T (14.7 T in magnetization experiment [10]), and the magnon energy at the Brillouin zone boundary is presumably 485 cm [11].
The crystal structure was reported in [12] and later refined in [13]. Magnetization, magnetic susceptibility and the Mössbauer spectra were studied in [14,15,16]. Symmetry considerations related to the magnetic structure are available and were provided in [17,18]. Magnetic torque and the weak moment magnetometry measurements showed that below , the spin configuration is of the symmetry, whereas above this temperature, it is of the symmetry. Koshizuka et al. demonstrated the possibility of modifying the magnetic structure with doping in [19]. Another exciting feature of is a spin orientation transition occurring above room temperature at K. It was studied in detail in [20], where a nearly intermediate nature of transition was established and which could be viewed either as a very weak first-order transition with extremely small hysteresis or as two second-order transitions close to each other. Several works have reported measurable effects of coupling between magnetic and lattice subsystems in via thermal expansion [21] and magnetoacoustic measurements [22,23].
Spin dynamics was explicitly addressed in [24,25], where quasi-ferromagnetic (qFM) and quasi-antiferromagnetic (qAFM) modes were registered, and their temperature dependence was studied. High-energy magnetic mode at ≈742 cm was reported in the Raman scattering experiment and assigned to two-magnon excitations based on their temperature behavior [26]. From a structural point of view, is a very similar system in which, instead of iron, one site is occupied with the magnetic ions while another with
diamagnetic . This antiferromagnet was studied earlier, and rich spin dynamics and spin–phonon interactions were observed [27].
However, many fundamental properties of remain unknown. For example, there are no reports on the exchange structure of this compound. In this work, we report and analyze results on both the lattice and spin dynamics of single crystals. Measurements were performed using low-frequency Raman scattering at room and liquid-helium temperatures at magnetic fields up to B = 30 T.
2. Materials and Methods
(SP 2-4 (SP x–y means not more than wt% of x impurities, e.g., SP 2-4 corresponds to a reagent with not more than wt% of two impurities), Donetsk chemical reagents plant, Donetsk, Ukraine), (SP 12-3, Red Chemist, St. Petersburg, Russia), (SP 5-3, Red Chemist, St. Petersburg, Russia), (SP 7-3, Red Chemist, St. Petersburg, Russia) were used as raw materials. All reagents were dried before synthesis. single crystals were grown from the fluxed melt consisting of (8.3) + (48.3) + (7.6) + (35.8) wt%.
Five hundred grams of the mixture was heated up to C using a platinum crucible, and was kept for 4 h at this temperature for homogenization. Then, the temperature was decreased down to C, where the saturation temperature was measured to be C. Afterwards, the platinum ring carrier was placed in the flux, and rotated with the rate of 30 revolutions per minute. After 60 min, the temperature of the flux was set to C, and further decreased at a rate of 1–3 C per 24 h. The total duration of crystal growth was 14 days. Both X-Ray fluorescent analysis and the XRD pattern of crashed single crystals confirm the high structural quality and absence of impurity phases as well as impurity ions. The obtained crystals are characterized by clean natural faceting, as demonstrated in Figure 1, where the simple (010) face is shown, along with the (111) and (210) ones. Crystals have a dark-red coloring which could be only seen on the splinters because of large optical density.
Raman scattering measurements were performed at High Field Magnet Laboratory (HFML, Nijmegen, The Netherlands) using 660 nm single mode laser TORUS (Laser Quantum, Stockport, UK). A 1 m spectrometer FHR-1000 (HORIBA, Kyoto, Japan) equipped with 1200 L/mm grating in combination with a liquid nitrogen-cooled CCD PyLoN camera (Teledyne Princeton Instruments, Thousand Oaks, CA, USA) were used for detecting Raman scattering signals. The set of the polarization optics, appropriate for an excitation wavelength of 660 nm, including Glan polarizers and half wave-plates (Thorlabs, Newton, MA, USA), was used for azimuthally resolved measurements. A set of volume-Bragg filters (Optigrate, Oviedo, FL, USA) was used in beamsplitter/rejection filters configuration to access the low-frequency region. The experimental setup was controlled with qudi code [29]. Fitting the experimental data was performed using the fityk [30] code with pseudo-Voigt lineshapes for all discussed excitations.
3. Results
3.1. Lattice Dynamics
belongs to an orthorhombic space group (#62) with , , Å, where iron ions occupy 4c and 8d Wyckoff positions [13]. Knowledge of symmetry allows deriving the symmetric Raman tensors for phonons that are given below:
In our experiments, we focused on a specific -plane orientation of the orthorhombic crystal for which only phonons of the and symmetry should be allowed. However, a small inevitable leakage of other symmetry modes was observed due to minor depolarization and misalignment effects. Spectra for different polarizations at 300 and 4.2 K are shown in Figure 2.
Polar dependencies of the integrated intensities were calculated according to:
where is the Raman tensor selected from Equation (1) depending on a particular mode, T is the rotation matrix, and and are the polarization vectors of the excitation and scattered light, respectively.
Since the experiment was performed with the bulk samples with the excitation and scattered light close to the transmission window, it was characterized by a relatively large scattering volume. Therefore, to correctly describe polar dependencies, we used the complex form of the Raman tensors. These complex phases should appear only in the situation when there is more than one particular element co-occurring. In our case, this is only possible for the modes. The phase difference was chosen as , leading to an almost perfect description of the experimental polar dependencies, in good accordance with a bulk limit proposed in [31].
The Raman scattering maps of the integral phonon intensities measured at room temperature are shown in the middle part of Figure 3 for parallel () and crossed () polarization configurations. Analysis and fitting of these dependencies to specific Raman tensors according to Equation (2) made it possible to unambiguously assign them either to the or modes. Extracted frequencies of these phonon modes are summed up in Table 1.
To obtain further insight into the phonon dynamics in , we performed experiments at liquid helium temperatures of 4.2 K. This allowed us to suppress the broadening of Raman lines caused by anharmonism, reduce the elastic contribution and increase the intensity of the weak modes. The results are shown in Figure 4. Similarly, from these maps, we extracted azimuthal dependencies of the integral phonon intensities and their frequencies from the angular-integrated spectra to further increase the signal-to-noise ratio. It is evident that, by performing measurements at low temperatures and analyzing the data with this procedure, we could “deconvolute” multiple excitations overlapping at room temperature. The overall increase in the intensity also allowed us to register very weak phonons, some of which matched the frequencies of the and phonon modes previously observed in [26]. However, considering the relatively low intensity for some modes (e.g., 113.8 cm) and their extremely narrow width, it was hard to assign them unambiguously using azimuthal dependencies. Thus, these modes could be checked versus high-temperature data from [26], where these specific modes were assigned to ones.
No pronounced magnetic field effect up to 30 T was observed on all phonon modes below 400 cm. This shows that even high fields applied along the hard axis are relatively small compared to critical ones, which are expected to be large given the high Néel temperature and large magnon gap in .
3.2. Spin Dynamics
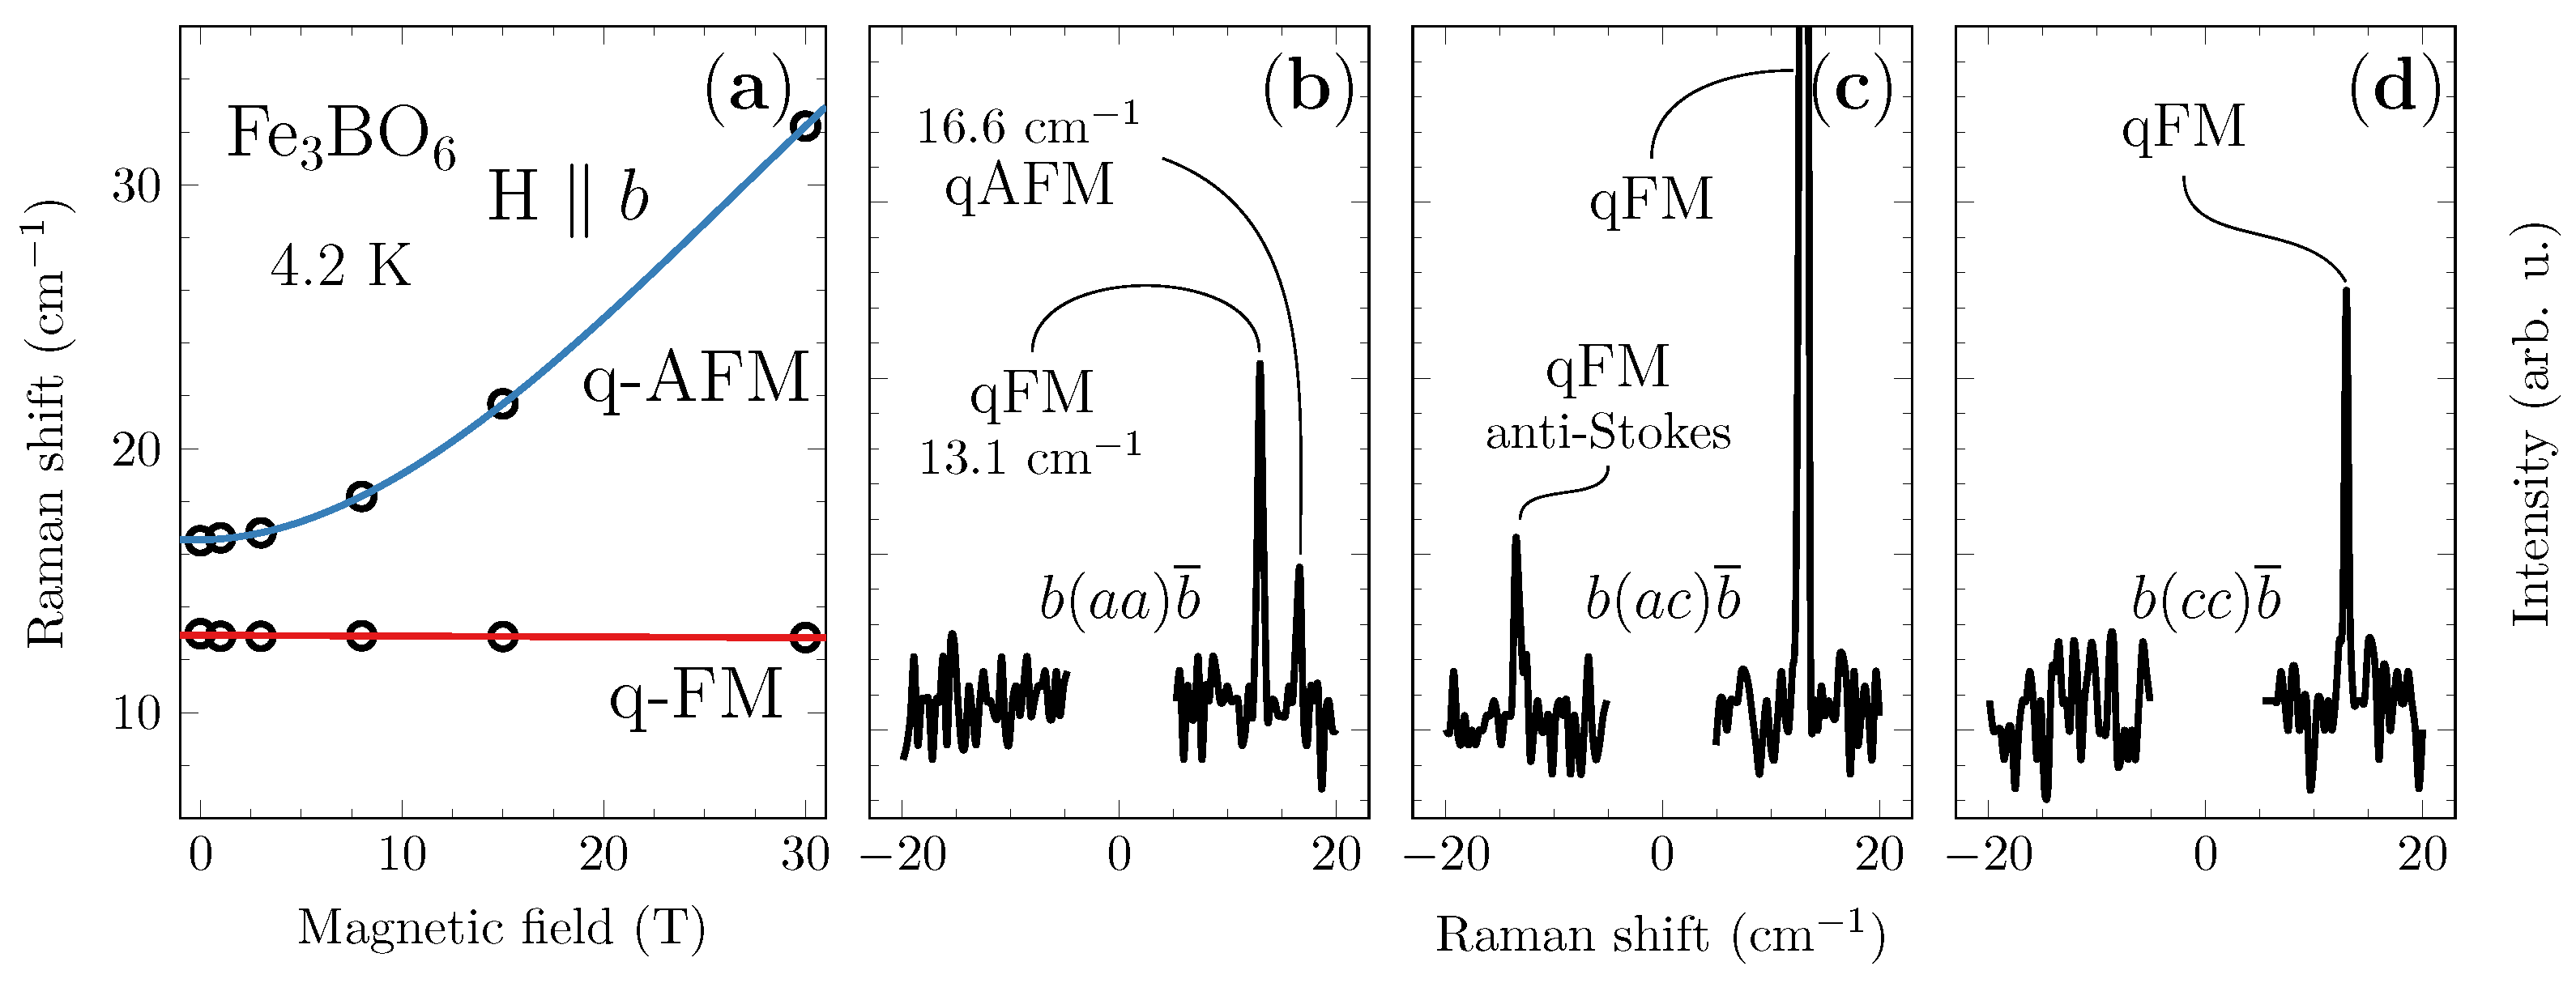
Along with multiple phonon excitations, we were able to observe the two low-frequency modes which we assign to the two lowest branches of magnon excitations corresponding to quasi-ferromagnetic (qFM) and quasi-antiferromagnetic (qAFM) ones. These assignments were made by taking into account their frequency, below 20 cm, compared to the phonon frequencies discussed above. Essential results for such identification were their response to the magnetic field and the unusual form of corresponding Raman tensors.
We note that these modes are already split in a zero-applied field due to antisymmetric (Dzyaloshinskii–Moriya (DMI)) exchange interaction, which also accounts for weak ferromagnetism in . The absence of the degeneracy uplifting is additional evidence to assign these excitations to qFM and qAFM modes.
The polar dependencies of the qFM magnon mode at 13.1 cm at 4.2 K show a noticeable difference between the and crossed polarizations which should be equal to any symmetric Raman scattering tensors. Such non-equivalence of the off-diagonal elements is the characteristic feature of the magnetic excitations [32]. The same effect could also be seen at room temperature (see Figure 3). Unfortunately, the higher-frequency qAFM mode was too weak for a reliable measurement of its polar dependence. It was only registered in the polarization configuration, as shown in Figure 5. According to [32], Raman tensors for magnons should be anti-symmetric in an ideal scenario.
However, different contributions, such as spin–orbit coupling, could alter this condition and make it non-symmetric, as directly probed in our azimuthally resolved measurements. The Raman tensor for qFM mode has the following form:
where the elements extracted from polar dependencies are g = 4.9 and h = 6.8 at 4.2 K. Our observations are also in good accordance with antiferromagnetic resonance (AFMR) measurements [25]. The observed FWHM of the qFM and qAFM modes are 0.4–0.55 cm (depending on the selected polarization) and 0.4 cm, respectively. These values are comparable with cm and cm observed in the AFMR studies. This indicates that the observed magnetic Raman modes are still resolution limited by the experimental hardware. We may assume that these limitations can be easily bypassed by using a higher spectral resolution setup.
The strong magnetic field applied along the hard magnetization b axis was used to achieve the spin-flip transition. However, observed field dependencies (Figure 5) show that the critical field lies above 30 T. Nevertheless, we reliably established a lower boundary of this field. We add that the observed field dependencies of both qFM and qAFM modes on the applied magnetic field could be used to create the exchange structure of .
4. Discussion
The observation of previously unreported phonons and the reliable determination of their symmetry and corresponding Raman tensor elements allow us to further expand our understanding of the lattice dynamics in . Along with these results, our observations provide additional opportunities for the full-optical orientation of the single crystals or small crystallites in polycrystalline samples. Additionally it can contribute to applying optical methods for controlling and characterizing powder-like materials [2,4,5,6] that could be created at an industrial scale. Our results on the spin dynamics in obtained with the use of Raman scattering can be applied to develop an entirely consistent model of the magnetic interactions, which until now remain unknown.
As a prospective for further research, a more rigorous exploration of the weak modes observed at low temperatures can be suggested since is expected to have several optical magnons at higher frequencies. As an alternative, time-resolved methods such as THz or pump-probe spectroscopy could also be applied to study the spin dynamics of within the time domain to obtain further insights into the onset, evolution, and interaction between different magnetic excitations. In some sense, the orthorhombic is similar to a rich family of rare-earth orthoferrites, for which time-resolved pump–probe methods brought many exciting results [33,34,35,36]. Another prospect for better understanding the lattice dynamics is the detailed DFT calculations based on our Raman data. In contrast to typical calculations, which only use frequencies of the phonons as observables, Raman tensor elements could be used to further refine ab initio models.
In a broader perspective, in addition to rare-earth orthoferrites, is an interesting antiferromagnet closely related to a thoroughly investigated . However, a more complex crystal structure of , with two crystallographically distinct sites occupied by the magnetic ions provides additional room for exploration. Moreover, the spin
reorientation temperature of lies above but sufficiently close to the
room temperature, which is very convenient to study given potential applications, e.g., in
antiferromagnetic spintronics.
5. Conclusions
The low-temperature study of the lattice and spin dynamics of allowed us to find new excitations, two of which were assigned to quasi-ferromagnetic and quasi-antiferromagnetic magnons according to their behavior in the magnetic field up to 30 T. Azimuthally resolved measurements made it possible to reliably extract the Raman tensor elements of phonons and qFM magnon. Thus, it was demonstrated that Raman spectroscopy is a non-destructive, local, selective, and fast method that could be directly applied to phase identification, the determination of phase purity, and the crystallite orientation of the promising cathode and spintronic material , facilitating and aiding further research.
Author Contributions
M.A.P.: conceptualization, investigation, formal analysis, writing—original draft preparation; S.N.B. and N.A.L.: sample growth; R.V.P.: discussion, editing; P.C.M.C.: resources. All authors have read and agreed to the published version of the manuscript.
Funding
The research is supported by BASIS foundation grant no. 21-1-4-33-1.
Institutional Review Board Statement
Not applicable.
Informed Consent Statement
Not applicable.
Data Availability Statement
Data is available from the corresponding author on reasonable request.
Acknowledgments
Fruitful discussions with Beatrice T. Crow and the great succor of E. A. Arkhipova are acknowledged. The support of HFML-RU/NWO-I, a member of the European Magnetic Field Laboratory (EMFL), is acknowledged.
Conflicts of Interest
The authors declare no conflict of interest.
References
- Rowsell, J.L.C.; Gaubicher, J.; Nazar, L.F. A New Class of Materials for Lithium-Ion Batteries: Iron(III) Borates. J. Power Sources 2001, 97–98, 254–257. [Google Scholar] [CrossRef]
- Shi, X.; Chang, C.; Xiang, J.; Xiao, Y.; Yuan, L.; Sun, J. Synthesis of Nanospherical Fe3BO6 Anode Material for Lithium-Ion Battery by the Rheological Phase Reaction Method. J. Solid State Chem. 2008, 181, 2231–2236. [Google Scholar] [CrossRef]
- Ram, S.; Kumari, K.; Kotnala, R.K. Synthesis of Norbergite Fe3BO6 of Single Crystallites from a Borate Glass. Trans. Indian Ceram. Soc. 2010, 69, 165–170. [Google Scholar] [CrossRef]
- Tian, J.; Wang, B.; Zhao, F.; Ma, X.; Liu, Y.; Kun Liu, H.; Huang, Z. Highly Active Fe3BO6 as an Anode Material for Sodium-Ion Batteries. Chem. Commun. 2017, 53, 4698–4701. [Google Scholar] [CrossRef] [PubMed]
- Kumari, K. Structural, Vibrational and Surface Analysis of Fe3BO6 Nanoplates Synthesized by Combustion Method. J. Mol. Struct. 2018, 1165, 293–298. [Google Scholar] [CrossRef]
- Kumari, K.; Ram, S.; Kotnala, R.K. Self-Controlled Growth of Fe3BO6 Crystallites in Shape of Nanorods from Iron-Borate Glass of Small Templates. Mater. Chem. Phys. 2011, 129, 1020–1026. [Google Scholar] [CrossRef]
- Kalashnikova, A.M.; Kimel, A.V.; Pisarev, R.V.; Gridnev, V.N.; Kirilyuk, A.; Rasing, T. Impulsive Generation of Coherent Magnons by Linearly Polarized Light in the Easy-Plane Antiferromagnet FeBO3. Phys. Rev. Lett. 2007, 99, 167205. [Google Scholar] [CrossRef] [PubMed]
- Abe, M.; Gomi, M.; Nomura, S. Faraday Rotation and Birefringence of Fe3BO6. Jpn. J. Appl. Phys. 1980, 19, 1329. [Google Scholar] [CrossRef]
- Andlauer, B.; Diehl, R. Optical Absorption of Fe3BO6 in the Range of the Transitions 6A1→4T1, 4T2. Phys. B C 1977, 89, 50–53. [Google Scholar] [CrossRef]
- Voigt, C. Field-Induced Phase Transition in Fe3BO6. Phys. Lett. A 1975, 53, 223–224. [Google Scholar] [CrossRef]
- Andlauer, B.; Diehl, R.; Skolnick, M.S. Investigation of the Optical Absorption of Fe3BO6 after Oxygen Annealing and under the Influence of Strong Magnetic Fields. J. Appl. Phys. 1978, 49, 2200–2202. [Google Scholar] [CrossRef]
- White, J.G.; Miller, A.; Nielsen, R.E. Fe3BO6, a Borate Isostructural with the Mineral Norbergite. Acta Crystallogr. 1965, 19, 1060–1061. [Google Scholar] [CrossRef]
- Diehl, R.; Brandt, G. Refinement of the Crystal Structure of Fe3BO6. Acta Crystall. B-Stru. 1975, 31, 1662–1665. [Google Scholar] [CrossRef]
- Wolfe, R.; Pierce, R.D.; Eibschütz, M.; Nielsen, J.W. Magnetization and Mössbauer Effect in Single Crystal Fe3BO6. Solid State Commun. 1969, 7, 949–952. [Google Scholar] [CrossRef]
- Voigt, C.; Bonnenberg, D. Temperature Dependence of the Magnetic Susceptibility of Fe3BO6. Phys. B C 1975, 80, 439–443. [Google Scholar] [CrossRef]
- Nakamura, S.; Mitsui, T.; Kobayashi, Y.; Kurokuzu, M.; Shimomura, S. Synchrotron Mössbauer Diffraction of Natural Iron Fe3BO6. J. Phys. Soc. Jpn. 2020, 89, 125001. [Google Scholar] [CrossRef]
- Hirano, M.; Okuda, T.; Tsushima, T.; Umemura, S.; Kohn, K.; Nakamura, S. Spin Configurations and Spin Reorientations in Pure and Impurity Doped Fe3BO6. Solid State Commun. 1974, 15, 1129–1133. [Google Scholar] [CrossRef]
- Mal’tsev, V.I.; Najden, E.P.; Zhilyakov, S.M.; Smolin, R.P.; Borisyuk, L.M. Magnetic Structure of Fe3BO6. Kristallografiya 1976, 21, 113–117. [Google Scholar]
- Koshizuka, N.; Hirano, M.; Okuda, T.; Nakamura, S.; Hiruma, H.; Tsushima, T. Control of the Spin Reorientation with Impurity Modification in RFeO3 and Fe3BO6. AIP Conf. Proc. 1975, 24, 61–62. [Google Scholar] [CrossRef]
- Tsymbal, L.T.; Bazaliy, Y.B.; Bezmaternykh, L.N.; Slawska-Waniewska, A.; Vasiliev, S.V.; Nedelko, N.; Linnik, A.I.; Cherkasov, A.N.; Nepochatykh, Y.I.; Dmitrenko, V.Y.; et al. Orientation Phase Transition in Fe3BO6: Experimental Determination of the Order of the Transition. Phys. Rev. B 2006, 74, 134429. [Google Scholar] [CrossRef]
- Biryukov, Y.P.; Filatov, S.K.; Vagizov, F.G.; Zinnatullin, A.L.; Bubnova, R.S. Thermal Expansion of FeBO3 and Fe3BO6 Antiferromagnets Near the Neel Temperature. J. Struct. Chem. 2018, 59, 1980–1988. [Google Scholar] [CrossRef]
- Buchelnikov, V.D.; Danshin, N.K.; Dolgushin, D.M.; Izotov, A.I.; Shavrov, V.G.; Tsymbal, L.T.; Takagi, T. Specific Features of Magnetoacoustic Waves in Fe3BO6. Phys. Solid State 2005, 47, 1886–1891. [Google Scholar] [CrossRef]
- Buchelnikov, V.; Danshin, N.; Dolgushin, D.; Isotov, A.; Shavrov, V.; Tsymbal, L.; Kakazei, G.; Takagi, T.; Wigen, P. The Magnetoacoustic Anomaly in Fe3BO6. J. Magn. Magn. Mater. 2004, 272–276, 2113–2114. [Google Scholar] [CrossRef]
- Müllerwiebus, E.U.; Bonnenberg, D. Microwave Resonance in Fe3BO6. Phys. B C 1975, 80, 435–438. [Google Scholar] [CrossRef]
- Harutunian, V.E.; Kocharian, K.N.; Martirosian, R.M.; Voronkov, V.D.; Bezmaternich, L.N. Investigation of Submillimeter-Wave Spin-Precession Modes in Fe3BO6. Int. J. Infrared Milli. 1989, 10, 841–845. [Google Scholar] [CrossRef]
- Navarro, H.; Potts, J.E.; Merlin, R. Raman Scattering from Phonons and Magnons in Antiferromagnetic Fe3BO6. Solid State Commun. 1984, 50, 331–333. [Google Scholar] [CrossRef]
- Prosnikov, M.A.; Smirnov, A.N.; Davydov, V.Y.; Pisarev, R.V.; Lyubochko, N.A.; Barilo, S.N. Magnetic Dynamics and Spin-Phonon Coupling in the Antiferromagnet Ni2NbBO6. Phys. Rev. B 2018, 98, 104404. [Google Scholar] [CrossRef]
- Momma, K.; Izumi, F. VESTA3 for Three-Dimensional Visualization of Crystal, Volumetric and Morphology Data. J. Appl. Crystallogr. 2011, 44, 1272–1276. [Google Scholar] [CrossRef]
- Binder, J.M.; Stark, A.; Tomek, N.; Scheuer, J.; Frank, F.; Jahnke, K.D.; Müller, C.; Schmitt, S.; Metsch, M.H.; Unden, T.; et al. Qudi: A Modular Python Suite for Experiment Control and Data Processing. SoftwareX 2017, 6, 85–90. [Google Scholar] [CrossRef]
- Wojdyr, M. Fityk: A General-Purpose Peak Fitting Program. J. Appl. Crystallogr. 2010, 43, 1126–1128. [Google Scholar] [CrossRef]
- Kranert, C.; Sturm, C.; Schmidt-Grund, R.; Grundmann, M. Raman Tensor Formalism for Optically Anisotropic Crystals. Phys. Rev. Lett. 2016, 116, 127401. [Google Scholar] [CrossRef] [PubMed]
- Fleury, P.A.; Loudon, R. Scattering of Light by One- and Two-Magnon Excitations. Phys. Rev. 1968, 166, 514–530. [Google Scholar] [CrossRef]
- De Jong, J.A.; Razdolski, I.; Kalashnikova, A.M.; Pisarev, R.V.; Balbashov, A.M.; Kirilyuk, A.; Rasing, T.; Kimel, A.V. Coherent Control of the Route of an Ultrafast Magnetic Phase Transition via Low-Amplitude Spin Precession. Phys. Rev. Lett. 2012, 108, 157601. [Google Scholar] [CrossRef] [PubMed]
- Yamaguchi, K.; Kurihara, T.; Minami, Y.; Nakajima, M.; Suemoto, T. Terahertz Time-Domain Observation of Spin Reorientation in Orthoferrite ErFeO3 through Magnetic Free Induction Decay. Phys. Rev. Lett. 2013, 110, 137204. [Google Scholar] [CrossRef] [PubMed]
- Mikhaylovskiy, R.V.; Hendry, E.; Secchi, A.; Mentink, J.H.; Eckstein, M.; Wu, A.; Pisarev, R.V.; Kruglyak, V.V.; Katsnelson, M.I.; Rasing, T.; et al. Ultrafast Optical Modification of Exchange Interactions in Iron Oxides. Nat. Comm. 2015, 6, 8190. [Google Scholar] [CrossRef] [PubMed]
- Mikhaylovskiy, R.V.; Huisman, T.J.; Gavrichkov, V.A.; Polukeev, S.I.; Ovchinnikov, S.G.; Afanasiev, D.; Pisarev, R.V.; Rasing, T.; Kimel, A.V. Resonant Pumping of d-d Crystal Field Electronic Transitions as a Mechanism of Ultrafast Optical Control of the Exchange Interactions in Iron Oxides. Phys. Rev. Lett. 2020, 125, 157201. [Google Scholar] [CrossRef] [PubMed]
Figure 1.
(a) Faceting and identification of the crystallographic faces of the single crystal. A picture was obtained with the use of VESTA software [28]; and (b) microphotograph of a single crystal sample used in the present study.
Figure 1.
(a) Faceting and identification of the crystallographic faces of the single crystal. A picture was obtained with the use of VESTA software [28]; and (b) microphotograph of a single crystal sample used in the present study.

Figure 2.
The selection of Raman scattering spectra measured at 300 and 4.2 K for distinct polarization configurations within -plane.
Figure 2.
The selection of Raman scattering spectra measured at 300 and 4.2 K for distinct polarization configurations within -plane.

Figure 3.
Raman scattering maps of the intensity, plotted as a function of the Raman shift and angle between the selected crystallographic axis and polarization plane defined by , measured on the plane of the sample at room temperature, as shown in the middle. Polar dependencies of the integral intensities (magnitude (counts/s/mW)) are shown above and below. Red and blue solid lines correspond to parallel () and crossed () polarization configurations. Black dotted and dashed curves are the results of model calculations (Equation (2)) for these configurations, respectively, and are used to extract the Raman tensor elements. Symmetry and the frequency of each mode are shown close to the relevant polar plots.

Figure 4.
Raman scattering maps of the intensity, plotted as a function of Raman shift and angle between the crystallographic axis and , measured on the plane at 4.2 K, shown in the middle. Polar dependencies of the integral intensities (magnitude (counts/s/mW)) are shown above and below. Red and blue solid lines correspond to parallel () and crossed () polarization configurations. Black dotted and dashed curves are the results of model calculations (Equation (2)) for these configurations, respectively, and are used to extract the Raman tensor elements. The symmetry and frequency of each mode are shown close to the relevant polar plots.
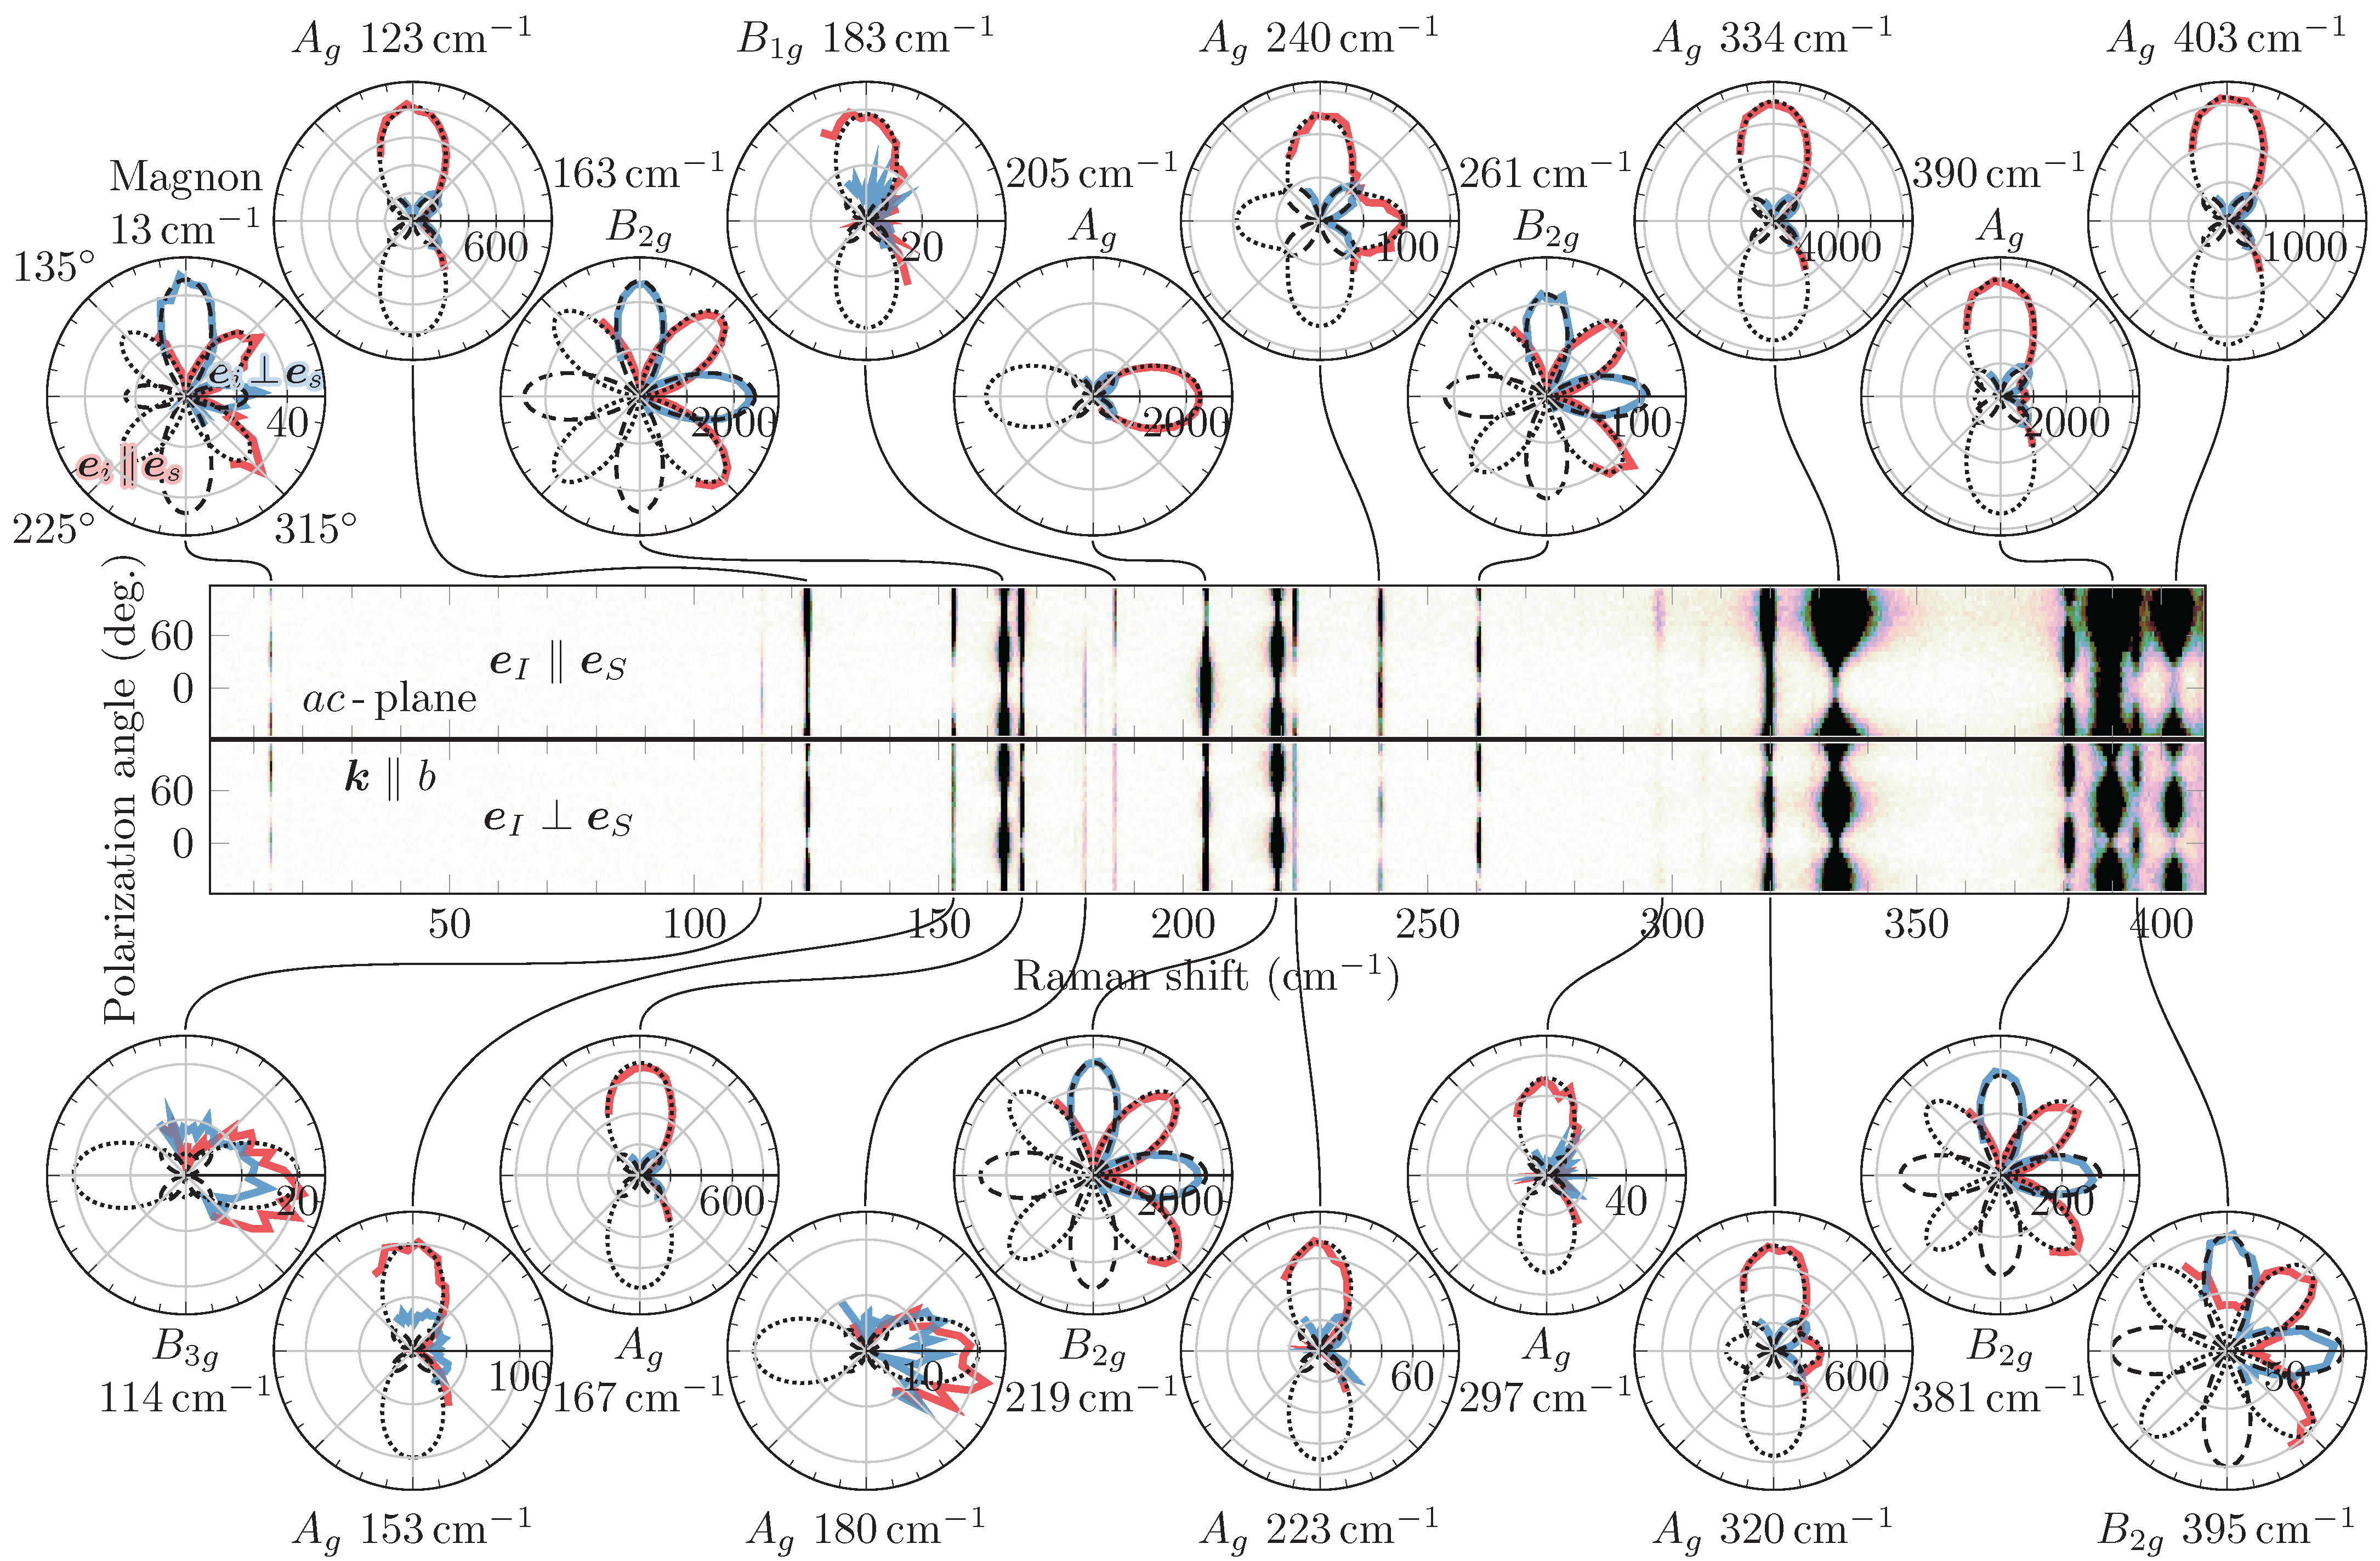
Figure 5.
(a) Magnetic field dependence of the quasi-ferromagnetic (qFM) and quasi-antiferromagnetic (qAFM) magnon modes in magnetic field parallel to the crystal b axis. (b–d) qFM and qAFM modes at different polarizations in low-frequency regions in both Stokes and anti-Stokes regimes.
Figure 5.
(a) Magnetic field dependence of the quasi-ferromagnetic (qFM) and quasi-antiferromagnetic (qAFM) magnon modes in magnetic field parallel to the crystal b axis. (b–d) qFM and qAFM modes at different polarizations in low-frequency regions in both Stokes and anti-Stokes regimes.

Table 1.
Experimentally observed frequencies of magnetic and phonon excitations at T = 4.2 and 300 K. To increase the signal-to-noise ratio, frequency values were extracted from the angular-integrated polar dependencies.
Table 1.
Experimentally observed frequencies of magnetic and phonon excitations at T = 4.2 and 300 K. To increase the signal-to-noise ratio, frequency values were extracted from the angular-integrated polar dependencies.
| (cm) | Assignment 1 | Tensor Elements 2 | (cm) | (cm) 3 |
|---|---|---|---|---|
| 13.1 | qFM | 7.8 | – | |
| 16.6 | qAFM | – | – | – |
| 113.8 | – | – | 114 | |
| 123.1 | 122.3 | 124 | ||
| 152.9 | 151.2 | 154 | ||
| 163.4 | 162.1 | 164 | ||
| 166.9 | 165.4 | 166 | ||
| 178.1 | – | – | 178 | |
| 179.9 | – | – | ||
| 183.2 | – | – | 184 | |
| 186.1 | – | – | ||
| 204.8 | 203.1 | 204 | ||
| 219.4 | 51 | 217.6 | 218 | |
| 222.9 | – | 221 | ||
| 240.5 | 238.8 | 240 | ||
| 260.7 | 259.0 | 260 | ||
| 281.8 | ? | – | – | – |
| 297.5 | – | 294 | ||
| 306.7 | ? | – | – | – |
| 320.1 | 18.5, 27.5 | 318.8 | 320 | |
| 333.7 | 331.9 | 332 | ||
| 381.4 | 18 | 379.7 | 382 | |
| 390.0 | 387.4 | 388 | ||
| 395.4 | 10 | – | 390 | |
| 402.9 | 400.4 | 400 | ||
| – | – | 427.1 | 428 |
1 It should be noted that our symmetry assignments are different from those in [26] because of different crystallographic axes’ nomenclature. 2 Elements are calculated according to Equation (2) with tensors from Equation (1). The geometry of our experiments allowed us to determine a and c elements for Ag and d elements for B1g modes, respectively, at a temperature of 4.2 K. 3 According to room temperature measurements from [26].
Publisher’s Note: MDPI stays neutral with regard to jurisdictional claims in published maps and institutional affiliations. |
© 2022 by the authors. Licensee MDPI, Basel, Switzerland. This article is an open access article distributed under the terms and conditions of the Creative Commons Attribution (CC BY) license (https://creativecommons.org/licenses/by/4.0/).
Share and Cite
MDPI and ACS Style
Prosnikov, M.A.; Barilo, S.N.; Liubochko, N.A.; Pisarev, R.V.; Christianen, P.C.M. High-Field Raman Scattering in an Antiferromagnet Fe3BO6. Magnetochemistry 2022, 8, 77. https://doi.org/10.3390/magnetochemistry8080077
AMA Style
Prosnikov MA, Barilo SN, Liubochko NA, Pisarev RV, Christianen PCM. High-Field Raman Scattering in an Antiferromagnet Fe3BO6. Magnetochemistry. 2022; 8(8):77. https://doi.org/10.3390/magnetochemistry8080077
Chicago/Turabian StyleProsnikov, Mikhail A., Sergei N. Barilo, Nadzeya A. Liubochko, Roman V. Pisarev, and Peter C. M. Christianen. 2022. "High-Field Raman Scattering in an Antiferromagnet Fe3BO6" Magnetochemistry 8, no. 8: 77. https://doi.org/10.3390/magnetochemistry8080077
Note that from the first issue of 2016, this journal uses article numbers instead of page numbers. See further details here.