Article

Influence of Bi Content on the Temperature of the Formation of the Hard Magnetic MnBi Phase: Simultaneous Irreversible Drop of Resistance

1
Laboratory of Magnetism, Department of Science (Physics), Campus de Arrosadía, Public University of Navarre (UPNA), 31006 Pamplona, Spain
2
Institute for Advanced Materials and Mathematics (INAMAT2), Campus de Arrosadía, Public University of Navarre (UPNA), 31006 Pamplona, Spain
*
Author to whom correspondence should be addressed.
Magnetochemistry 2022, 8(8), 82; https://doi.org/10.3390/magnetochemistry8080082
Submission received: 30 May 2022 / Revised: 22 July 2022 / Accepted: 24 July 2022 / Published: 29 July 2022
(This article belongs to the Special Issue Magnetic and Transport Properties of Thin-Film Materials)

Abstract

:
Pulsed laser-deposited (PLD) MnBi films were fabricated by alternating deposition of Mn and Bi layers. In order to obtain the ferromagnetic MnBi phase, heat treatments were performed on the samples. Simultaneously, the resistance of the samples was monitored as a function of the temperature. Thus, on increasing the temperature, a steep decrease in the resistance of the films was observed, simultaneous to the onset of the formation of the MnBi phase. At room-temperature, these annealed samples showed a ferromagnetic behavior, as well as the presence of the characteristic LT-MnBi phase diffraction peaks in the X-ray diffraction patterns. The temperature of the generation of the MnBi phase depended on the relative concentration of Mn and Bi in the different samples: on increasing the Bi atomic concentration, the temperature of the generation of the MnBi phase decreased.

1. Introduction

In recent years, the MnBi compound has aroused great interest as a promising candidate for building rare-earth-free permanent magnets. Although this compound does not have the particular characteristics of FeNdB or SmCo magnets, the saturation magnetization (μ0MS) of MnBi is in the order of 0.7 T and its coercivity (μ0HC) is larger than 1 T at room-temperature. Furthermore, MnBi has a positive temperature coefficient of coercivity, in such a way that μ0HC increases up to 2.5 T at 260 °C. The Curie temperature of MnBi is around 360 °C. These properties make this compound very competitive for use at high temperatures compared to FeNdB magnets, for instance. In addition, MnBi alloys have a very high uniaxial magnetic anisotropy field (μ0HK), which is in the order of 5.5 T at room-temperature, and a theoretical maximum BH product in the order of 140 kJ/m3 [1,2,3,4,5].
MnBi magnets have been fabricated by solid state reactions [6,7,8,9,10,11], by rapid solidification in a melt-spinner [12] and by ball milling [13,14,15,16]. In thin-film geometry, MnBi has been deposited by laser ablation [17,18], through e-beam [19,20] and thermal evaporation [21,22], and by sputtering [23,24,25,26,27,28,29]. After the production of the as-cast or as-deposited samples through these different techniques, the compounds were annealed in order to originate the magnetic MnBi phase. An alternative procedure, consisting of the deposition of Mn and Bi on heated substrates, was also used to give rise to the ferromagnetic MnBi phase.
In order to give rise to the MnBi phase in films, a great range of annealing temperatures and times have been reported in the scientific literature. Traditionally, Chen’s method was used to originate the MnBi phase [30,31]. This method consisted of annealing the samples in the temperature range 225–350 °C for 72 h. However, other authors reported the observation of the MnBi phase upon annealing at temperatures in the order of 350 [26], 450 [24], or 550 °C [23], and also with a wide variety of annealing times, from 30 min [23,24] to 4 h [22]. In this scenario, the resistance measurements might provide direct evidence of the formation of the MnBi phase, in order to shed light on the process of fabrication of these hard magnetic materials [32]. In addition, monitoring the resistance measurements could also reduce the annealing times to two minutes, for instance, as in the heat treatments detailed in this work.

2. Materials and Methods

PLD films were fabricated with a Nd:YAG Litron laser with an energy per pulse of 325 mJ. The frequency of the pulses was 20 Hz. The pulse duration was 6 ns and the radiation wavelength was 1064 nm. The spot of the laser beam on the target surface was 6 mm2. The deposition pressure in a Neocera chamber (Neocera, Beltsville, MD, USA) was 10−5 mbar. A Mn (99.95% purity) target was provided by Kurt J. Lesker (Kurt J. Lesker, Jefferson Hills, PA, USA), and a Bi (99.999% purity) target was supplied by Goodfellow. A Ta (99.99% purity) target provided by Goodfellow (Goodfellow, Cambridge, UK) was also used to deposit a protective layer to prevent oxidation during the annealing processes. The particular characteristics of the deposition process were detailed in previous works [32,33].
The samples were fabricated by alternative deposition of Bi and Mn. For all the samples, Mn was deposited for 20 s. The average Mn deposition rate was 4.2 nm/min. The average Bi deposition rate was 19 nm/min. The Bi deposition time was changed from 7 to 10 s for the different samples, thus changing the relative deposited amounts of Bi and Mn, cf. Table 1. We repeated this basic deposition structure of Bi/Mn layers 40 times for each sample. A 15 nm thick Ta layer was deposited on all films to prevent oxidation. The atomic composition of MnBi films deposited on Si substrates was determined using the microanalysis probe in a JEOL JSM-5610 LV Scanning Electron Microscope (JEOL, Tokyo, Japan).
The thickness of the different samples was measured with a Nanotec magnetic/atomic force microscope (MFM/AFM) [34], with CoCr-coated MESP tips from Veeco. We extracted the Mn and Bi deposition rates from the AFM measurements.
We annealed the different samples ex situ in a homemade furnace with an Ar dynamic atmosphere. The rate of increase in the temperature was 9 °C/min until we reached the annealing temperature. The maximum temperature in each annealing was kept constant for 2 min. The rate at which the temperature decreased was also 9 °C/min. The resistance of the samples was monitored during the annealing process.
X-ray diffraction measurements were performed on the different samples at room-temperature with an XRD3000 diffractometer from Seifert (GE, Fairfield, CT, USA), using the Cu Kα radiation in the θ–2θ geometry.
The magnetic hysteresis loops of the samples were measured at room-temperature with a vibrating sample magnetometer (VSM) from EG&G (URS Corp, San Francisco, CA, USA), in magnetic fields up to 1.7 T.

3. Results and Discussion

As indicated above, a set of different (Bi/Mn)40 samples was pulsed laser deposited through the alternating deposition of Bi and Mn layers. The deposition time for the Mn layers was 20 s for each layer in every sample. By changing the Bi deposition time, the relative concentration of Bi and Mn was modified among the different samples. Deposition times and average thicknesses, calculated from the already-mentioned deposition rates, and the atomic concentrations of the particular samples, are displayed in Table 1.
The results of the energy-dispersive X-ray (EDX) spectroscopy for the different samples are displayed in Figure 1.
The different films were heat-treated around the corresponding temperatures of the formation (Tform) of the MnBi phase. Table 2 displays the annealing temperatures for the distinct samples (Tann), around Tform.
I.
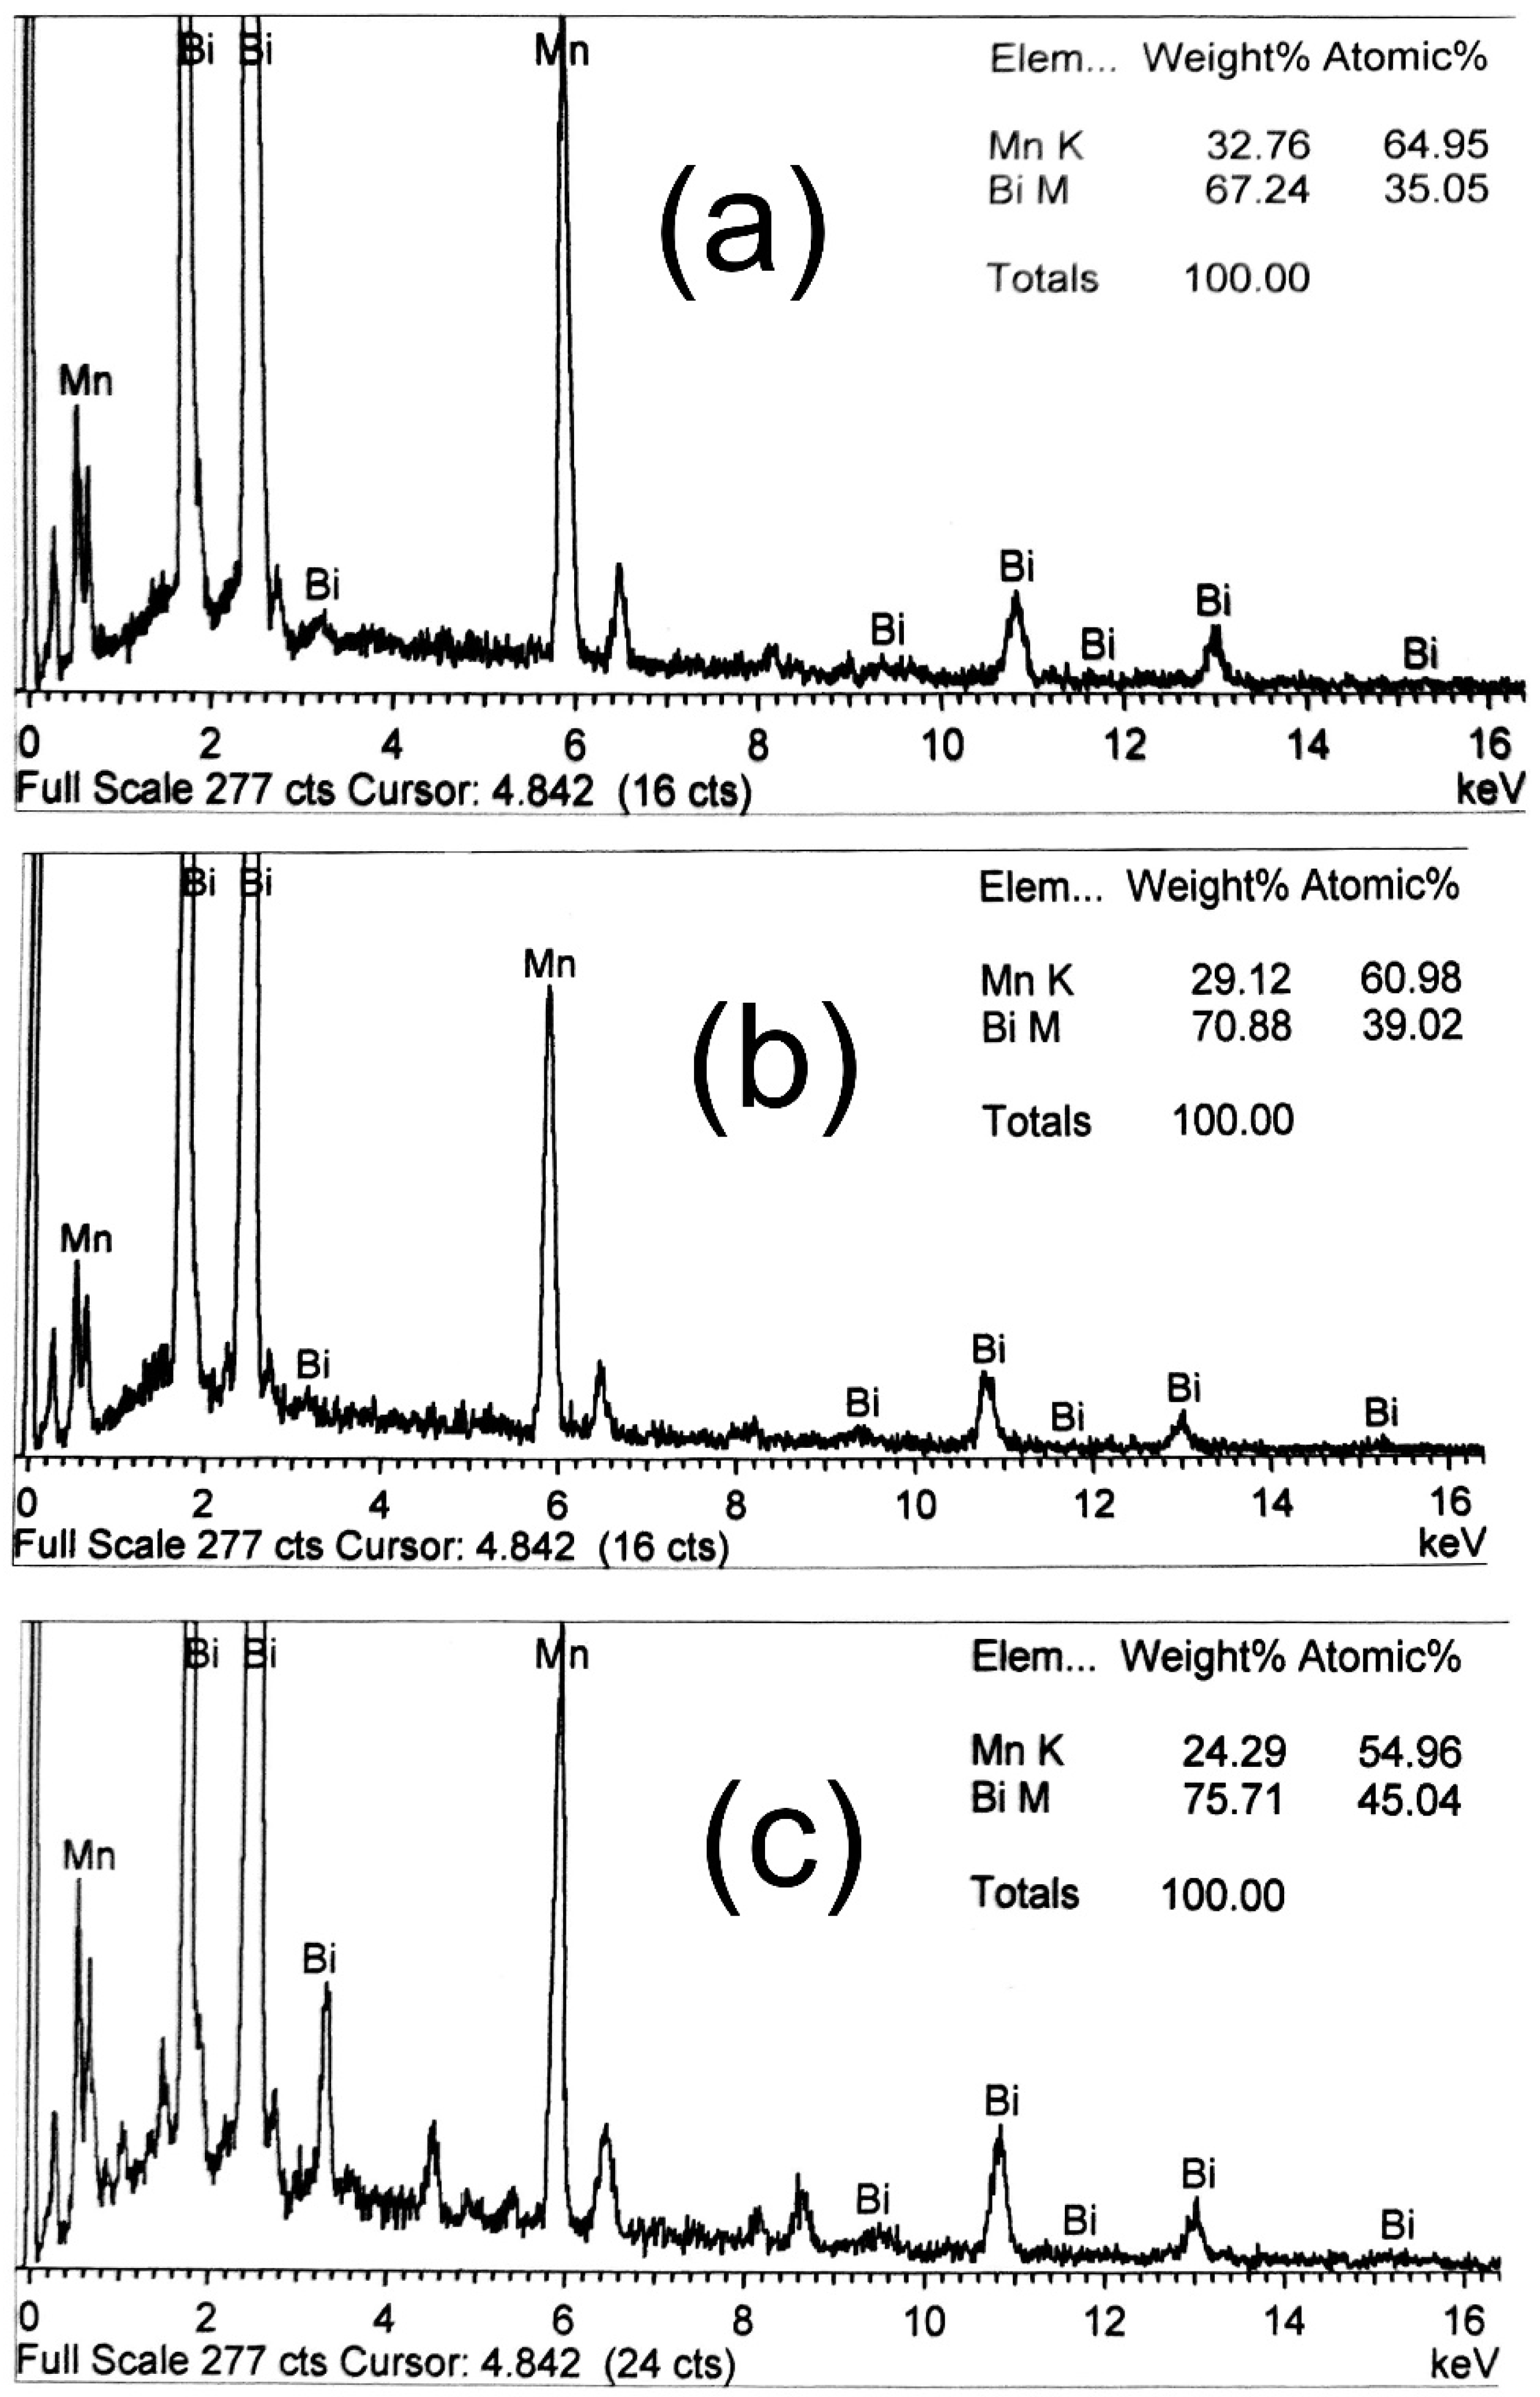
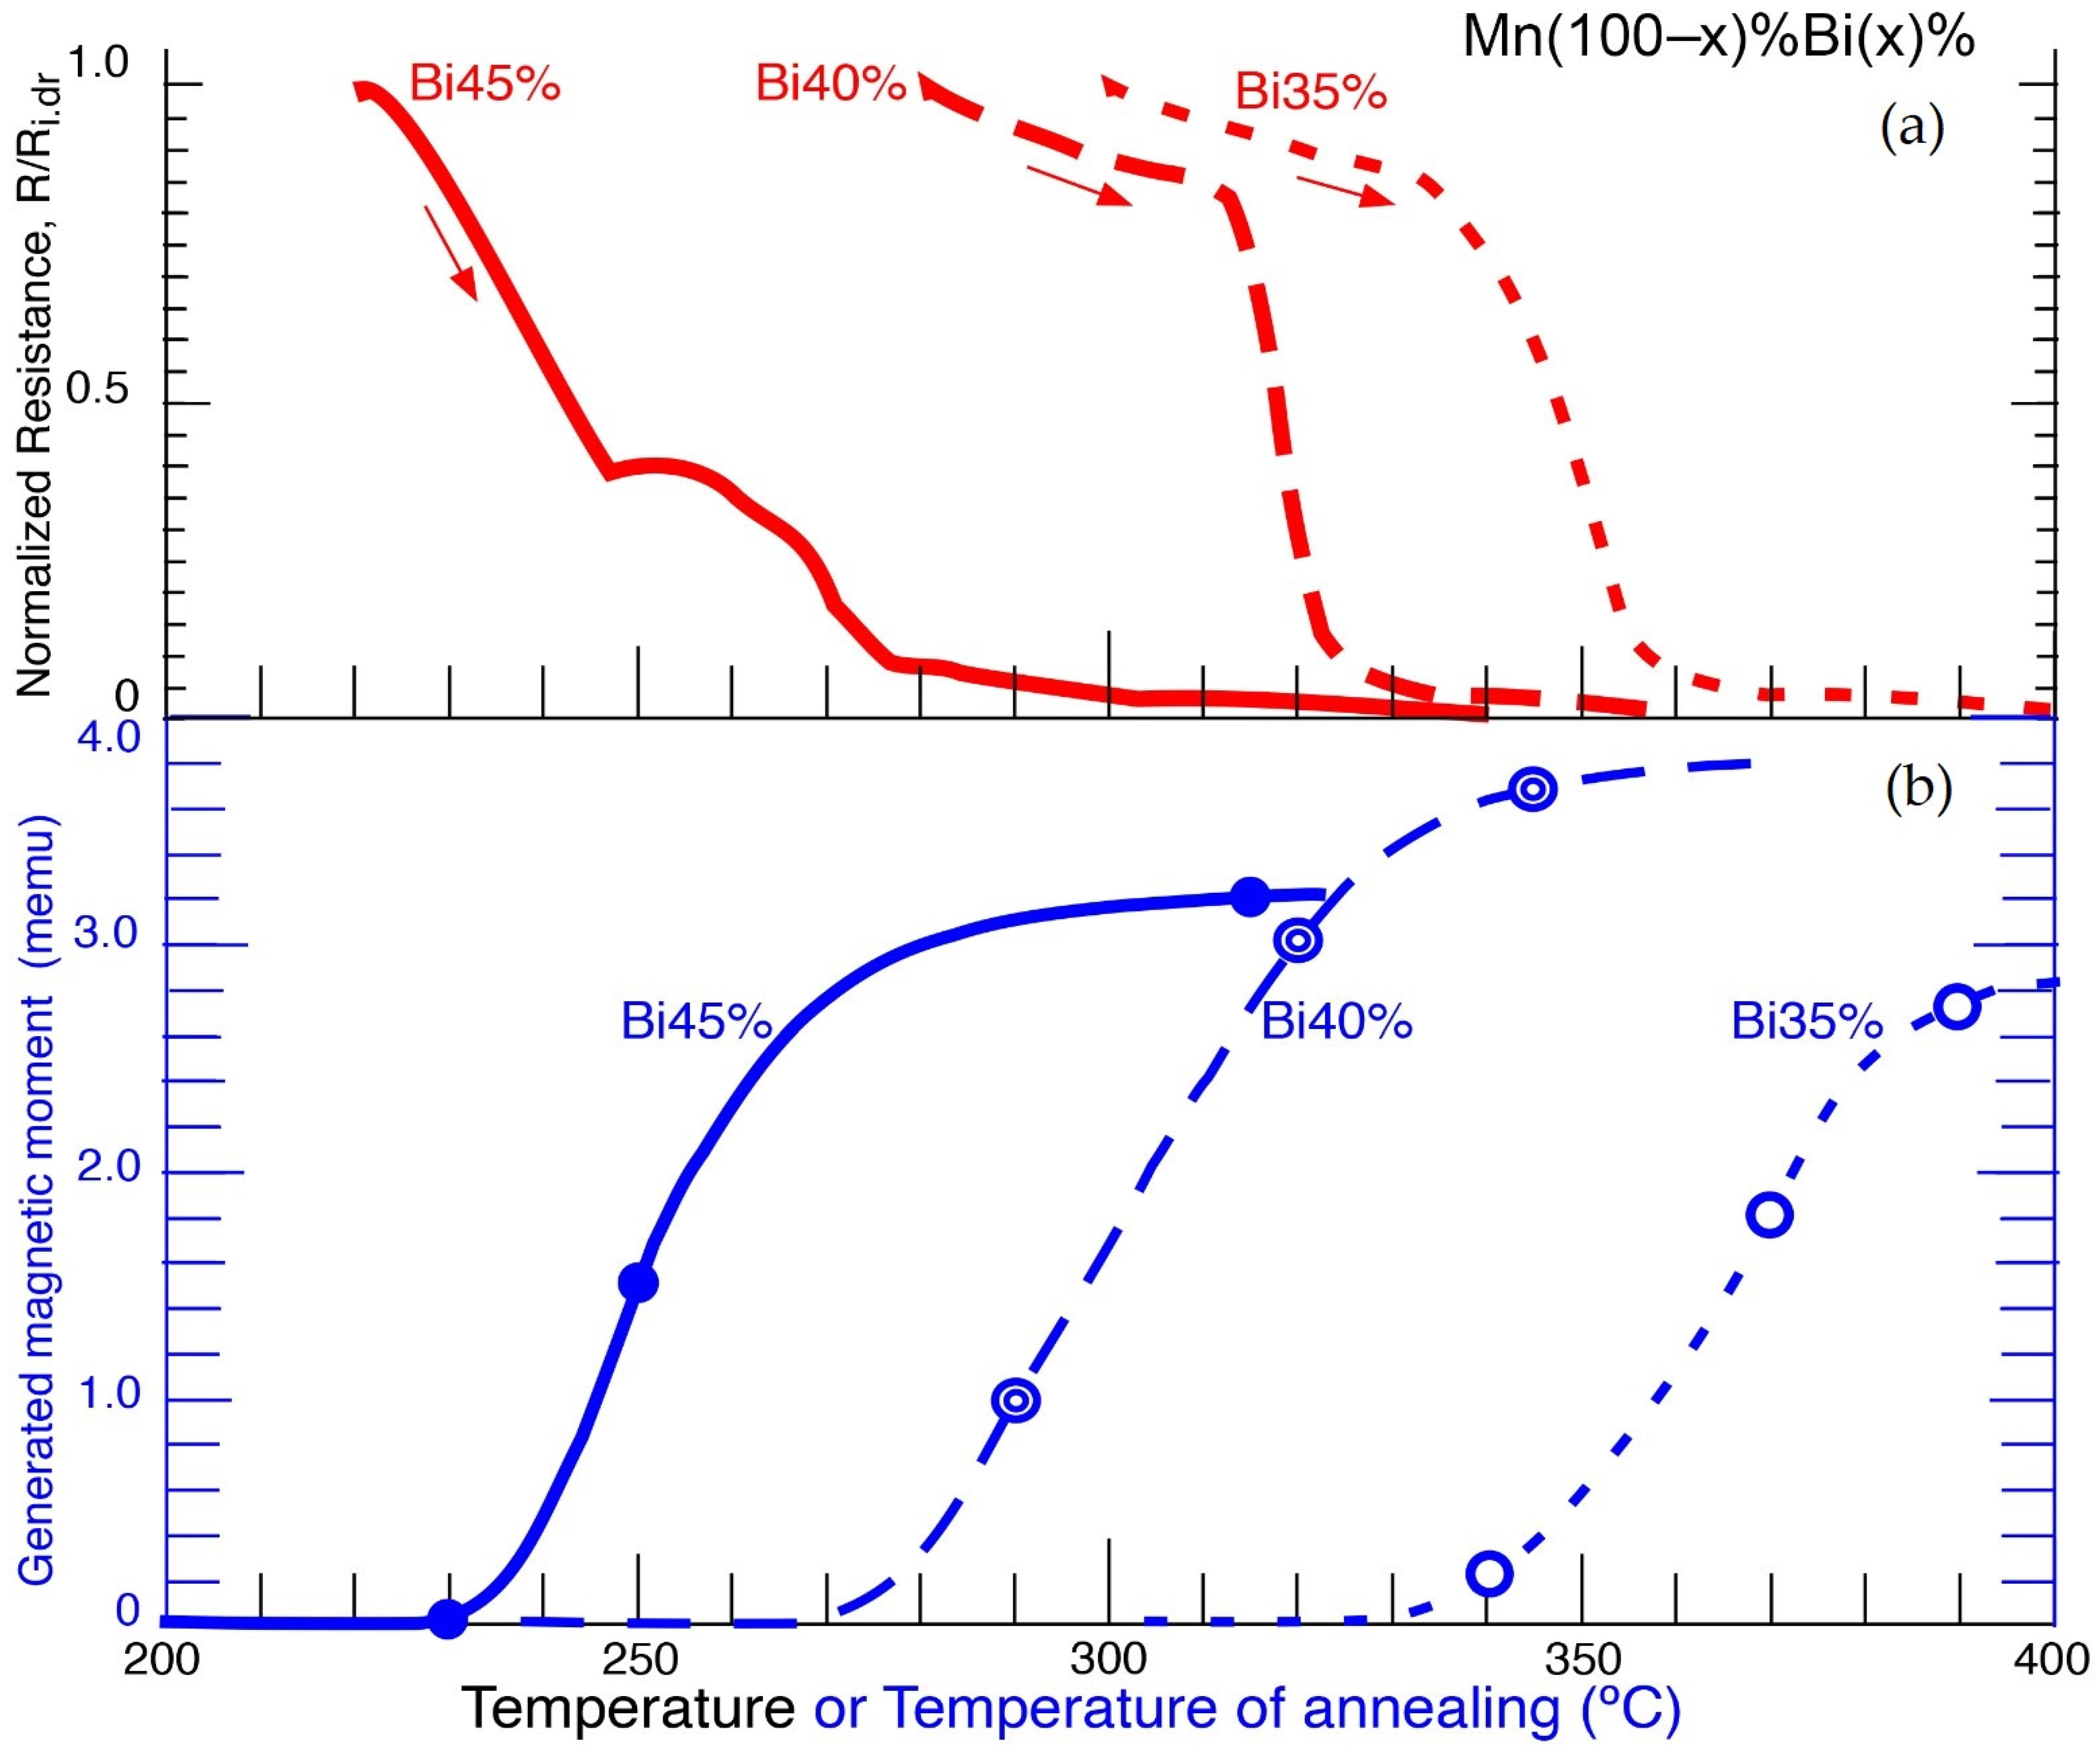
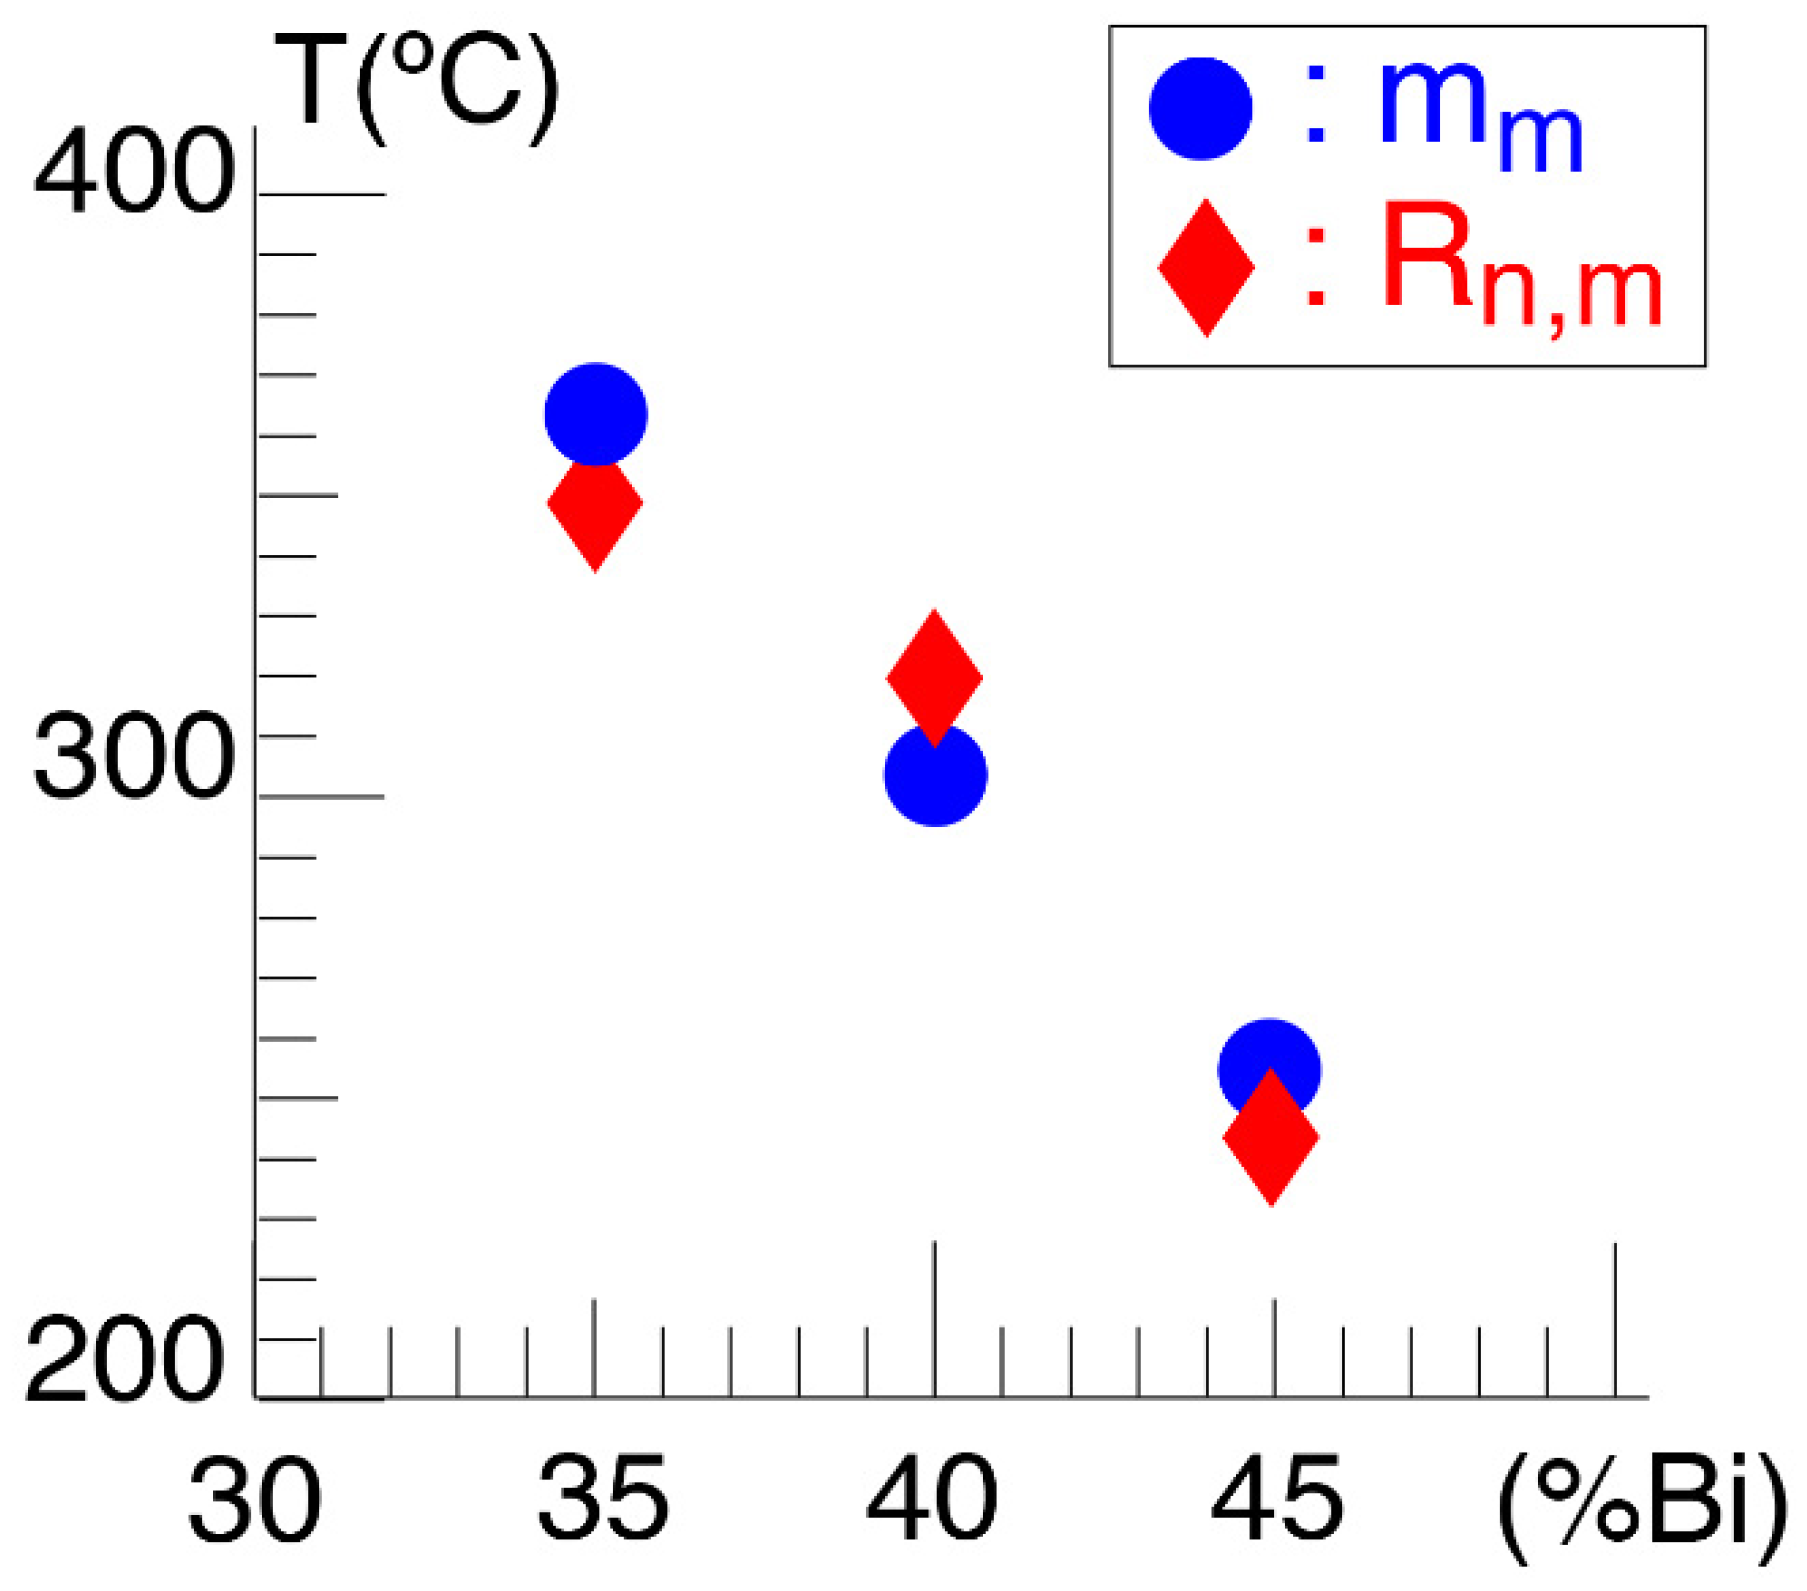
Sample I: Mn(65%)Bi(35%) Film
For Sample I, the SEM microanalysis probe indicated that the atomic composition of the film was Mn(65%)Bi(35%), cf. Table 1. The resistance of this sample was measured up to 400 °C in an inert Ar atmosphere. The resistance dropped as we increased the temperature from room-temperature to roughly 200 °C. This decrease in resistance was associated exclusively with changes in Bi, not to the formation of the MnBi phase [32]. However, upon annealing at higher temperatures, a second resistance drop in the temperature range from 340 to 360 °C was observed, as indicated in Figure 2a.
In order to correlate this new drop in resistance with possible structural and magnetic changes in the sample, we annealed several Mn(65%)Bi(35%) samples at temperatures around the temperature of this resistance drop. Figure 2b,e display respectively, the room- temperature X-ray diffraction pattern and magnetic hysteresis loops of the Mn(65%)Bi(35%) sample annealed at 340 °C, before the temperature of the resistance drop. The X-ray diffraction patterns were measured in the 2 theta range from 20 to 70 deg. Nevertheless, we only represent the range from 25 to 30 deg in Figure 2, where the sharpest diffraction maxima were observed. Thus, Figure 2b shows the characteristic (102) Bi peak and an incipient (101) MnBi diffraction maximum. Correspondingly, the room-temperature hysteresis loop of the 340 °C annealed sample (Figure 2e), showed a weak magnetic response to the applied magnetic field.
On increasing the annealing temperature to 370 °C, the formation of the magnetic MnBi phase took place in the Mn(65%)Bi(35%) sample. In Figure 2c, the intensity of the (101) MnBi diffraction peak increased, although the Bi (102) was still present in the X-ray diffraction pattern of the film. The magnetization of the 370 °C annealed sample also increased, as shown by the magnetic hysteresis loops of Figure 2f, when the magnetic field was applied in either the film plane, parallel configuration, or perpendicular to the film plane, in the perpendicular configuration.
Finally, on annealing the Mn(65%)Bi(35%) sample to 390 °C, the formation of the MnBi phase took place. Further heat treatments at higher temperatures did not modify either the X-ray diffraction patterns or the hysteresis loops of the sample. Thus, the X-ray diffraction pattern of the 390 °C annealed sample mainly showed the MnBi (101) diffraction peak and a residual Bi (102) maximum, cf. Figure 2d. Furthermore, an increase in the magnetization of this particular sample, with respect to the one annealed at 370 °C, was evident from the room-temperature magnetic hysteresis loops of Figure 2g. A slightly predominant growth in the MnBi grains with their c-axes perpendicular to the film plane seemed to occur, since the values of the magnetic moment of the annealed films were larger when the applied magnetic field was perpendicular to the film plane.
AFM images of the as-deposited Mn(35%)Bi(65%) sample are displayed in Figure 3a. In this sample, grains whose size are in the order of a few hundred nm, were observed on the surface of the film. The X-ray diffraction pattern of this sample, in the range from 20 to 70 deg, displayed the characteristic Bi (102) maximum, cf. Figure 3b. No peaks associated with Mn were observed, since this element seemed to grow in either an amorphous or nano-crystalline state [32]. A similar AFM image is shown for the 390 °C annealed sample in Figure 3c. In this image, the presence of larger particles of a size close to 1 μm was evidenced. The formation of these larger particles could be due to the growth in the LT-MnBi phase. Thus, the characteristic MnBi (101) diffraction peak was observed in the X-ray diffractogram of the 390 °C annealed sample, cf. Figure 3d.
II.
Sample II: Mn(60%)Bi(40%) Film
For Sample II, the atomic concentration was Mn(60%)Bi(40%) according to the EDX microanalysis, as shown in Table 1. The resistance of the Mn(60%)Bi(40%) sample was measured up to 360 °C in an inert Ar atmosphere, as indicated in Figure 4a. Additionally, a sharp resistance drop was observed in the temperature range from 315 to 325 °C.
In this sample, a correlation between the resistance drop and the structural and magnetic transformation of the Mn(60%)Bi(40%) sample was also found. In this way, Figure 4b,e display, respectively, the room-temperature X-ray diffraction pattern and magnetic hysteresis loops of the Mn(60%)Bi(40%) sample annealed at 290 °C before the structural and magnetic transformation. Figure 4b shows the characteristic Bi (102) peak and a weak MnBi (101) diffraction peak. For this sample, the corresponding room-temperature hysteresis loops, cf. Figure 4e, showed a small magnetic moment when the magnetic field was applied in the film plane or perpendicular to the film plane.
When the annealing temperature was increased to 320 °C, the formation of the magnetic MnBi phase took place on the Mn(60%)Bi(40%) sample. Thus, Figure 4c shows an increased intensity of the (101) MnBi diffraction peak, as well as the characteristic Bi (102) X-ray diffraction peak. The magnetization of the 320 °C annealed sample also increased with respect to the magnetization of the sample annealed at 290 °C, as shown by the magnetic hysteresis loops of Figure 4f. It is also worth pointing out that the magnetization of the Mn(60%)Bi(40%) sample increased with respect to the value found for the Mn(65%)Bi(35%) sample. This could be a consequence of the formation of a larger amount of the MnBi phase, since, in the Mn(60%)Bi(40%) film, the amount of Bi was larger than in the previous sample.
In a similar way as previously described for the Mn(65%)Bi(35%) sample, on annealing the Mn(60%)Bi(40%) film at 360 °C, the formation of the MnBi phase took place (no further changes in the X-ray diffraction pattern and in the magnetization of the sample took place on annealing at higher temperatures). The X-ray diffraction pattern of the 360 °C annealed film mainly showed the MnBi (101) diffraction peak and a weak Bi (102) peak, cf. Figure 4d. Similarly, an increase in the magnetic moment of this sample took place, as shown by the room-temperature magnetic hysteresis loops, for both orientations of the applied magnetic field with respect to the film plane, as seen in Figure 4g.
III.
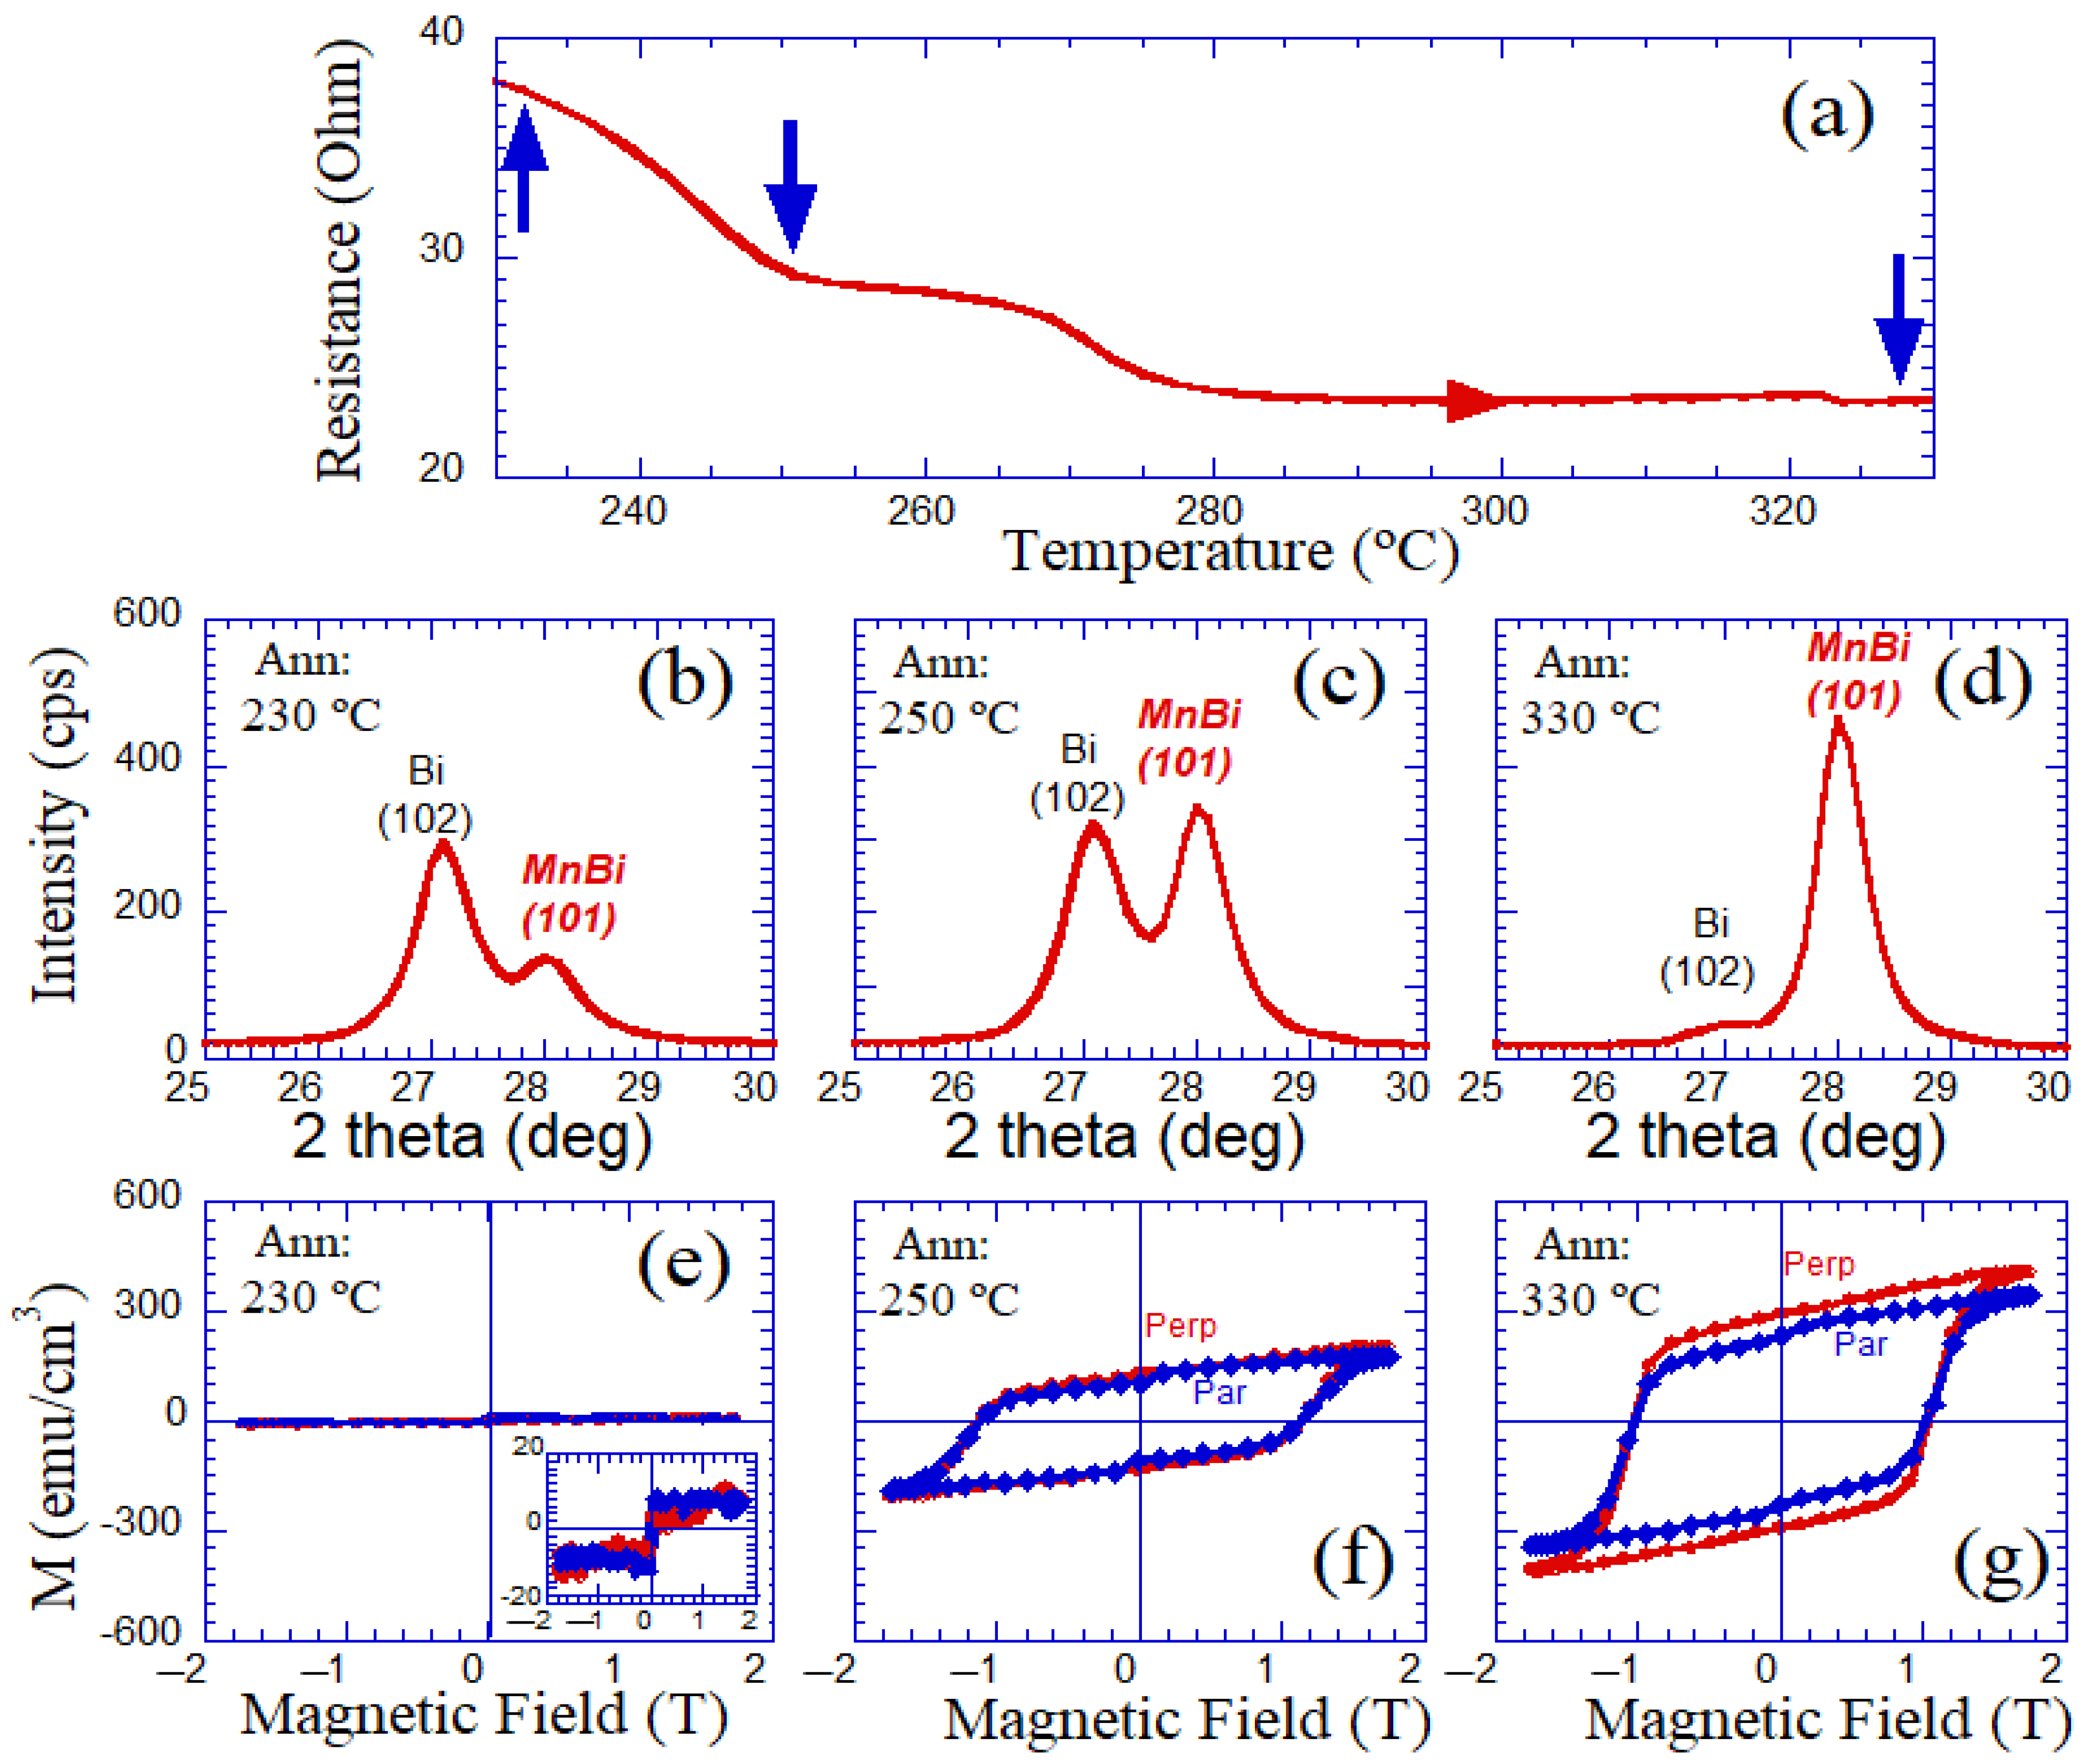
Sample III: Mn(55%)Bi(45%) Film
The atomic composition of this sample was Mn(55%)Bi(45%), from EDX microanalysis, cf. Table 1. In a similar way, the resistance of the Mn(55%)Bi(45%) sample was measured up to 330 °C in an inert dynamic Ar atmosphere, as shown in Figure 5a. The resistance of the sample decreased in the temperature range from 230 to 280 °C.
In this sample, a correlation was also found between the decrease in the resistance and the structural and magnetic transformation. Figure 5b,e display, respectively, the room-temperature X-ray diffraction pattern and magnetic hysteresis loops of the Mn(55%)Bi(45%) sample annealed at 230 °C. In a similar way, as described for previous samples before the structural and magnetic transformation, Figure 5b shows the Bi (102) peak and a small MnBi (101) diffraction peak. The room-temperature hysteresis loops (Figure 5e) show a small signal in both the parallel and in the perpendicular geometry.
When the annealing temperature was increased to 250 °C, an increase in the intensity of the (101) MnBi diffraction peak was observed, cf. Figure 5c. The characteristic Bi (102) X-ray diffraction peak was also observed in this figure, since the whole transformation had not fully occurred at 250 °C. The magnetization of the 250 °C annealed Mn(55%)Bi(45%) sample, shown in the room-temperature magnetic hysteresis loops of Figure 5f, also increased with respect to the magnetization of the sample annealed at 230 °C.
On annealing the Mn(55%)Bi(45%) film to 330 °C, the MnBi phase was formed in this sample, since, as in the two previous cases, no further structural or magnetic changes took place in the samples upon annealing at higher temperatures. Thus, the X-ray diffraction pattern of the 330 °C annealed film mainly showed the MnBi (101) diffraction peak and a residual Bi (102) peak, cf. Figure 5d. Similar to other samples, an increase in the magnetization of this film was evidenced through the room-temperature magnetic hysteresis loops, in both orientations, as shown in Figure 5g.
In this scenario, it is worth indicating that electrical resistivity is a physical property that changes by several orders of magnitude in different materials, for instance, from conductors to insulators. Furthermore, this physical property is very sensitive to structural transformations [35] within a particular material. Processes such as grain growth or structural transformations [36] may give rise to significant changes in the resistivity of a material. In thin film technology, the measurement of the resistance of a deposit is a very powerful tool in determining the structural changes in the samples, due to the particular geometry of the films. Thus, while some properties become difficult to estimate as a consequence of the reduced mass of the system, the situation is different for the measurement of the resistance of films.
The measurement of the change in the resistance of MnBi films as a function of temperature has already been reported [21,32,37]. However, in this work, we wanted to emphasize the validity of the resistance measurements in determining the varied temperature of the formation of the MnBi phase in samples, with different relative amounts of their constituents. Thus, in Figure 6a, we have plotted the normalized resistance change (R(T) − R(Tmax))/(R(Tidrop) − R(Tmax)) for the different samples in the temperature ranges from Tidrop, the temperature at which the resistances started to decrease, to Tmax, the maximum temperatures of the measurements. These resistance drops, connected to the formation of the magnetic MnBi phase, were monitored for the MnBi samples with different compositions. These resistance drops were simultaneous with the increase in the magnetization of the samples, due to the formation of the MnBi phase, as represented in Figure 6b.
Of particular note, and in comparison with the rest of the samples with lower Bi content, the sample with a larger amount of Bi showed a steep decrease in its resistance at a lower temperature, which was correlated with a reduced temperature for the formation of the MnBi phase. It has been proposed that the physical mechanism responsible for the formation of the MnBi phase, starting from the separated Mn and Bi layers, could be the atomic diffusion of Bi and Mn upon annealing [38]. This atomic diffusion process is, in general, ruled by an activation mechanism following the Arrhenius law. Therefore, in this scenario, the energy of activation depended upon the melting temperature of every particular element: the Bi melting temperature is 271 °C and the Mn melting temperature is 1248 °C. Consequently, the atomic diffusion coefficient in the temperature range described in this work would be larger for Bi atoms than for Mn atoms. For instance, the diffusion coefficient for Bi in the heat-treatment temperature range would be in the order of 10−13 m2s−1. Meanwhile, in the same temperature range, the diffusion coefficient for Mn atoms could be 10−25 m2s−1 [39]. Therefore, in the samples with a larger Bi content, the diffusion of Bi atoms, giving rise to the MnBi phase, would increase. Thus, the magnetic MnBi phase would grow at lower temperatures in the samples with larger relative Bi content. These results are summarized in Figure 7. This figure represents the temperatures of the maximum slope of the resistance vs. Bi atomic concentration. Simultaneously, the estimated temperatures at which the magnetization of the different samples reached half of its maximum value were also plotted.
The results from this work reinforce the findings reported from previous work with similar samples [38]. These particular samples had extra Bi capping and buffer layers. In these samples, the formation of the MnBi phase took place, even at lower temperatures (220 °C), as reported in Ref. [38].

4. Conclusions

It has been demonstrated that resistance changes took place simultaneously with structural transformations, particularly in MnBi films. Therefore, MnBi films with different relative compositions of their constituents were pulsed laser deposited. Thus, the Mn(65%)Bi(35%) as-deposited sample, experienced a steep decrease in its resistance at around 350 °C. This resistance change was accompanied by a structural and magnetic transformation, simultaneous to the formation of the magnetic MnBi phase. These transformations were demonstrated through the visualization of the characteristic MnBi (101) diffraction peak and the increase in the magnetization of the samples annealed above 350 °C. A similar situation was found in a Mn(60%)Bi(40%) as-deposited sample, although the temperatures of the resistance drop were around 320 °C for this sample. Again, the temperature range of the resistance drop roughly corresponded to the generation of the magnetic MnBi phase. Finally, in a Mn(55%)Bi(45%) as-deposited sample, the temperature range where the MnBi phase was formed was around 250 °C. In this way, resistance measurements might shed light on the formation of the MnBi phase, whose characteristic formation temperature depended on the relative concentration of Bi and Mn in these films: the higher the Bi content, the lower the temperature of the generation of the MnBi phase. Bi atomic diffusion is proposed as the mechanism responsible for the thermal dependence of the formation of the MnBi phase.

Author Contributions

J.V.: Conceptualization, Methodology, Investigation, Formal analysis, Visualization, Writing—original draft, Writing—review and editing. C.F.: Conceptualization, Investigation, Methodology, Formal analysis, Writing—review and editing. V.M.: Conceptualization, Visualization, Methodology, Investigation, Formal analysis, Writing—review and editing. All authors have read and agreed to the published version of the manuscript.

Funding

This research received no specific funding.

Conflicts of Interest

The authors declare no conflict of interest.

References

  1. Li, D.; Pan, D.; Li, S.; Zhang, Z. Recent developments of rare-earth-free hard-magnetic materials. Sci. China Phys. Mech. Astron. 2016, 59, 617501. [Google Scholar] [CrossRef]
  2. Guo, X.; Chen, X.; Altounian, Z.; Ström-Olsen, J.O. Magnetic properties of MnBi prepared by rapid solidification. Phys. Rev. B 1992, 46, 14578–14582. [Google Scholar] [CrossRef] [PubMed]
  3. Mohapatra, J.; Liu, J.P. Rare-earth–free permanent magnets: The past and the future. In Handbook of Magnetic Materials; Elsevier B.V.: Amsterdam, The Netherlands, 2018; Volume 27, pp. 1–57. [Google Scholar] [CrossRef]
  4. Müller, K.-H.; Sawatzki, S.; Gauss, R.; Gutfleisch, O. Permanent magnet materials and applications. In Handbook of Magnetism and Magnetic Materials; Springer: Berlin/Heidelberg, Germany, 2021. [Google Scholar] [CrossRef]
  5. Park, J.; Hong, Y.-K.; Lee, J.; Lee, W.; Kim, S.-G.; Choi, C.-J. Electronic Structure and Maximum Energy Product of MnBi. Metals 2014, 4, 455–464. [Google Scholar] [CrossRef] [Green Version]
  6. Rao, N.V.R.; Gabay, A.M.; Li, W.F.; Hadjipanayis, G.C. Nanostructured bulk MnBi magnets fabricated by hot compaction of cryomilled powders. J. Phys. D Appl. Phys. 2013, 46, 265001. [Google Scholar] [CrossRef]
  7. Marker, M.C.; Terzieff, P.; Kainzbauer, P.; Bobnar, M.; Richter, K.W.; Ipser, H. BiMn: Synthesis, separation by centrifugation, and characterization. J. Alloys Compd. 2018, 741, 682–688. [Google Scholar] [CrossRef]
  8. Mitsui, Y.; Umetsu, R.Y.; Takahashi, K.; Koyama, K. Reactive sintering process of ferromagnetic MnBi under high magnetic fields. J. Magn. Magn. Mater. 2018, 453, 231–235. [Google Scholar] [CrossRef]
  9. Xiang, Z.; Wang, T.; Ma, S.; Qian, L.; Luo, Z.; Song, Y.; Yang, H.; Lu, W. Microstructural evolution and phase transformation kinetics of MnBi alloys. J. Alloys Compd. 2018, 741, 951–956. [Google Scholar] [CrossRef]
  10. Cui, J.; Choi, J.-P.; Polikarpov, E.; Bowden, M.E.; Xie, W.; Li, G.; Nie, Z.; Zarkevich, N.A.; Kramer, M.J.; Johnson, D. Effect of composition and heat treatment on MnBi magnetic materials. Acta Mater. 2014, 79, 374–381. [Google Scholar] [CrossRef] [Green Version]
  11. Mitsui, Y.; Umetsu, R.Y.; Koyama, K.; Watanabe, K. Magnetic-field-induced enhancement for synthesizing ferromagnetic MnBi phase by solid-state reaction sintering. J. Alloys Compd. 2014, 615, 131–134. [Google Scholar] [CrossRef]
  12. Gabay, A.M.; Hadjipanayis, G.C.; Cui, J. Preparation of highly pure α-MnBi phase via melt-spinning. AIP Adv. 2018, 8, 056702. [Google Scholar] [CrossRef]
  13. Poudyal, N.; Liu, X.; Wang, W.; Nguyen, V.V.; Ma, Y.; Gandha, K.; Elkins, K.; Liu, J.P.; Sun, K.; Kramer, M.J.; et al. Processing of MnBi bulk magnets with enhanced energy product. AIP Adv. 2016, 6, 056004. [Google Scholar] [CrossRef] [Green Version]
  14. Xiang, Z.; Song, Y.; Pan, D.; Shen, Y.; Qian, L.; Luo, Z.; Liu, Y.; Yang, H.; Yan, H.; Lu, W. Coercivity enhancement and magnetization process in Mn55Bi45 alloys with refined particle size. J. Alloys Compd. 2018, 744, 432–437. [Google Scholar] [CrossRef]
  15. Zhang, D.; Geng, W.; Yue, M.; Liu, W.; Zhang, J.; Sundararajan, J.; Qiang, Y. Crystal structure and magnetic properties of MnxBi100−x (x=48, 50, 55 and 60) compounds. J. Magn. Magn. Mater. 2012, 324, 1887–1890. [Google Scholar] [CrossRef]
  16. Cui, J.; Choi, J.P.; Li, G.; Polikarpov, E.; Darsell, J.; Overman, N.; Olszta, M.; Schreiber, D.; Bowden, M.; Droubay, T.; et al. Thermal stability of MnBi magnetic materials. J. Phys. Condens. Matter 2014, 26, 064212. [Google Scholar] [CrossRef]
  17. Zhou, D.; Zhang, Y.-F.; Ma, X.-B.; Liu, S.-Q.; Chang-Sheng, W.; Zhu, M.-G.; Wang, C.-S.; Yang, J.-B. Preparation of Highly Textured Bi and MnBi Films by the Pulsed Laser Deposition Method. Chin. Phys. Lett. 2015, 32, 127502. [Google Scholar] [CrossRef]
  18. Zhang, Y.; Han, J.; Liu, S.; Tian, H.; Zhao, H.; Du, H.; Yang, Y.; Fang, Y.; Li, W.; Yang, J. Structural modification and ultra-high coercivity of nanostructural anisotropic MnBi/Bi films. Acta Mater. 2017, 128, 96–102. [Google Scholar] [CrossRef]
  19. Zhang, W.; Kharel, P.; Valloppilly, S.; Yue, L.; Sellmyer, D.J. High-energy-product MnBi films with controllable anisotropy. Phys. Status Solidi (B) 2015, 252, 1934–1939. [Google Scholar] [CrossRef]
  20. Kharel, P.; Li, X.Z.; Shah, V.R.; Al-Aqtash, N.; Tarawneh, K.; Sabirianov, R.F.; Skomski, R.; Sellmyer, D.J. Structural, magnetic, and electron transport properties of MnBi:Fe thin films. J. Appl. Phys. 2012, 111, 07E326. [Google Scholar] [CrossRef] [Green Version]
  21. Myagkov, V.G.; Bykova, L.E.; Yakovchuk, V.Y.; Zhigalov, V.S.; Volochaev, M.N.; Matsynin, A.A.; Tambasov, I.A.; Seredkin, V.A.; Patrin, G.S.; Bondarenko, G.N. Structural and magnetic features of solid-phase transformations in Mn/Bi and Bi/Mn films. J. Exp. Theor. Phys. Lett. 2016, 103, 254–259. [Google Scholar] [CrossRef]
  22. Sellmyer, D.J.; Kirby, R.D.; Chen, J.; Wierman, K.W.; Shen, J.X.; Liu, Y.; Robertson, B.W.; Jaswal, S.S. Magneto-optical and structural properties of nanocrystalline MnBi-based films. J. Phys. Chem. Solids 1995, 56, 1549–1555. [Google Scholar] [CrossRef]
  23. Hozumi, T.; LeClair, P.; Mankey, G.; Mewes, C.; Sepehri-Amin, H.; Hono, K.; Suzuki, T. Magnetic and structural properties of MnBi multilayered thin films. J. Appl. Phys. 2014, 115, 17A737. [Google Scholar] [CrossRef]
  24. Ito, M.; Tanaka, Y.; Satoh, T.; Mankey, G.; Schad, R.; Suzuki, T. Magnetic properties and structure of low temperature phase MnBi with island structure. AIP Adv. 2017, 7, 056226. [Google Scholar] [CrossRef]
  25. Sabet, S.; Hildebrandt, E.; Romer, F.; Radulov, I.; Zhang, H.; Farle, M.; Alff, L. Low-Temperature Phase c-axis Oriented Manganese Bismuth Thin Films With High Anisotropy Grown From an Alloy Mn55Bi45Target. IEEE Trans. Magn. 2016, 53, 2100306. [Google Scholar] [CrossRef]
  26. Moon, H.; Kim, S.; Jung, H.; Lee, H.-S.; Lee, W. Layer-number dependence of the magnetic properties of MnBi films. Appl. Surf. Sci. 2017, 420, 618–624. [Google Scholar] [CrossRef]
  27. Céspedes, E.; Villanueva, M.; Navío, C.; Mompeán, F.; García-Hernández, M.; Inchausti, A.; Pedraz, P.; Osorio, M.; Camarero, J.; Bollero, A. High coercive LTP-MnBi for high temperature applications: From isolated particles to film-like structures. J. Alloys Compd. 2017, 729, 1156–1164. [Google Scholar] [CrossRef]
  28. Quarterman, P.; Zhang, D.; Schliep, K.B.; Peterson, T.J.; Lv, Y.; Wang, J.-P. Effect of capping layer on formation and magnetic properties of MnBi thin films. J. Appl. Phys. 2017, 122, 213904. [Google Scholar] [CrossRef]
  29. Sun, M.; Xu, X.; Liang, X.; Sun, X.; Zheng, Y. Effect of oxidation on perpendicular magnetic behavior of MnBi thin films. J. Alloys Compd. 2016, 672, 59–63. [Google Scholar] [CrossRef]
  30. Chen, D.; Ready, J.F.; Bernal, G.E. MnBi Thin Films: Physical Properties and Memory Applications. J. Appl. Phys. 1968, 39, 3916–3927. [Google Scholar] [CrossRef]
  31. Chen, D. Preparation and Stability of MnBi Thin Films. J. Appl. Phys. 1971, 42, 3625–3628. [Google Scholar] [CrossRef]
  32. Vergara, J.; Favieres, C.; Madurga, V. MnBi hard magnetic films optimised through the correlation between resistivity, morphology and magnetic properties. J. Magn. Magn. Mater. 2019, 491, 165525. [Google Scholar] [CrossRef]
  33. Madurga, V.; Vergara, J.; Favieres, C. Influence of nature of the substrate on the soft magnetic properties of pulsed laser ablated-deposited amorphous Co. J. Magn. Magn. Mater. 2003, 254–255, 140–142. [Google Scholar] [CrossRef]
  34. Horcas, I.; Fernández, R.; Gómez-Rodriguez, J.M.; Colchero, J.; Gomez-Herrero, J.; Baro, A.M. WSXM: A software for scanning probe microscopy and a tool for nanotechnology. Rev. Sci. Instrum. 2007, 78, 13705. [Google Scholar] [CrossRef] [PubMed]
  35. Shekhawat, R.; Pamuluri, H.; Erkkara Madhavan, V.; Ramesh, K. Structural transformation and phase change properties of Se substituted GeTe. Nat. Sci. Rep. 2021, 11, 7604. [Google Scholar] [CrossRef] [PubMed]
  36. Favieres, C.; Vergara, J.; Madurga, V. Tailoring Magnetic and Transport Anisotropies in Co100−x–Cux Thin Films through Obliquely Grown Nano-Sheets. Magnetochemistry 2021, 8, 4. [Google Scholar] [CrossRef]
  37. Angadi, M.A.; Thanigaimani, V. Thickness dependence of temperature coefficient of resistance of MnBi films. Appl. Phys. A 1987, 44, 261–264. [Google Scholar] [CrossRef]
  38. Vergara, J.; Favieres, C.; Madurga, V. Magnetic domain configurations of pulsed laser deposited MnBi hard magnetic films. J. Magn. Magn. Mater. 2022, 554, 169316. [Google Scholar] [CrossRef]
  39. Mehrer, H. Diffusion in Solids; Springer Series in Solid-State Sciences; Springer: Berlin/Heidelberg, Germany, 2007. [Google Scholar] [CrossRef]
Figure 1. EDX spectra for the different MnBi samples; Sample I (a), Sample II (b) and Sample III (c).
Magnetochemistry 08 00082 g001
Figure 2. Resistance as a function of the temperature of the Mn(65%)Bi(35%) sample (a). The blue arrows over the resistance curve indicate the annealing temperatures. The red arrow indicates that the resistance was measured on increasing the temperature. X-ray diffraction patterns (bd) and room-temperature magnetic hysteresis loops (eg) of the 340, 370 and 390 °C annealed Mn(65%)Bi(35%) samples, respectively. Par and Perp indicate the parallel and perpendicular orientation of the magnetic field with respect to the film plane.
Magnetochemistry 08 00082 g002
Figure 3. AFM image and X-ray diffraction pattern of the as-deposited Mn(35%)Bi(65%) sample (a,b) respectively. For the 390 °C annealed sample, the AFM image is plotted in (c), while the corresponding X-ray diffraction pattern is shown in (d).
Magnetochemistry 08 00082 g003
Figure 4. Resistance as a function of the temperature of the Mn(60%)Bi(40%) sample (a). The blue arrows over the resistance curve indicate the annealing temperatures. The red arrow indicates that the resistance was measured on increasing the temperature. X-ray diffraction patterns (bd) and room-temperature magnetic hysteresis loops (eg) of the 290, 320 and 360 °C annealed Mn(60%)Bi(40%) samples, respectively. Par and Perp indicate the parallel and perpendicular orientation of the magnetic field with respect to the film plane.
Magnetochemistry 08 00082 g004
Figure 5. Resistance as a function of the temperature of the Mn(55%)Bi(45%) sample (a). The blue arrows over the resistance curve indicate the annealing temperatures. The red arrow indicates that the resistance was measured on increasing the temperature. X-ray diffraction patterns (bd) and room-temperature magnetic hysteresis loops (eg) of the 230, 250 and 330 °C annealed Bi(45%)Mn(55%) samples, respectively. The inset of Figure (e) shows the enlarged magnetization curves of the sample. Par and Perp indicate the parallel and perpendicular orientation of the magnetic field with respect to the film plane.
Magnetochemistry 08 00082 g005
Figure 6. Normalized resistance change as a function of the temperature for the different samples (a). The arrows indicated that the resistance was measured on increasing the temperature. Generated magnetic moment as a function of the annealing temperature for the different MnBi samples. Continuous and dashed lines are visual guides in (b).
Magnetochemistry 08 00082 g006
Figure 7. Temperatures of the maximum slope of the resistance drop (Rn,m) and estimated temperatures where half of the total magnetic moment of the samples (mm) was formed. The former temperatures are represented as a function of the atomic content of Bi in the samples.
Magnetochemistry 08 00082 g007
Table 1. Summary of the deposition times, thicknesses and composition of the different samples.
SampleDeposition TimeThicknessComposition (at %)
Sample I(Bi7sMn20s)40(Bi2.2nmMn1.4nm)40Mn(65%)Bi(35%)
Sample II(Bi8.5sMn20s)40(Bi2.7nmMn1.4nm)40Mn(60%)Bi(40%)
Sample III(Bi10sMn20s)40(Bi3.2nmMn1.4nm)40Mn(55%)Bi(45%)
Table 2. Annealing temperatures for the assorted films.
Sample CompositionTann < TformTformTann > Tform
Mn(65%)Bi(35%)340 (°C)370 (°C)390 (°C)
Mn(60%)Bi(40%)290 (°C)320 (°C)360 (°C)
Mn(55%)Bi(45%)230 (°C)250 (°C)330 (°C)
Publisher’s Note: MDPI stays neutral with regard to jurisdictional claims in published maps and institutional affiliations.

