Article

Structure and Lattice Dynamics of Bi1−xNdxFeO3 and Bi1−xGdxFeO3 Ceramics near the Morphotropic Phase Boundary

by
Valery R. Sobol
1,*,
Kazimir I. Yanushkevich
2,
Siarhei I. Latushka
2,
Dmitry V. Zhaludkevich
2,
Kapiton N. Nekludov
3,
Maxim V. Silibin
3,4,
M. I. Sayyed
5,
Nouf Almousa
6,
Barys V. Korzun
7,
Olga N. Mazurenko
8 and
Dmitry V. Karpinsky
2,*
1
Faculty of Physics and Mathematics, Belarusian State Pedagogical University, 220030 Minsk, Belarus
2
Scientific-Practical Materials Research Centre of NAS of Belarus, 220072 Minsk, Belarus
3
Institute of Advanced Materials and Technologies, National Research University of Electronic Technology “MIET”, 124498 Zelenograd, Moscow, Russia
4
Scientific-Manufacturing Complex “Technological Centre”, 124498 Zelenograd, Moscow, Russia
5
Department of Physics, Faculty of Science, Isra University, Amman 1162, Jordan
6
Department of Physics, College of Science, Princess Nourah Bint Abdulrahman University, P.O. Box 84428, Riyadh 11671, Saudi Arabia
7
Borough of Manhattan Community College, The City University of New York, New York, NY 10007, USA
8
Belarusian Republican Foundation for Fundamental Research, 220072 Minsk, Belarus
*
Authors to whom correspondence should be addressed.
Magnetochemistry 2022, 8(9), 103; https://doi.org/10.3390/magnetochemistry8090103
Submission received: 4 August 2022 / Revised: 9 September 2022 / Accepted: 12 September 2022 / Published: 15 September 2022
(This article belongs to the Special Issue Magnetic Multiferroics)

Abstract

:
The crystal structures of Bi1−xNdxFeO3 and Bi1−xGdxFeO3 solid solutions (0 ≤ x ≤ 0.2) with chemical compositions across structural transformations from the polar rhombohedral phase to the orthorhombic phase with an antipolar distortion and then to the nonpolar orthorhombic phase have been investigated using X-ray diffraction and infrared reflective spectrometry. The obtained results clarify details of the structural transitions assuming the changes that occurred in the crystal lattice dynamics of the compounds. Increase in the dopant content causes a notable change in the intensity and position of the reflectance lines at 18.2 μm and 22.6 μm (550 cm−1 and 440 cm−1) ascribed to the transverse optical phonon modes associated with Bi (Nd, Gd)–O and Fe–O bonds. In the concentration region attributed to the dominant rhombohedral phase, the chemical substitution leads to an increase in intensity of the modes A1 for solid solutions of both systems. Meanwhile, in the case of Gd doping, the mode A1 shifts towards the red side of the spectrum, but there is an opposite tendency in the case of Nd doping; the intensity of the modes E decrease regardless of both the dopant-ion type and concentration. This behavior is discussed assuming the change in mass for the chain of chemical bonds caused by different dopant ions and the structural transformations occurring in the compounds upon chemical doping.

1. Introduction

Ceramics based on iron complex oxides (ferrites) attract the attention of researchers due to their fundamental significance and potential for practical applications mainly associated with multiple concentration-driven structural transitions accompanied by a notable change in physicochemical parameters of the compounds [1,2,3,4,5]. In the vicinity of the phase transitions, bismuth-ferrite-based solid solutions are characterized by a notable improvement in physical properties caused by the formation of a metastable structural state in such compounds [6,7,8,9,10]. It is assumed that the metastable state is conditioned by a coexistence of the adjacent structural phases and is accompanied with a decrease in the characteristic sizes of these phases down to the nanoscale level. This structural state assumes the presence of a quantity of different structural defects, inhomogeneous distribution of mechanical stresses, local fluctuations in chemical composition, vacancies of oxygen and cations, etc. [6,7,8], which reduce the thermodynamic stability of the compounds and increase sensitivity to external influences—temperature, electric field, magnetic field, pressure, etc.
In the pristine BiFeO3, the substitution of Bi ions by rare earth elements with similar ionic radii (La, Pr, Nd, Sm, Eu, Gd) leads to a concentration-driven structural transformation from the rhombohedral to the orthorhombic phase, and the mentioned structural modification assumes a formation of an intermediate antipolar orthorhombic phase [11,12]. The most favorable physical parameters were found for solid solutions with chemical compositions near the morphotropic phase boundary (MPB) between the polar active rhombohedral phase (R-phase) and the antipolar orthorhombic (O*-phase) phase [13]. The concentration region specific to the MPB consisting of the R- and O- phases essentially depends on the sort and concentration level of the rare-earth elements. Thus, the chemical substitution by lanthanum ions causes a formation of the mentioned MPB region in the concentration range 15–20 mol. % of the La ions; doping by praseodymium ions shifts the two-phase region to 13–17 mol. %; further decrease in the ionic radius of the substituting ion leads to a contraction of the MPB region along with a reduction in its concentration level [12]. Despite the obvious role of size effect, the mentioned structural transition from the R- to the O- phases is also determined by the oxygen stoichiometry, electronic configuration of the dopant ions and features of the chemical bonds’ character, lattice dynamics, local defects caused by the vacancies in A- and B- perovskite sublattices, and other factors [12].
The available studies, e.g., Refs. [9,10,11,12] dedicated to the crystal structure of Bi1−xRExFeO3 ceramics are mainly focused on the size effect (n.b. r(Bi3+)CN8 = 1.17 Å3, r(Nd3+)CN8 = 1.109 Å3, r(Gd3+)CN8 = 1.053 Å3 [2]) and electronic configuration of the dopant ions as the key factors affecting the structural phase transitions. Along with the mentioned factors, the present paper highlights the effect of the ionic masses of the dopant ions—Nd and Gd (m(Nd) = 144.24 u, m(Gd) = 157.2 u, m(Bi) = 208.98 u)—on the structural stability of the polar rhombohedral phase and the structural transformation to the antipolar or the nonpolar orthorhombic phases. Such chemical doping scheme has allowed us to itemize the factors governing the structural transitions across the phase boundary regions ‘rhombohedral—antipolar orthorhombic’ and ‘antipolar orthorhombic—nonpolar orthorhombic’ located in the dopant concentration ranges x ≤ 0.2 for both solid solutions. The relationship between the crystal structure of the solid solutions and the perovskite lattice dynamics of the respective phases has also been analyzed using a combination of results obtained by X-ray diffraction and FT-IR spectroscopy methods.

2. Experimental Section

Ceramic compounds Bi1−xNdxFeO3 and Bi1−xGdxFeO3 (x = 0–0.2 with a step of 5 mol. %) were prepared using the solid-state reaction method from stoichiometric mixtures of the simple oxides Bi2O3, Fe2O3, Nd2O3, Gd2O3 [9,14]. The powders were rigorously mixed in a planetary ball mill using ethanol as a medium, then pressed in pellet form and calcined at ~700 °C for 3 h, then ground again, pressed and synthesized at 800–900 °C for 8 h (temperature increases with the dopant’s concentration); the ceramics were furnace cooled to room temperature from the synthesis temperature. The structure of the cermic compounds was studied based on the diffraction results obtained at room temperature using a DRON-3M laboratory diffractometer with λ = 1.5406 Å in 2θ range of 20°–70° with a scanning rate of 5 deg./min and a step of 0.02 deg. The diffraction data were refined by FullProf software using the Rietveld method [15]. The reflectance FT-IR spectra in the mid-IR region were obtained at room temperature using an FT-IR spectrometer (VERTEX 80 v, Bruker). The samples were prepared in the form of cylindrical pellets 8 mm in diameter and 1.4 mm in height obtained under a pressure of ~5 GPa, the surface was polished to an optical quality (class 12, rms roughness ~0.2 µm), the incident angle of the testing radiation beam was ~1.2 rad. An aluminum mirror (R = 97 %) and a single crystal silicon wafer were used for calibrating the absolute values of the reflection coefficient.

3. Results

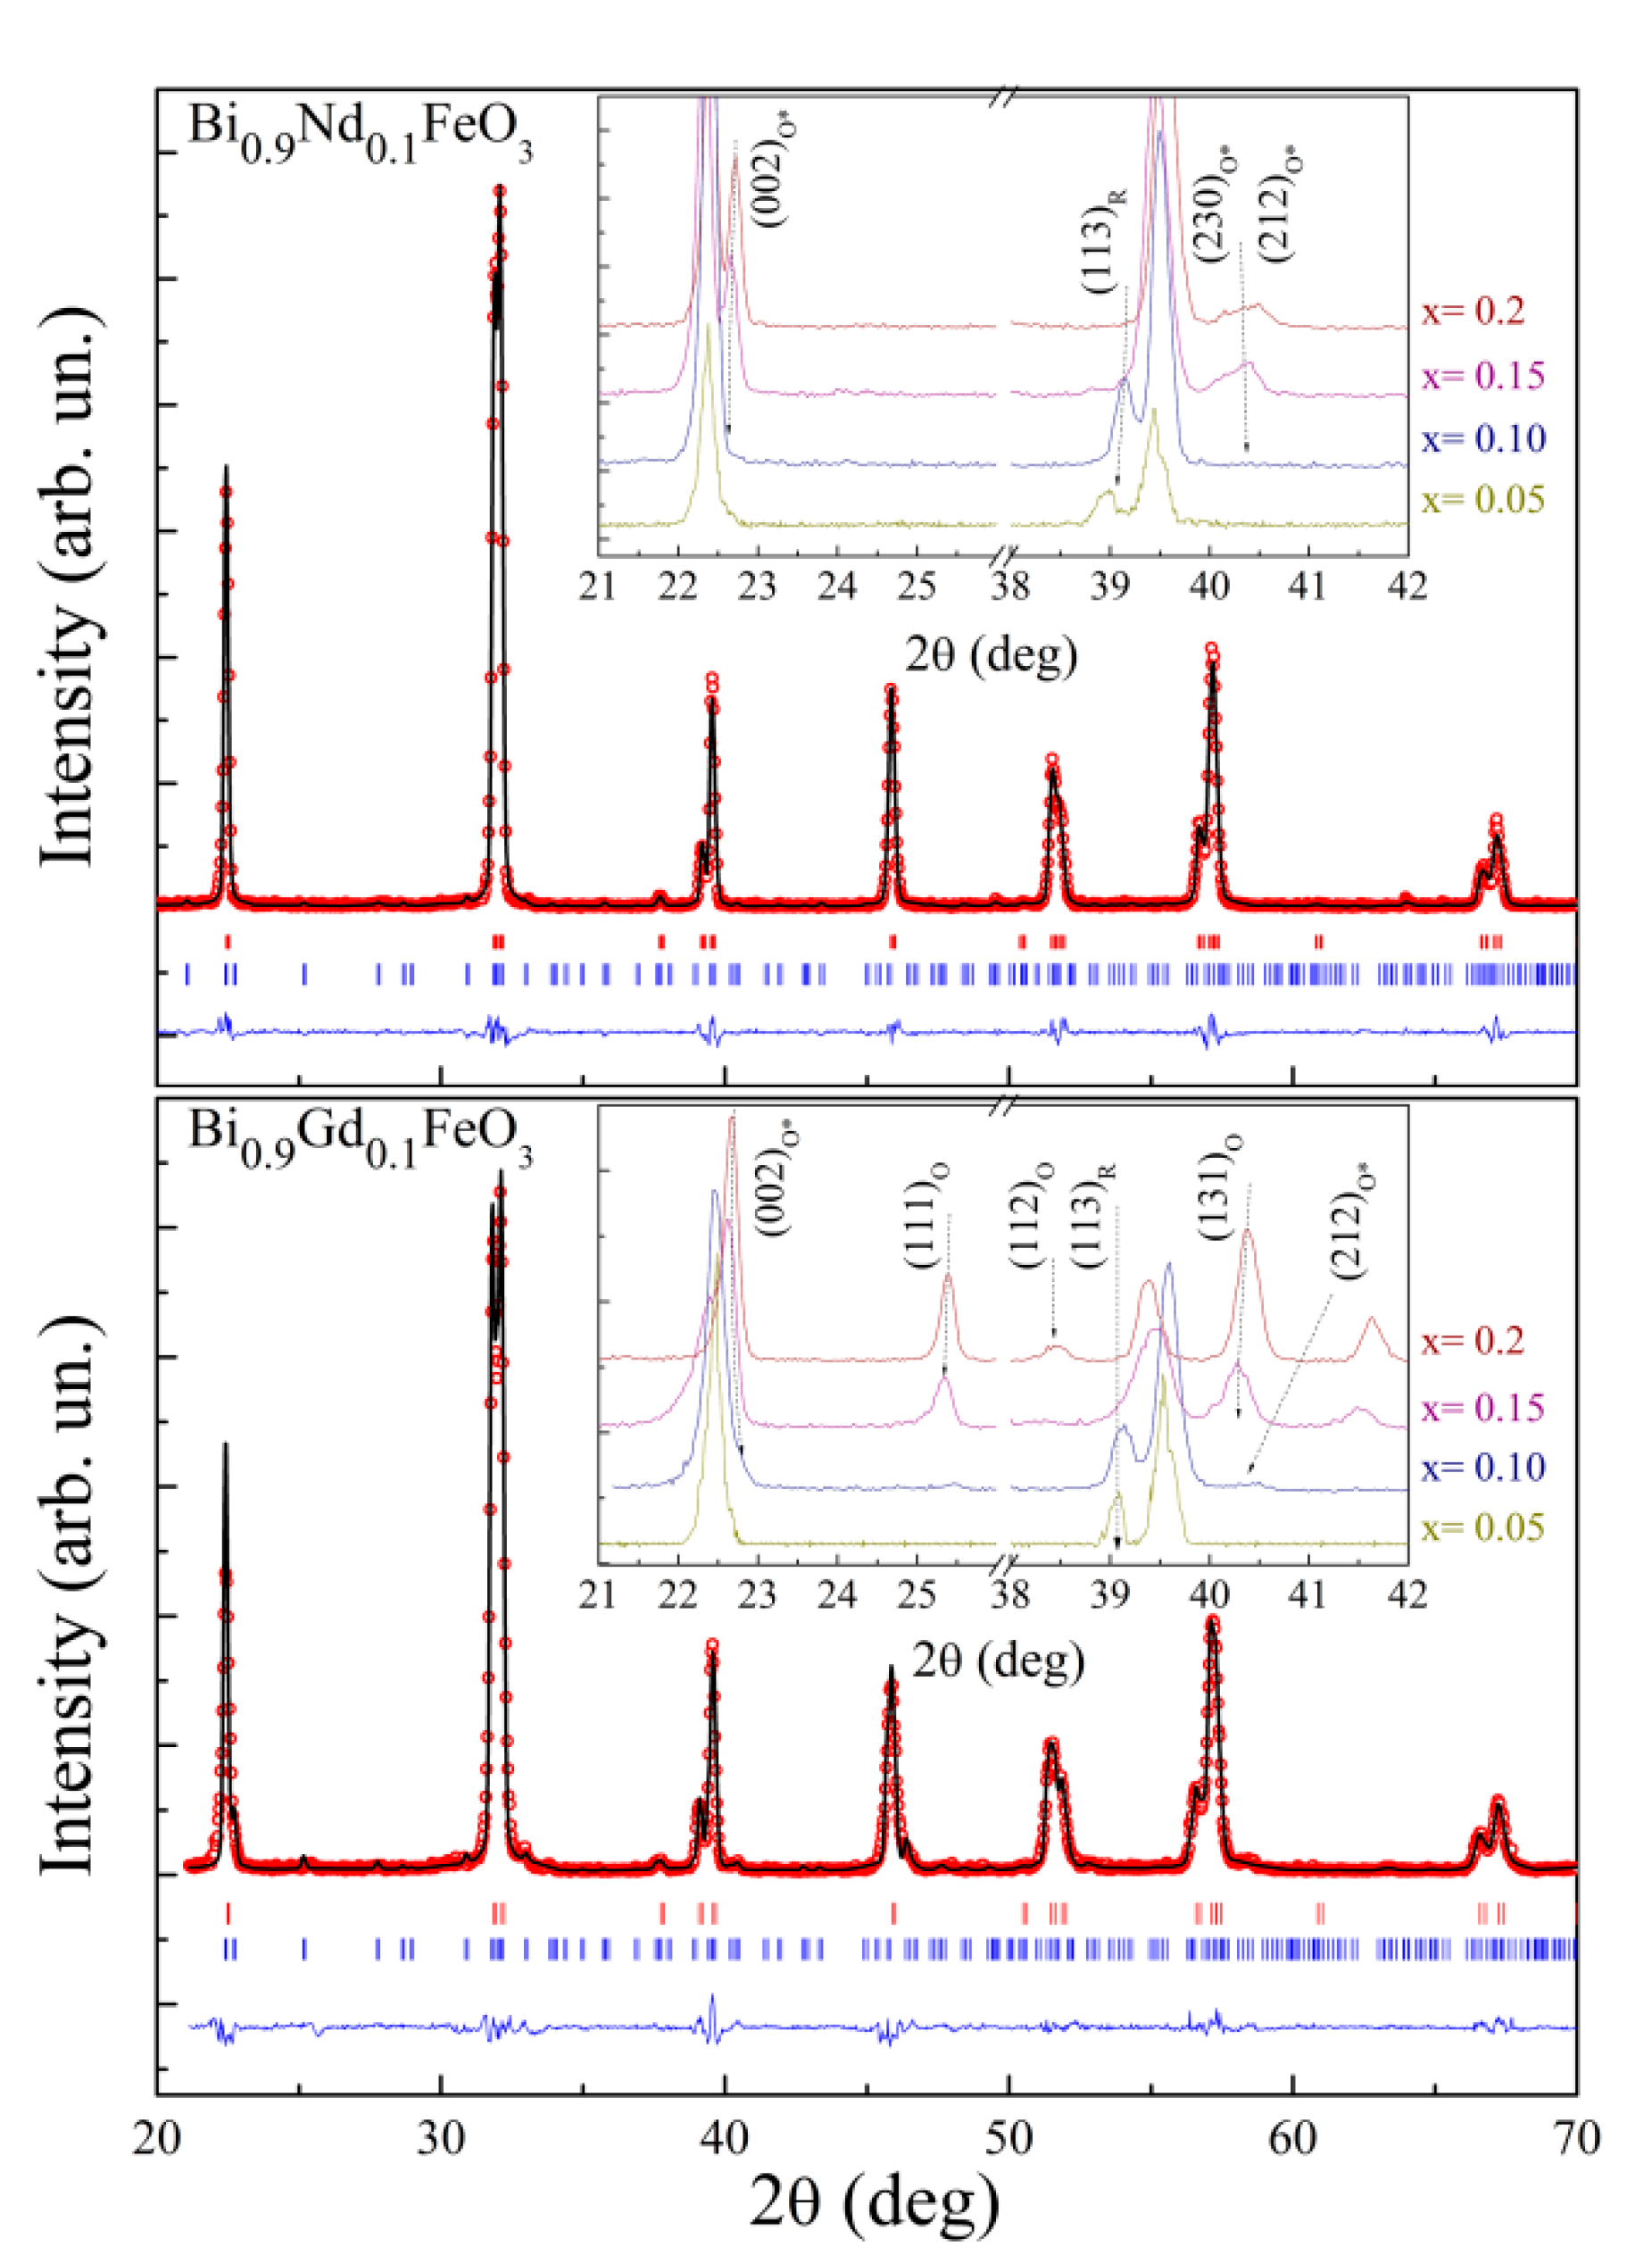
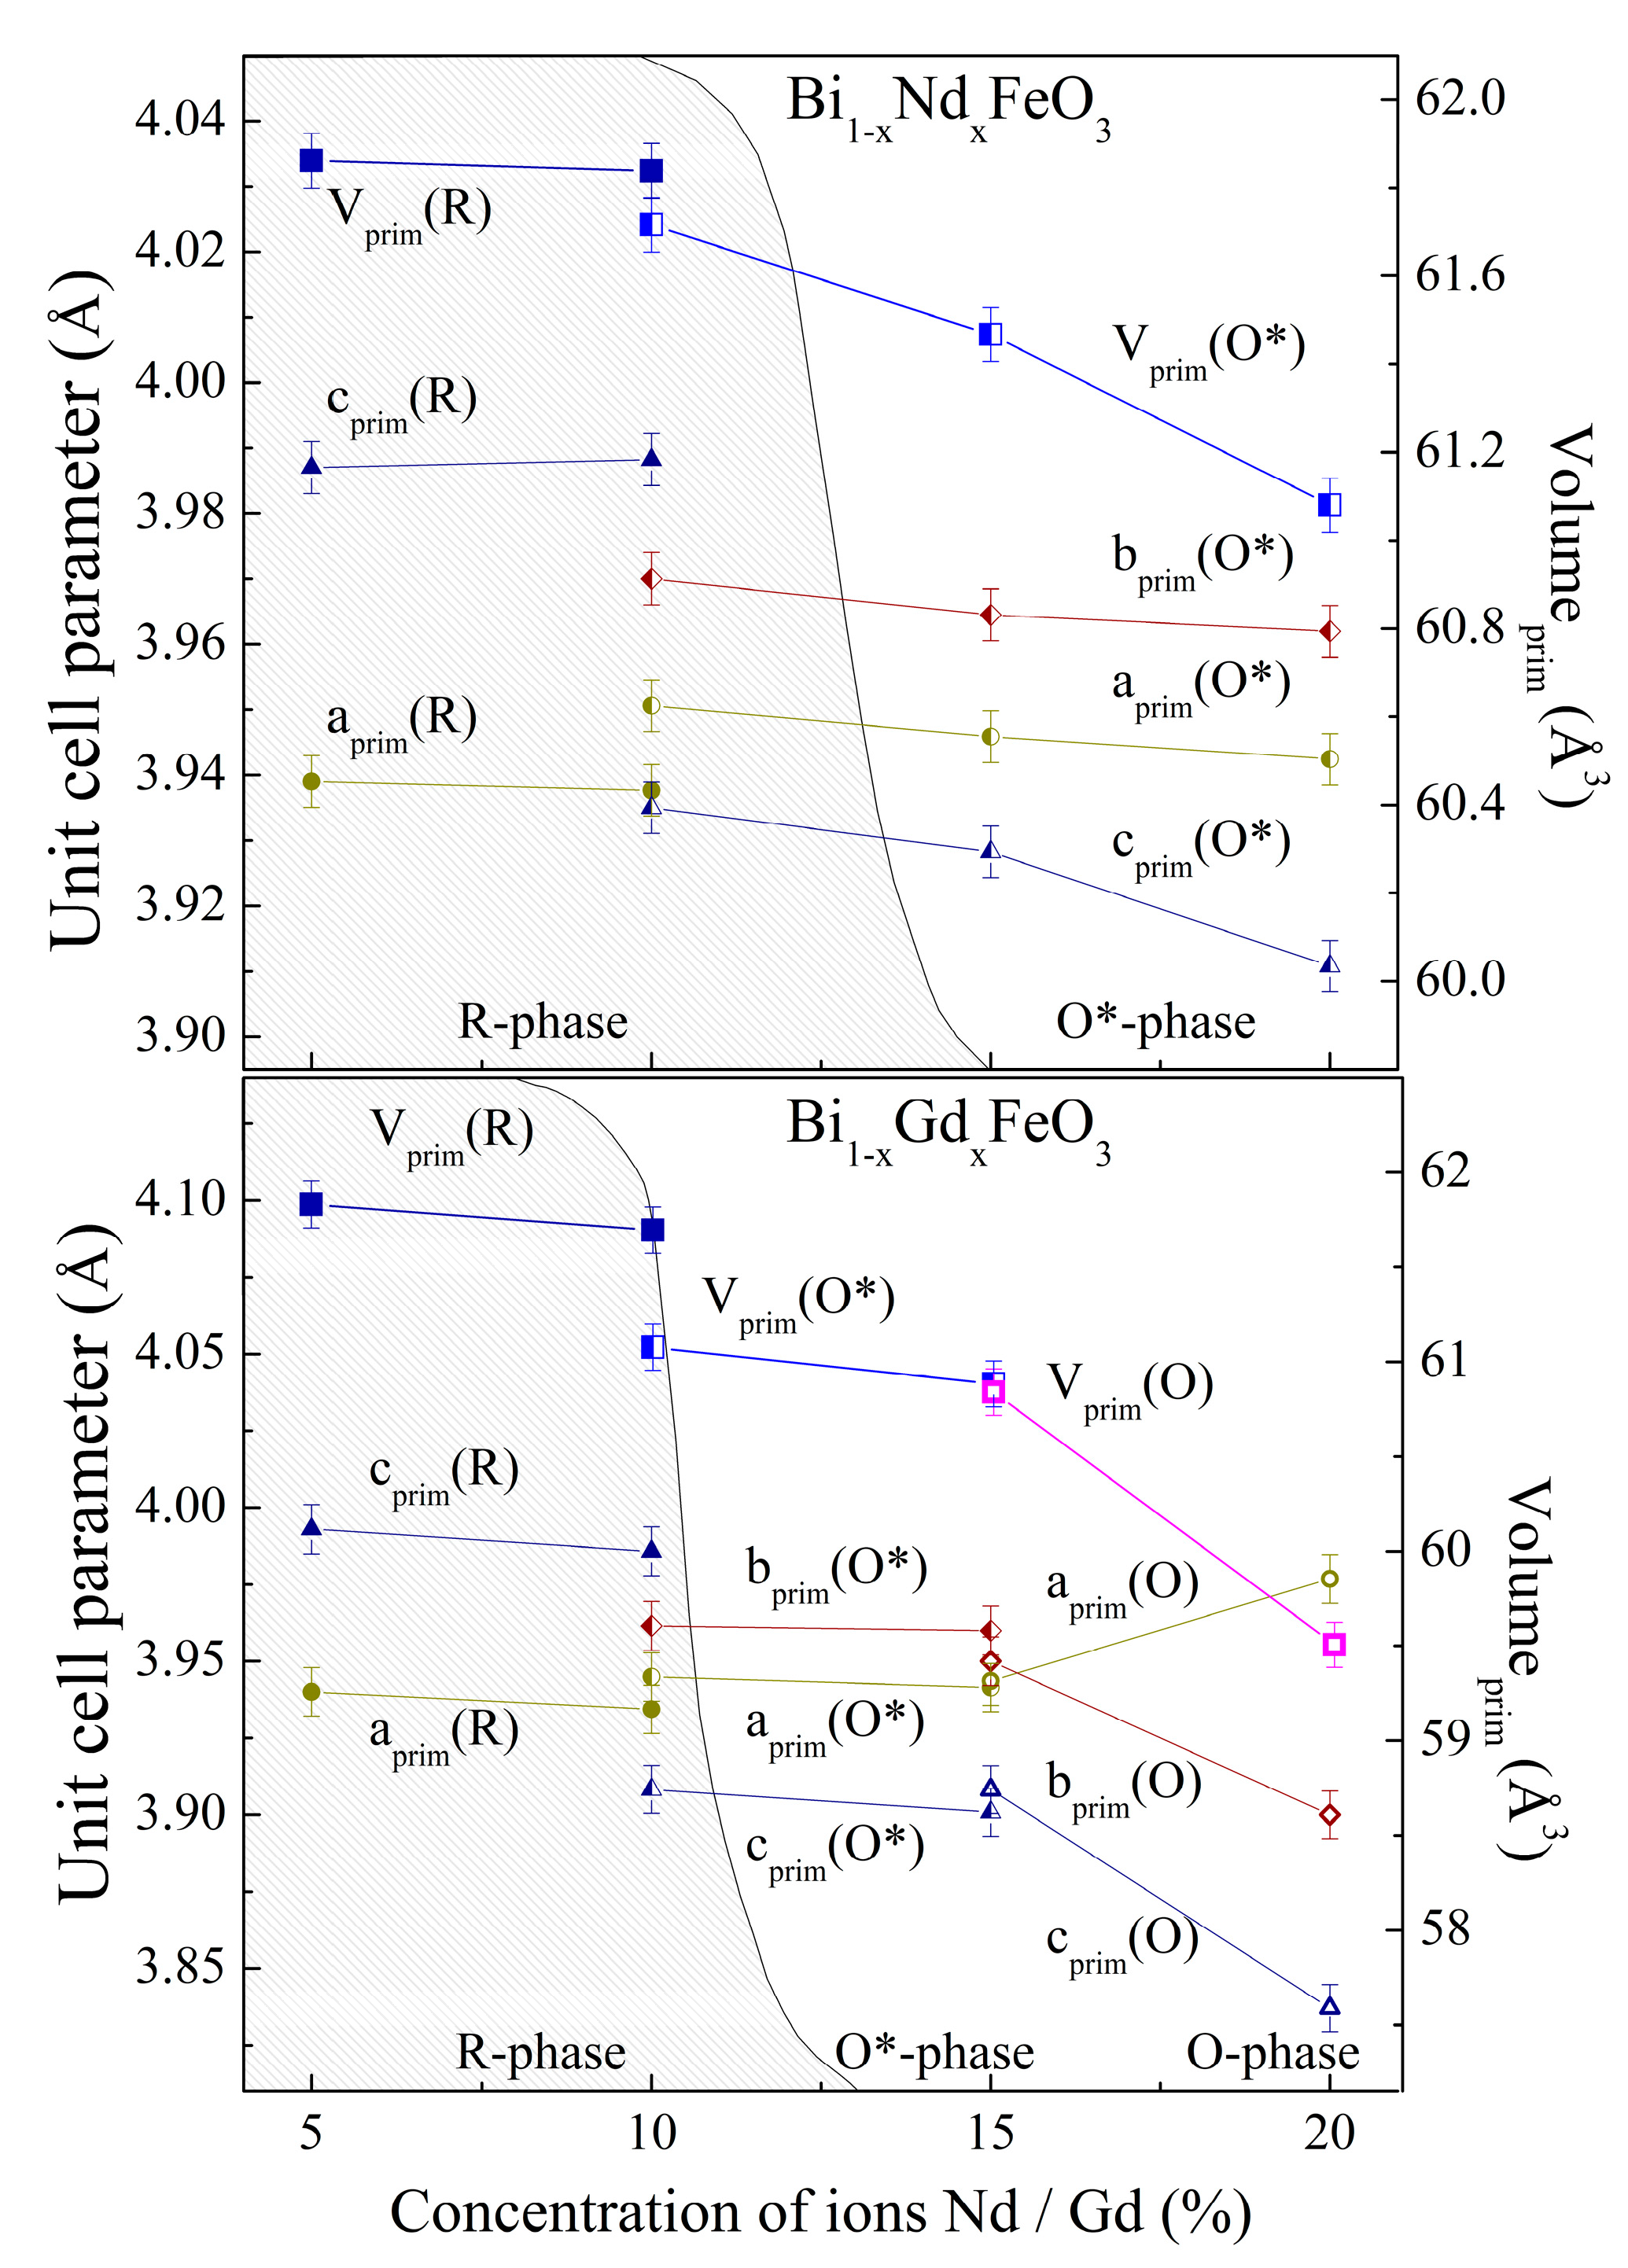
3.1. Analysis of the Crystal Structure by Diffraction Measurements

The results of diffraction measurements obtained for Bi1−xNdxFeO3 ceramics with a dopant concentration x < 0.10 indicated the formation of compounds with a single-phase rhombohedral structure described by the space group (s. g.) R3c (R-phase, metric √2ap · √2ap · 2√3ap, where apa parameter of pseudocubic unit cell) (Figure 1). An increase in the dopant content leads to the formation of the antipolar orthorhombic phase refined using the s. g. Pbam (O*-phase, metric √2ap · 2√2ap · 2ap). The most characteristic reflections ascribed to the rhombohedral and antipolar orthorhombic phases are marked, as seen in the insets of the Figure 1. The XRD pattern recorded for the compound with x = 0.15 was refined using the single-phase model assuming an antipolar orthorhombic structure. The compound with x = 0.2 remains in the single phase orthorhombic structure (O*-phase).
The concentration range of the rhombohedral structure solely for the solid solutions Bi1−xGdxFeO3 is reduced compared with that estimated for the compounds Bi1−xNdxFeO3. The structure of the 10 mol. % Gd solid solution is characterized by the presence of a minor amount (~10 %) of the antipolar orthorhombic phase simultaneously with the dominant rhombohedral phase (Figure 1). The XRD pattern of the solid solution with x = 0.15 was refined assuming a dominance of the nonpolar orthorhombic phase refined using the s. g. Pnma (O-phase, metric √2ap · 2ap · √2ap), while careful analysis of the XRD patterns revealed the presence of a small amount (~5–10%) of the antipolar orthorhombic phase (O*-phase, s. g. Pbam). The concentration region specific for the dominance of the antipolar orthorhombic phase is placed in the concentration region 0.1 < x < 0.15 which is in accordance with previous data [11]. The solid solution with x = 0.20 is assumed to be single-phase orthorhombic (O-phase, s. g. Pnma).
The unit cell parameters calculated based on the diffraction measurements are presented in Figure 2 for the compounds of both systems. For the solid solutions Bi1−xNdxFeO3 in the rhombohedral phase, the a- parameter slightly decreases but the c- parameter barely increases thus resulting in a decrease of the unit cell volume. The structural parameters of the antipolar orthorhombic phase (O*-phase) also show gradual reduction thus demonstrating the formation of a continuous solid solution. The unit cell volume decreases from ~62.0 Å3 for the rhombohedral compound with x = 0.05 down to ~61.28 Å3 for the compound with x = 0.15 and then to ~61.08 Å3 for the solid solution with x = 0.2 which are considered to be single-phase orthorhombic (O*-phase). The structural parameters estimated for the compounds Bi1−xGdxFeO3 show more drastic changes along the phase transition to the orthorhombic structure, viz. the unit cell volume decreases from ~61.97 Å3 for the rhombohedral compound x = 0.05 down to the average unit cell volume ~60.86 Å3 for the two-phase compound x = 0.15 and ~59.51 Å3 for the solid solution with x = 0.2 with single-phase nonpolar orthorhombic structure (s.g. Pnma) (Figure 2). The bond lengths Fe–O and RE–O estimated from the diffraction data show gradual decrease in the average magnitudes with the dopant concentration, while the accuracy of the obtained values is insufficient to obtain precise values for all different chemical bonds due to limitations of the X-ray diffraction method, the reliability factors are quite low for all refined patterns (Rf < 8, chi2 < 5). An evolution of the chemical bond lengths as a function of the dopant type and concentration is discussed in the next section based on the FT-IR data.

3.2. FT-IR Spectroscopy Analysis

Reflection spectra (Figure 3) show the activation of the optical oscillator caused by a growth in the dopant content against the background of a general decrease in the refractive index in accordance with normal dispersion. In the region of low wavelengths, the spectra show a decrease in the intensity of the reflection coefficient which is related to the decrease in the permittivity for high energy radiation, while this tendency is violated upon chemical doping. Figure 3 shows an evolution of two main vibrational modes at λ = 18.2 μm and 22.6 μm (550 cm−1 and 440 cm−1) from 12 total modes (4 A and 8 E types) usually observed within the spectral range 50–700 cm−1 [16,17]. The vibrational mode at 18.2 μm is symmetrical transverse optical phonon mode noted as A1(TO4), while that at 22.6 μm is doubly degenerated transverse optical phonon mode E(TO8). These bands are caused by stretching vibrations of the Fe–O chemical bond–A1(TO4) and bending vibrations of the Fe–O bond occurring in the oxygen octahedra FeO6E(TO8), while the E(TO8) band is also related to Bi–O group vibrations corresponding to BiO12 polyhedra thus overlapping the modes ascribed to vibrations of Fe–O bonds [16,18,19,20].
According to the published data [21,22], in undoped bismuth ferrite the band A1(TO4) is located at 17.5 μm (~570 cm−1) at a temperature of 5 K and the band shifts towards lower frequencies with an increase in temperature reaching ~18.1 μm (~550 cm−1) at room temperature. Temperature increases also causes a notable broadening of its linewidth accompanied by a decrease in its intensity [22]. Chemical substitution by the rare-earth elements also causes a shift of the A1(TO4) and E(TO8) bands towards higher wavelengths. This is caused by a decrease in the mass of the chain of the chemical bonds—Bi–Bi(Nd, Gd)–Bi—and structural distortions, specific to the rhombohedral phase. An increase in the dopant content causes drastic changes of the observed IR bands. In the case of the solid solutions Bi1−xNdxFeO3, the A1(TO4) band notably decreases in intensity and shifts towards lower wavelengths for the compounds with x > 0.1 [23,24].
Whereas in the case of the compounds Bi1−xGdxFeO3 the direction of shift is opposite, the band A1(TO4) becomes even more intensive, wherein the band shifts towards higher wavelengths, viz. from λ ~18.0 μm for compound with x = 0.05 to λ ~18.5 μm for x = 0.2. It should be noted that the concentration-driven modification of the vibrational mode E(TO8) is quite similar for both systems, viz. the band decreases in intensity and becomes insignificant for the compounds with x ≥ 0.15. The evolution of the mode E(TO8) is associated with the rhombohedral distortion of the perovskite lattice, thus a decrease in the volume fraction of the rhombohedral phase followed by its disappearance causes a disappearance of the related vibrational mode.
The evolution of the vibrational modes as well as the crystal lattice dynamics are tightly related to the symmetry changes occurring in the solid solutions upon chemical doping. It is known that the total number of vibration modes and their type depend on the number of ions in the unit cell and their local symmetry. These can be represented through the combinations of normal coordinates corresponding to the symmetry elements of the structure, that is, by means of irreducible representations of local symmetry for groups of equivalent atoms. In vibrational spectroscopy, each vibrational normal mode consisting of stretches, bends, and other motions conform to the irreducible representation of a symmetry species in the point group of the lattice. So, it is possible to determine the motion of the crystal lattice in the terminology of formalism of the so-called factor-group.
For a rhombohedrally distorted perovskite lattice, the local symmetry of Bi and Fe atoms corresponds to C3 (or 3, in ITA notations) symmetry, and oxygen ions correspond to C1 (1, ITA) symmetry. Accordingly, the characters of these complexes in the Schoenflies terminology of the designation can be represented as presented in Table 1 and Table 2.
The factor group as the space group reduced to the translation group defines the symmetry of directions and is isomorphic to the C3v point group. This group has the following tabular characters.
Accordingly, the motion of the atoms can be written in the form of a sum of irreducible representations in terms of the types and symmetry of the vibrations of the group C3v. Namely, there are two ordinary A1, A2 and one two-dimensional E vibration type belonging to Bi, Fe and O ions in the lattice
aBi, Fe = A1 + A2 + 2E;
aO = 3A1 + 3A2 + 6E.
In accordance with the selection rules there are 12 IR active modes, viz. 4 A1 modes and 8 E modes (A2 modes are silent in the mentioned rhombohedral structure). The chemical doping causes the phase transformation to the orthorhombic structure in both studied systems. The solid solutions of both systems with the dopant concentration level of 10 mol. % contain a small amount of the antipolar orthorhombic phase (point group D2h or mmm in ITA notations), while in the case of the Nd-doped system its amount is nearly negligible; however, in the case of the Bi1−xGdxFeO3 system its volume fraction reaches a value of ~10%. The compound Bi0.85Nd0.15FeO3 is single-phase orthorhombic (O*- phase) and its IR spectrum shows a notable shift of the A1 band to a lower wavelength (higher frequency) as compared to the compound with x = 0.10 which is in agreement with the reduced average mass in the ionic chains—Bi–Bi(Nd)–Bi. An additional phonon band appears at ~14.8 μm associated with a new stretching vibration band of FeO6 octahedra caused by the antipolar alignment of dipole moments in the O*- phase [23]. The band at ~14.8 μm is specific to the antipolar orthorhombic distortion, and it becomes less pronounced in the compound with x = 0.2 thus pointing at gradual reduction of the antipolar orthorhombic distortion. It should be noted that the mentioned band can hardly, if possible, be distinguished using Raman spectroscopy data as confirmed in the previous study [24], thus highlighting the advantages of FT-IR spectroscopy over the Raman measurements for analysis of the ‘rhombohedral—orthorhombic’ structural transition in BiFeO3-based solid solutions.
The IR spectrum of the compound with x = 0.2 does not show any notable changes of the band at ~18 μm, while the band at ~22 μm completely vanishes thus confirming a total reduction of the R-phase even at a local scale level. An opposite trend in the modification of the vibrational modes was noted for compounds Bi1−xGdxFeO3 with x ≥ 0.15 which bear a two-phase structural state (x = 0.15, O* + O phases) and a single-phase orthorhombic state (x = 0.20, Ophases), respectively. The bands at ~18 μm shift towards higher wavelengths caused by the formation of a nonpolar orthorhombic structure as compared to the antipolar orthorhombic structure in Bi1−xNdxFeO3 compounds.
It should be noted, that for both orthorhombic structures only B (antisymmetric) modes are IR active, while these modes are similar for both structures (Γacoustic = B1u + B2u + B3u modes for both space groups) as the point groups are the same for both structure (D2h), the amount of the vibrational modes and their multiplicity are notably different (see Table 3 and Table 4). It should be noted that the rare-earth ions are located in the 4g and 4h Wyckoff positions in the lattice described by the s.g. Pbam while they occupy 4c Wyckoff position in the s.g. Pnma; the iron ions occupy 8i position in the s.g. Pbam and 4a position in the s.g. Pnma. The differences in the occupation sites attributed to the Bi(Nd,Gd) and Fe ions in the different orthorhombic lattices as well as the differences in the parameters of the chemical bond lengths Bi(Nd,Gd)–O and Fe–O determine the differences observed in the IR spectra of the orthorhombic compounds of both systems.

4. Conclusions

The X-ray diffraction results simultaneously with the data of IR reflective spectrometry measurements have allowed clarification of the correlation between the structural changes occurring in the solid solutions Bi1−xNdxFeO3 and Bi1−xGdxFeO3 across the structural phase transformations from the polar rhombohedral structure to the antipolar and then to the nonpolar orthorhombic structure, in addition to related changes in the crystal lattice dynamics. It is shown that regardless of the dopant-ion type, a growth in the dopant concentration leads to a growth in intensity of the reflectance lines at 18.2 μm and 22.6 μm (~550 cm−1 and 440 cm−1) ascribed to Bi (Nd, Gd)–O and Fe–O bonds. An opposite direction movement of the transverse optical phonon modes at ~18 μm observed for the cases of Nd- and Gd doping is caused by competitive contribution of two factors—mass of the ions in the chain of the bonds and—the changes occurring in the chemical bond parameters caused by chemical doping.
The chemical doping with Gd ions causes a stabilization of the nonpolar orthorhombic phase in the heavily doped solid solutions which presents a more symmetrical structure (O –phase, described by the s. g. Pnma, #62) as compared to the case of Nd-doped compounds characterized by the antipolar orthorhombic structure refined using the s. g. Pbam (#55) which demonstrates a dominance of the structural factor over the mass factor in the shift of the related vibrational modes.

Author Contributions

V.R.S., D.V.K.: Supervision, Conceptualization, Investigation, Writing—Original Draft. M.V.S., K.N.N., D.V.Z., S.I.L., N.A., B.V.K., O.N.M.: Investigation, Data Analysis. M.I.S., V.R.S., K.I.Y.: Supervision, Conceptualization. D.V.K. Validation, Conceptualization and Editing. All authors have read and agreed to the published version of the manuscript.

Funding

This work was performed within the framework of the State Program for Scientific Research 2021–2025 “Materials science, new materials and technologies” subprogram “Nanostructural materials, nanotechnologies, nanotechnology”. This research was supported by the BRFFR (grants # F21RM-018, # T22UZB-045) and RFBR (grant # 20-58-04003 bel_mol_a).

Acknowledgments

The authors express their gratitude to Princess Nourah Bint Abdulrahman University Researchers Supporting Project Number (PNURSP2022R111), Princess Nourah Bint Abdulrahman University, Riyadh, Saudi Arabia.

Conflicts of Interest

The authors declare no conflict of interest.

References

  1. Pullar, R.C. Hexagonal ferrites: A review of the synthesis, properties and applications of hexaferrite ceramics. Prog. Mater Sci. 2012, 57, 1191–1334. [Google Scholar] [CrossRef]
  2. Trukhanov, A.V.; Turchenko, V.O.; Bobrikov, I.A.; Trukhanov, S.V.; Kazakevich, I.S.; Balagurov, A.M. Crystal structure and magnetic properties of the BaFe12−xAlxO19 (x=0.1–1.2) solid solutions. J. Magn. Magn. Mater. 2015, 393, 253–259. [Google Scholar] [CrossRef]
  3. Trukhanov, A.V.; Kostishyn, V.G.; Panina, L.V.; Korovushkin, V.V.; Turchenko, V.A.; Thakur, P.; Thakur, A.; Yang, Y.; Vinnik, D.A.; Yakovenko, E.S.; et al. Control of electromagnetic properties in substituted M-type hexagonal ferrites. J. Alloys Compd. 2018, 754, 247–256. [Google Scholar] [CrossRef]
  4. Trukhanov, S.V.; Trukhanov, A.V.; Turchenko, V.A.; Trukhanov, A.V.; Trukhanova, E.L.; Tishkevich, D.I.; Ivanov, V.M.; Zubar, T.I.; Salem, M.; Kostishyn, V.G.; et al. Polarization origin and iron positions in indium doped barium hexaferrites. Ceram. Int. 2018, 44, 290–300. [Google Scholar] [CrossRef]
  5. Almessiere, M.A.; Trukhanov, A.V.; Slimani, Y.; You, K.Y.; Trukhanov, S.V.; Trukhanova, E.L.; Esa, F.; Sadaqat, A.; Chaudhary, K.; Zdorovets, M.; et al. Correlation Between Composition and Electrodynamics Properties in Nanocomposites Based on Hard/Soft Ferrimagnetics with Strong Exchange Coupling. Nanomaterials 2019, 9, 202. [Google Scholar] [CrossRef]
  6. Spaldin, N.A.; Ramesh, R. Advances in magnetoelectric multiferroics. Nat. Mater. 2019, 18, 203–212. [Google Scholar] [CrossRef]
  7. Ghosh, A.; Trujillo, D.P.; Choi, H.; Nakhmanson, S.M.; Alpay, S.P.; Zhu, J.-X. Electronic and Magnetic Properties of Lanthanum and Strontium Doped Bismuth Ferrite: A First-Principles Study. Sci. Rep. 2019, 9, 194. [Google Scholar] [CrossRef] [PubMed]
  8. Karpinsky, D.V.; Silibin, M.V.; Trukhanov, S.V.; Trukhanov, A.V.; Zhaludkevich, A.L.; Latushka, S.I.; Zhaludkevich, D.V.; Khomchenko, V.A.; Alikin, D.O.; Abramov, A.S.; et al. Peculiarities of the Crystal Structure Evolution of BiFeO3–BaTiO3 Ceramics across Structural Phase Transitions. Nanomaterials 2020, 10, 801. [Google Scholar] [CrossRef]
  9. Zhang, Y.-j.; Zhang, H.-g.; Yin, J.-h.; Zhang, H.-w.; Chen, J.-l.; Wang, W.-q.; Wu, G.-h. Structural and magnetic properties in Bi1−xRxFeO3 (x=0–1, R=La, Nd, Sm, Eu and Tb) polycrystalline ceramics. J. Magn. Magn. Mater. 2010, 322, 2251–2255. [Google Scholar] [CrossRef]
  10. Xue, F.; Fu, Q.; Zhou, D.; Tian, Y.; Hu, Y.; Zheng, Z.; Zhou, L. Properties of Bi0.8Ln0.2FeO3 (Ln=La, Gd, Ho) multiferroic ceramics. Ceram. Int. 2015, 41(Part B), 14718–14726. [Google Scholar] [CrossRef]
  11. Troyanchuk, I.O.; Karpinsky, D.V.; Bushinsky, M.V.; Mantytskaya, O.S.; Tereshko, N.V.; Shut, V.N. Phase transitions, magnetic and piezoelectric properties of rare-earth-substituted BiFeO3 ceramics. J. Am. Ceram. Soc. 2011, 94, 4502–4506. [Google Scholar] [CrossRef]
  12. Arnold, D.C. Composition-driven structural phase transitions in rare-earth-doped BiFeO3 ceramics: A review. IEEE Trans. Ultrason. Ferroelectr. Freq. Control 2015, 62, 62–82. [Google Scholar] [CrossRef] [PubMed]
  13. Lazenka, V.V.; Zhang, G.; Vanacken, J.; Makoed, I.I.; Ravinski, A.F.; Moshchalkov, V.V. Structural transformation and magnetoelectric behaviour in Bi1−xGdxFeO3 multiferroics. J. Phys. D Appl. Phys. 2012, 45, 125002. [Google Scholar] [CrossRef]
  14. Godara, P.; Agarwal, A.; Ahlawat, N.; Sanghi, S. Crystal structure, dielectric and magnetic properties of Gd doped BiFeO3 multiferroics. Phys. B 2018, 550, 414–419. [Google Scholar] [CrossRef]
  15. Rodríguez-Carvajal, J. Recent advances in magnetic structure determination by neutron powder diffraction. Physica B 1993, 192, 55. [Google Scholar] [CrossRef]
  16. Maleki, H. Photocatalytic activity, optical and ferroelectric properties of Bi0.8Nd0.2FeO3 nanoparticles synthesized by sol-gel and hydrothermal methods. J. Magn. Magn. Mater. 2018, 458, 277–284. [Google Scholar] [CrossRef]
  17. Dhanya, S.R.; Nair, S.G.; Satapathy, J.; Kumar, N.P. Structural and spectroscopic characterization of bismuth-ferrites. AIP Conf. Proc. 2019, 2166, 020017. [Google Scholar]
  18. Chen, P.; Xu, X.; Koenigsmann, C.; Santulli, A.C.; Wong, S.S.; Musfeldt, J.L. Size-Dependent Infrared Phonon Modes and Ferroelectric Phase Transition in BiFeO3 Nanoparticles. Nano Lett. 2010, 10, 4526–4532. [Google Scholar] [CrossRef]
  19. Tuboltsev, V.; Savin, A.; Sakamoto, W.; Hieno, A.; Yogo, T.; Räisänen, J. Spin-glass behavior of nanocrystalline multiferroic bismuth ferrite lead titanate. J. Mater. Chem. 2011, 21, 781–788. [Google Scholar] [CrossRef]
  20. Gaikwad, V.M.; Acharya, S.A. Investigation of spin phonon coupling in BiFeO3 based system by Fourier transform infrared spectroscopy. J. Appl. Phys. 2013, 114, 193901. [Google Scholar] [CrossRef]
  21. Komandin, G.A.; Torgashev, V.I.; Volkov, A.A.; Porodinkov, O.E.; Spektor, I.E.; Bush, A.A. Optical properties of BiFeO3 ceramics in the frequency range 0.3–30.0 THz. Phys. Solid State 2010, 52, 734–743. [Google Scholar] [CrossRef]
  22. Jiang, P.P.; Zhang, X.L.; Chang, P.; Hu, Z.G.; Bai, W.; Li, Y.W.; Chu, J.H. Spin-phonon interactions of multiferroic Bi4Ti3O12-BiFeO3 ceramics: Low-temperature Raman scattering and infrared reflectance spectra investigations. J. Appl. Phys. 2014, 115, 144101. [Google Scholar]
  23. Karpinsky, D.V.; Pakalniškis, A.; Niaura, G.; Zhaludkevich, D.V.; Zhaludkevich, A.L.; Latushka, S.I.; Silibin, M.; Serdechnova, M.; Garamus, V.M.; Lukowiak, A.; et al. Evolution of the crystal structure and magnetic properties of Sm-doped BiFeO3 ceramics across the phase boundary region. Ceram. Int. 2020, 47, 5399–5406. [Google Scholar] [CrossRef]
  24. Delfard, N.B.; Maleki, H.; Badizi, A.M.; Taraz, M. Enhanced Structural, Optical, and Multiferroic Properties of Rod-Like Bismuth Iron Oxide Nanoceramics by Dopant Lanthanum. J. Supercond. Novel Magn. 2020, 33, 1207–1214. [Google Scholar] [CrossRef]
Figure 1. XRD patterns of the compounds Bi0.9Nd0.1FeO3 and Bi0.9Gd0.1FeO3 and refined within the two-phase models (upper-row ticks denote R3c (R) phase, second-row ticks—Pbam (O*) phase for both compounds); the insets demonstrate concentration-driven changes of the peaks specific to the rhombohedral, antipolar orthorhombic and nonpolar orthorhombic phases.
Magnetochemistry 08 00103 g001
Figure 2. The normalized unit cell parameters calculated for the Bi1−xNdxFeO3 and Bi1−xGdxFeO3 compounds; the volume fractions of the R- phases for both systems are denoted by the dashed areas (the data for the phase boundary regions have also been taken from the previous papers [11,12]).
Magnetochemistry 08 00103 g002
Figure 3. IR reflection spectra of Bi1−xNdxFeO3 (upper image) and Bi1−xGdxFeO3 compounds (1−x = 0; 2–0.05; 3–0.1, 4–0.15, 5–0.2) recorded at room temperature.
Magnetochemistry 08 00103 g003
Table 1. Symmetry operations and symmetry species * for the Wyckoff positions 6a (left side columns) and 18b.
WP: 6a EC3 C 3 2 WP: 18b E
A600 A18
* symmetry species are presented using Mulliken symbols.
Table 2. Character table for the C3v (3m, ITA) point group.
E2C3 (3, ITA)3Cv (m1–10, ITA)
A1111
A211−1
E2−10
Table 3. IR selection rules of the selected Wyckoff positions (s.g. Pnma).
WPAgAuB1gB1uB2gB2uB3gB3u
4a···3·3·3
4b···3·3·3
4c···2·1·2
8d···3·3·3
Table 4. IR selection rules of the selected Wyckoff positions (s.g. Pbam).
WPAgAuB1gB1uB2gB2uB3gB3u
2a···1·2·2
2b···1·2·2
2c···1·2·2
2d···1·2·2
4e···1·2·2
4f···1·2·2
4g···1·2·2
4h···1·2·2
8i···3·3·3
Publisher’s Note: MDPI stays neutral with regard to jurisdictional claims in published maps and institutional affiliations.

