
Multi-Scale Heterogeneity of Electrode Reaction for 18650-Type Lithium-Ion Batteries during Initial Charging Process

Department of Chemical Engineering, Shanghai Electrochemical Energy Devices Research Center, Shanghai Jiao Tong University, Shanghai 200240, China
*
Author to whom correspondence should be addressed.
Batteries 2024, 10(3), 109; https://doi.org/10.3390/batteries10030109
Submission received: 13 February 2024
/
Revised: 12 March 2024
/
Accepted: 14 March 2024
/
Published: 18 March 2024
(This article belongs to the Special Issue Fast-Charging Lithium Batteries: Challenges, Progress and Future)
Abstract
:The improvement of fast-charging capabilities for lithium-ion batteries significantly influences the widespread application of electric vehicles. Fast-charging performance depends not only on materials but also on the battery’s inherent structure and the heterogeneity of the electrode reaction. Herein, we utilized advanced imaging techniques to explore how the internal structure of cylindrical batteries impacts macroscopic electrochemical performance. Our research unveiled the natural 3D structural non-uniformity of the electrodes, causing heterogeneity of electrode reaction. This non-uniformity of reaction exhibited a macro–meso–micro-scale feature in four dimensions: the exterior versus the interior of the electrode, the middle versus the sides of the cell, the inside versus the outside of the cell, and the surface versus the body of the electrode. Furthermore, the single-coated side of the anode demonstrated notably faster reaction than the double-coated sides, leading to the deposition of island-like lithium during fast charging. These discoveries offer novel insights into multi-scale fast-charging mechanisms for commercial batteries, inspiring innovative approaches to battery design.
1. Introduction
In recent decades, lithium-ion batteries have advanced significantly as a cutting-edge energy technology, transforming lifestyles and industrial production [1,2]. However, the continuous depletion of fossil fuels has led to increased greenhouse gas emissions, demanding immediate sustainable energy cycling. Currently, the implementation of a dual carbon strategy has become a major approach to address this challenge [3,4,5]. Gradually replacing conventional fuel vehicles with electric vehicles is a pivotal solution [6,7,8,9]. However, the widespread adoption of lithium-ion batteries for electric vehicles faces limitations, such as poor fast-charging performance [10], safety [11,12], and range anxiety [13,14]. Therefore, there is a pressing need to develop lithium batteries with high safety and energy density, fast-charging ability, and a long cycle life.
The development of commercial lithium-ion batteries with fast-charging [15] or even extreme-fast-charging (XFC) capabilities has become an important frontier in current research [16,17]. For graphite-based commercial lithium-ion battery systems, the essential nature of their fast charging lies in the rapid and efficient insertion/extraction process of lithium ions within the graphite anode/cathode particles [18,19]. This process is specifically manifested by the swift desolvation and insertion/extraction of lithium ions on a particle’s surface, and the rapid solid-state diffusion of lithium ions within the particle. Simultaneously, it is crucial to effectively inhibit lithium dendrite deposition [20,21], electrolyte side reactions, the generation of particle micro-cracks [22,23], and polarization in the electrode processes during this procedure. These unexpected fast-charging behaviors have garnered attention and driven significant advancements from various perspectives [24], such as the optimization of electrolyte formulations [25,26], the structure design of high-rate graphite particles [27,28], the development of micron-sized single-crystal materials [29], and the modification of material surfaces through coating [30].
Fast-charging uniformity is another crucial characteristic of commercial batteries. Mesoscopic electrodes, made up of numerous particles, show reaction patterns intricately tied to both the characteristics of micron-sized particles and the mesoscopic electrode’s inherent reaction mechanism. This inherent mechanism is influenced by factors at the mesoscopic level, such as lithium-ion liquid-phase transport, lithium-ion solid-phase diffusion, and an electron conductive network, consequently impacting the overall distribution uniformity of potential and current across the electrode [31,32]. For the ideal thin electrode model, ternary cathodes demonstrate homogeneous reactions, while lithium iron phosphate (LFP) cathodes exhibit heterogeneous reactions [33]. However, in practical electrodes, the characteristics of reaction uniformity are closely tied to factors like electrode thickness [34], electrode porosity, charging–discharging strategies, and electrode surface modifications [35]. For instance, as charging–discharging rates rise, ternary positive electrodes may transition from uniform reactions to non-uniform reactions [36]. Moreover, the actual electrode surface displays non-uniformity among multi-particle reactions [37,38]. These heterogeneities can be ameliorated through methods such as surface modifications [39], composite electrode design [40,41], and unconventional porous electrode design [42,43]. Importantly, most commercial batteries exhibit complex structures [44,45]. In contrast to coin cells and lab-level small pouch cells, commercial wound cells (such as 18650-type and 21700-type cells) have different curvatures and electrode bending degrees at the inner and outer section of the winding core [46]. Commercial battery electrodes involve numerous mesoscopic electrodes, and research on macroscopic electrode reactions is limited [47]. Additionally, commercial battery electrolytes typically have a slight rather than significant surplus [48]. The intricate structure of these batteries is expected to impact the non-uniformity of electrolyte distribution [49,50], thereby influencing the reaction uniformity of mesoscopic electrodes. Therefore, studying the inherent reaction uniformity of commercial batteries under fast-charging conditions is crucial for understanding the multi-scale mechanisms of fast-charging processes in batteries.
In this study, we used commercially available 18650 nickel–cobalt–manganese cathode/graphite anode batteries as a model. By applying hyphenated techniques, such as disassembly, ultra-depth-of-field (UDOF) optical microscopy, scanning electron microscopy (SEM), and time-of-flight secondary ion mass spectrometry (NanoSIMs), we systematically investigated the intrinsic fast-charging mechanisms of fresh batteries. We discovered macro–meso–microscopic-reaction non-uniformities of graphite anodes under an initial fast-charging process. Fundamentally, these non-uniformities arise from the heterogeneous bending of electrodes inside the cylindrical structure. Additionally, the cathode exhibits radial non-uniformity. Cylindrical batteries exhibit 3D non-uniform reactions during the fast-charging process. These non-uniformities are noticeably suppressed during the slow-charging process. This study offers a novel perspective for the accelerated development of fast-charging batteries.
2. Materials and Methods
2.1. Electrochemical Test and Sample Preparation
Commercial 2 Ah 18650-type cells were sourced from a large-scale production batch (more than one million) produced by the EVE Energy Battery company in Huizhou, China. The main composition of the 2 Ah cells was a LiNi0.5Co0.2Mn0.3O2 (NCM523) cathode, a graphite anode, electrolyte, and a polyethylene (PE) separator. Electrochemical tests of fast-charging and slow-charging working conditions were conducted on a Neware CT 5 V/6 A battery testing system (Neware, Shenzhen, China). All the fresh cells were first discharged to 2.7 V at a current rate of 0.2 C. Then, they were charged to different cut-off voltages varying from 3.7 V to 4.2 V at the constant current rate of 3 C for fast charging and 0.5 C for slow charging. Immediately, the cells were disassembled carefully to obtain the delithiated cathodes and lithiated anodes in a Ar-filled glove box. The time between the charging ending and the completed disassembly was about 3–5 min. The measured widths of the NCM523 cathode and graphite anode from the disassembly of the 18650-typedcells were 57.5 mm and 59 mm, respectively. Overall and partial pictures of the whole graphite anodes at different lithiation states were taken with a phone camera. In the Ar-filled glove box, parts of the graphite anode at different positions were cut off with ceramic scissors, wrapped between two plates of quartz, and finally sealed carefully with epoxide resin AB glue. Pieces of the NCM523 cathode, opposite to the typical areas mentioned above, were punched using a hole puncher. All the partial cathode samples were washed with dimethyl carbonate (DMC) for 24 h to remove the LiPF6 within the electrodes.
2.2. Multi-Scale Characterizations
A three-dimensional X-ray computed tomographic (X-ray CT) imaging test of an 18650-type cell was performed using a Versa 520 system (Carl Zeiss, Jena, Germany). The acceleration voltage was set to 140 kV, with a power of 10 mW and a spatial resolution of 20 µm. High-resolution (4 k) optical images of the sealed air-sensitive samples were captured using an ultra-depth-of-field optical (UDOF) microscope (Keyence VHX-7000 system, Osaka, Japan). These raw optical images were processed with a self-written Matlab code (File S1) to obtain the distribution features of the graphite anodes at a multi-scale level using authorized Matlab (version R2023a). The single-coated sides of charged graphite anodes were placed in a self-designed vacuum transfer device in the same Ar-filled glove box. Then, the device was placed carefully in Tescan SEM systems to conduct the multi-mode characterization of the air-sensitive samples. SEM images and EDX images of the graphite anode samples were obtained on a Tescan MAGNA system (Brno, Czech Republic). The testing parameters were 5 kV/300 pA for SEM and 5 kV/1 nA for EDX. Cross-sectional samples of the NCM523 cathodes were prepared for 2 h at a voltage of 7 kV and 0.5 h at a voltage of 4.5 kV using focused Ar+ ion beams (Leica EM TIC 3X system, Wetzlar, Germany). And NanoSIMs characterizations of the graphite anodes and the cross-sectional cathode samples were taken on a Tescan GAIA instrument (Brno, Czech Republic), obtaining tomography and lithium element images of these samples at the same field of view. The testing conditions of the NanoSIMs were 30 kV/500 pA, with focused Ga+ ion sputtering for 3 min, and positive mode. These raw images of the lithium element were processed by another Matlab code (File S1) to obtain the quantitative distribution of the lithium element.
3. Results and Discussion
3.1. Electrochemical Heterogeneity of 18650-Type Cells
We conducted tests on fresh batteries under two typical working conditions: fast charging (3 C) and slow charging (0.5 C). We studied the electrochemical uniformity of the charging reactions by comparing the curves of the capacity percentage versus the charging voltage during the first cycle charging process in Figure 1a. Interestingly, the 18650-type cells exhibited significantly different reaction uniformity between the fast-charging and slow-charging processes. Figure 1b,c illustrates different charging behaviors: the fast-charged cell showed a rapid increase in its charging capacity between 3.7 V and 4.0 V before a slow increase stage between 4.0 V and 4.2 V (red line), while the capacity gradually increased between 3.7 V and 4.2 V for the slow-charged cell (green line).
When comparing the capacity percentage differences at identical voltages, we observed an asymmetrical curve resembling a volcano during the charging process. The difference curve (blue dashed line in Figure 1b) could be divided into three stages: (1) The charging capacity percentage differences (0~10%) increased quickly from the starting point voltage to 3.6 V (stage I). (2) Between 3.6 V and 4.0 V, larger charging capacity percentage differences (10~30%) suggested substantial differences in the internal reaction uniformity between the two charging conditions (stage II). (3) Between 4.0 V and 4.2 V, charging capacity percentage differences (8~10%) decreased slowly and gently (stage III). Furthermore, within the 3.8–4.2 V range in Figure 1c, the charging capacity percentages of the fast-charged cell closely matched those of the slow-charged cell at 0.1 V lower. For instance, the charging capacity ratio of the 4.0 V fast-charged cell (64.8%) closely resembled that of the slow-charged cell (65.2%) at 3.9 V, providing a useful reference for deeper comparative analysis.
3.2. Structural Non-Uniformity of 18650-Type Cells and Its Impact on Initial Charging
The 18650-type cells were complex in structure and composition. As depicted in Figure 2a, the 18650-type battery comprised a NCM523 electrode plate, two slices of separators, and a graphite electrode plate, which were tightly wound together. Both NCM523 and graphite electrodes were double-coated and delineated into inside and outside layers. The inside layer of the cathode/anode aligned with the outside anode/cathode, forming numerous microbattery modules. The macroscopic charging/discharging process of the 18650-type battery occurred within these micro-battery modules.
Consequently, the 18650-type battery’s structure comprised three primary heterogeneities: (1) Along the rolling direction in Figure 2b, the whole cell core was divided into an inner section (yellow annulus) and outer section (red annulus) using the cathode tab as a boundary, wherein the inner section exhibited more pronounced bending and large curvature compared to the outer. (2) Radially with the battery in Figure 2c,d, the inside electrode displayed a compressed state, while the outside electrode exhibited a stretched state [46]. The compressed state was more prone to causing detachment between the active material and the current collector. (3) At the outermost edge of the battery, a small portion of the graphite anode was single-coated (orange arc in Figure 2b).
Moreover, the NCM523 electrode plate showed a non-uniform distance between the two adjacent electrode circles in three directions. Firstly, by defining the three-dimensional CT structure of the 18650-type cell (Figure 2e), we could categorize the battery into three directions: the z-direction in the vertical orientation (including the top, middle, and bottom portions) (Figure 2f); the x-direction in the horizontal orientation, representing the direction parallel to the cathode tab (Figure 2g, orange line); and the y-direction, representing the direction vertical to the cathode tab (Figure 2g, red line). Subsequently, morphological calculations were conducted for the adjacent cathode electrodes in each section, yielding their spatial horizontal distances (Figure 2h, dashed line). The morphological statistical results indicate that in the horizontally wound x-direction and y-direction, the spacing distances of the adjacent cathode electrodes were slightly larger for the outer region (1–10 circles) compared to the inner region (11–25 circles) (Figure 2i). In the z-direction of the winding core (Figure 2j), the overall distances were greater in the top and bottom regions compared to the central region. This three-dimensional variation in the electrode spacing is speculated to impact the infiltration and uniform distribution of the injected electrolyte.
By analyzing the disassembled graphite anode’s color, we could initially assess the macroscopic uniformity of the charging reaction. The color of the graphite anode typically transitions from black to gray, red-brown, dark yellow, yellow, and bright yellow as the state of charge (SoC) increases [51]. Here, we opted to disassemble graphite electrodes from the batteries of 4.0 V fast-charging cut-off and 3.9 V slow-charging cut-off. Although these batteries possess identical capacities (Figure 1c), there were significant disparities in the coloration of the graphite anodes (refer to Figure 2k,l). According to the distinctive structure of wound batteries, we segmented the entire graphite electrode into four representative regions: inner-inside (S1, S5), outer-inside (S2, S6), inner-outside (S3, S7), and outer-outside (S4, S8). The graphite after fast charging displayed conspicuous color differences across these four regions, with S1 showing a brown hue, while S2–S4 exhibited varying degrees of brightness in yellow. Conversely, for the slow-charged graphite anode, the majority of the electrode regions exhibited similar shades of yellow (S5–S8), indicating a relatively uniform reaction at the macroscopic scale. This macroscopic disparity in color among the graphite electrodes after fast charging further corroborated the electrochemical non-uniformity observed during the charging process. This spatial reaction heterogeneity may arise from the non-uniform distribution of electrolyte within the entire cell due to the heterogeneous structure, as illustrated above.
3.3. Quasi-Operando Charging Behavior of Graphite Anode
We employed UDOF optical microscopy to conduct a quasi-operando analysis of the reaction heterogeneities for the graphite anode at multiple scales (Figure 3a). Unlike traditional photography, this UDOF imaging technology offers extended depth of field and stitched scanning capabilities. These features enable the imaging of macroscopic areas at a microscopic resolution, as illustrated in Figure 3b. The lithiated graphite anodes were sealed into two pieces of quartz plates with AB glue to prevent side reactions with the air during the optical characterization, as shown in Figure 3b. All the over-view images of lithiated graphite anodes in a cell charged to a specified cut-off voltage are shown in Supplementary Materials Figure S1a,b. The graphite anode showed different extents of lithiation reaction of the lithium ions in the graphite electrode for the quasi-operando fast-charging and slow-charging processes at the S1/S5 areas of the cell. The colors of both areas gradually changed from gray to yellow during the charging process. These fast-charged graphite electrode images and curves had a wide and less uniform distribution between 3.7 V and 4.2 V (Figure 3c), while those of the slow-charged one showed narrow and more uniform distribution features (Figure 3d).
During the constant current charging stage (3.7–4.2 V) under quasi-operando fast-charging (Figure 4a) and slow-charging (Figure 4b) working conditions, all typical areas (S1–S4 for fast charging and S5–S8 for slow charging) of the 18650-type cells also showed similar color changes in the graphite anodes, as mentioned above (Figure 3c,d). Interestingly, between 3.7 V and 4.2 V, the colors of the graphite anodes at the S1 and S2 areas changed more slowly than those at the S3 and S4 areas, indicating a slower reaction rate of the inner side of the same cell compared to the outer side. For instance, at the stages of 3.9 V and 4.0 V, the extents of the S1 and S2 areas (purple) were slower than those of the S3 and S4 areas (dark yellow) for fast charging, implying macro-scale reaction heterogeneities of the whole graphite anode plate. In contrast, all images of the graphite anodes at the S5–S8 areas showed similar color-changing features under the slow-charging condition at a constant current charging stage (3.7–4.2 V), indicating the relative reaction homogeneity of the graphite anode at the cell scale. As all cells were high-quality products sourced from the same batch produced by a reputable large-scale company, their structure and electrolyte distribution should be consistent. Hence, the notable reaction heterogeneity of the whole graphite anode plate under fast-charging working conditions implied the heterogenous distribution of electrolyte within the whole cell and its inadequacy at the inner section, which was mostly caused by the inherently 3D structural non-uniformity of the 18650-type cell. Hence, we offer two improvement strategies: (1) Applying radial non-uniform injection and repeated injection techniques, enhancing the intrinsic uniformity of electrolyte distribution. (2) Appropriately increasing the electrolyte volume to enhance liquid-phase ion transfer, thereby initially improving fast-charging performance.
3.4. Multi-Scale Reaction Heterogeneity of Graphite Anode
The raw optical images exhibited substantial uniformity behaviors of the graphite anode in 18650-type cells. As discussed in the aforementioned study (Figure 3 and Figure 4), the SoC of the graphite anode was associated with colors, with brighter colors indicating a higher graphite anode SoC [51]. Initially, a raw image (Supplementary Materials Figure S2a) was converted to a gray-scale image (Supplementary Materials Figure S2b), followed by its representation as a new image (Supplementary Materials Figure S2c) using the parula colormap. Given the above experimental findings and the significant challenges in accurately quantifying characterization techniques and the calculation method of the SoC of graphite particles at the micro-scale level, we assumed a linear relationship between SoC and color intensity (Supplementary Materials Figure S2d). Furthermore, a similar calculation of SoC using particle color intensity has recently been applied to NCM523 cathode particles [37]. Consequently, we translated the color intensity of each pixel to reflect the local graphite SoC. Finally, the distribution pattern of the graphite anode SoC and the depth curve of SoC along the z-direction were separately calculated using the hist function and nanmean function.
We initially examined the spatial reaction uniformity of the graphite cathode at the macroscopic level. Images were acquired at typical areas, S1–S8 (59 × 59 mm2), as shown in Figure 5a. For the fast-charged and slow-charged cells, we compared the reaction uniformity of the graphite anode in three dimensions (x, z, r) (illustrated in Figure 2a,e). The findings indicated a significantly spatial reaction non-uniformity under the fast-charging condition. In the z-direction, the SoCs at the central regions of the anode were larger than those of the two sides, implying faster lithiation of the graphite particles at the central area (S1–S4 in Figure 5b,c). Likewise, in the x-direction, the outer regions reacted faster than the inner regions (S2 vs. S1); in the r-direction, the outside areas reacted more quickly than the inside ones (S3 vs. S1). Further comparative analysis across these three dimensions unveiled that the reaction at the inner-inside area was the slowest, while the differences among the other three regions were fast and similar. This macroscopic-scale reaction non-uniformity may be influenced by uneven electrolyte distribution. In contrast, for the slow-charged cells, the graphite anode exhibited slight non-uniform reaction characteristics among the different areas: a relatively uniform reaction in the z-direction (S5–S8 in Figure 5b,c), a slightly faster reaction in the outside area compared to the inside in the r-direction (S7 vs. S5), and a slightly faster reaction in the inner region compared to the outer in the x-direction (S6 vs. S5).
Furthermore, we delved deeper into the intrinsic reaction uniformity of the graphite electrode at the macroscopic scale. We opted to conduct a comparative analysis on the S1–S8 central regions with a diameter of 10 mm, all situated at the central position along the z-direction of the graphite anodes, as depicted in Figure 5a,d. As shown in Figure 5e, we calculated the SoC distribution for the lithiated graphite particles in Figure 5d to explore the intrinsic reaction uniformity. Under the fast-charging condition, the graphite particles in these four distinct regions (S1–S4) exhibited two different distribution characteristics of SoC. Conversely, under the slow-charging condition, the SoC of the graphite particles in these same four regions displayed a consistent distribution pattern (S5–S8 in Figure 5e). This indicates that under fast-charging conditions, the electrode manifests an intrinsic reaction non-uniformity across distinct macroscopic regions. Moreover, the distribution curve for S2 is a single peak, while the curves for the three others (S1, S3, S4) had a main peak and an acromial peak. The distribution curves for the slow-charged areas also featured a main peak and an acromial peak. Hence, the SoC distribution curves with double peaks in both the fast-charged and slow-charged anode areas implied a non-uniform reaction of the graphite anode at the macro scale. Overall, altering the charging strategies could modify the electrode’s intrinsic reaction uniformity at the macroscopic level for 18650-type cells.
When observing the graphite anode at the meso scale, its reaction uniformity notably differed from those at the macro scale. We selected the meso-scale circle areas (500 × 500 μm2) from these regions in Figure 5d for high-resolution optical imaging and quantitative analysis (refer to Figure 5f,g). It is apparent that for all the typical regions after fast charging and slow charging, all the SoC distribution curves had a large peak (low SoC) and a small peak (large SoC). This means that the graphite anode exhibited similar non-uniformity characteristics regardless of the charging conditions. This intrinsic non-uniformity at the meso scale seems to have less correlation with the spatial position of graphite particles or the charging rates.
As the 18650-type cells were sourced from the same large-scale production batch manufactured by a well-established major corporation, they featured identical battery structures, similar quantities of electrolyte injection, and consistent electrolyte distribution. Moreover, all electrodes were produced with the same controlled parameters, including thickness, area density, and composition, resulting in nearly identical raw unwound electrodes. Following the identical winding process, electrodes located at corresponding positions within the batteries were expected to possess highly similar characteristics, encompassing bending state, thickness, distance between adjacent cathodes, and thus, electron conductive ability. And at equal radial distances (with the same r value) from the battery center, distinct small electrode sections were anticipated to display analogous bending states, regardless of their positions along the electrode width z-direction (varying z values).
Hence, it is assumed that the reaction mode remains consistent for the same areas under different charging modes, as well as different areas with the same radial (r) value for these cells from the same batch. However, for the same macro-scale areas, the electrode reactions exhibited various SoC distribution patterns under fast charging (S1–S4 in Figure 5d,e) compared to slow charging (S5–S8 in Figure 5d,e). Despite the similar electrode parameters discussed earlier for these cells in the same areas, the primary reason for this variation lay in the diverse diffusion patterns of lithium ions due to the heterogeneous distribution of electrolytes. Under the slow-charging condition, the electrode reaction progressed slowly, and the lithium ions’ diffusion adequately met most of the reaction requirements, even in the presence of heterogeneous electrolytes. Conversely, during fast charging, the required electrode speed significantly increased, and not all these requirements were met due to limitations in lithium ions’ diffusion caused by the heterogeneous distribution of electrolytes. Consequently, the same areas exhibited varying degrees of reaction in a fast-charging mode at the macro-scale level. At the meso-scale level, the distributions for S1–S8 were similar, implying the intrinsically similar distribution of graphite SoC at this scale. Furthermore, different areas along the z-direction at the same r value showed various reaction degrees (S1–S8 in Figure 5b,c). These areas displayed noticeable differences in electrode distance (Figure 2e,j) despite the similar bending state of the electrode, which could impact the distribution of injected electrolytes from an engineering fabrication perspective. This provided circumstantial evidence supporting the hypothesis of electrolyte distribution. As the detection of electrolyte for 18650-type cells was challenging, we intend to delve deeper into the research, gathering more direct evidence to support these findings.
3.5. Electrode Reaction Heterogeneity and Lithium Island Deposition in a Single-Coated Anode Section
During the initial charging process, the actual battery’s single-coated region exhibited notable side reaction features under fast charging. As depicted in Figure 6a–d, this area displayed numerous island-like lithium plating regions. Concurrently, there were electrolyte decompositions on the same lithium plating region, according to higher counts of the F element compared with the graphite areas from the EDX mapping image (Figure 6e,f). This indicates that the actual charging rate in this region significantly surpassed the apparent charging rate. Under a fast-charging condition, this loss of lithium ions may lead to a reduction in battery capacity. In contrast, under the slow-charging condition, the single-coated area maintained overall reaction uniformity and showed minimal signs of lithium plating (Figure 6h–k), few electrolyte decompositions (Figure 6l,m), and uniform lithiation of graphite particles (Figure 6n). According to further statistical analysis on these precipitated lithium islands in Figure 6o,p, it was found that the equivalent radii of these islands ranged from 50 μm to 500 μm (Figure 6q), with the lithium deposit area accounting for approximately 42.5% of the total area (Figure 6r). These large areas and sizes of lithium precipitation behavior may have a negative impact on battery safety under a fast-charging working condition.
Additionally, during the initial charging process, the reaction behavior of the single-coated graphite electrode region differed from that of the double-coated region (as depicted in Figure 4 and Figure 5). This anomaly is indeed intriguing and contrasts with our intuitive understanding. From the perspective of electrode structure, both the single-coated area and the double-coated regions shared identical design parameters, including thickness, areal density, curvature, and chemical components. Moreover, according to potential distribution theory, both regions should exhibit the same potential. Given these factors, the two regions should have the same reaction behavior. However, under the fast-charging (3 C rate) condition, the color of the single-coated side was brighter than that of the double-coated area at the 3.9 V cell, and apparent lithium plating occurred when the charging voltage was above the 4.0 V cell (Supplementary Materials Figure S1a). Higher SoC and lithium deposition implied a faster reaction process, indicating a higher current density at the same voltage. This unexpected phenomenon is hypothesized to be due to the lower resistance of the single-coated region. Introducing novel designs, such as an increase in thickness and surface modification of the single-coated side anode area, may help suppress lithium deposition and reduce irreversible capacity loss for 18650-type cells.
3.6. Electrode Reaction Heterogeneity of Cross-Sectional NCM523 Cathode
We further investigated the reaction uniformity within the electrodes (r-direction) under both fast-charging and slow-charging conditions. Here, we employed the NanoSIMs characterization technique [52,53] to assess the lithium concentration within the cross-sections of the NCM523 cathode, comparing cross-sectional reaction uniformity between the fast-charging and slow-charging working conditions. This is due to persistent challenges in preparing and characterizing the cross-sections of the lithiated graphite electrodes; we opted to analyze the cross-sections of the cathodes, which were opposite to these graphite anodes. Similar to the analysis of the graphite electrode’s areas, we also focused on four typical regions within the whole cathode: inner-inside (C1, C5), outer-inside (C2, C6), inner-outside (C3, C7), and outer-outside (C4, C8).
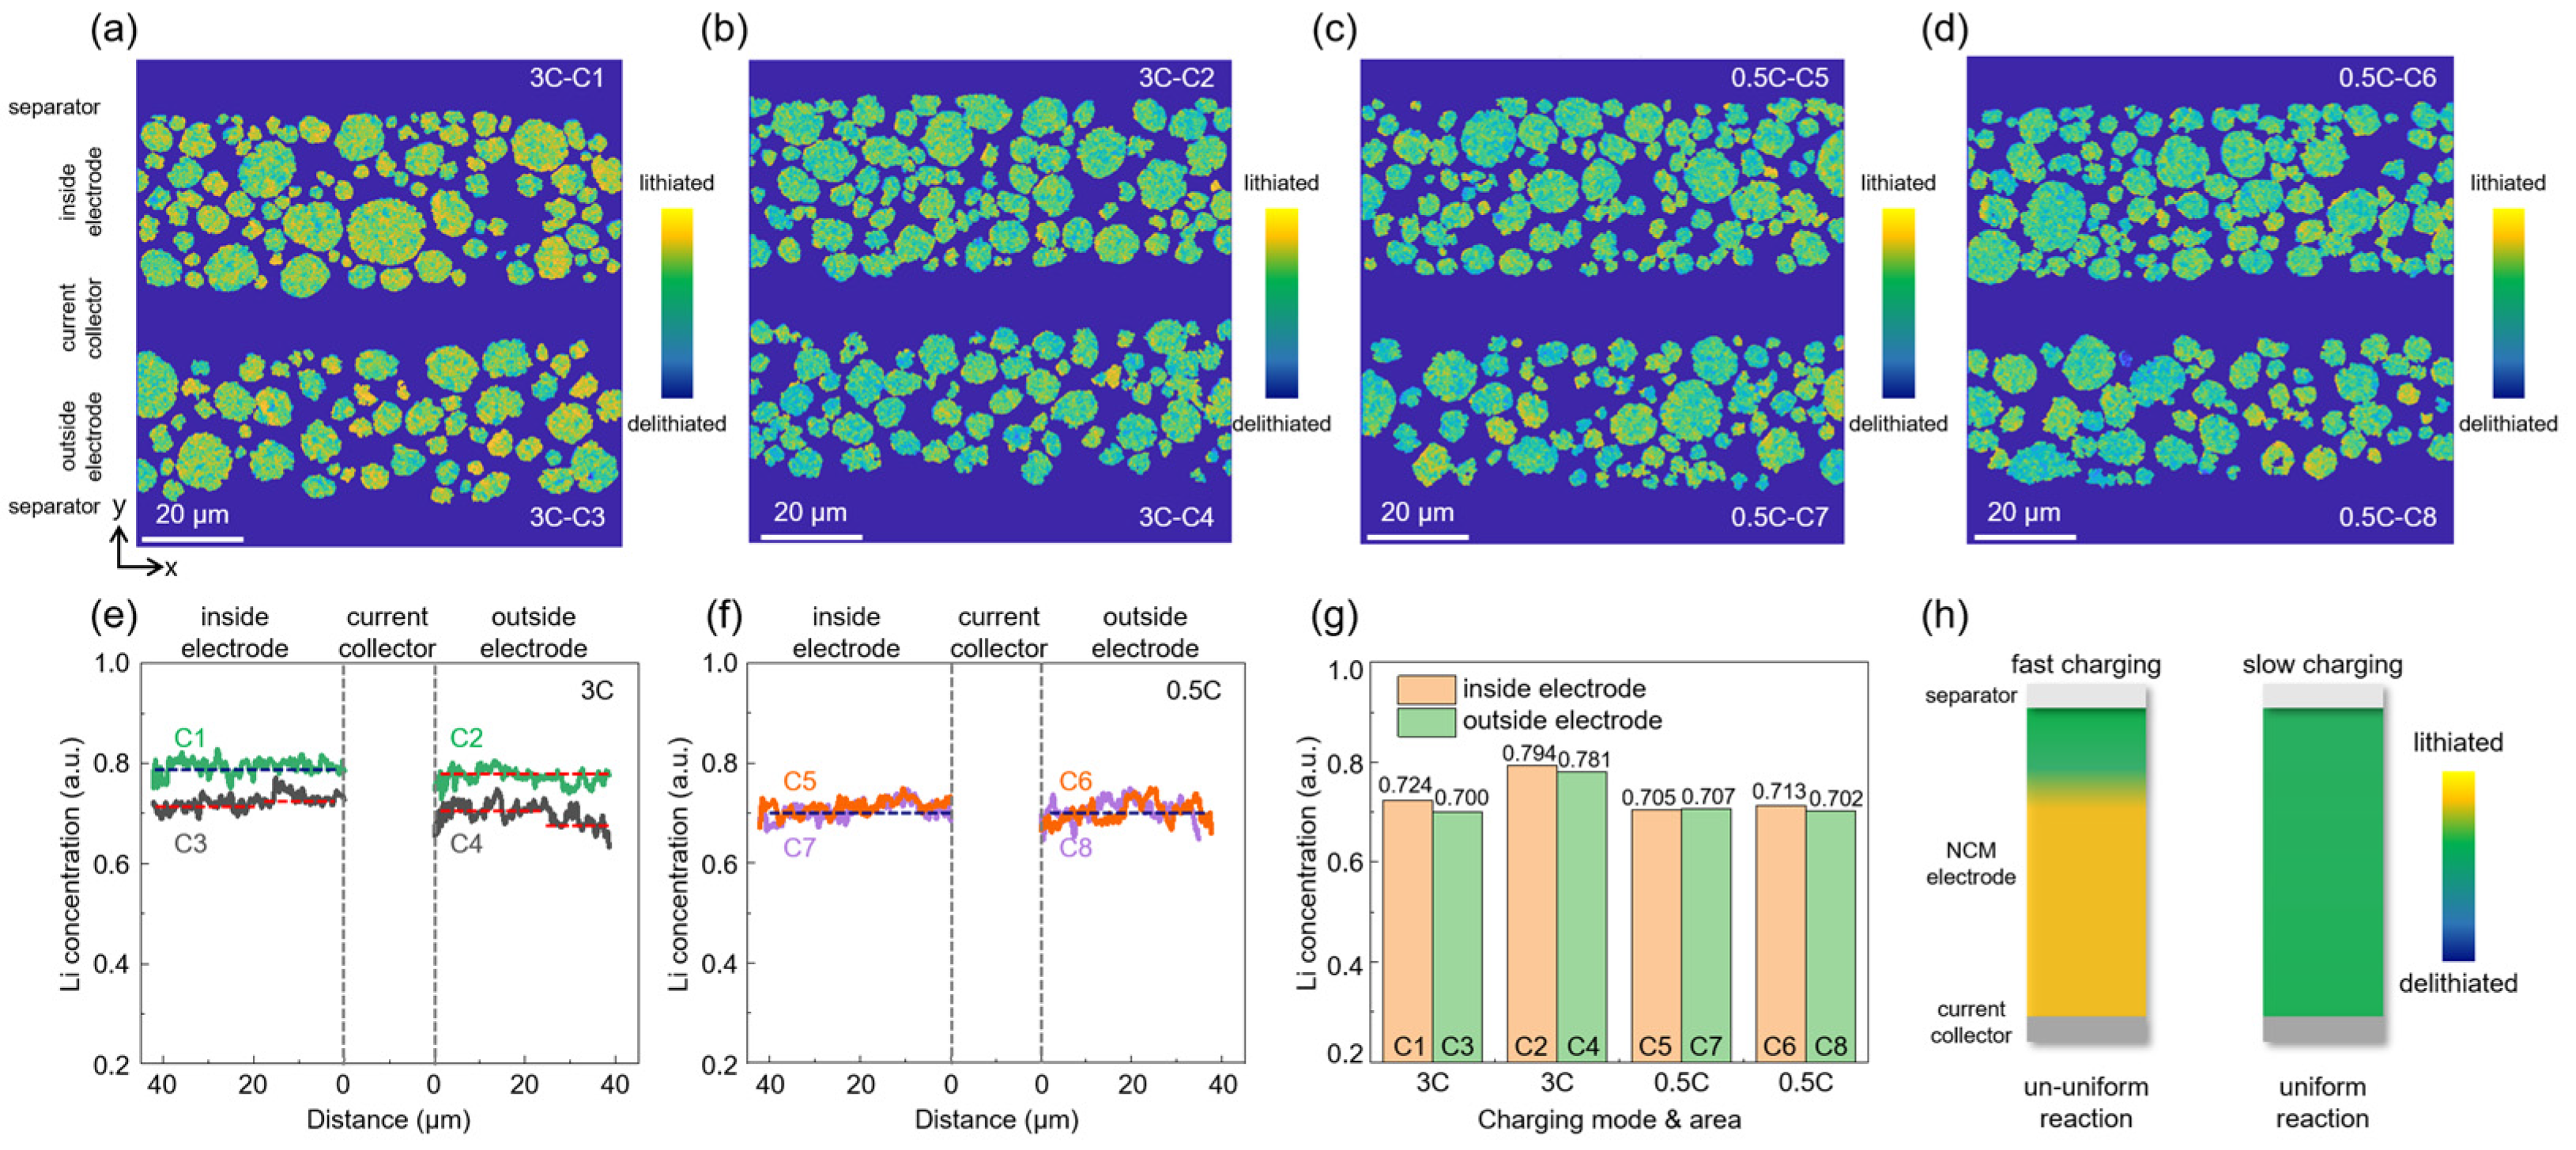
The NCM523 electrode exhibited different reaction non-uniformities under fast-charging and slow-charging conditions. Lithium mapping images of these cross-sections are shown in Figure 7a–d. And we obtained lithium distribution lines in the depth direction (Figure 7e,f), as well as the average lithium concentration (Figure 7f,g) of the whole cross-sections from the lithium images above. As observed in Figure 7e, under the fast-charging condition, the inner cathodes of cells (C1, C3) displayed significantly higher lithium concentrations than the outer ones (C2, C4). In the electrode’s depth (r-direction), the lithium concentration appeared uniform in the inside cathodes (C1, C2), while the outside ones exhibited a lithium concentration gradient (C3, C4). For the NCM523 cathode, a higher lithium concentration corresponds to the lower SoC. This implies that, during the fast-charging process, the reaction rate in the outer regions of the cathode surpassed that of the inner regions, and the reaction speed is higher in the outside areas than in the inside ones. Previous structural analyses revealed a correspondence between the inside/outside areas of the cathode with the outside/inside areas of the anode, respectively. Hence, these two distinct reaction non-uniformities in the cathode during the fast-charging process correspond to the characteristics of the anode. In contrast, during the slow-charging process, the lithium concentration remained similar among the four typical zones (Figure 7g), and the lithium distributions along the cross-section were uniform (Figure 7f). This indicates a consistent reaction process across the cathode under the slow-charging condition. In summary, under the fast-charging condition, the cathode exhibited two different reaction mechanisms: uniform and non-uniform reactions (Figure 7h). However, during the slow-charging process, only a uniform reaction mechanism was present. The non-uniform reactions in the cathode under the fast-charging operating condition interacted with the anode’s reaction characteristics, further exacerbating the macroscopic battery non-uniformities. The non-uniform reactions observed in both cathode and anode predominantly stemmed from the 3D structural heterogeneities present in the two jelly-roll electrodes. Therefore, addressing these non-uniform reactions could be achieved through the implementation of two advanced electrode fabrication techniques: (1) A revolutionizing macroscopic heterogeneous electrode design by incorporating reasonable area density differentiation on the inside/outside and inner/outer parts of the electrodes, thereby enhancing overall reaction uniformity during the fast-charging condition. (2) Innovating surface modifications and longitudinal designs of electrodes to elevate the 3D uniformity of electrode reactions.
4. Conclusions
This study demonstrates a direct relationship between the multi-scale heterogeneity of electrode reactions and the inherent structural non-uniformity of a cylindrical battery during an initial fast-charging process. We developed multi-scale integrated techniques involving multi-scale UDOF optical imaging and the NanoSIMs technique, enabling the rapid assessment of fast-charging reaction mechanisms. This significantly improves the understanding of fast-charging reaction mechanisms, innovates structural designs of batteries, accelerates the development cycle, refines the prediction mode for fast-charging cycling, and enhances battery safety. Given the inherent heterogeneity of electrode reactions within cylindrical batteries, we propose feasible improvement strategies during the initial manufacturing processes of electrolyte injection and electrode fabrication: optimizing electrolyte distribution through radial non-uniform injection, a revolutionary area density design for electrodes, as well as introducing novel designs for the single-coated anode area. We believe that concerted efforts between academia and industry can propel the widespread application of fast-charging batteries.
Supplementary Materials
The following supporting information can be downloaded at: https://www.mdpi.com/article/10.3390/batteries10030109/s1, Figure S1: (a) Overall expanded images of the lithiated graphite anodes between 3.7–4.2 V at four typical areas under fast-charging condition (3 C rate); (b) overall expanded images of the lithiated graphite anodes between 3.7–4.2 V under slow-charging condition (0.5 C rate). Figure S2: (a) Raw UDOF RGB image of graphite anode; (b) gray-scale image of panel a with a range of 0 to 255; (c) normalized of panel b with a range of 0 to 1.0; (d) samples of normalized and non-normalized RGB graphite SoC as labeled in panel (a) and panel (b). File S1: Matlab code for graphite anode SoC calculation.
Author Contributions
L.L. and D.M. conceived the research; D.M. carried out the experiments; L.L. and D.M. wrote the manuscript; L.L. supervised the project, Z.M. and L.L acquired the funding. All authors have read and agreed to the published version of the manuscript.
Funding
This work was supported by the National Natural Science Foundation of China (22378260), the National Key Research and Development Program of China (2021YFB3800300), and the Gansu Science and Technology Project (21ZD3GC001).
Data Availability Statement
The data that support the findings of this study are available from the corresponding author upon reasonable request.
Acknowledgments
The authors would like to thank IAC SJTU for multi-scale characterizations of the cells.
Conflicts of Interest
The authors declare no conflicts of interest. The funder had no role in the design of the study; in the collection, analyses, or interpretation of the data; in the writing of the manuscript; or in the decision to publish the results.
References
- Armand, M.; Axmann, P.; Bresser, D.; Copley, M.; Edström, K.; Ekberg, C.; Guyomard, D.; Lestriez, B.; Novák, P.; Petranikova, M.; et al. Lithium-ion batteries–Current state of the art and anticipated developments. J. Power Sources 2020, 479, 228708. [Google Scholar] [CrossRef]
- Yoshino, A. The birth of the lithium-ion battery. Angew. Chem. Int. Ed. 2012, 51, 5798–5800. [Google Scholar] [CrossRef] [PubMed]
- Jiang, B.H.; Raza, M.Y. Research on China’s renewable energy policies under the dual carbon goals: A political discourse analysis. Energy Strat. Rev. 2023, 48, 101118. [Google Scholar] [CrossRef]
- Li, T.; Ma, L.; Liu, Z.; Yi, C.; Liang, K. Dual carbon goal-based quadrilateral evolutionary game: Study on the new energy vehicle industry in China. Int. J. Environ. Res. Public Health 2023, 20, 3217. [Google Scholar] [CrossRef] [PubMed]
- Liu, X.L.; Zhao, F.Q.; Hao, H.; Liu, Z.W. Opportunities, challenges and strategies for developing electric vehicle energy storage systems under the carbon neutrality goal. World Electr. Veh. J. 2023, 14, 170. [Google Scholar] [CrossRef]
- Zeng, X.Q.; Li, M.; Abd El-Hady, D.; Alshitari, W.; Al-Bogami, A.S.; Lu, J.; Amine, K. Commercialization of lithium battery technologies for electric vehicles. Adv. Energy Mater. 2019, 9, 1900161. [Google Scholar] [CrossRef]
- Yu, A.; Wei, Y.Q.; Chen, W.W.; Peng, N.J.; Peng, L.H. Life cycle environmental impacts and carbon emissions: A case study of electric and gasoline vehicles in China. Transp. Res. Part D Transp. Environ. 2018, 65, 409–420. [Google Scholar] [CrossRef]
- Yu, R.J.; Cong, L.Z.; Li, Y.M.; Ran, C.J.; Zhao, D.C.; Li, P.; Van Mierlo, J. Prospects of passenger vehicles in China to meet dual carbon goals and bottleneck of critical materials from a fleet evolution perspective. World Electr. Veh. J. 2024, 15, 14. [Google Scholar] [CrossRef]
- Li, X.; Peng, Y.; He, Q.Q.; He, H.M.; Xue, S. Development of new-energy vehicles under the carbon peaking and carbon neutrality strategy in China. Sustainability 2023, 15, 7725. [Google Scholar] [CrossRef]
- Li, M.; Feng, M.; Luo, D.; Chen, Z.W. Fast charging Li-ion batteries for a new era of electric vehicles. Cell Rep. Phys. Sci. 2020, 1, 100212. [Google Scholar] [CrossRef]
- Chen, Y.Q.; Kang, Y.Q.; Zhao, Y.; Wang, L.; Liu, J.L.; Li, Y.X.; Liang, Z.; He, X.M.; Li, X.; Tavajohi, N.; et al. A review of lithium-ion battery safety concerns: The issues, strategies, and testing standards. J. Energy Chem. 2021, 59, 83–99. [Google Scholar] [CrossRef]
- Deng, J.; Bae, C.; Marcicki, J.; Masias, A.; Miller, T. Safety modelling and testing of lithium-ion batteries in electrified vehicles. Nat. Energy 2018, 3, 261–266. [Google Scholar] [CrossRef]
- Chakraborty, P.; Parker, R.; Hoque, T.; Cruz, J.; Du, L.L.; Wang, S.; Bhunia, S. Addressing the range anxiety of battery electric vehicles with charging en route. Sci. Rep. 2022, 12, 5588. [Google Scholar] [CrossRef] [PubMed]
- Kempton, W. Electric vehicles: Driving range. Nat. Energy 2016, 1, 16131. [Google Scholar] [CrossRef]
- Tomaszewska, A.; Chu, Z.Y.; Feng, X.N.; O’Kane, S.; Liu, X.H.; Chen, J.Y.; Ji, C.Z.; Endler, E.; Li, R.H.; Liu, L.S.; et al. Lithium-ion battery fast charging: A review. eTransportation 2019, 1, 100011. [Google Scholar] [CrossRef]
- Zhu, G.L.; Zhao, C.Z.; Huang, J.Q.; He, C.X.; Zhang, J.; Chen, S.H.; Xu, L.; Yuan, H.; Zhang, Q. Fast charging lithium batteries: Recent progress and future prospects. Small 2019, 15, e1805389. [Google Scholar] [CrossRef]
- Liu, Y.Y.; Zhu, Y.Y.; Cui, Y. Challenges and opportunities towards fast-charging battery materials. Nat. Energy 2019, 4, 540–550. [Google Scholar] [CrossRef]
- Weng, S.T.; Yang, G.J.; Zhang, S.M.; Liu, X.Z.; Zhang, X.; Liu, Z.P.; Cao, M.Y.; Ates, M.N.; Li, Y.J.; Chen, L.Q.; et al. Kinetic limits of graphite anode for fast-charging lithium-ion batteries. Nano-Micro Lett. 2023, 15, 215. [Google Scholar] [CrossRef]
- Yao, Y.X.; Chen, X.; Yao, N.; Gao, J.H.; Xu, G.; Ding, J.F.; Song, C.L.; Cai, W.L.; Yan, C.; Zhang, Q. Unlocking charge transfer limitations for extreme fast charging of Li-ion batteries. Angew. Chem. Int. Ed. 2023, 62, e202214828. [Google Scholar] [CrossRef]
- Huang, W.X.; Ye, Y.S.; Chen, H.; Vilá, R.A.; Xiang, A.; Wang, H.X.; Liu, F.; Yu, Z.A.; Xu, J.W.; Zhang, Z.W.; et al. Onboard early detection and mitigation of lithium plating in fast-charging batteries. Nat. Commun. 2022, 13, 7091. [Google Scholar] [CrossRef]
- Mao, C.Y.; Ruther, R.E.; Li, J.L.; Du, Z.J.; Belharouak, I. Identifying the limiting electrode in lithium ion batteries for extreme fast charging. Electrochem. Commun. 2018, 97, 37–41. [Google Scholar] [CrossRef]
- Li, J.Z.; Sharma, N.; Jiang, Z.S.; Yang, Y.; Monaco, F.; Xu, Z.R.; Hou, D.; Ratner, D.; Pianetta, P.; Cloetens, P.; et al. Dynamics of particle network in composite battery cathodes. Science 2022, 376, 517–521. [Google Scholar] [CrossRef] [PubMed]
- Xu, Z.R.; Rahman, M.M.; Mu, L.Q.; Liu, Y.J.; Lin, F. Chemomechanical behaviors of layered cathode materials in alkali metal ion batteries. J. Mater. Chem. 2018, 6, 21859–21884. [Google Scholar] [CrossRef]
- Weiss, M.; Ruess, R.; Kasnatscheew, J.; Levartovsky, Y.; Levy, N.R.; Minnmann, P.; Stolz, L.; Waldmann, T.; Wohlfahrt-Mehrens, M.; Aurbach, D.; et al. Fast charging of lithium-ion batteries: A review of materials aspects. Adv. Energy Mater. 2021, 11, 2101126. [Google Scholar] [CrossRef]
- Yue, X.Y.; Zhang, J.; Dong, Y.T.; Chen, Y.M.; Shi, Z.Q.; Xu, X.J.; Li, X.L.; Liang, Z. Reversible li plating on graphite anodes through electrolyte engineering for fast-charging batteries. Angew. Chem. Int. 2023, 62, e202302285. [Google Scholar] [CrossRef] [PubMed]
- Logan, E.R.; Dahn, J.R. Electrolyte design for fast-charging Li-ion batteries. Trends Chem. 2020, 2, 354–366. [Google Scholar] [CrossRef]
- Mancini, M.; Martin, J.; Ruggeri, I.; Drewett, N.; Axmann, P.; Wohlfahrt-Mehrens, M. Enabling fast-charging lithium-ion battery anodes: Influence of spheroidization on natural graphite. Batt. Supercaps 2022, 5, e202200109. [Google Scholar] [CrossRef]
- Cai, W.L.; Yan, C.; Yao, Y.X.; Xu, L.; Xu, R.; Jiang, L.L.; Huang, J.Q.; Zhang, Q. Rapid lithium diffusion in order@disorder pathways for fast-charging graphite anodes. Small Struct. 2020, 1, 2000010. [Google Scholar] [CrossRef]
- Lu, Y.Y.; Zhu, T.Y.; McShane, E.; McCloskey, B.D.; Chen, G.Y. Single-crystal LiNixMnyCo1−x−yO2 cathodes for extreme fast charging. Small 2022, 18, 2105833. [Google Scholar] [CrossRef]
- Kim, D.S.; Kim, Y.E.; Kim, H. Improved fast charging capability of graphite anodes via amorphous Al2O3 coating for high power lithium ion batteries. J. Power Sources 2019, 422, 18–24. [Google Scholar] [CrossRef]
- Doyle, M.; Fuller, T.F.; Newman, J. Modeling of galvanostatic charge and discharge of the lithium/polymer/insertion cell. J. Electrochem. Soc. 1993, 140, 1526–1533. [Google Scholar] [CrossRef]
- Fuller, T.F.; Doyle, M.; Newman, J. Simulation and optimization of the dual lithium ion insertion cell. J. Electrochem. Soc. 1994, 141, 1–10. [Google Scholar] [CrossRef]
- Wang, F.; Tang, M. Thermodynamic origin of reaction non-uniformity in battery porous electrodes and its mitigation. J. Electrochem. Soc. 2020, 167, 120543. [Google Scholar] [CrossRef]
- Kuang, Y.D.; Chen, C.J.; Kirsch, D.; Hu, L.B. Thick electrode batteries: Principles, opportunities, and challenges. Adv. Energy Mater. 2019, 9, 1901457. [Google Scholar] [CrossRef]
- Xu, H.Y.; Zhu, J.E.; Finegan, D.P.; Zhao, H.B.; Lu, X.K.; Li, W.; Hoffman, N.; Bertei, A.; Shearing, P.; Bazant, M.Z. Guiding the design of heterogeneous electrode microstructures for Li-ion batteries: Microscopic imaging, predictive modeling, and machine learning. Adv. Energy Mater. 2021, 11, 2003908. [Google Scholar] [CrossRef]
- Lu, X.K.; Bertei, A.; Finegan, D.P.; Tan, C.; Daemi, S.R.; Weaving, J.S.; O’Regan, K.B.; Heenan, T.M.M.; Hinds, G.; Kendrick, E.; et al. 3D microstructure design of lithium-ion battery electrodes assisted by X-ray nano-computed tomography and modelling. Nat. Commun. 2020, 11, 2079. [Google Scholar] [CrossRef]
- Xue, Z.C.; Sharma, N.; Wu, F.X.; Pianetta, P.; Lin, F.; Li, L.X.; Zhao, K.J.; Liu, Y.J. Asynchronous domain dynamics and equilibration in layered oxide battery cathode. Nat. Commun. 2023, 14, 8394. [Google Scholar] [CrossRef] [PubMed]
- Sharma, N.; de Vasconcelos, L.S.; Hassan, S.; Zhao, K.J. Asynchronous-to-synchronous transition of Li reactions in solid-solution cathodes. Nano Lett. 2022, 22, 5883–5890. [Google Scholar] [CrossRef]
- Kazyak, E.; Chen, K.H.; Chen, Y.X.; Cho, T.H.; Dasgupta, N.P. Enabling 4C fast charging of lithium-ion batteries by coating graphite with a solid-state electrolyte. Adv. Energy Mater. 2022, 12, 2102618. [Google Scholar] [CrossRef]
- Lu, L.L.; Lu, Y.Y.; Zhu, Z.X.; Shao, J.X.; Yao, H.B.; Wang, S.G.; Zhang, T.W.; Ni, Y.; Wang, X.X.; Yu, S.H. Extremely fast-charging lithium ion battery enabled by dual-gradient structure design. Sci. Adv. 2022, 8, eabm6624. [Google Scholar] [CrossRef]
- Chen, K.H.; Goel, V.; Namkoong, M.J.; Wied, M.; Müller, S.; Wood, V.; Sakamoto, J.; Thornton, K.; Dasgupta, N.P. Enabling 6C fast charging of Li-ion batteries with graphite/hard carbon hybrid anodes. Adv. Energy Mater. 2021, 11, 2003336. [Google Scholar] [CrossRef]
- Vishnugopi, B.S.; Verma, A.; Mukherjee, P.P. Fast charging of lithium-ion batteries via electrode engineering. J. Electrochem. Soc. 2020, 167, 090508. [Google Scholar] [CrossRef]
- Yang, J.; Li, Y.J.; Mijailovic, A.; Wang, G.Y.; Xiong, J.; Mathew, K.; Lu, W.Q.; Sheldon, B.W.; Wu, Q.L. Gradient porosity electrodes for fast charging lithium-ion batteries. J. Mater. Chem. A 2022, 10, 12114–12124. [Google Scholar] [CrossRef]
- Bridgewater, G.; Capener, M.J.; Brandon, J.; Lain, M.J.; Copley, M.; Kendrick, E. A comparison of lithium ion cell performance across three different cell formats. Batteries 2021, 7, 38. [Google Scholar] [CrossRef]
- Sturm, J.; Frank, A.; Rheinfeld, A.; Erhard, S.V.; Jossen, A. Impact of electrode and cell design on fast charging capabilities of cylindrical lithium-ion batteries. J. Electrochem. Soc. 2020, 167, 130505. [Google Scholar] [CrossRef]
- Waldmann, T.; Scurtu, R.G.; Richter, K.; Wohlfahrt-Mehrens, M. 18650 vs. 21700 Li-ion cells—A direct comparison of electrochemical, thermal, and geometrical properties. J. Power Sources 2020, 472, 228614. [Google Scholar] [CrossRef]
- Parmananda, M.; Norris, C.; Roberts, S.A.; Mukherjee, P.P. Probing the role of multi-scale heterogeneity in graphite electrodes for extreme fast charging. ACS Appl. Mater. Interfaces 2022, 14, 18335–18352. [Google Scholar] [CrossRef]
- Günter, F.J.; Burgstaller, C.; Konwitschny, F.; Reinhart, G. Influence of the electrolyte quantity on lithium-ion cells. J. Electrochem. Soc. 2019, 166, A1709–A1714. [Google Scholar] [CrossRef]
- Shodiev, A.; Primo, E.; Arcelus, O.; Chouchane, M.; Osenberg, M.; Hilger, A.; Manke, I.; Li, J.L.; Franco, A.A. Insight on electrolyte infiltration of lithium ion battery electrodes by means of a new three-dimensional-resolved lattice Boltzmann model. Energy Storage Mater. 2021, 38, 80–92. [Google Scholar] [CrossRef]
- Mühlbauer, M.J.; Petz, D.; Baran, V.; Dolotko, O.; Hofmann, M.; Kostecki, R.; Senyshyn, A. Inhomogeneous distribution of lithium and electrolyte in aged Li-ion cylindrical cells. J. Power Sources 2020, 475, 228690. [Google Scholar] [CrossRef]
- Lu, X.K.; Lagnoni, M.; Bertei, A.; Das, S.; Owen, R.E.; Li, Q.; O’Regan, K.; Wade, A.; Finegan, D.P.; Kendrick, E.; et al. Multiscale dynamics of charging and plating in graphite electrodes coupling operando microscopy and phase-field modelling. Nat. Commun. 2023, 14, 5127. [Google Scholar] [CrossRef] [PubMed]
- Sui, T.; Song, B.H.; Dluhos, J.; Lu, L.; Korsunsky, A.M. Nanoscale chemical mapping of Li-ion battery cathode material by FIB-SEM and TOF-SIMS multi-modal microscopy. Nano Energy 2015, 17, 254–260. [Google Scholar] [CrossRef]
- Bessette, S.; Paolella, A.; Kim, C.; Zhu, W.; Hovington, P.; Gauvin, R.; Zaghib, K. Nanoscale lithium quantification in LiXNiyCowMnzO2 as cathode for rechargeable batteries. Sci. Rep. 2018, 8, 17575. [Google Scholar] [CrossRef] [PubMed]
Figure 1.
Comparisons of the fast-charging (3 C) and slow-charging (0.5 C) electrochemistry behaviors during the initial charging cycle for the 18650-type cell. (a) Charging and discharging curves for fast charging and slow charging in first cycle. (b) Charging capacity ratio curves for fast charging and slow charging, as well as their charging capacity ratio difference curve. (c) Charging capacity ratio comparison of cell at different cut-off voltages for fast charging and slow charging, with red and green dashed lines representing the growth trends of charging capacity percentage, while the grey dashed line indicating a close resemblance in charging capacity percentage between fast charging and slow charging.

Figure 2.
Structural non-uniformity of 18650-type cell and its influence on the charging heterogeneity of graphite cathodes. (a) The main compositions of a 18650-type cell. (b) The overall cross-sectional slice of the cell at the macro-scale in the xy plane from X-ray CT. (c) SEM cross-sectional image of the inner section at the meso-scale in the xy plane from panel (b). (d) SEM cross-sectional image showing the main compositions of the cell, double-coated structures of electrodes, and compressed/stressed states of the double-coated NCM523 cathode/graphite electrodes at the meso-scale in the xy plane from panel (c). (e) Three-dimensional X-ray CT perspective view of the 18650-type cell. (f) Top, middle, and bottom cross-sectional slices along the z-direction in panel (e). (g) A typical cross-sectional 2D CT slice in the xy plane. (h) Calculation of the spacing distance of the adjacent cathode circles from panel (g). (i) Electrode spacing diagram of the wound core on the same xy plane. (j) Electrode spacing diagram of the wound core in the z-direction. (k,l) Overall optical images at the macro-scale of lithiated graphite anode plates with similar state of capacity (SoC) after fast charging and slow charging from the disassembling of the 18650-type cells.

Figure 3.
Quasi-operando ultra-depth-of-field (UDOF) optical characterization of the lithiated graphite anodes during the fast-charging and slow-charging processes of 2 Ah 18650-type cells. (a) UDOF optical characterization of the lithiated graphite anodes. (b) Seal and multi-scale UDOF optical images of the lithiated graphite anodes. (c,d) Quasi-operando lithiation UDOF images of a graphite anode for the initial fast-charging and slow-charging processes at the same area (S1 and S5) of the 2 Ah 18650-type cells.

Figure 4.
Quasi-operando UDOF optical images of lithiated graphite anodes during the fast-charging and slow-charging processes of 2 Ah 18650-type cells. (a) UDOF optical images of lithiated graphite anodes between 3.7 and 4.2 V at four typical areas (S1–S4) under fast-charging condition. (b) UDOF optical images of lithiated graphite anodes between 3.7 V and 4.2 V at four typical areas (S5–S8) under slow-charging condition.
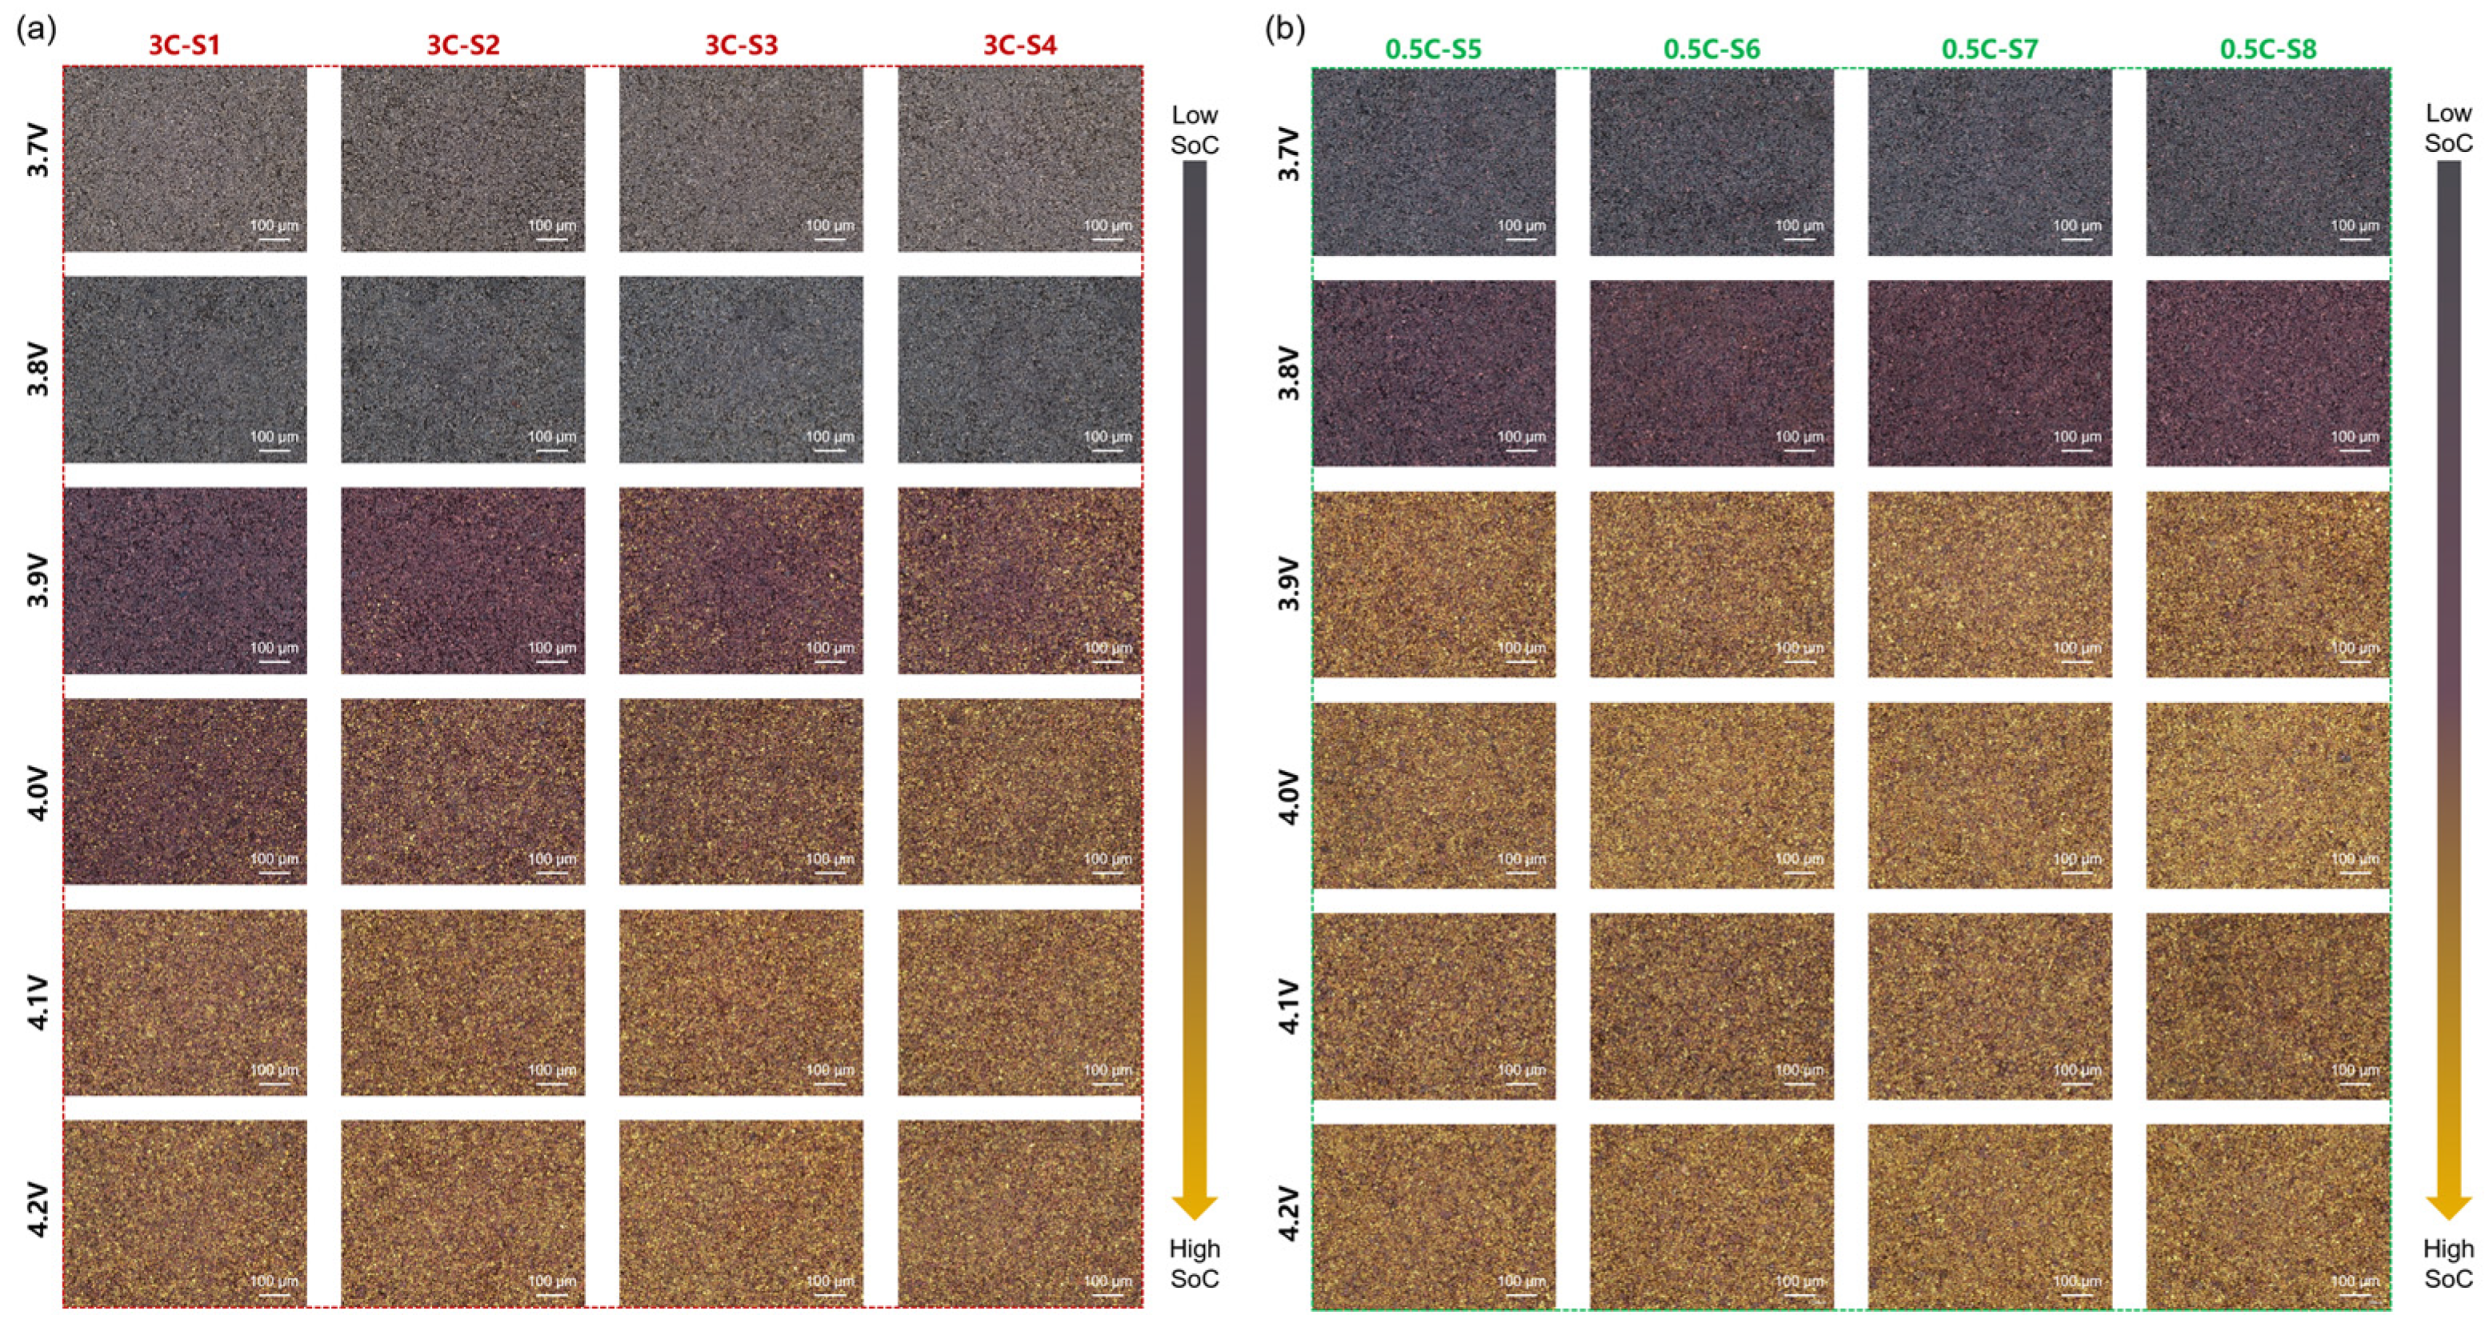
Figure 5.
Reaction heterogeneity of graphite anode at multiple scales during fast charging and slow charging. (a) Optical images of graphite anode across different sections (59 × 59 mm2) of the electrode. (b) UDOF images of graphite SoC in z-direction at macroscopic scale (59 × 3.5 mm2) from panel (a). (c) Depth distribution curves of graphite SoC for panel (b). (d) Images of graphite SoC in x-direction at macroscopic scale (diameter = 10 mm). (e) Distribution curves of graphite SoC for panel (d). (f) UDOF images of graphite SoC in x-direction at meso scale (500 × 500 μm2). (g) Distribution curves of graphite SoC for panel (f).

Figure 6.
Electrode reaction heterogeneity and lithium deposition on the single-coated side of graphite anode. (a) Optical image of single-coated side of graphite anode after fast charging to 4.0 V. (b–d) SEM images of the graphite anode from panel (a), with moss-like Li, dendritic Li and electrolyte decomposing byproduct marked with yellow arrows, white circles and red circles. (e–g) Element distribution images of C, F, and Li at the surface of graphite from panel (d). (h) Optical image of single-coated side of graphite anode after slow charging to 3.9 V. (i–k) SEM images of the graphite anode from panel (h). (l–n) Element distribution images of C, F, and Li at the surface of graphite from panel (k). (o) SEM image of lithium islands from panel (a). (p) Label of lithium islands in panel (o). (q) Equivalent radius distribution of the lithium islands from panel (p). (r) Pie chart of the percentage of lithium islands from panel (p).

Figure 7.
Electrode reaction heterogeneities in the cross-sectional NCM523 cathodes in 18650-type cells under fast-charging and slow-charging conditions. (a–d) Lithium mapping images of different cross-sectional sections in the NCM523 cathodes using NanoSIMs. (e,f) Lithium concentration curves across the cathodes after fast charging and slow charging, with dash lines showing whether the curves are gradient. (g) Comparison of lithium concentrations for the fast-charged and slow-charged cathodes. (h) Electrode reaction mechanisms of NCM523 cathode in 18650-type cells under fast-charging and slow-charging working conditions.
Disclaimer/Publisher’s Note: The statements, opinions and data contained in all publications are solely those of the individual author(s) and contributor(s) and not of MDPI and/or the editor(s). MDPI and/or the editor(s) disclaim responsibility for any injury to people or property resulting from any ideas, methods, instructions or products referred to in the content. |
© 2024 by the authors. Licensee MDPI, Basel, Switzerland. This article is an open access article distributed under the terms and conditions of the Creative Commons Attribution (CC BY) license (https://creativecommons.org/licenses/by/4.0/).
Share and Cite
MDPI and ACS Style
Meng, D.; Ma, Z.; Li, L. Multi-Scale Heterogeneity of Electrode Reaction for 18650-Type Lithium-Ion Batteries during Initial Charging Process. Batteries 2024, 10, 109. https://doi.org/10.3390/batteries10030109
AMA Style
Meng D, Ma Z, Li L. Multi-Scale Heterogeneity of Electrode Reaction for 18650-Type Lithium-Ion Batteries during Initial Charging Process. Batteries. 2024; 10(3):109. https://doi.org/10.3390/batteries10030109
Chicago/Turabian StyleMeng, Dechao, Zifeng Ma, and Linsen Li. 2024. "Multi-Scale Heterogeneity of Electrode Reaction for 18650-Type Lithium-Ion Batteries during Initial Charging Process" Batteries 10, no. 3: 109. https://doi.org/10.3390/batteries10030109
Note that from the first issue of 2016, this journal uses article numbers instead of page numbers. See further details here.