
Numerical Investigation of Thermal Management of a Large Format Pouch Battery Using Combination of CPCM and Liquid Cooling
 , , , and
Abstract
:1. Introduction
2. LIB Cell Specification
3. Numerical Model
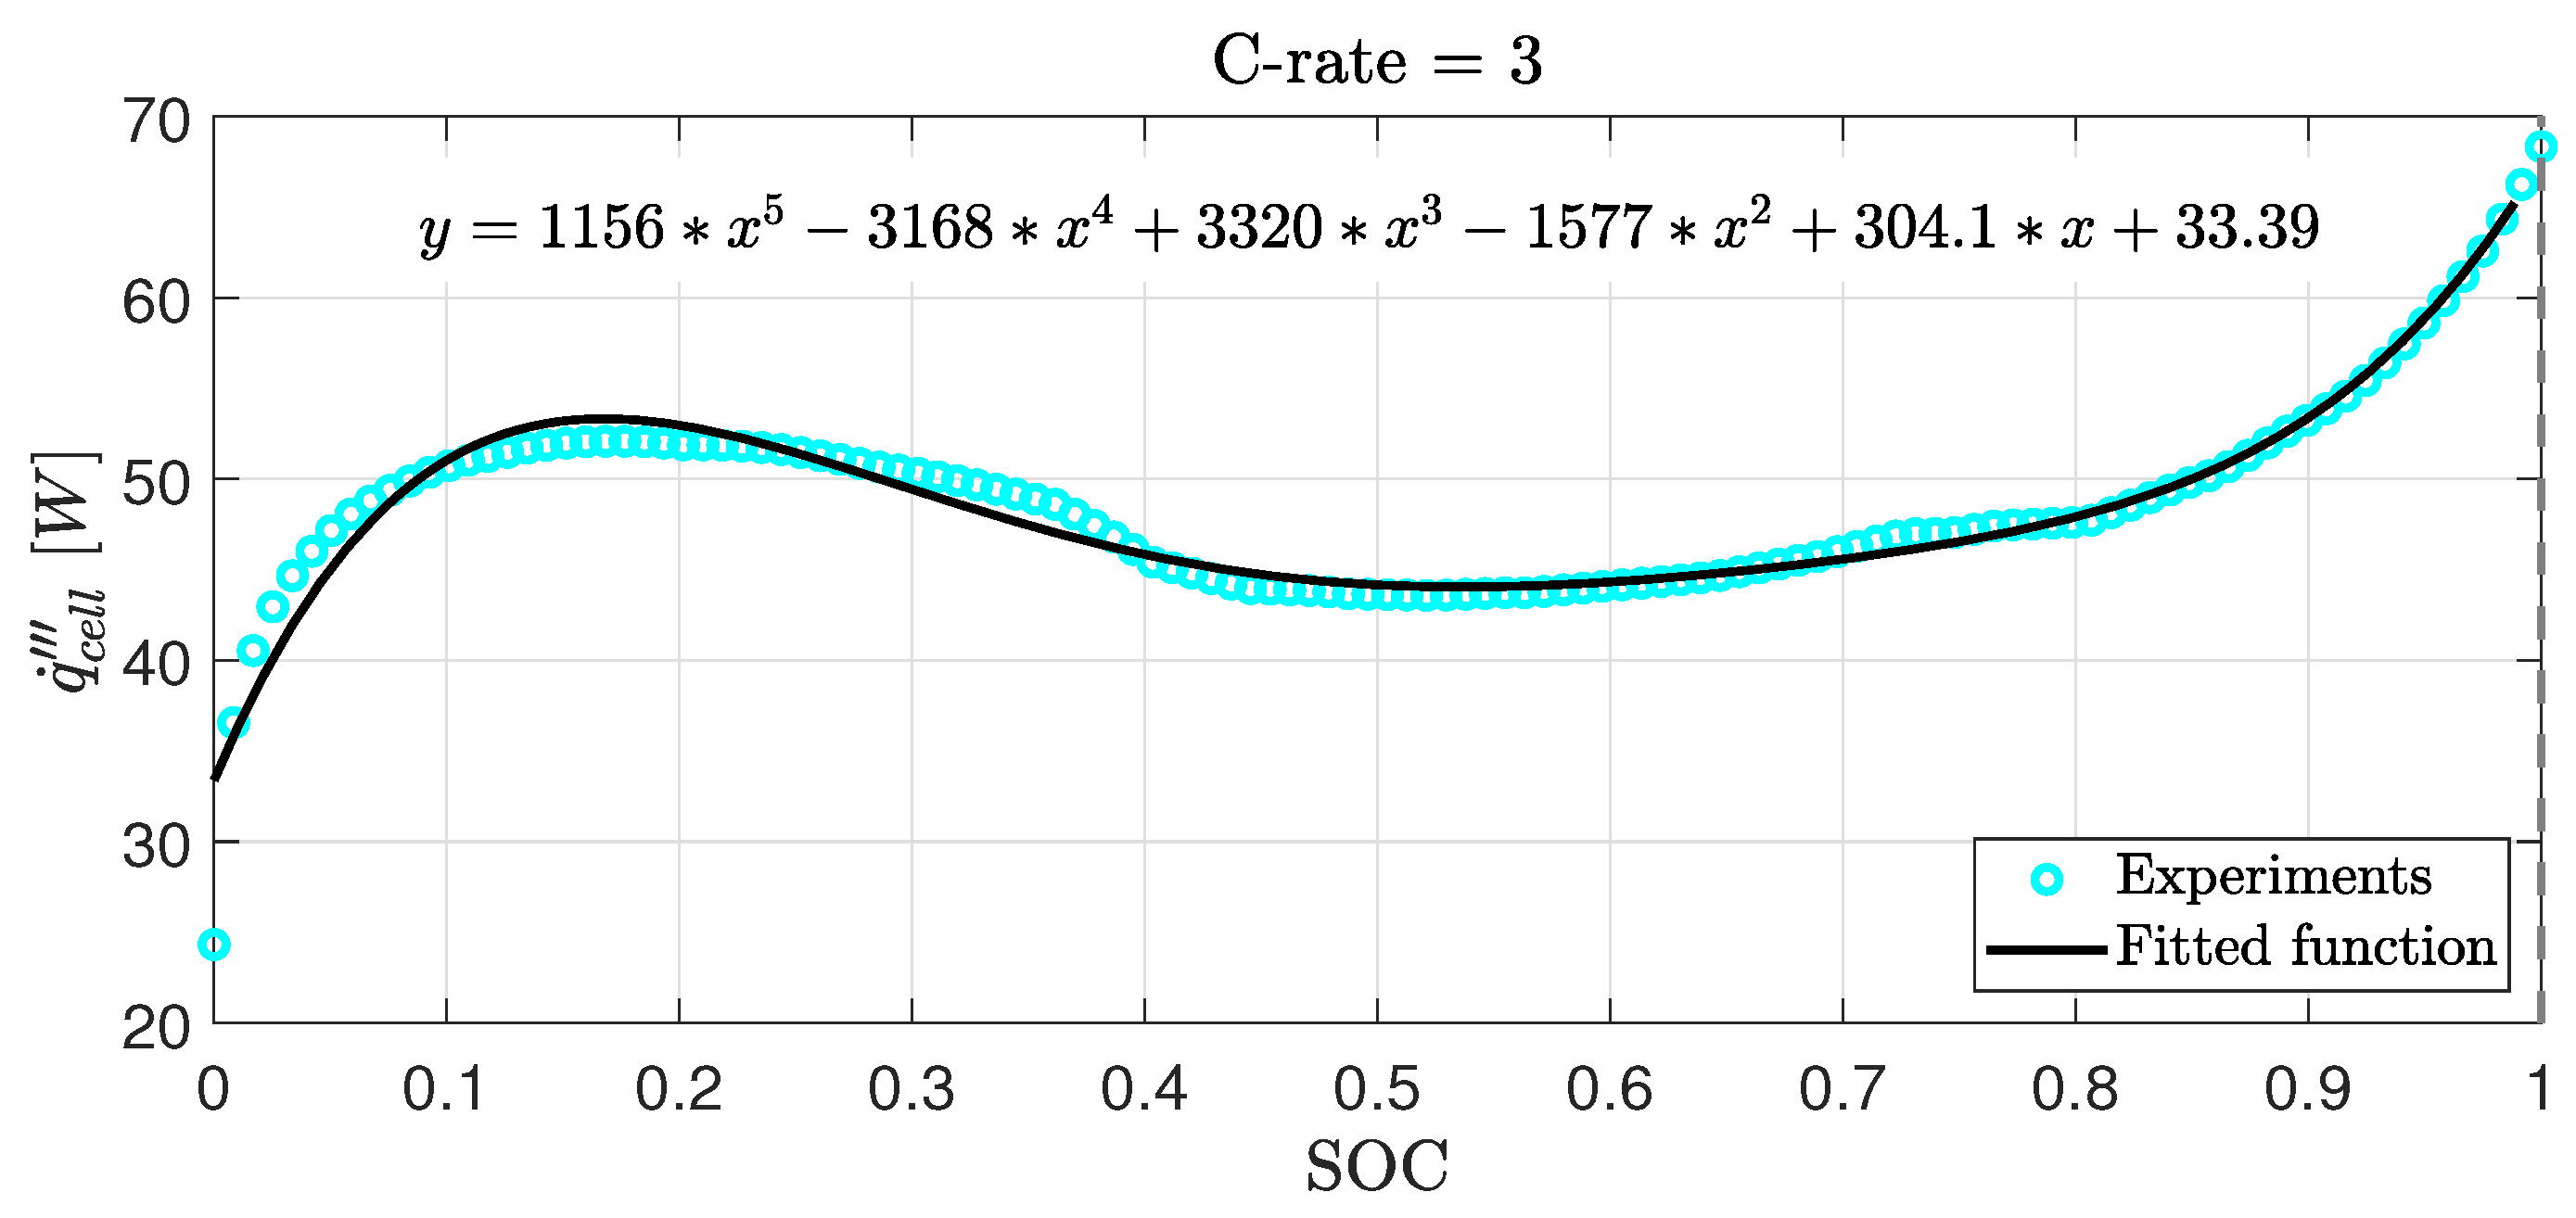
3.1. LIB Cells
3.2. CPCM
3.3. Liquid Cooling
3.4. Simulation Domain
3.5. Boundary Conditions
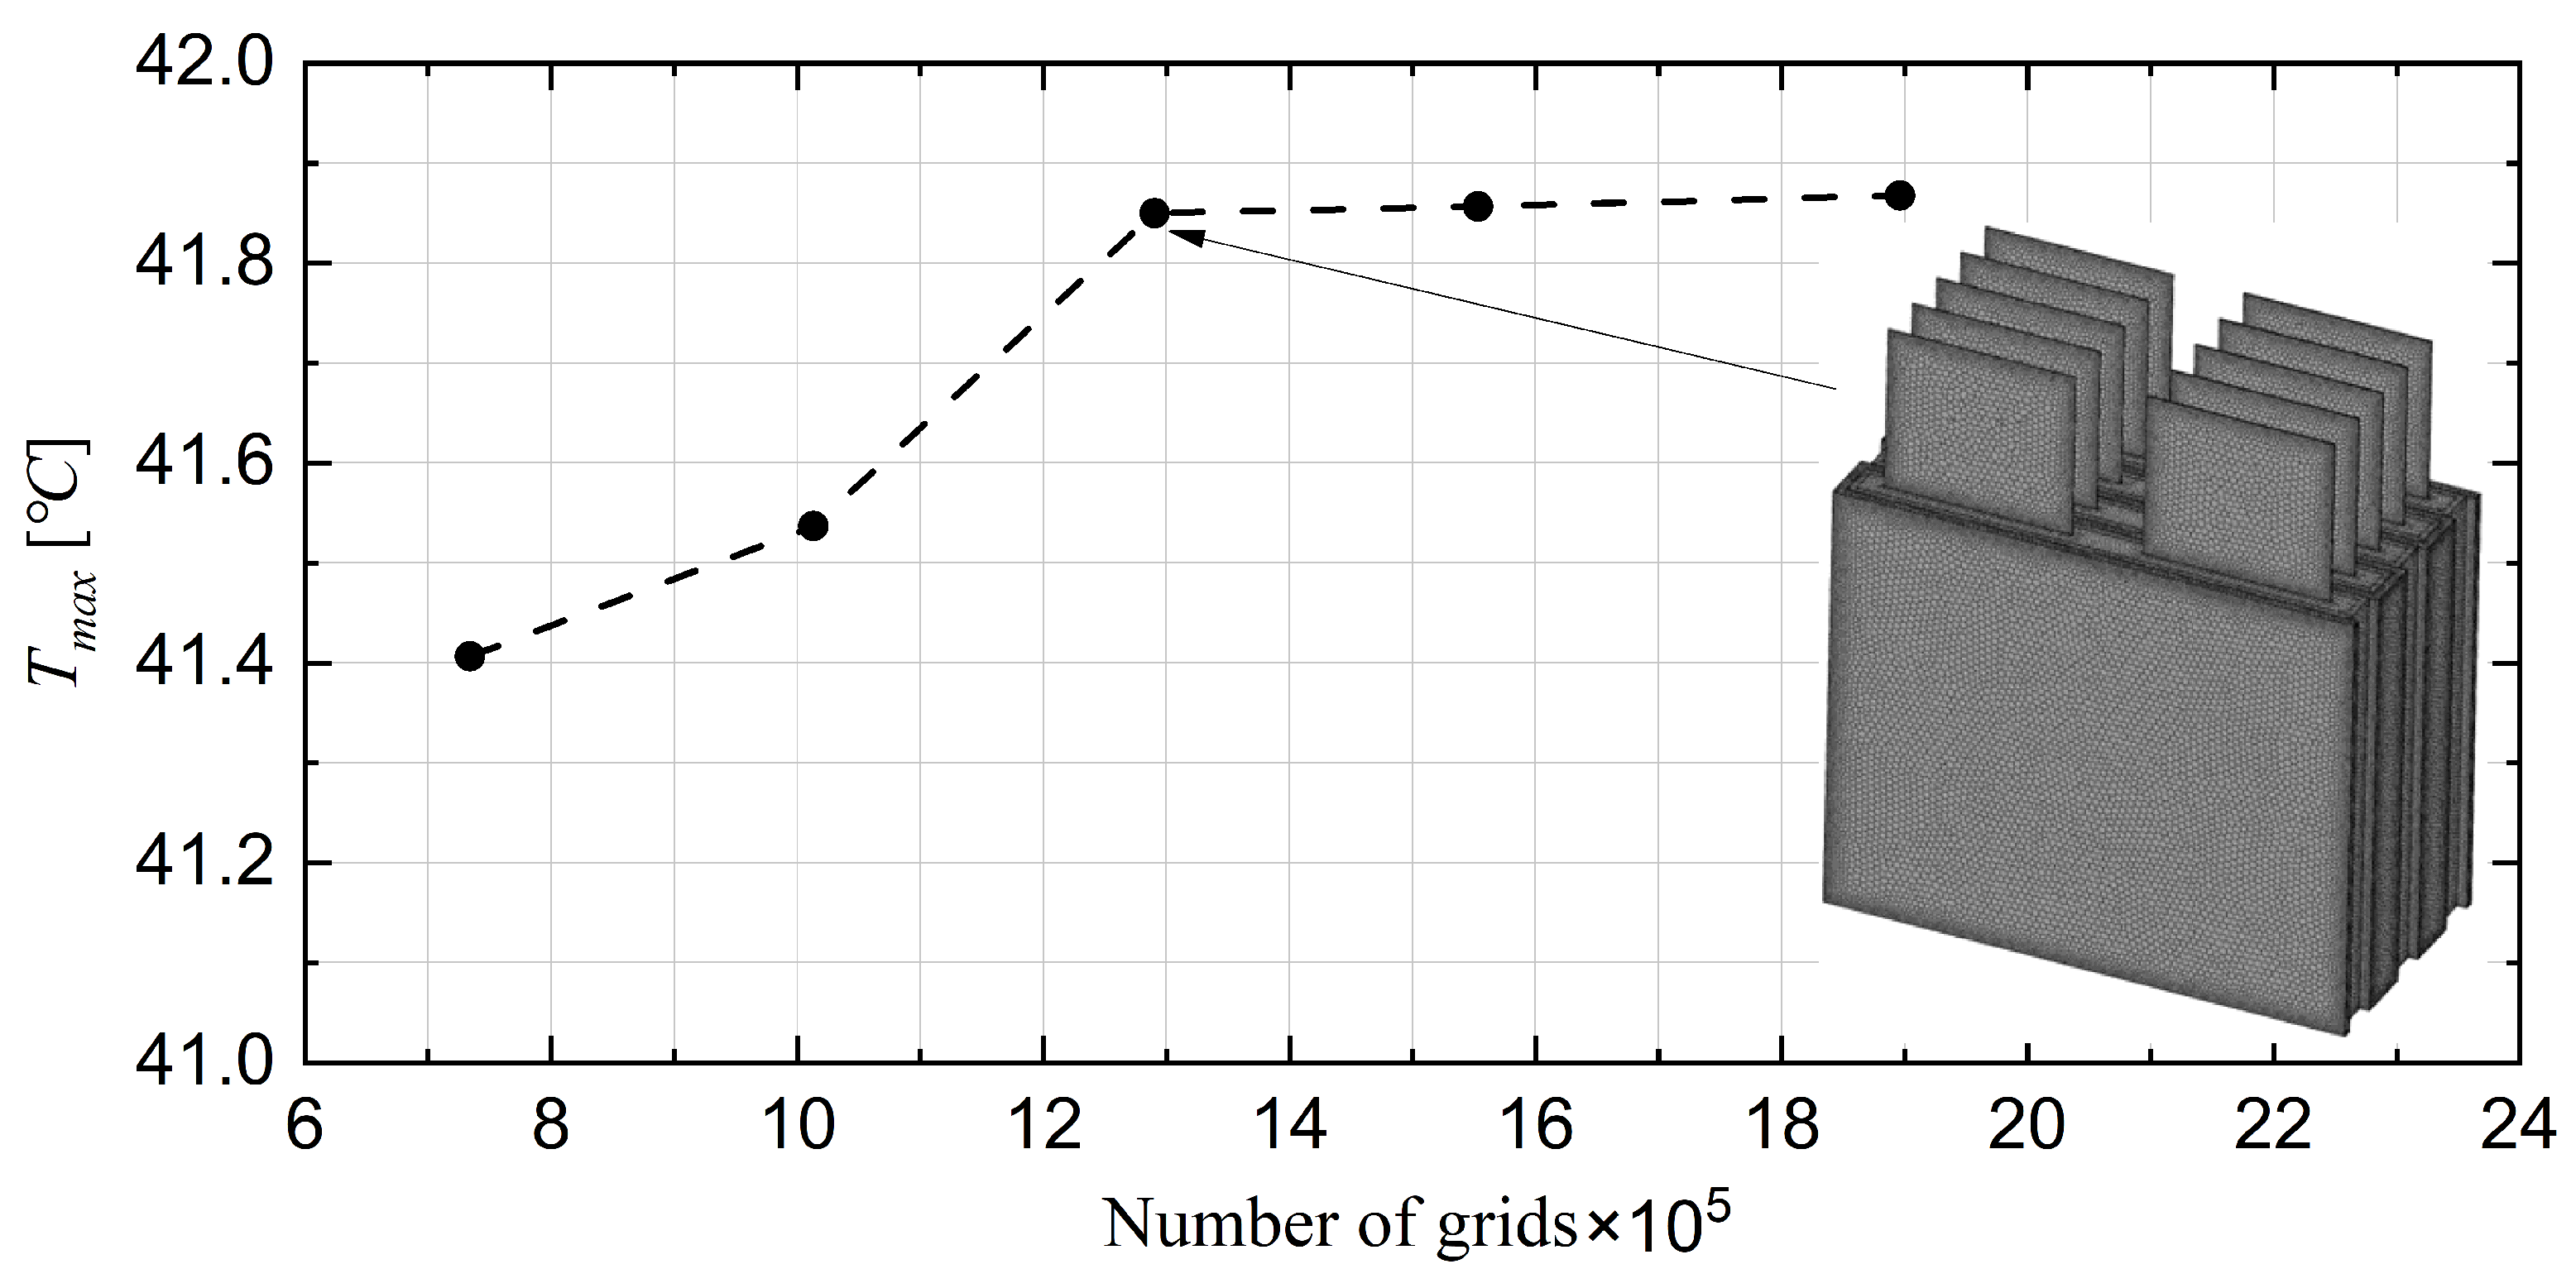
3.6. Mesh Sensitivity Analysis and Validation
4. Results and Discussion
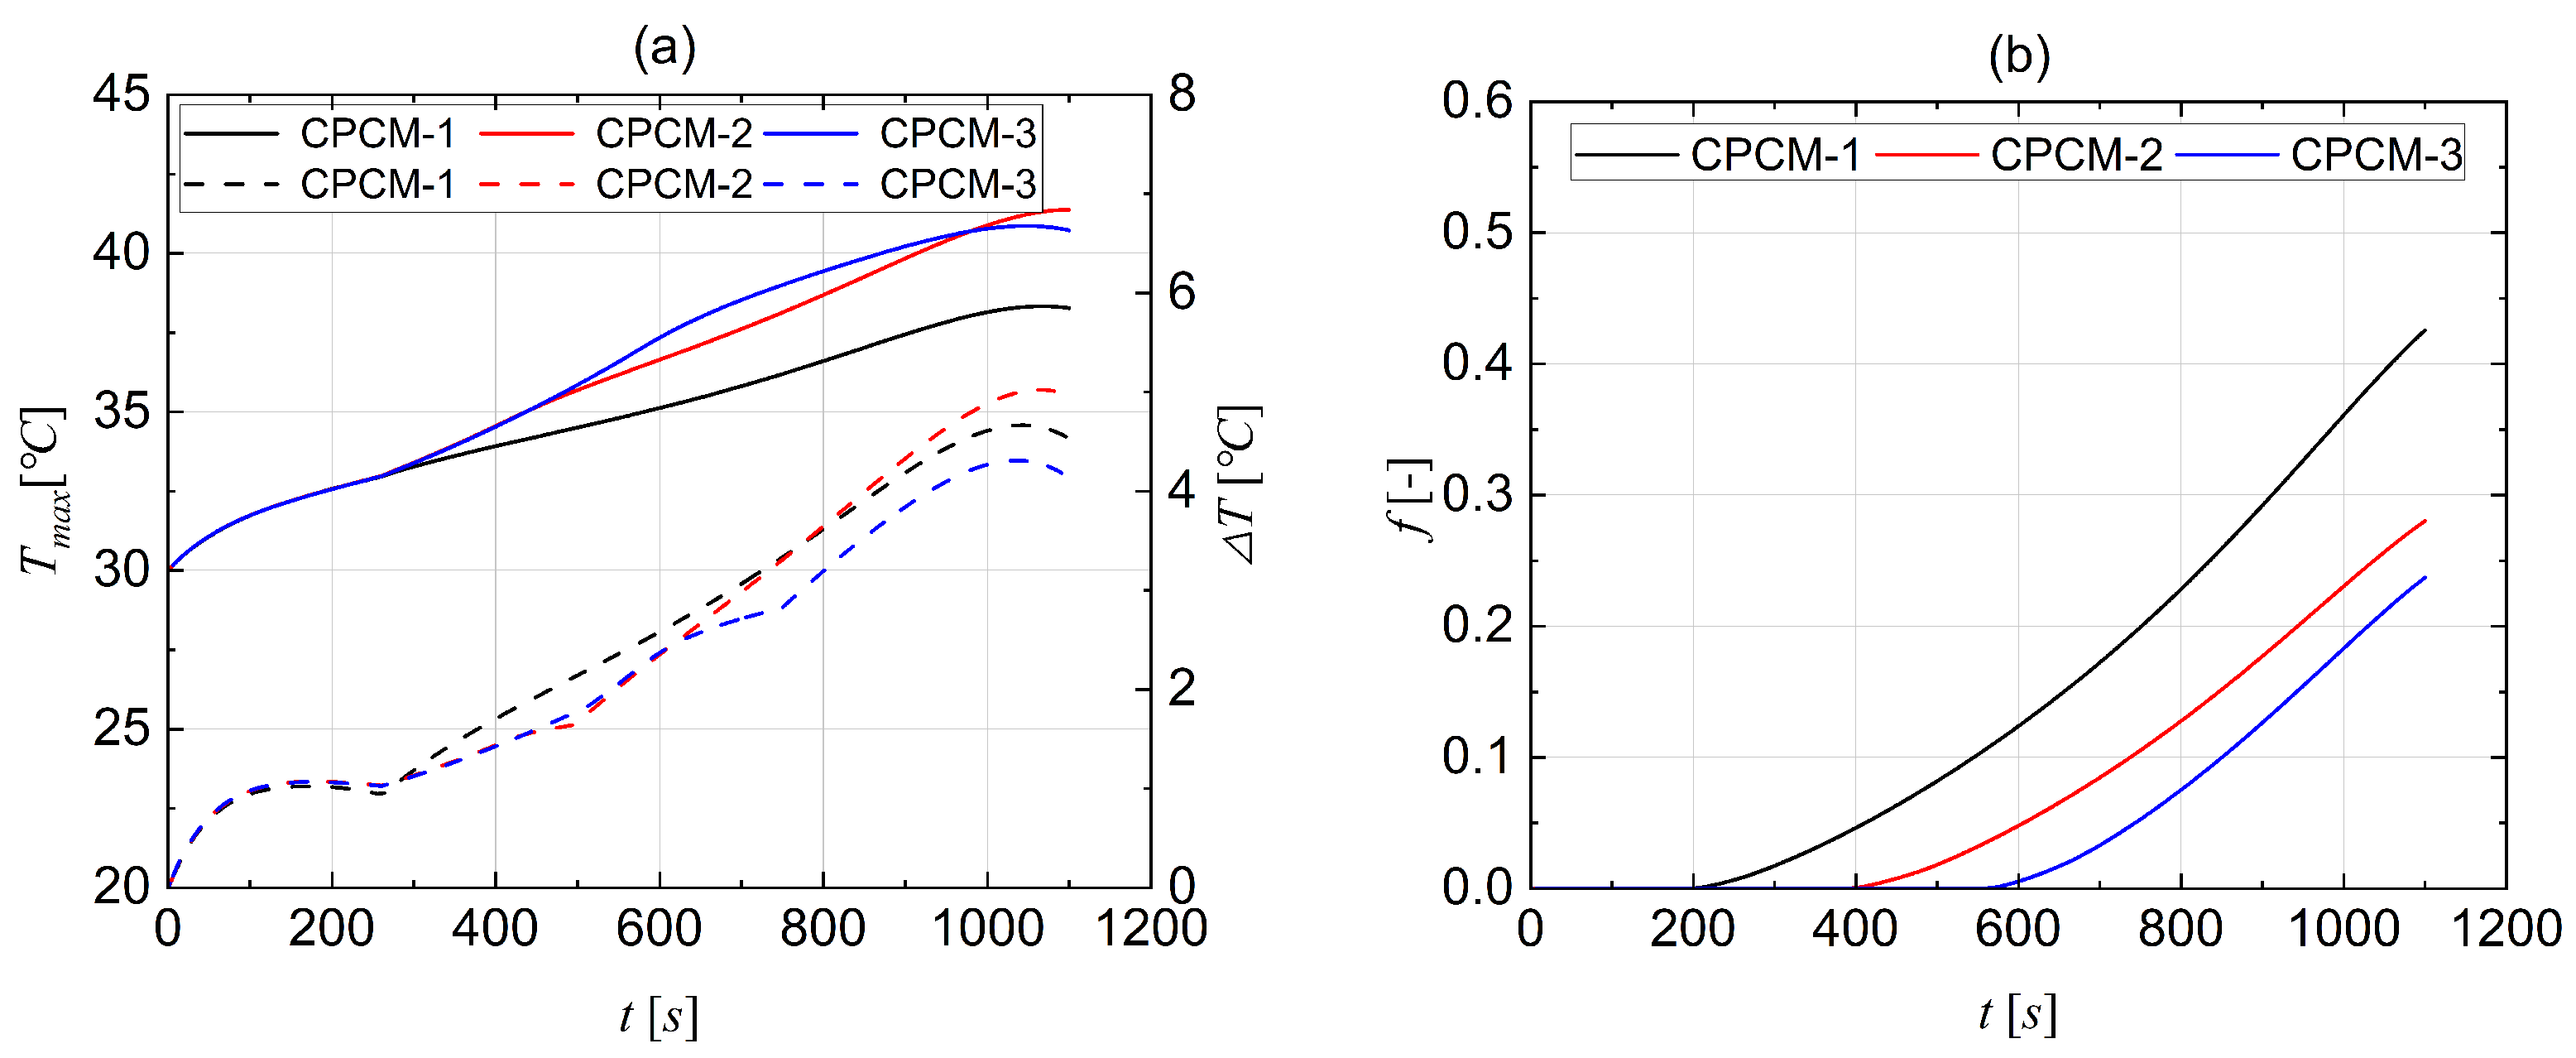
4.1. Comparative Selection of CPCMs
4.2. Performance of the Hybrid Cooling Model
4.3. Optimising BTMS Energy Consumption
4.4. Safety of BTMS
4.5. Configuration (4) Performance under a Drive Cycle
4.6. Cell Thermal Runaway Event
5. Conclusions
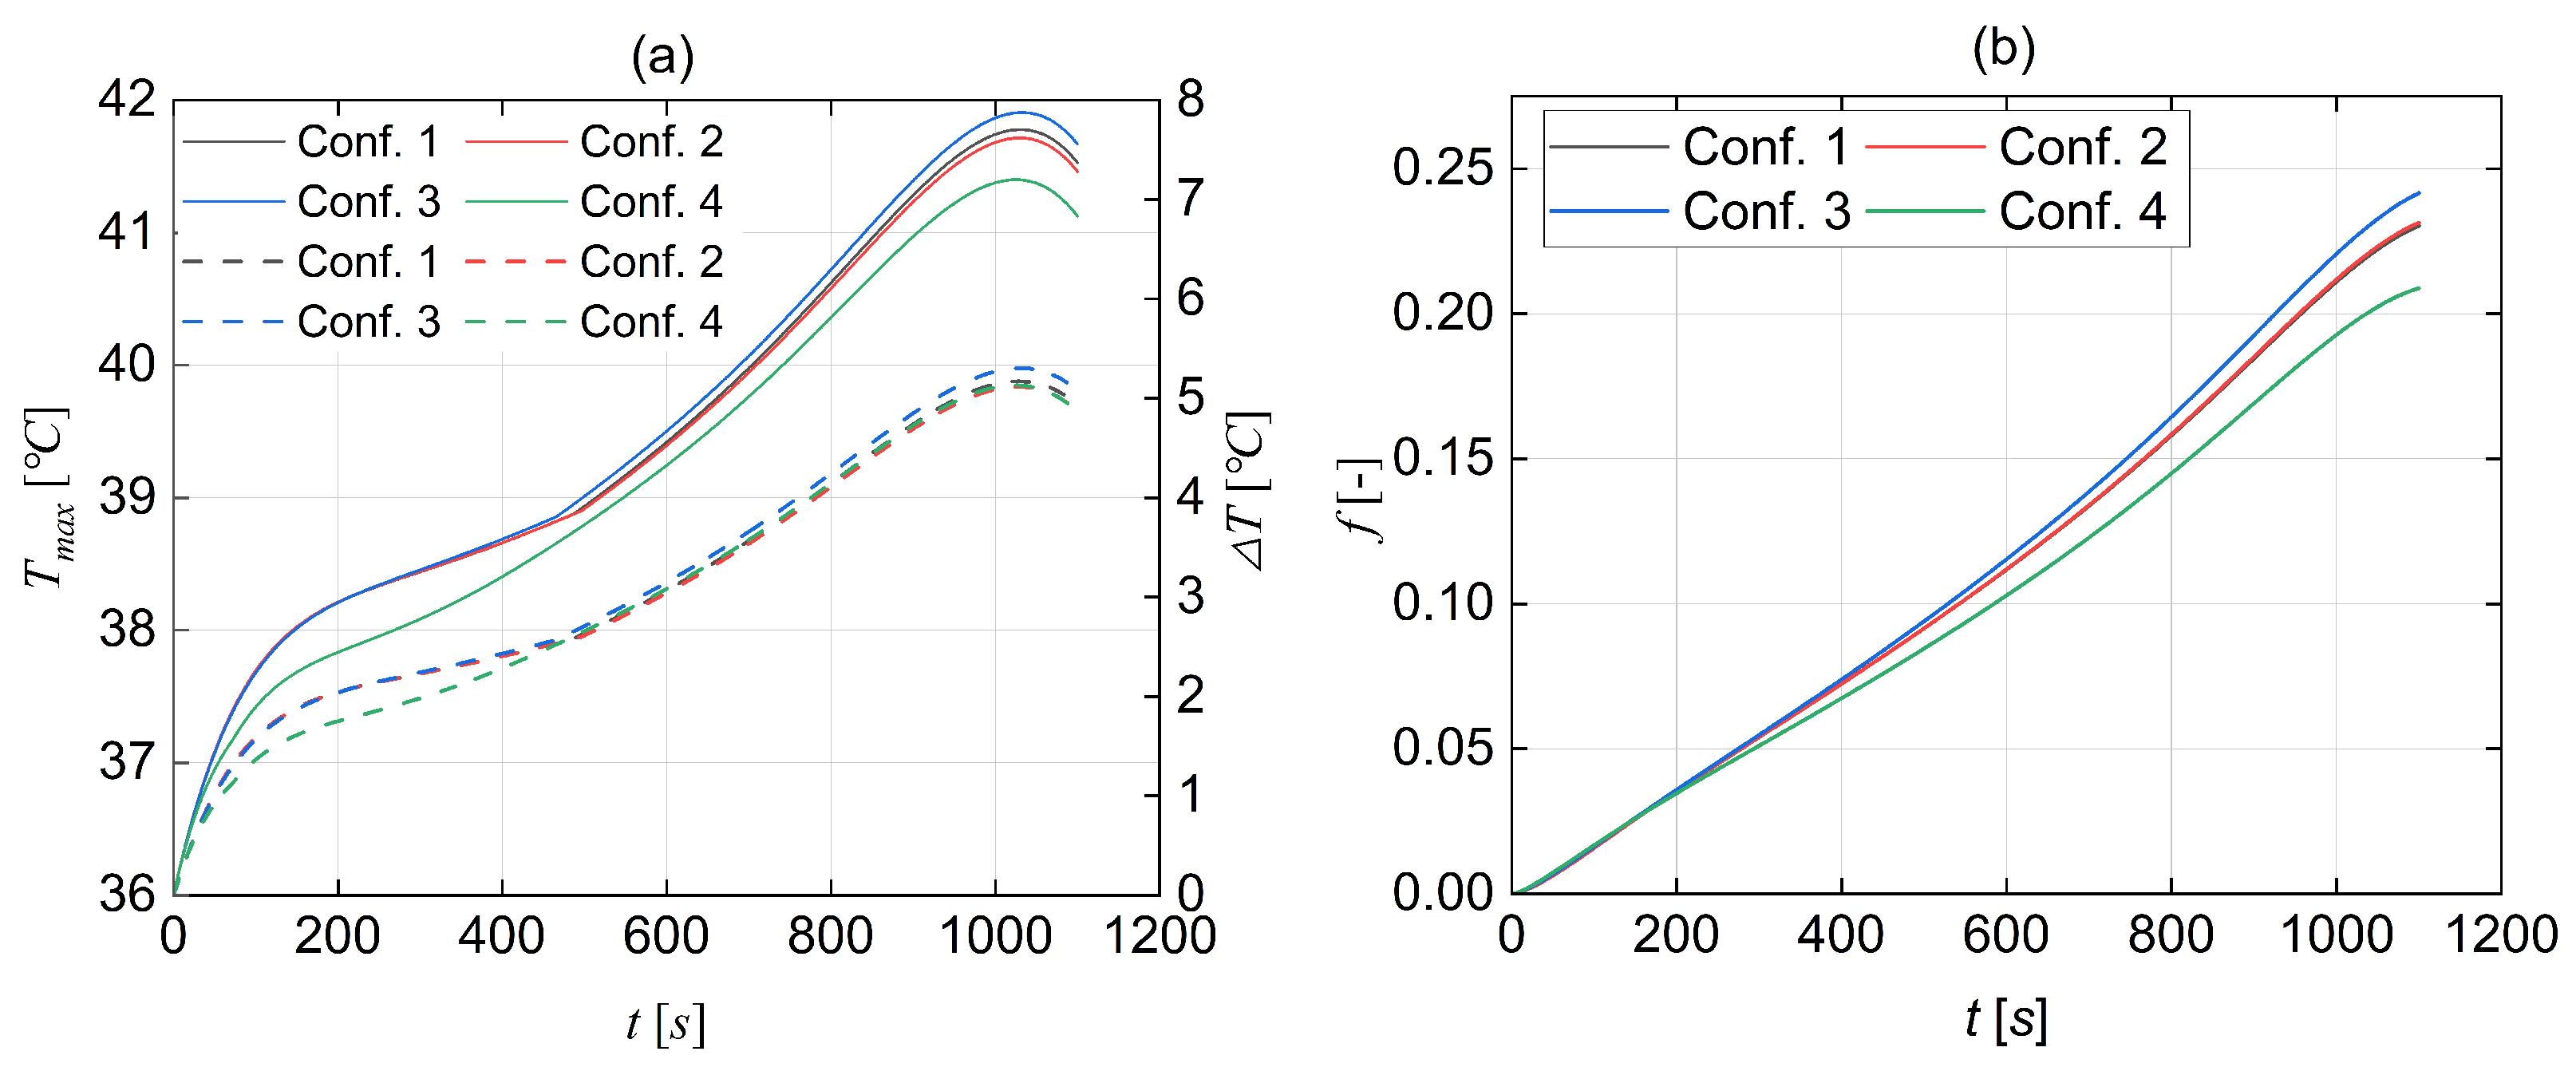
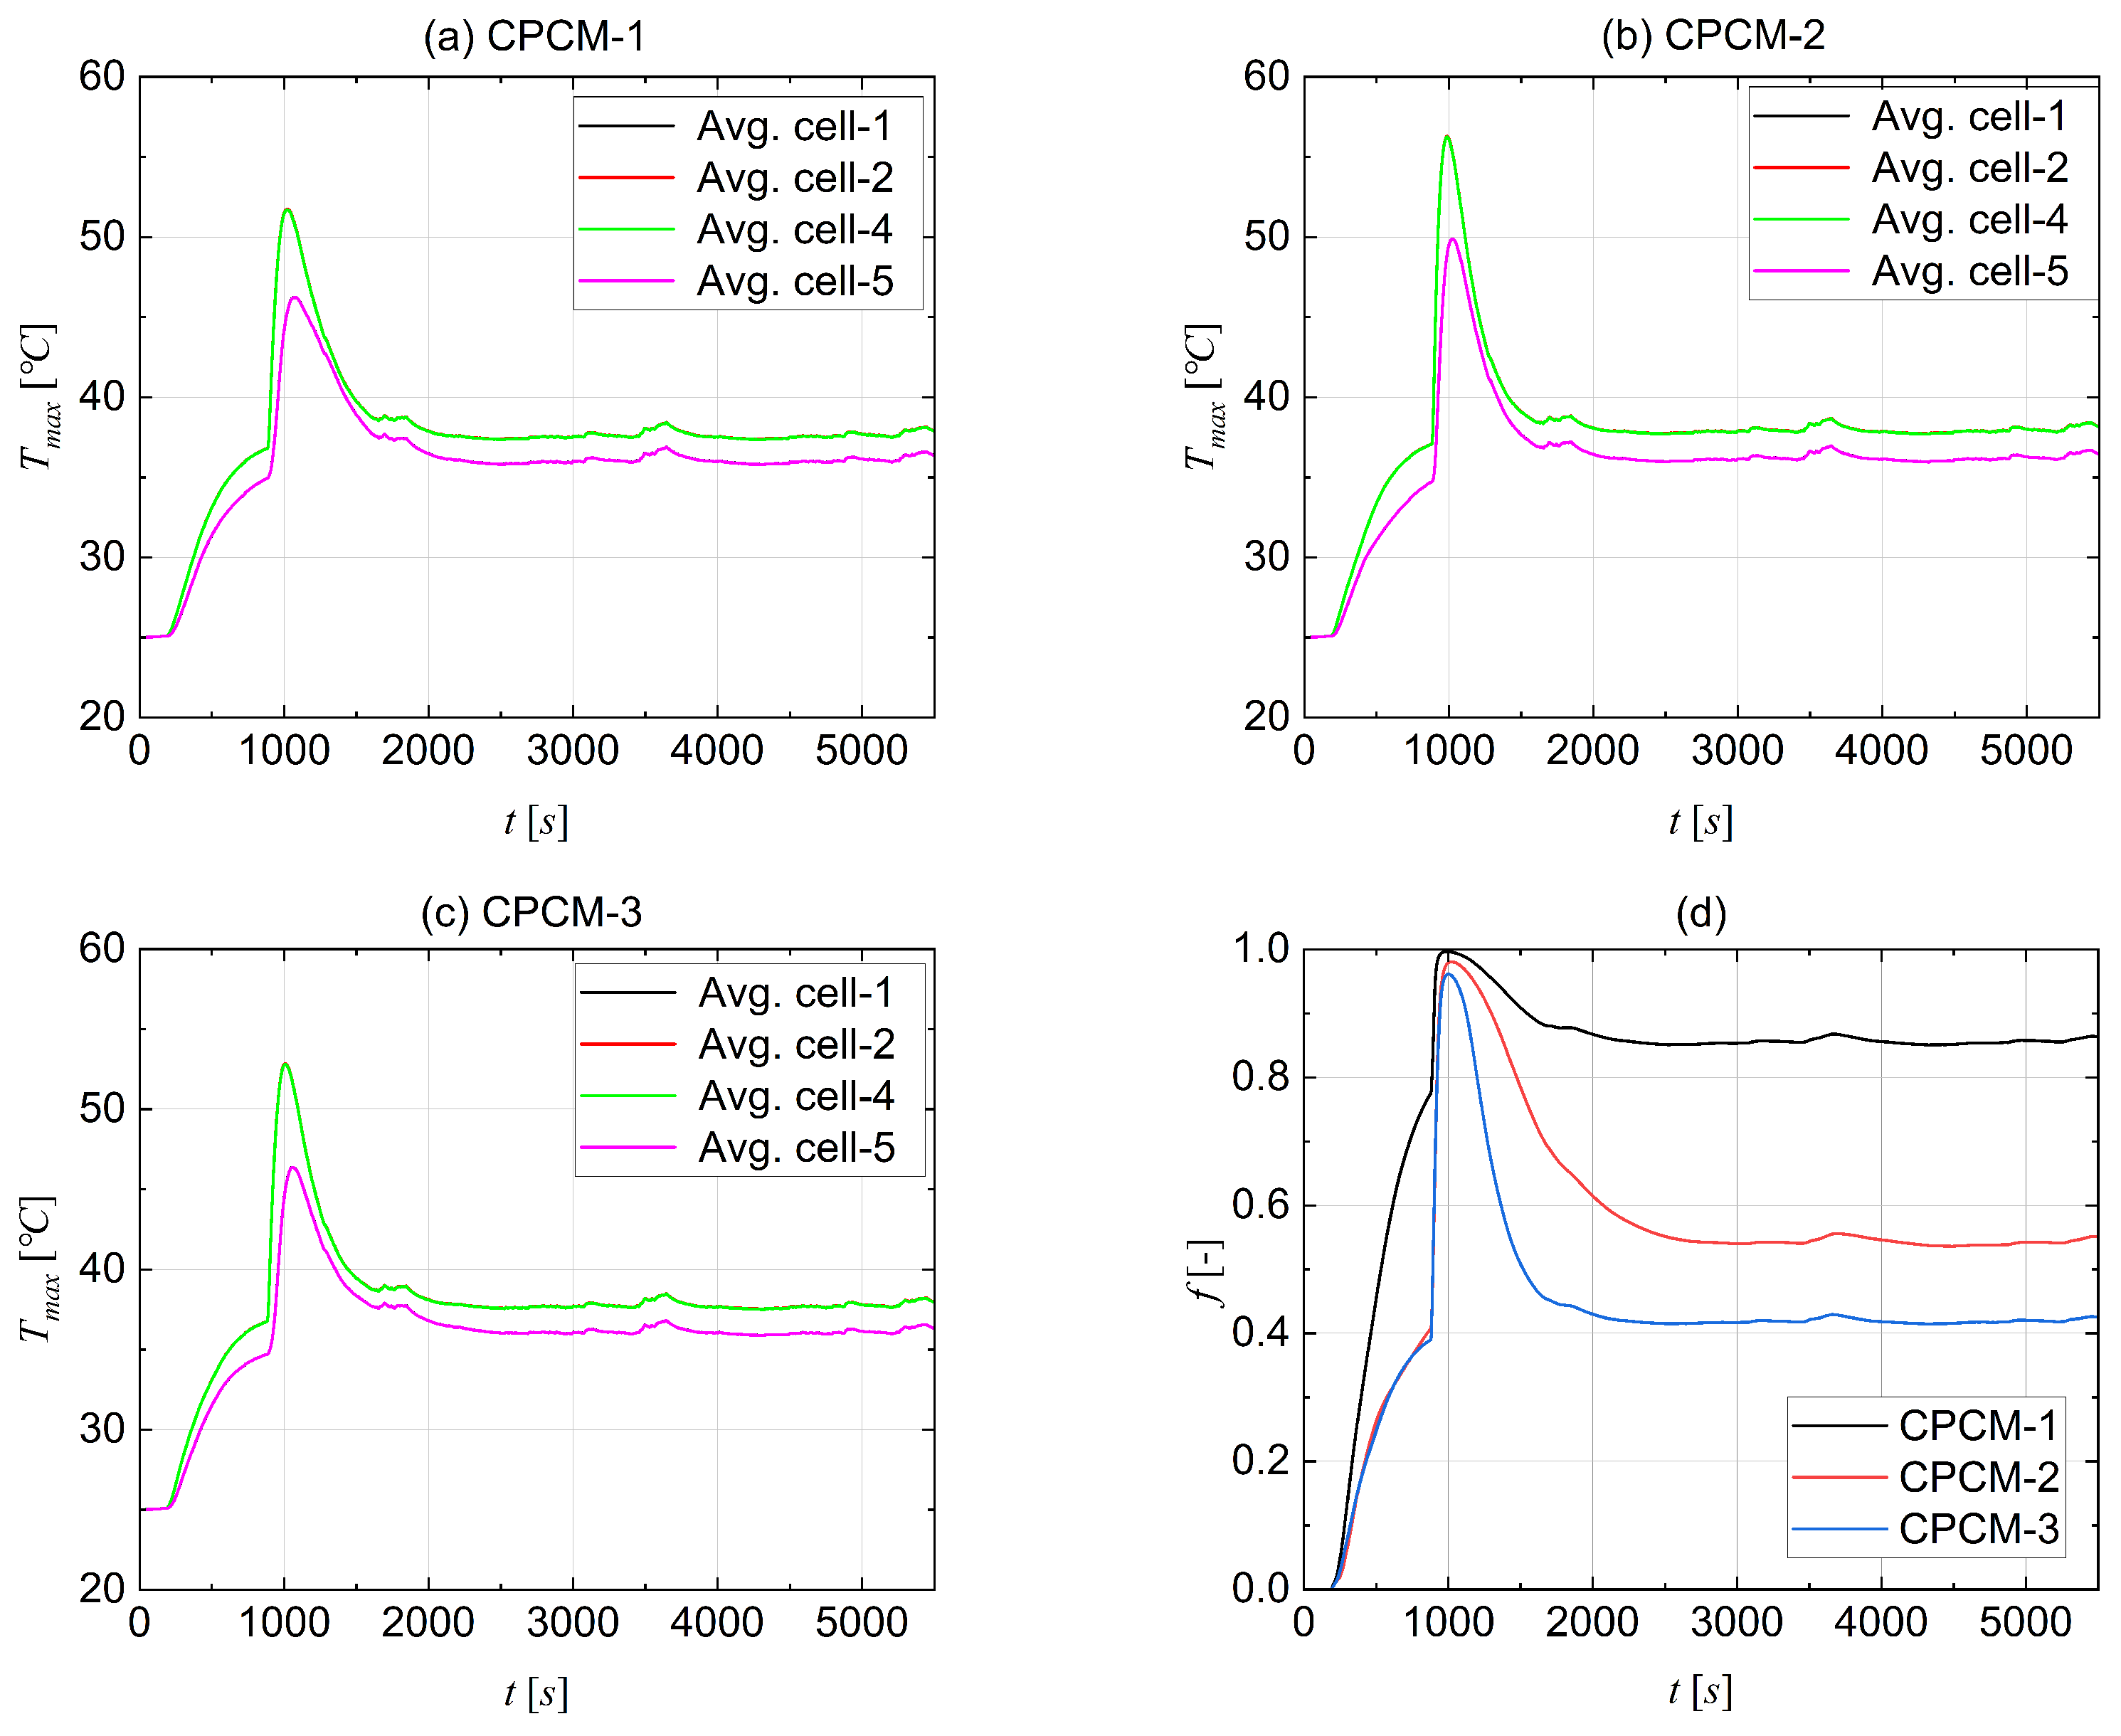
- Comparative simulation was conducted to assess the cooling effectiveness of three types of CPCMs for large-scale LIB pouch cells. Analysis shows that CPCM-3 is the best in terms of cooling performance, and thence, was selected as the passive cooling material for the rest of the study. The research findings indicate that the CPCM-3 enables the battery to operate safely.
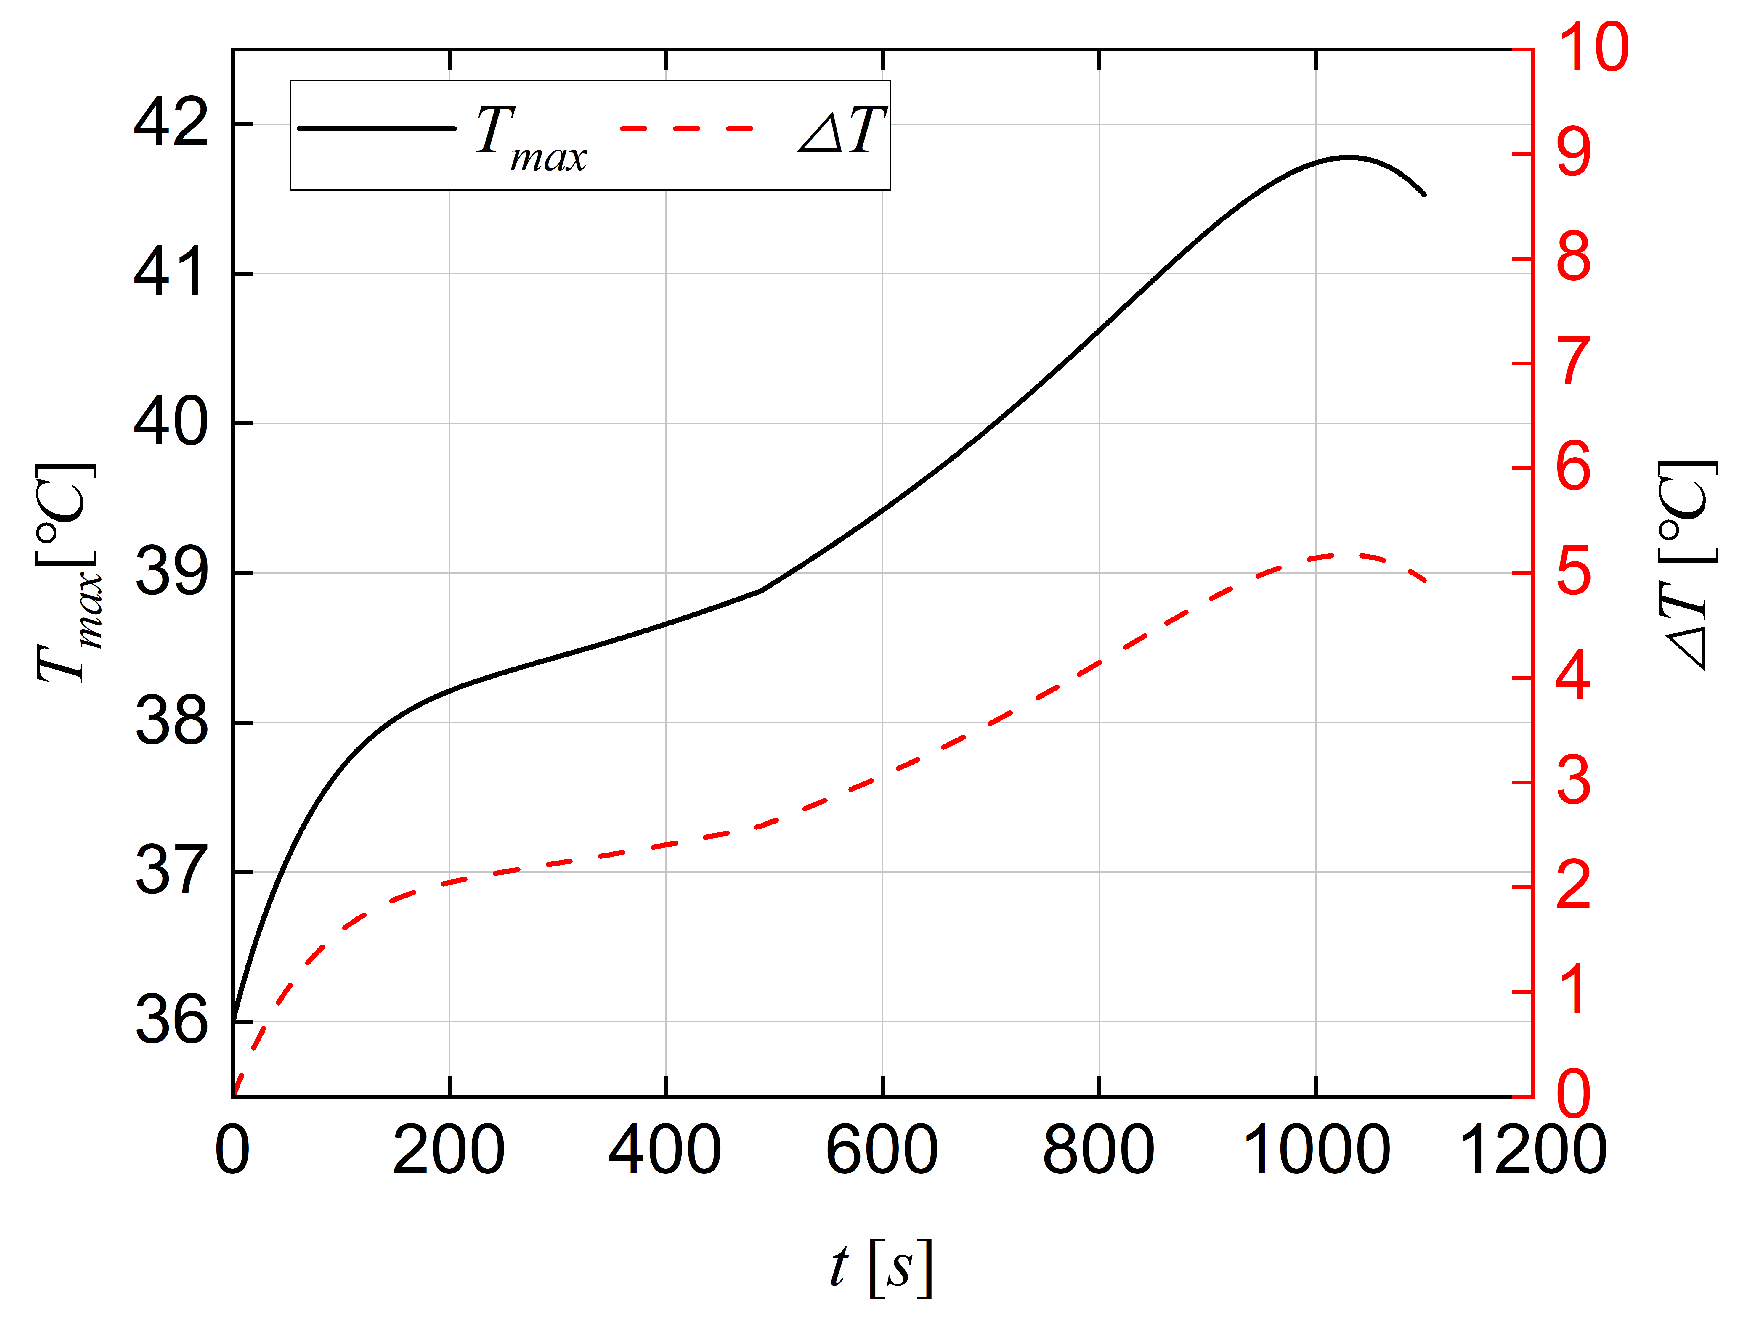
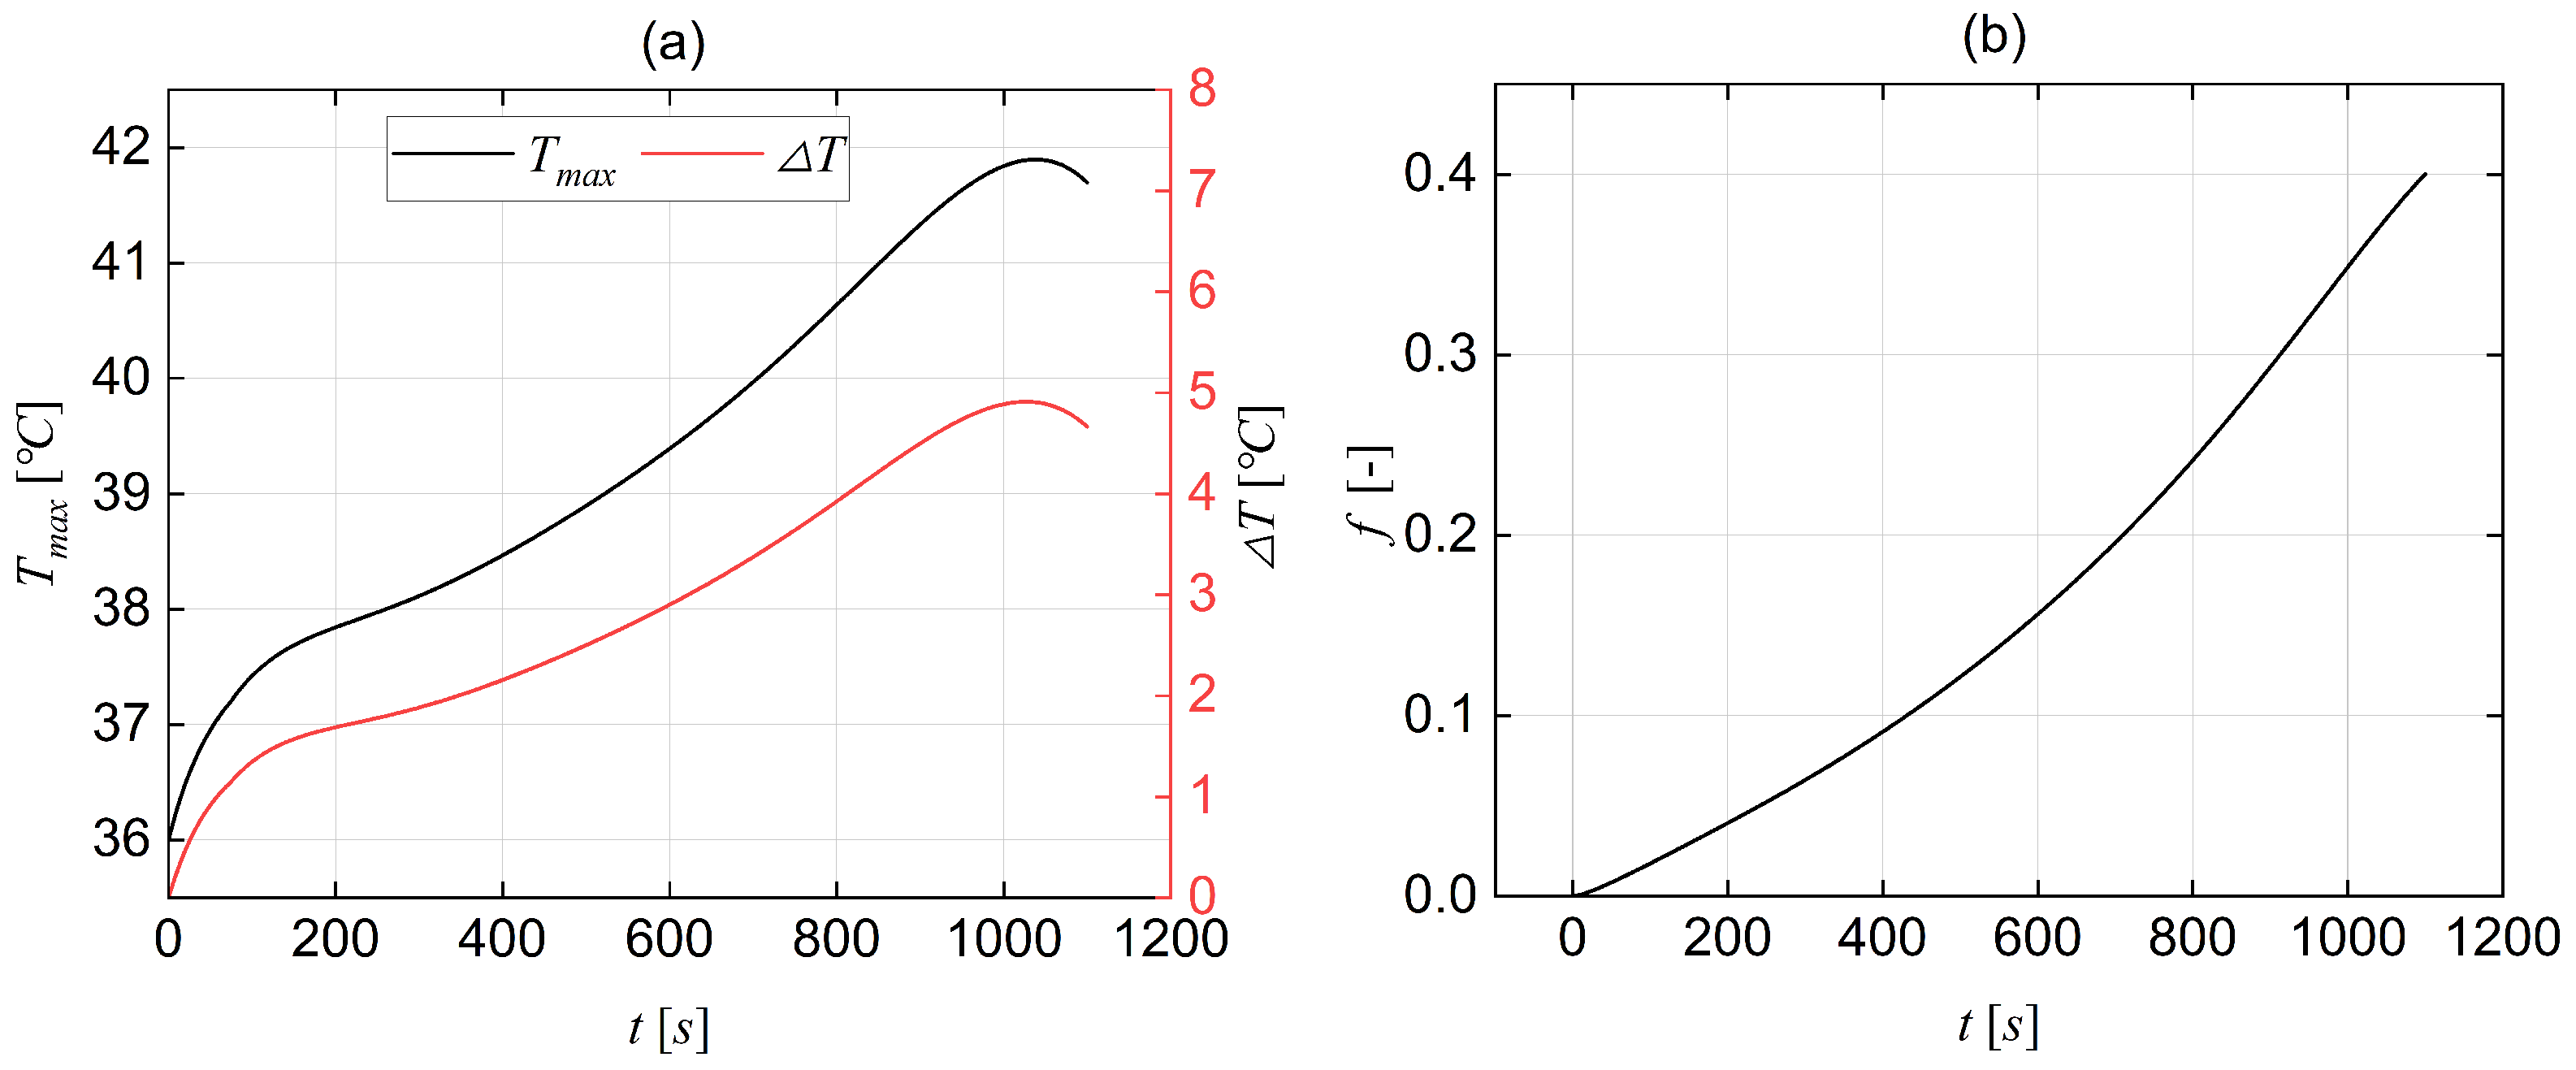
- Four hybrid cooling configurations were established, and the results demonstrate that the configuration (4) can effectively limit the maximum internal temperature of the battery pack to below 41.5 °C and the temperature difference to below 4.89 °C under an environmental temperature of 36 °C at a discharge rate of 3 C.
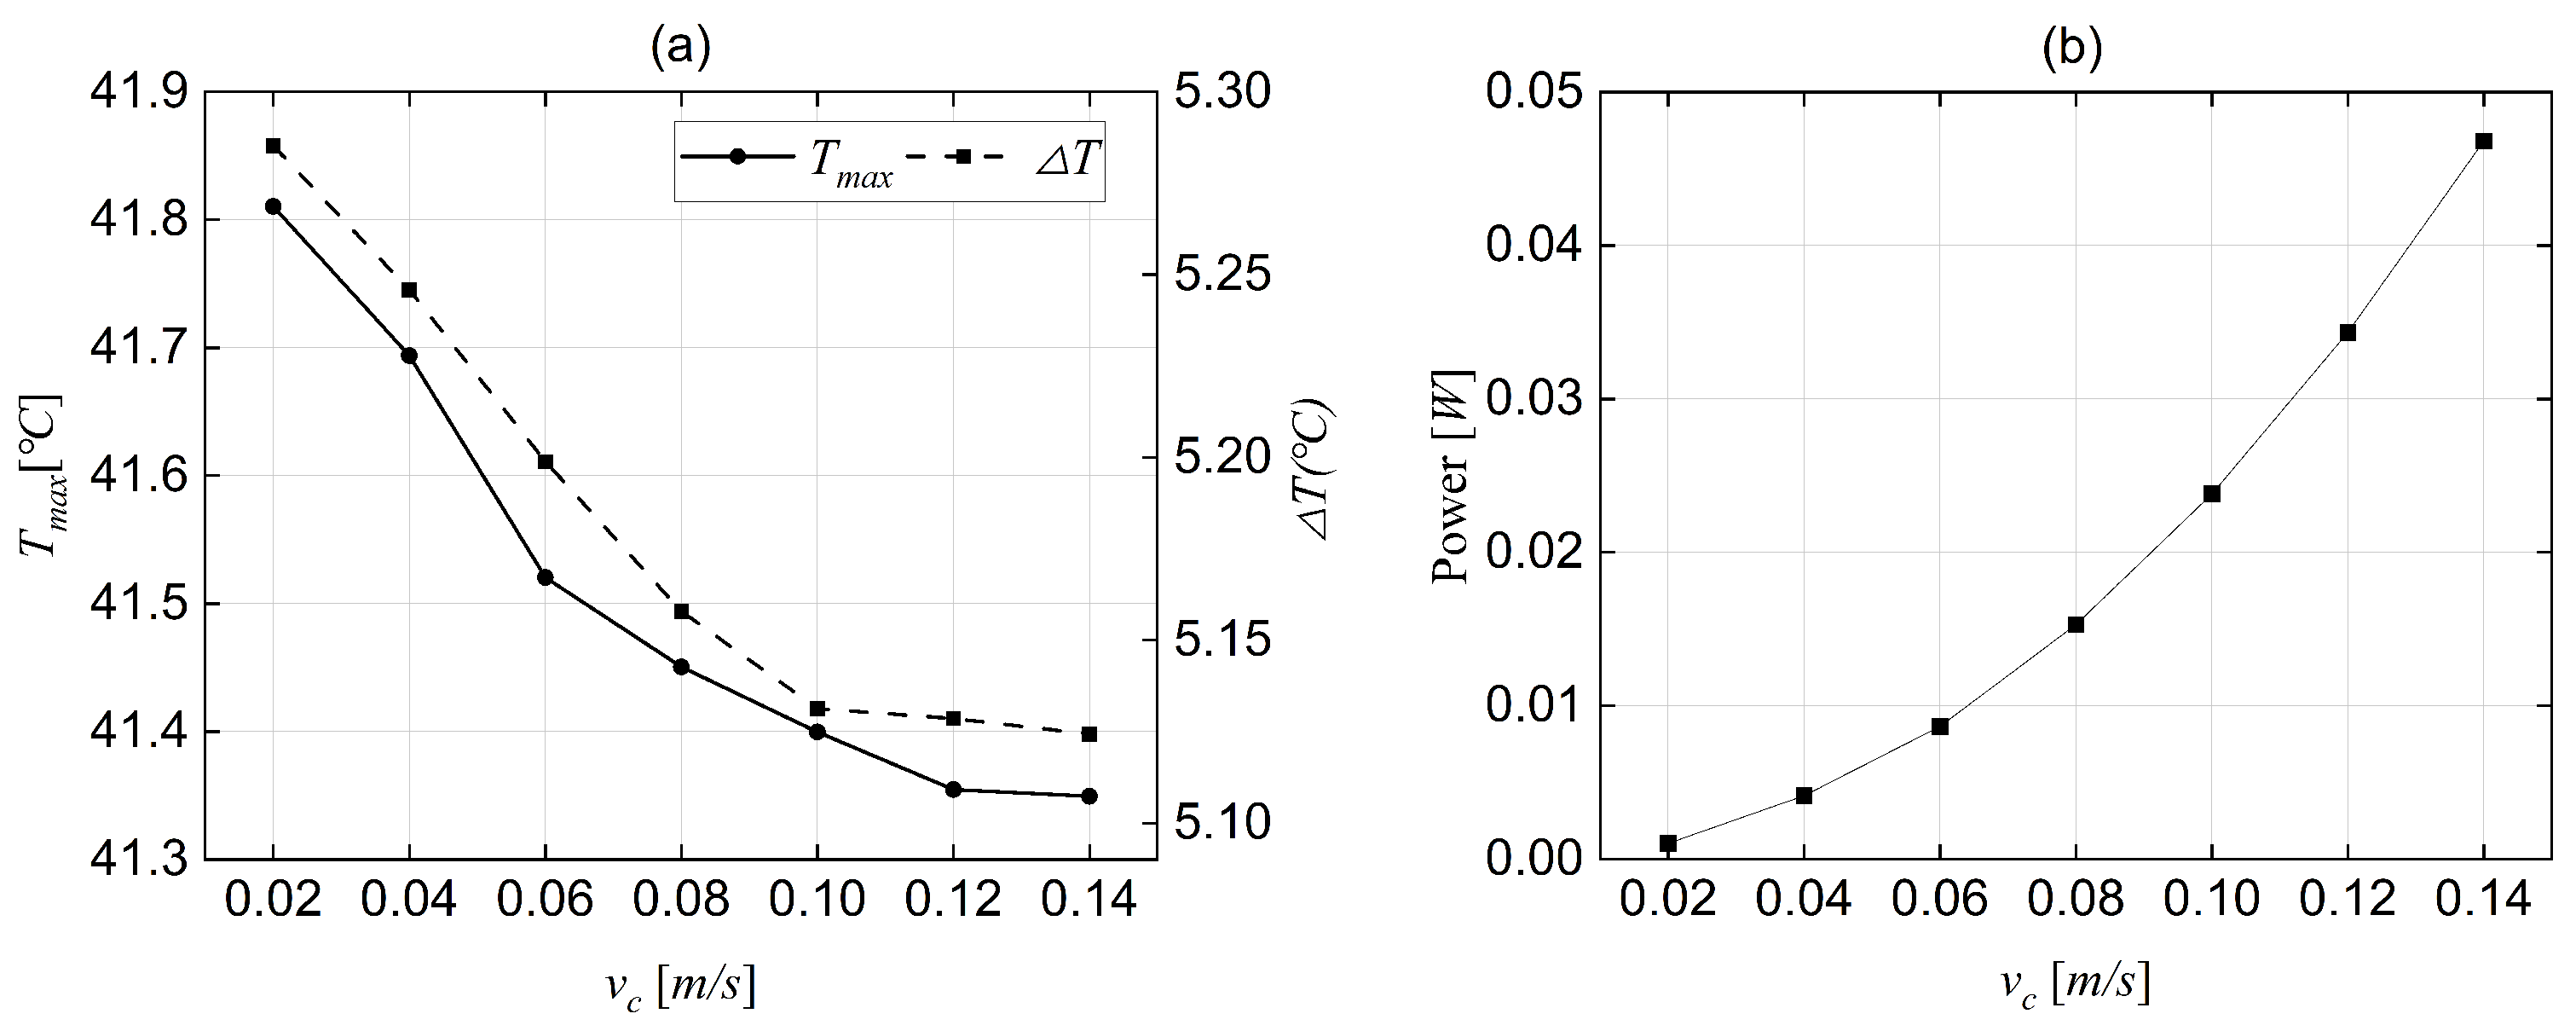
- Through numerical simulations of the coolant flow rate’s impact on cooling performance and energy consumption, a flow rate of 0.1 m/s was selected as the optimal liquid flow rate for the current BTMS. Implementing this flow rate helps minimise the energy losses of the BTMS in EVs. Compared to various flow rate control strategies, adopting a single flow rate to control active cooling simplifies the operation. It reduces the likelihood of active cooling failure to a greater extent.
- Simulation results on BTMS cooling performance and liquid fraction when active cooling fails, specifically at a coolant flow rate of 0 m/s, indicate that the system with CPCM-3 can still operate safely.
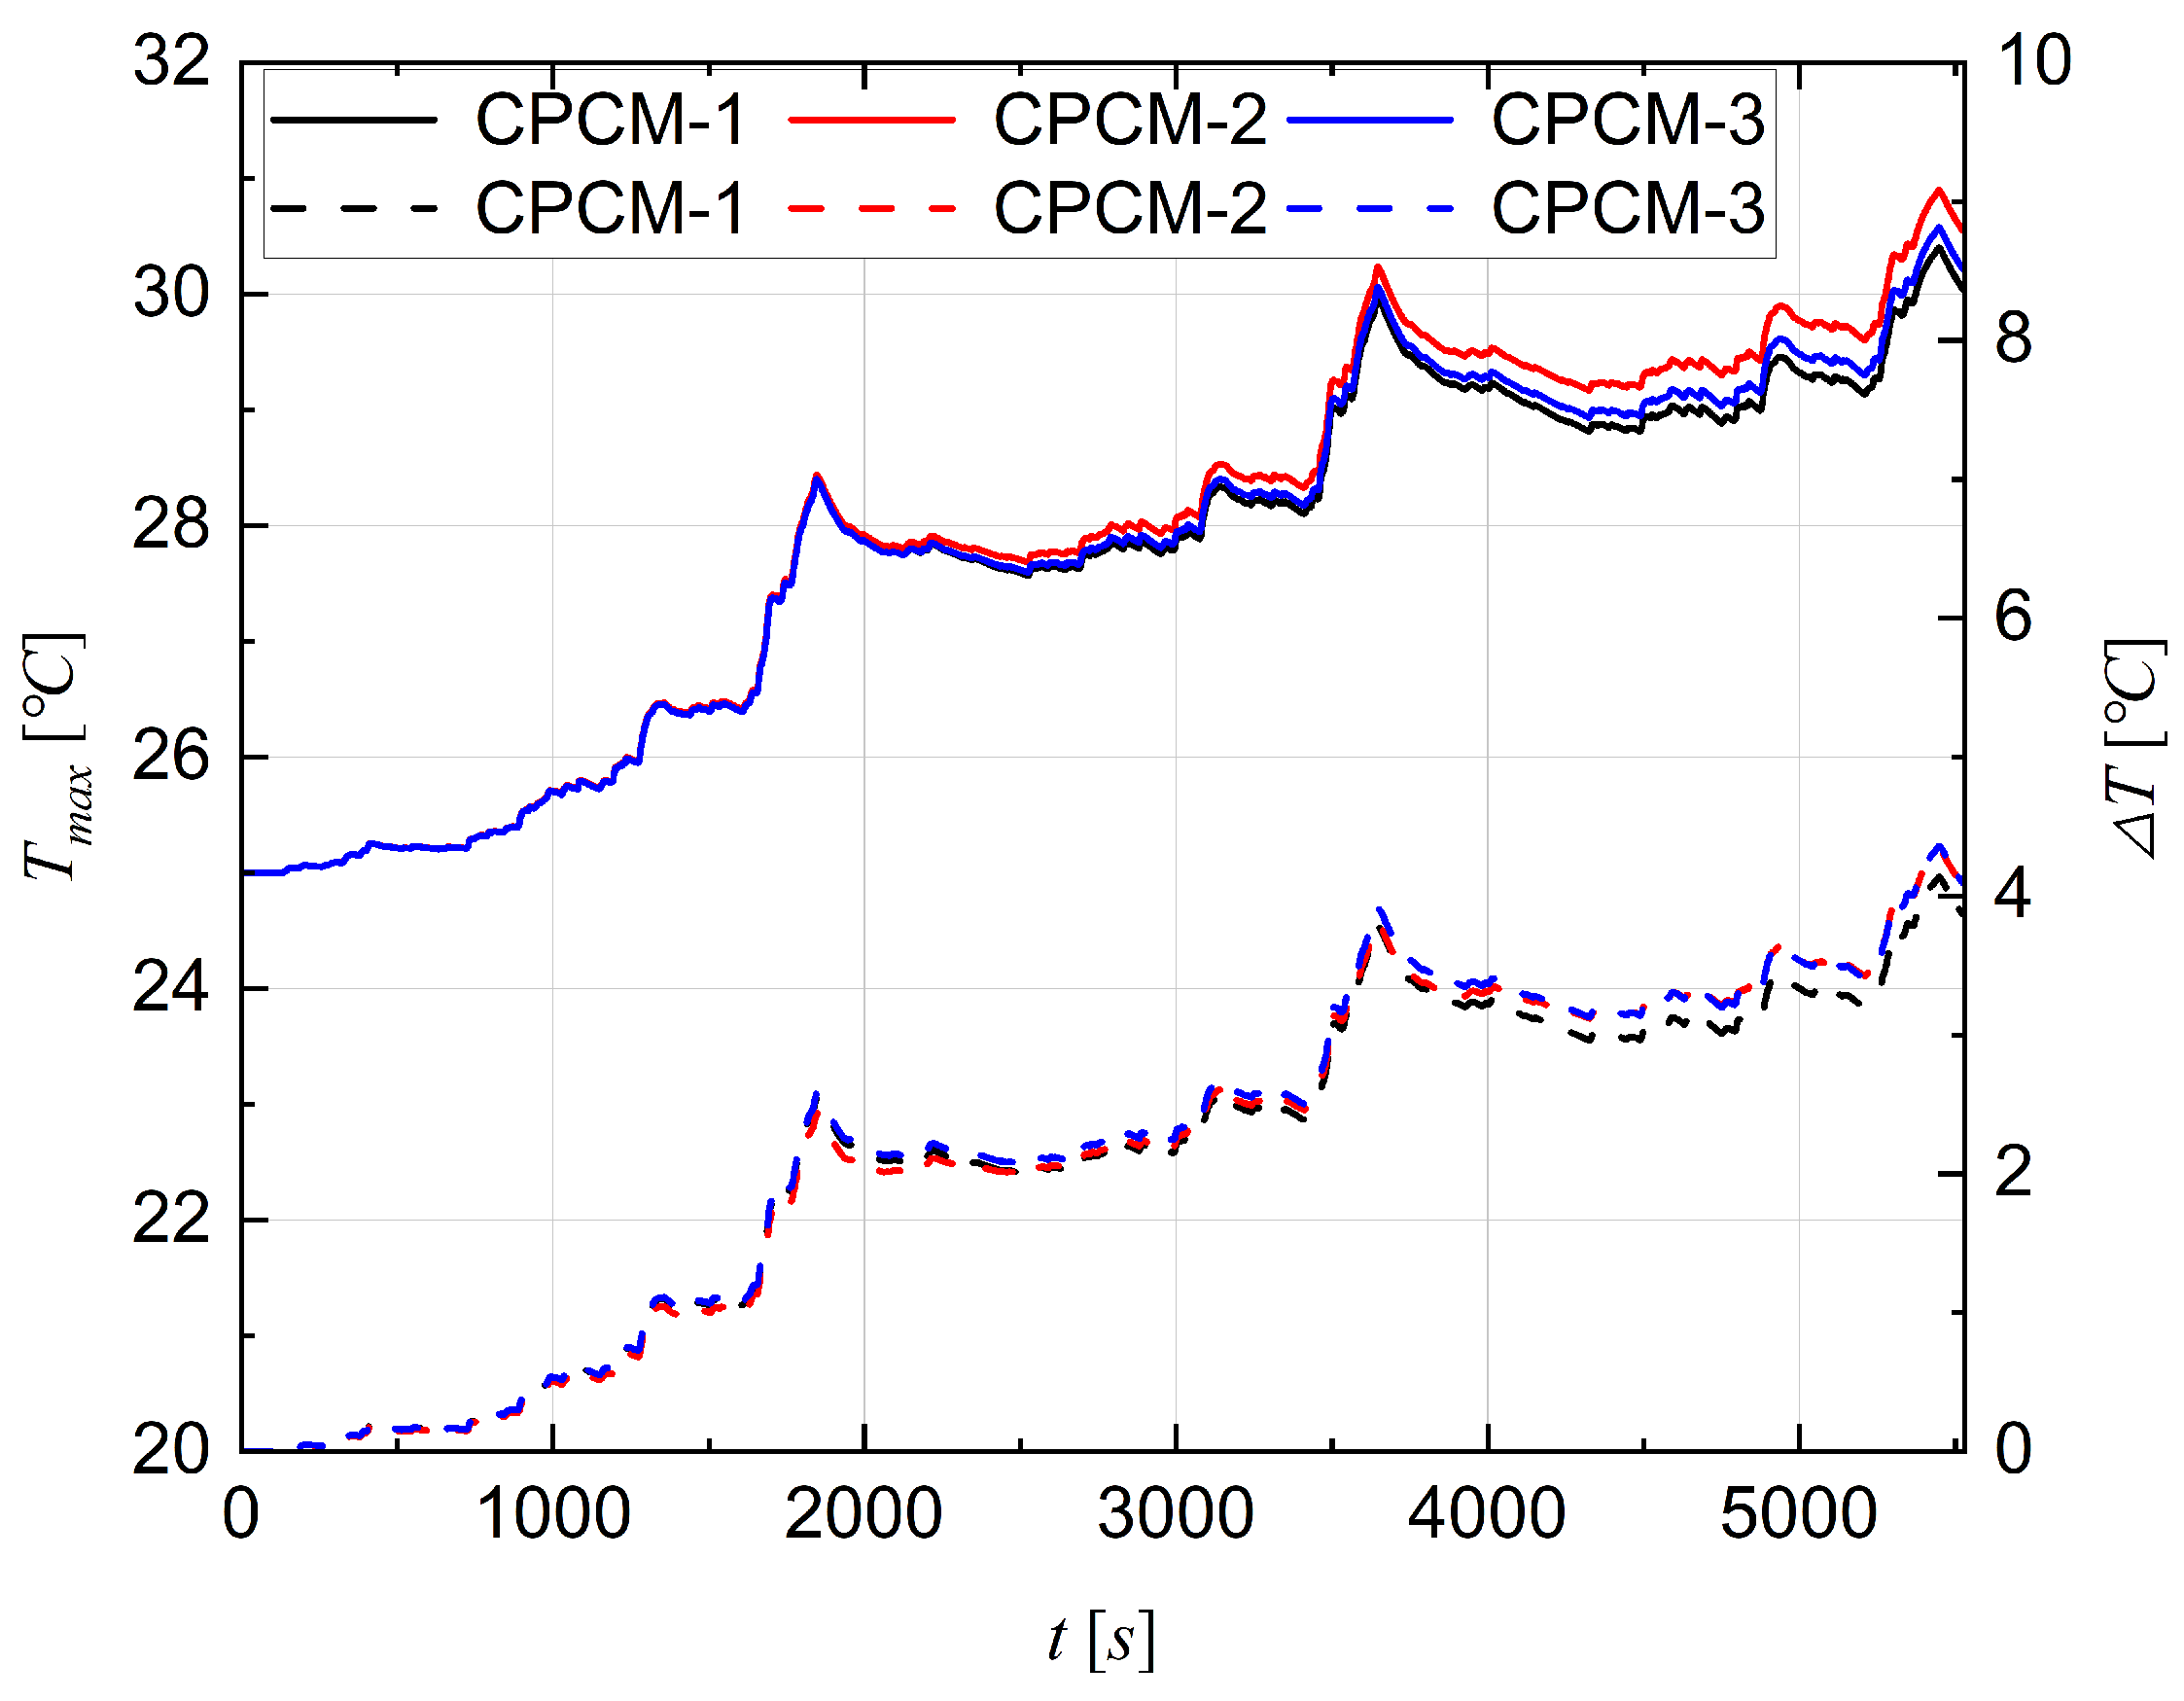
- Using configuration (4), the battery pack can work safely under the WLTP class 3 drive cycle.
- In the case of thermal runaway for the middle cell, the proposed BTMS keeps the range of operational temperature below 60 °C, with CPCM-3 performing the best amongst three CPCMs.
Author Contributions
Funding
Data Availability Statement
Conflicts of Interest
References
- Fotso-Nguemo, T.C.; Vondou, D.A.; Diallo, I.; Diedhiou, A.; Weber, T.; Tanessong, R.S.; Nghonda, J.P.; Yepdo, Z.D. Potential impact of 1.5, 2 and 3 C global warming levels on heat and discomfort indices changes over Central Africa. Sci. Total Environ. 2022, 804, 150099. [Google Scholar] [CrossRef] [PubMed]
- Bibra, E.M.; Connelly, E.; Dhir, S.; Drtil, M.; Henriot, P.; Hwang, I.; Le Marois, J.B.; McBain, S.; Paoli, L.; Teter, J. Global EV Outlook 2022: Securing Supplies for an Electric Future. 2022. Available online: https://trid.trb.org/View/2005689 (accessed on 1 December 2023).
- Wassiliadis, N.; Schneider, J.; Frank, A.; Wildfeuer, L.; Lin, X.; Jossen, A.; Lienkamp, M. Review of fast charging strategies for lithium-ion battery systems and their applicability for battery electric vehicles. J. Energy Storage 2021, 44, 103306. [Google Scholar] [CrossRef]
- Tran, M.K.; Akinsanya, M.; Panchal, S.; Fraser, R.; Fowler, M. Design of a hybrid electric vehicle powertrain for performance optimization considering various powertrain components and configurations. Vehicles 2020, 3, 20–32. [Google Scholar] [CrossRef]
- Piao, N.; Gao, X.; Yang, H.; Guo, Z.; Hu, G.; Cheng, H.M.; Li, F. Challenges and development of lithium-ion batteries for low temperature environments. eTransportation 2022, 11, 100145. [Google Scholar] [CrossRef]
- Zhang, S.; Zhang, X. A multi time-scale framework for state-of-charge and capacity estimation of lithium-ion battery under optimal operating temperature range. J. Energy Storage 2021, 35, 102325. [Google Scholar] [CrossRef]
- Osmani, K.; Alkhedher, M.; Ramadan, M.; Choi, D.S.; Li, L.K.; Doranehgard, M.H.; Olabi, A.G. Recent progress in the thermal management of lithium-ion batteries. J. Clean. Prod. 2023, 389, 136024. [Google Scholar] [CrossRef]
- Park, S.H.; Park, J.; Ryou, M.H.; Lee, Y.M. Sensitivity of power of lithium-ion batteries to temperature: A case study using cylindrical-and pouch-type cells. J. Power Sources 2020, 465, 228238. [Google Scholar] [CrossRef]
- Han, X.; Lu, L.; Zheng, Y.; Feng, X.; Li, Z.; Li, J.; Ouyang, M. A review on the key issues of the lithium ion battery degradation among the whole life cycle. eTransportation 2019, 1, 100005. [Google Scholar] [CrossRef]
- Thakur, A.K.; Sathyamurthy, R.; Velraj, R.; Saidur, R.; Pandey, A.; Ma, Z.; Singh, P.; Hazra, S.K.; Sharshir, S.W.; Prabakaran, R.; et al. A state-of-the art review on advancing battery thermal management systems for fast-charging. Appl. Therm. Eng. 2023, 226, 120303. [Google Scholar] [CrossRef]
- Xie, W.; Liu, X.; He, R.; Li, Y.; Gao, X.; Li, X.; Peng, Z.; Feng, S.; Feng, X.; Yang, S. Challenges and opportunities toward fast-charging of lithium-ion batteries. J. Energy Storage 2020, 32, 101837. [Google Scholar] [CrossRef]
- Logan, E.; Dahn, J. Electrolyte design for fast-charging Li-ion batteries. Trends Chem. 2020, 2, 354–366. [Google Scholar] [CrossRef]
- Liu, Y.; Zhu, Y.; Cui, Y. Challenges and opportunities towards fast-charging battery materials. Nat. Energy 2019, 4, 540–550. [Google Scholar] [CrossRef]
- Zhang, Z.; Fu, L.; Sheng, L.; Ye, W.; Sun, Y. Method of liquid-cooled thermal control for a large-scale pouch lithium-ion battery. Appl. Therm. Eng. 2022, 211, 118417. [Google Scholar] [CrossRef]
- Sait, H. Cooling a plate lithium-ion battery using a thermoelectric system and evaluating the geometrical impact on the performance of heatsink connected to the system. J. Energy Storage 2022, 52, 104692. [Google Scholar] [CrossRef]
- Pan, S.; Ji, C.; Wang, S.; Wang, B. Study on the performance of parallel air-cooled structure and optimized design for lithium-ion battery module. Fire Technol. 2020, 56, 2623–2647. [Google Scholar] [CrossRef]
- Lu, M.; Zhang, X.; Ji, J.; Xu, X.; Zhang, Y. Research progress on power battery cooling technology for electric vehicles. J. Energy Storage 2020, 27, 101155. [Google Scholar] [CrossRef]
- Kleiner, J.; Singh, R.; Schmid, M.; Komsiyska, L.; Elger, G.; Endisch, C. Influence of heat pipe assisted terminal cooling on the thermal behavior of a large prismatic lithium-ion cell during fast charging in electric vehicles. Appl. Therm. Eng. 2021, 188, 116328. [Google Scholar] [CrossRef]
- Huang, R.; Li, Z.; Hong, W.; Wu, Q.; Yu, X. Experimental and numerical study of PCM thermophysical parameters on lithium-ion battery thermal management. Energy Rep. 2020, 6, 8–19. [Google Scholar] [CrossRef]
- Landini, S.; Leworthy, J.; O’Donovan, T. A review of phase change materials for the thermal management and isothermalisation of lithium-ion cells. J. Energy Storage 2019, 25, 100887. [Google Scholar] [CrossRef]
- Wang, X.; Xie, Y.; Day, R.; Wu, H.; Hu, Z.; Zhu, J.; Wen, D. Performance analysis of a novel thermal management system with composite phase change material for a lithium-ion battery pack. Energy 2018, 156, 154–168. [Google Scholar] [CrossRef]
- Zhi, M.; Fan, R.; Yang, X.; Zheng, L.; Yue, S.; Liu, Q.; He, Y. Recent research progress on phase change materials for thermal management of lithium-ion batteries. J. Energy Storage 2022, 45, 103694. [Google Scholar] [CrossRef]
- Zhang, F.; Zhai, L.; Zhang, L.; Yi, M.; Du, B.; Li, S. A novel hybrid battery thermal management system with fins added on and between liquid cooling channels in composite phase change materials. Appl. Therm. Eng. 2022, 207, 118198. [Google Scholar] [CrossRef]
- Zhao, Y.; Zou, B.; Ding, J.; Ding, Y. Experimental and numerical investigation of a hybrid battery thermal management system based on copper foam-paraffin composite phase change material and liquid cooling. Appl. Therm. Eng. 2023, 218, 119312. [Google Scholar] [CrossRef]
- Zhang, W.; Liang, Z.; Yin, X.; Ling, G. Avoiding thermal runaway propagation of lithium-ion battery modules by using hybrid phase change material and liquid cooling. Appl. Therm. Eng. 2021, 184, 116380. [Google Scholar] [CrossRef]
- Fan, Y.; Wang, Z.; Xiong, X.; Zhu, J.; Gao, Q.; Wang, H.; Wu, H. Novel concept design of low energy hybrid battery thermal management system using PCM and multistage Tesla valve liquid cooling. Appl. Therm. Eng. 2023, 220, 119680. [Google Scholar] [CrossRef]
- Kong, D.; Peng, R.; Ping, P.; Du, J.; Chen, G.; Wen, J. A novel battery thermal management system coupling with PCM and optimized controllable liquid cooling for different ambient temperatures. Energy Convers. Manag. 2020, 204, 112280. [Google Scholar] [CrossRef]
- Hosseinzadeh, E.; Genieser, R.; Worwood, D.; Barai, A.; Marco, J.; Jennings, P. A systematic approach for electrochemical-thermal modelling of a large format lithium-ion battery for electric vehicle application. J. Power Sources 2018, 382, 77–94. [Google Scholar] [CrossRef]
- Chen, S.; Wan, C.; Wang, Y. Thermal analysis of lithium-ion batteries. J. Power Sources 2005, 140, 111–124. [Google Scholar] [CrossRef]
- Jabbari, M.; Wang, R.; Liang, Z.; Esfahani, M.; Hosseinzadeh, E. Numerical modelling of nanocomposite conductive plate for battery thermal management using a novel multi-domain approach. Appl. Therm. Eng. 2021, 182, 116067. [Google Scholar] [CrossRef]
- Dutil, Y.; Rousse, D.R.; Salah, N.B.; Lassue, S.; Zalewski, L. A review on phase-change materials: Mathematical modeling and simulations. Renew. Sustain. Energy Rev. 2011, 15, 112–130. [Google Scholar] [CrossRef]
- Jaguemont, J.; Omar, N.; Van den Bossche, P.; Mierlo, J. Phase-change materials (PCM) for automotive applications: A review. Appl. Therm. Eng. 2018, 132, 308–320. [Google Scholar] [CrossRef]
- Wang, R.; Liang, Z.; Souri, M.; Esfahani, M.; Jabbari, M. Numerical analysis of lithium-ion battery thermal management system using phase change material assisted by liquid cooling method. Int. J. Heat Mass Transf. 2022, 183, 122095. [Google Scholar] [CrossRef]
- Malik, M.; Dincer, I.; Rosen, M.; Fowler, M. Experimental investigation of a new passive thermal management system for a Li-ion battery pack using phase change composite material. Electrochim. Acta 2017, 257, 345–355. [Google Scholar] [CrossRef]
- Luo, X.; Guo, Q.; Li, X.; Tao, Z.; Lei, S.; Liu, J.; Kang, L.; Zheng, D.; Liu, Z. Experimental investigation on a novel phase change material composites coupled with graphite film used for thermal management of lithium-ion batteries. Renew. Energy 2020, 145, 2046–2055. [Google Scholar] [CrossRef]
- Zhang, W.; Ling, G.; Zhuang, L.; Liang, Z. The effect of reducing the thermal contact resistance on the performance of battery thermal management system. Int. J. Energy Res. 2021, 45, 9970–9982. [Google Scholar] [CrossRef]
- Zheng, Y.; Shi, Y.; Huang, Y. Optimisation with adiabatic interlayers for liquid-dominated cooling system on fast charging battery packs. Appl. Therm. Eng. 2019, 147, 636–646. [Google Scholar] [CrossRef]
- Yu, L.; Zhang, J.; Wu, X.; Huang, J.; Hu, L.; Shi, L.; Dong, Y.; Chen, K.; Cao, B. Efficient optimization of parallel micro-channel heat sinks based on flow resistance network model. Appl. Therm. Eng. 2023, 233, 121169. [Google Scholar] [CrossRef]
- Qian, Z.; Li, Y.; Rao, Z. Thermal performance of lithium-ion battery thermal management system by using mini-channel cooling. Energy Convers. Manag. 2016, 126, 622–631. [Google Scholar] [CrossRef]
- Yan, H.; Marr, K.C.; Ezekoye, O.A. Thermal runaway behavior of nickel–manganese–cobalt 18650 lithium-ion cells induced by internal and external heating failures. J. Energy Storage 2022, 45, 103640. [Google Scholar] [CrossRef]


| Domain | [kg/m3] | [J/kg·K] | k [W/m·K] | [Ω] |
|---|---|---|---|---|
| Cell | 2551.7 | 1100 | , | − |
| Tab(+) | 7987 | 381 | 387.6 | |
| Tab(−) | 7987 | 381 | 387.6 |
| Materials | [kg/m3] | [J/kg·K] | k [W/m·K] | H [J/kg] | [°C] | [°C] |
|---|---|---|---|---|---|---|
| CPCM-1 | 895 | 1910 | 12 | 160,000 | 32 | 38 |
| CPCM-2 | 1130 | 1600 | 4.27 | 127,000 | 33.9 | 47.6 |
| CPCM-3 | 880 | 2100 | 7.62 | 210,000 | 36 | 40 |
| Materials | [kg/m3] | [J/kg·K] | k [W/m·K] | [Pa·s] |
|---|---|---|---|---|
| Air | 1.225 | 1006 | 0.0242 | |
| Coolant | 1063.66 | 3358 | 0.394 | |
| Aluminium | 2719 | 871 | 202.4 | - |
| t [s] | [°C] | [°C] | Error [%] |
|---|---|---|---|
| 30 | 26.9 | 25.94 | 3.56 |
| 400 | 36.1 | 33.13 | 8.22 |
| 800 | 42.6 | 42.18 | 0.98 |
| 1100 | 49.1 | 51 | −3.87 |
Disclaimer/Publisher’s Note: The statements, opinions and data contained in all publications are solely those of the individual author(s) and contributor(s) and not of MDPI and/or the editor(s). MDPI and/or the editor(s) disclaim responsibility for any injury to people or property resulting from any ideas, methods, instructions or products referred to in the content. |
© 2024 by the authors. Licensee MDPI, Basel, Switzerland. This article is an open access article distributed under the terms and conditions of the Creative Commons Attribution (CC BY) license (https://creativecommons.org/licenses/by/4.0/).
Share and Cite
Xu, C.; Ma, C.; Souri, M.; Moztarzadeh, H.; Nasr Esfahani, M.; Jabbari, M.; Hosseinzadeh, E. Numerical Investigation of Thermal Management of a Large Format Pouch Battery Using Combination of CPCM and Liquid Cooling. Batteries 2024, 10, 113. https://doi.org/10.3390/batteries10040113
Xu C, Ma C, Souri M, Moztarzadeh H, Nasr Esfahani M, Jabbari M, Hosseinzadeh E. Numerical Investigation of Thermal Management of a Large Format Pouch Battery Using Combination of CPCM and Liquid Cooling. Batteries. 2024; 10(4):113. https://doi.org/10.3390/batteries10040113
Chicago/Turabian StyleXu, Caiqi, Chao Ma, Mohammad Souri, Hadi Moztarzadeh, Mohammad Nasr Esfahani, Masoud Jabbari, and Elham Hosseinzadeh. 2024. "Numerical Investigation of Thermal Management of a Large Format Pouch Battery Using Combination of CPCM and Liquid Cooling" Batteries 10, no. 4: 113. https://doi.org/10.3390/batteries10040113