Local Study of Lithiation and Degradation Paths in LiMn2O4 Battery Cathodes: Confocal Raman Microscopy Approach


 and
and 
Abstract
:1. Introduction
2. Materials and Methods
2.1. Sample Preparation
2.2. Confocal Raman Microscopy
3. Results and Discussion
3.1. Integral Raman Spectroscopy Measurements
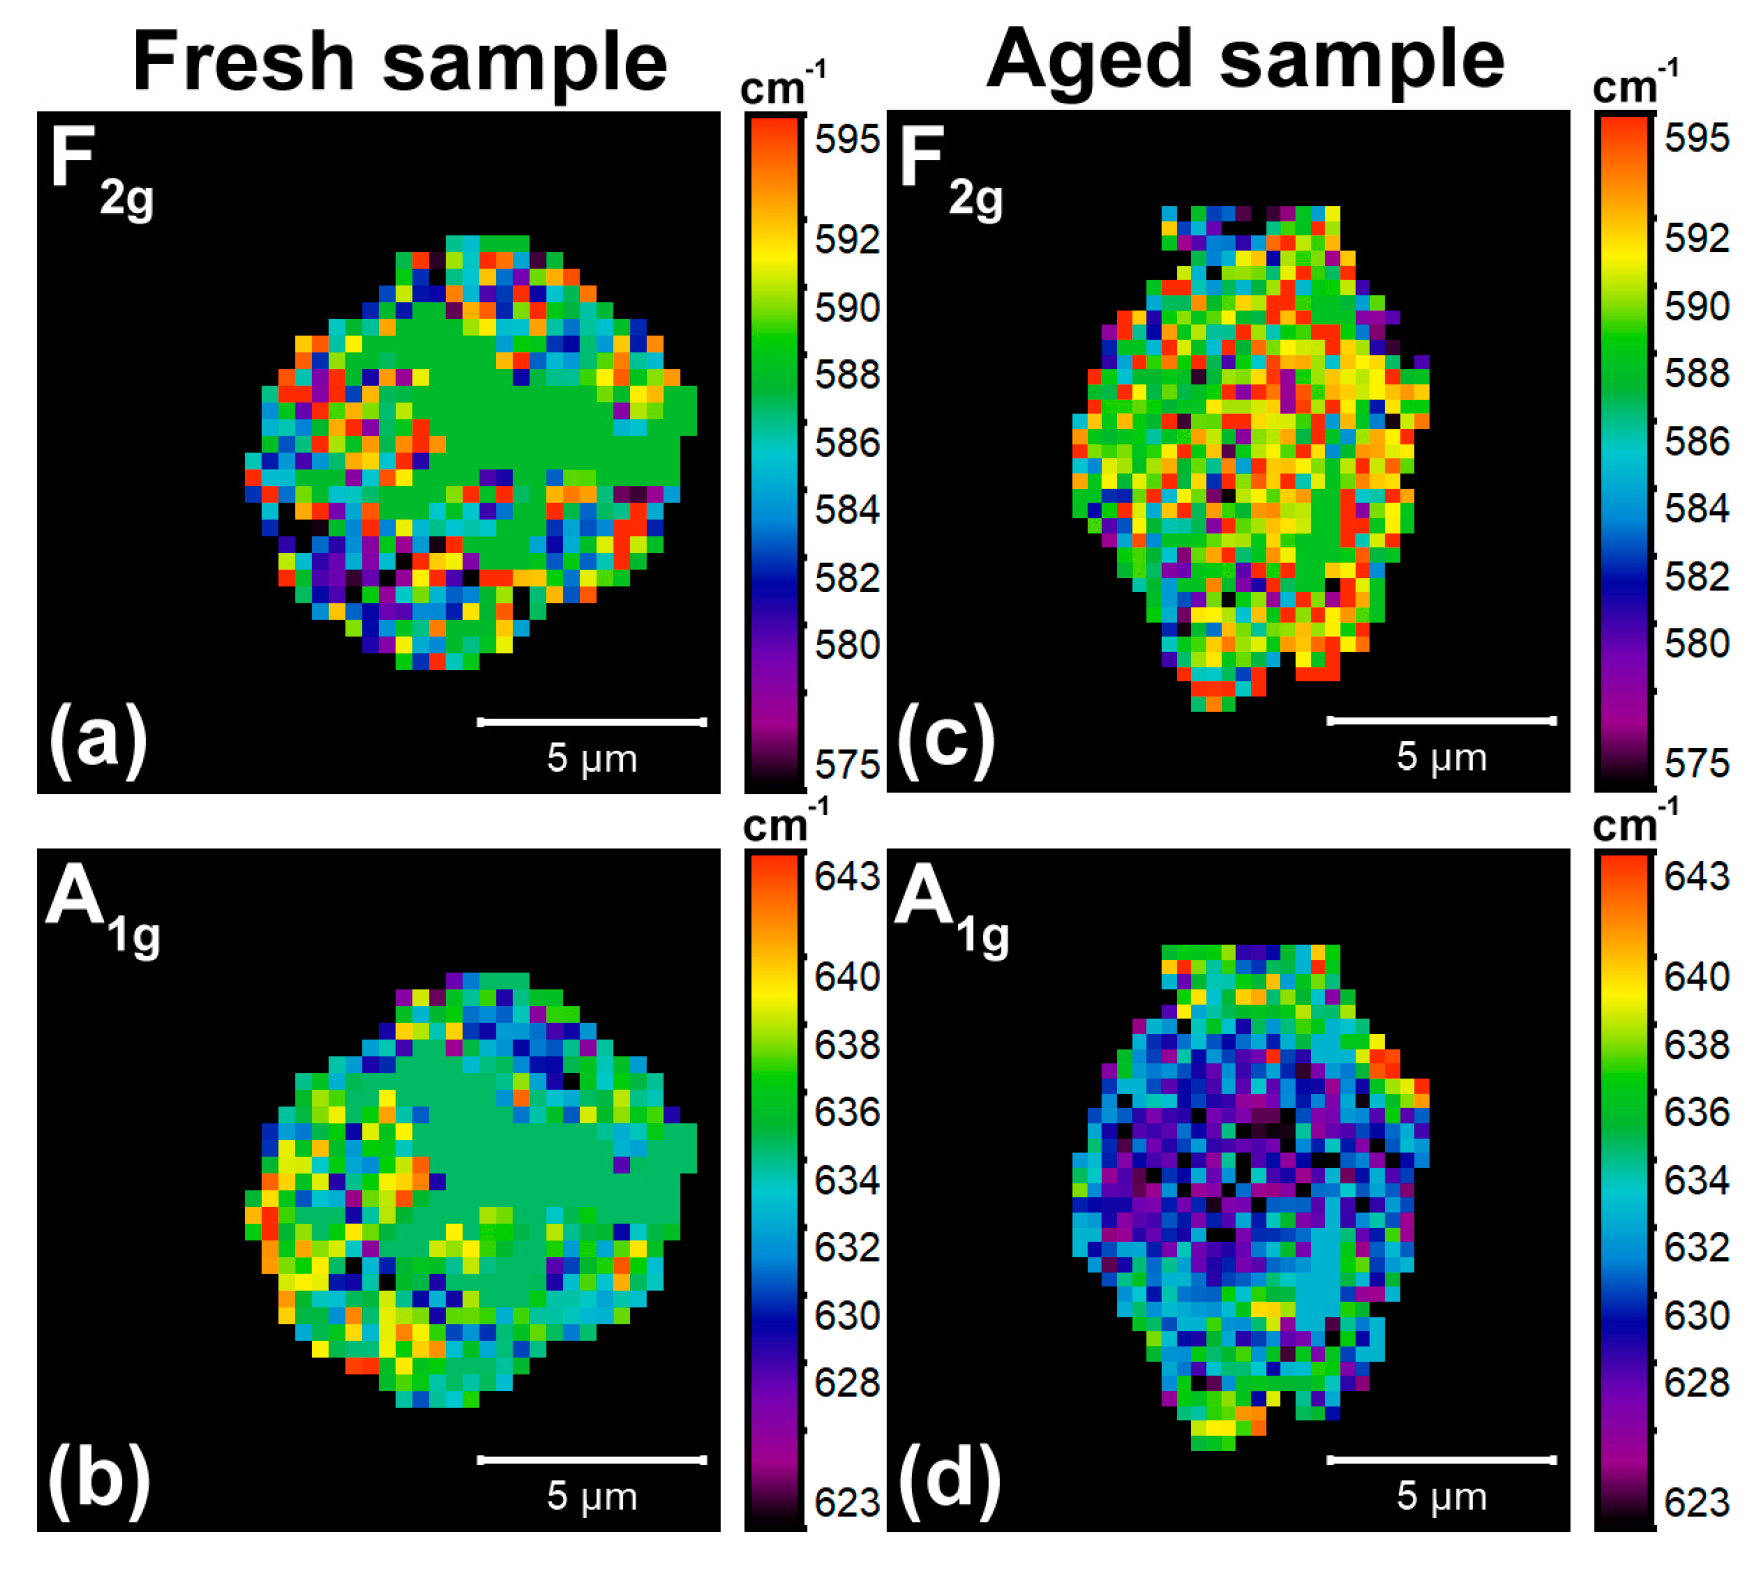
3.2. Characterization of Lithiated State
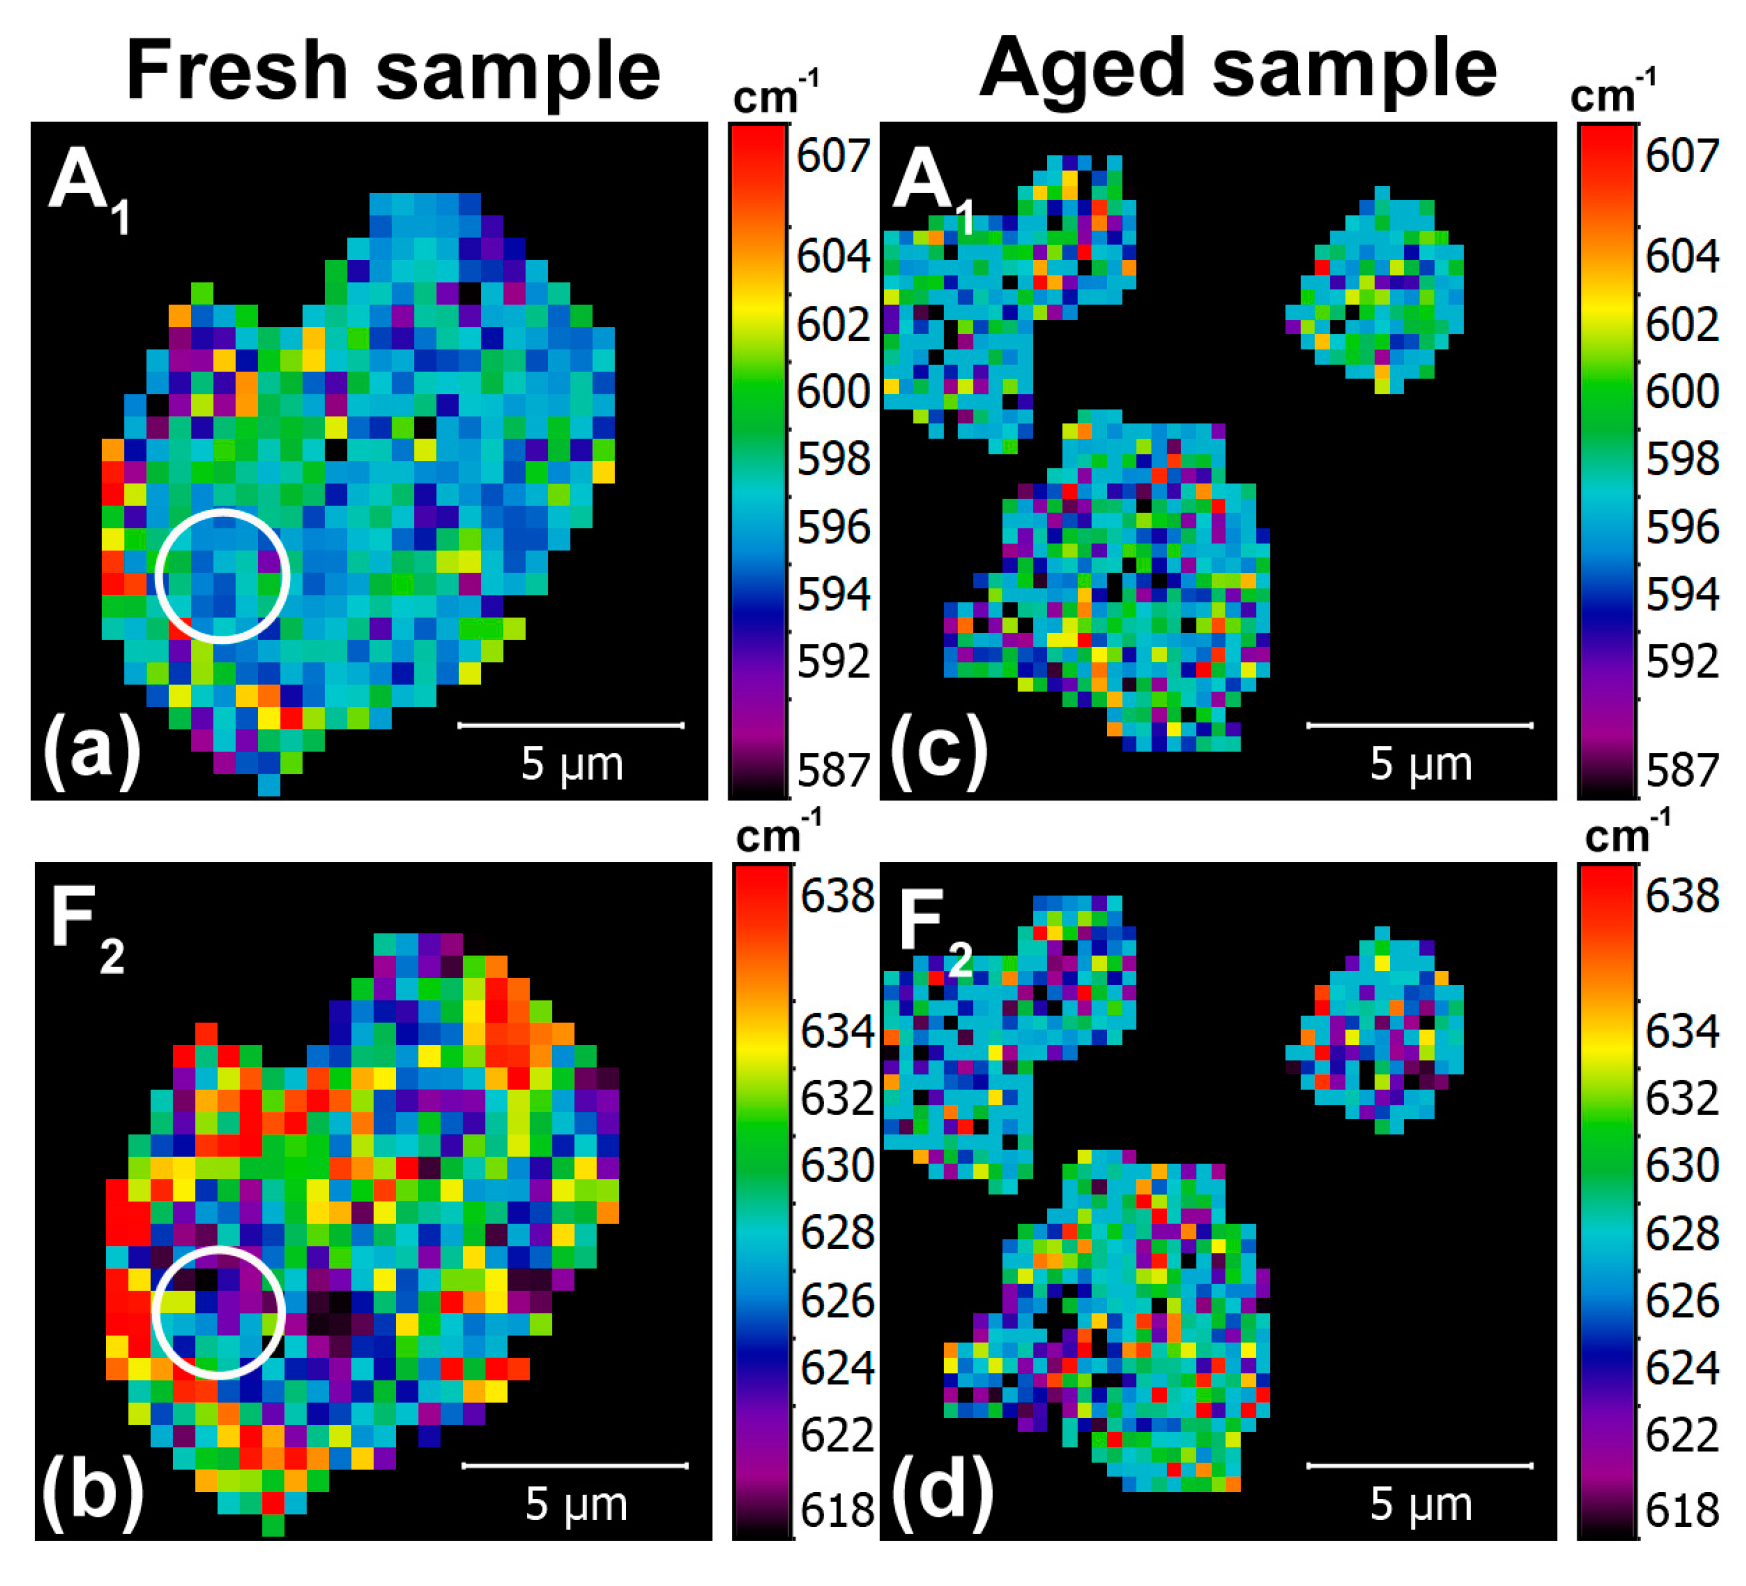
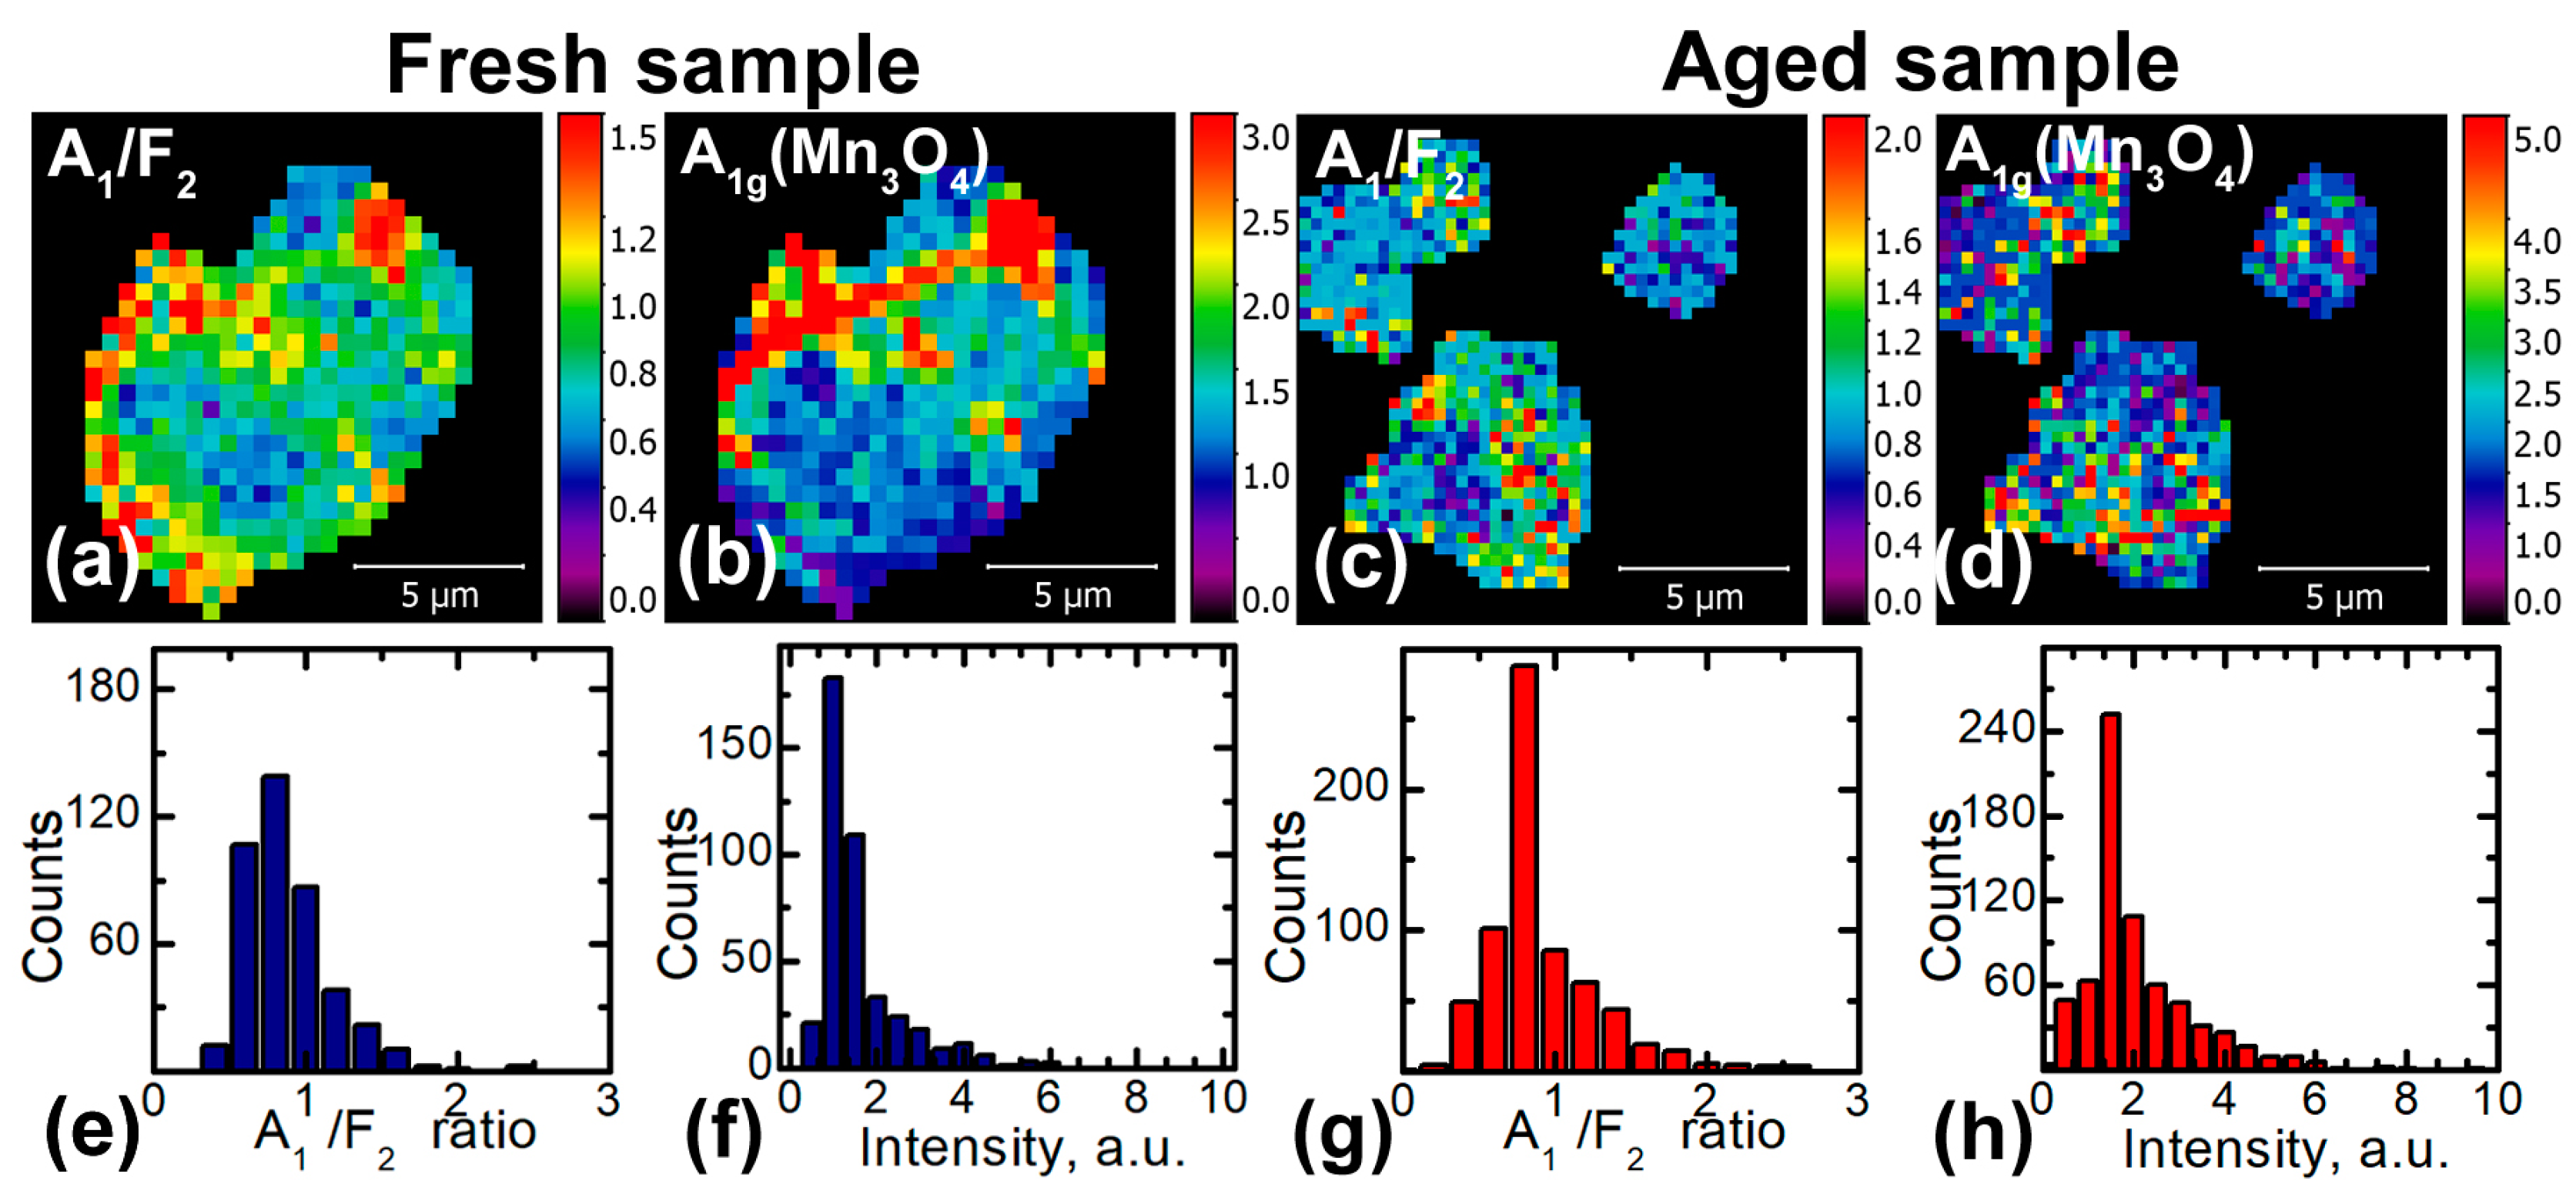
3.3. Characterization of Delithiated State
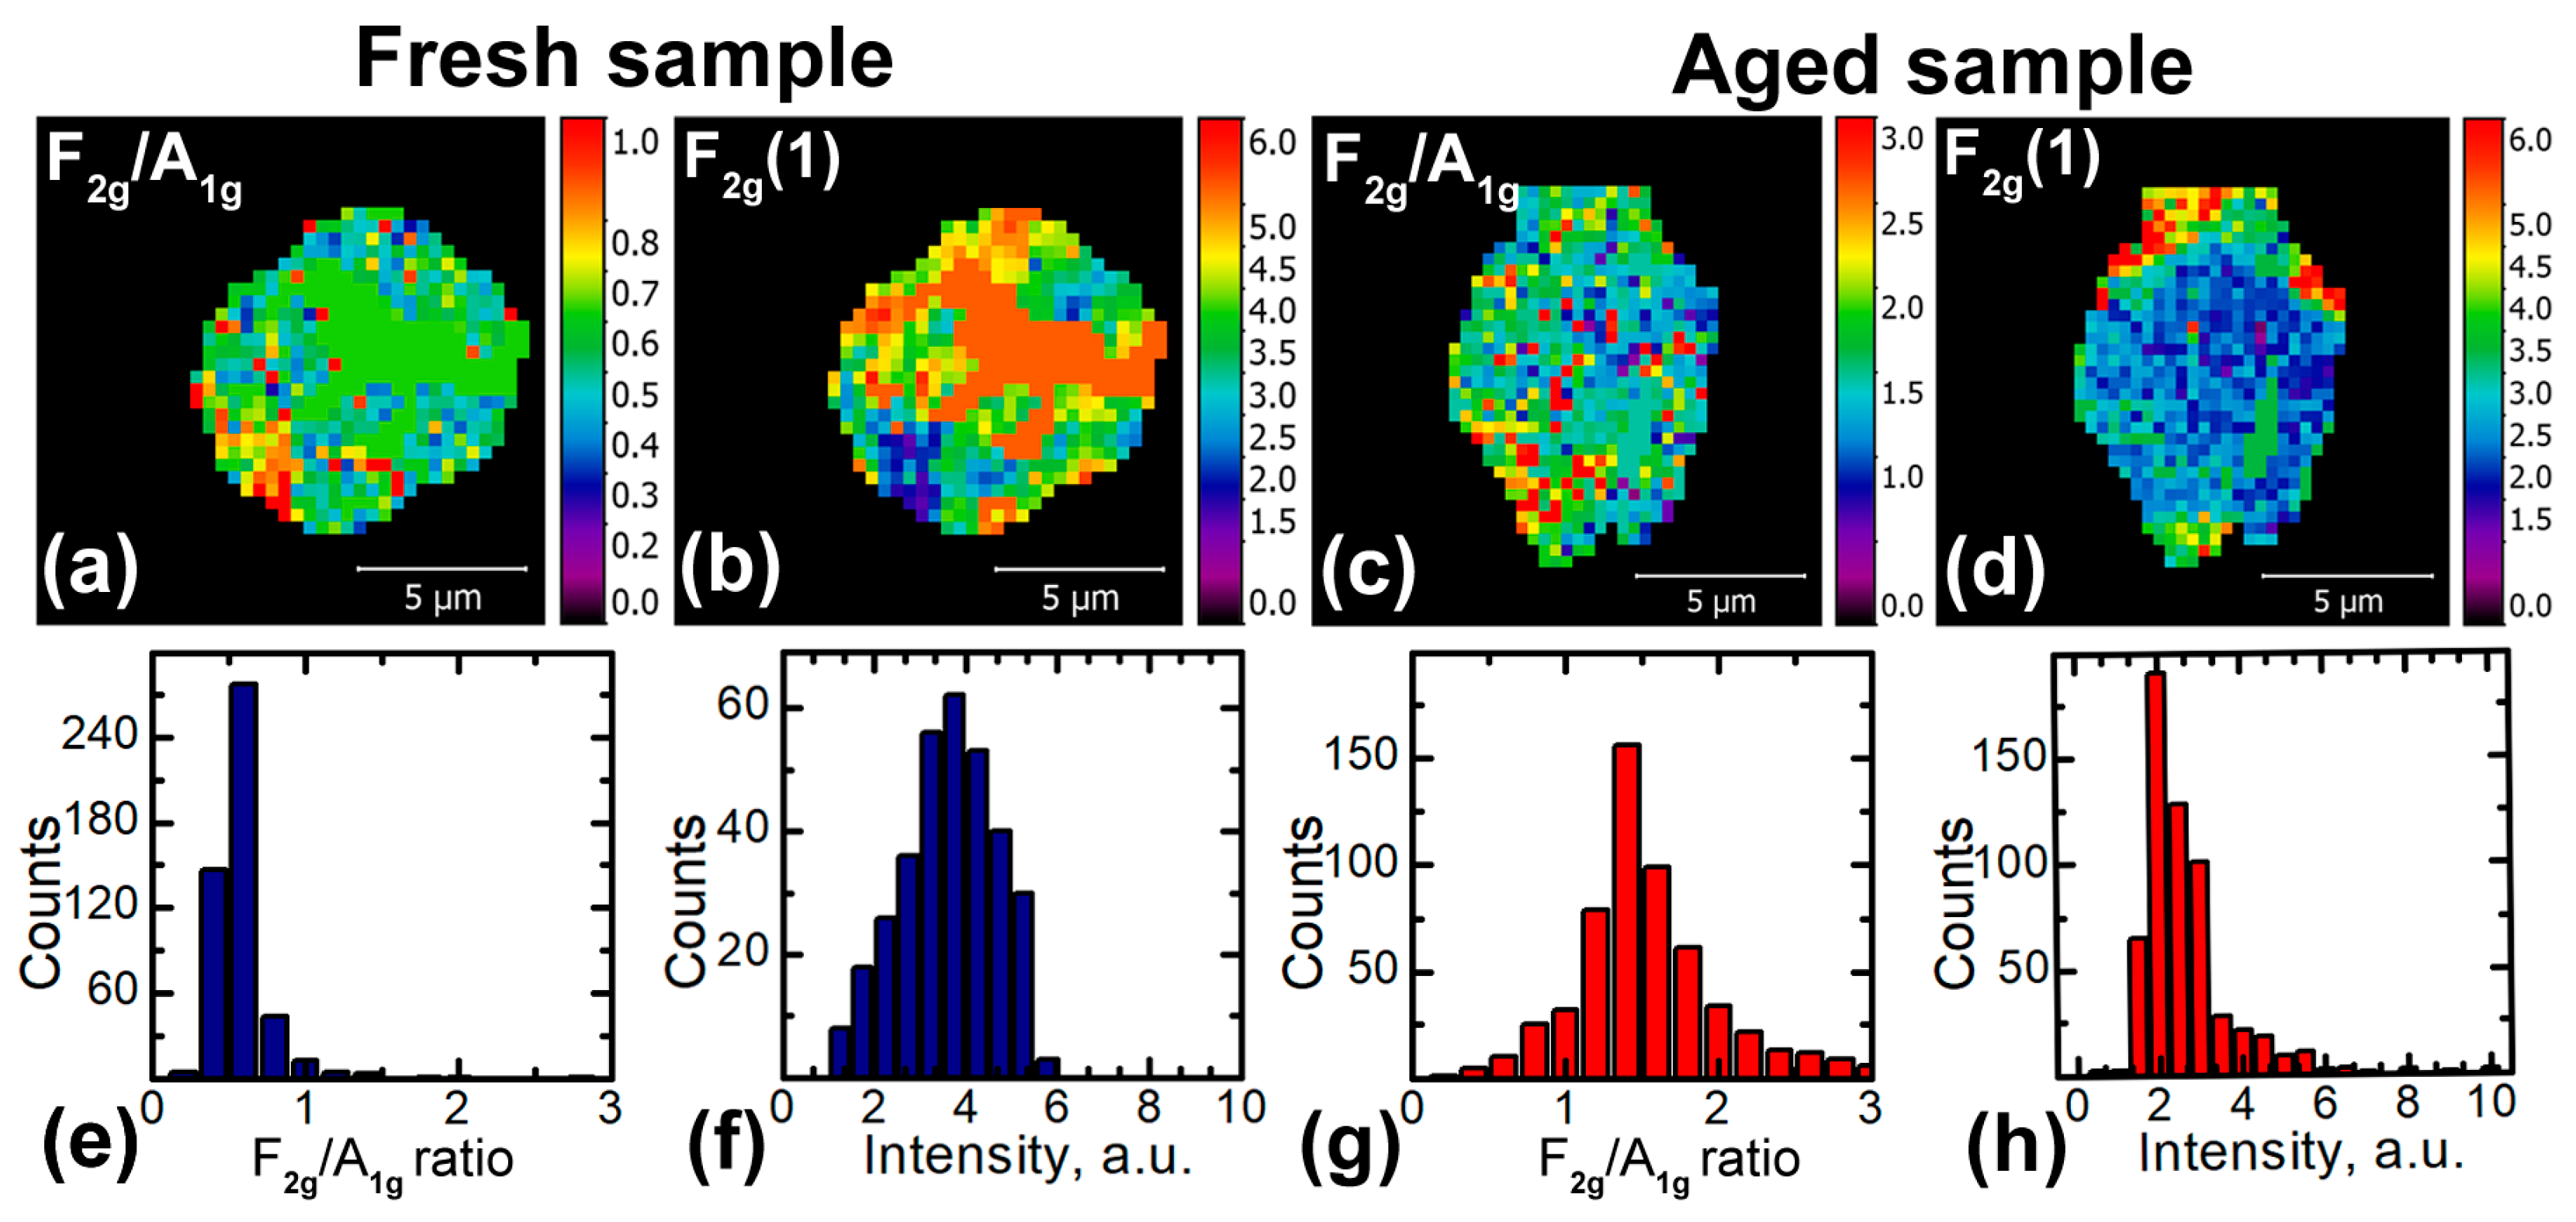
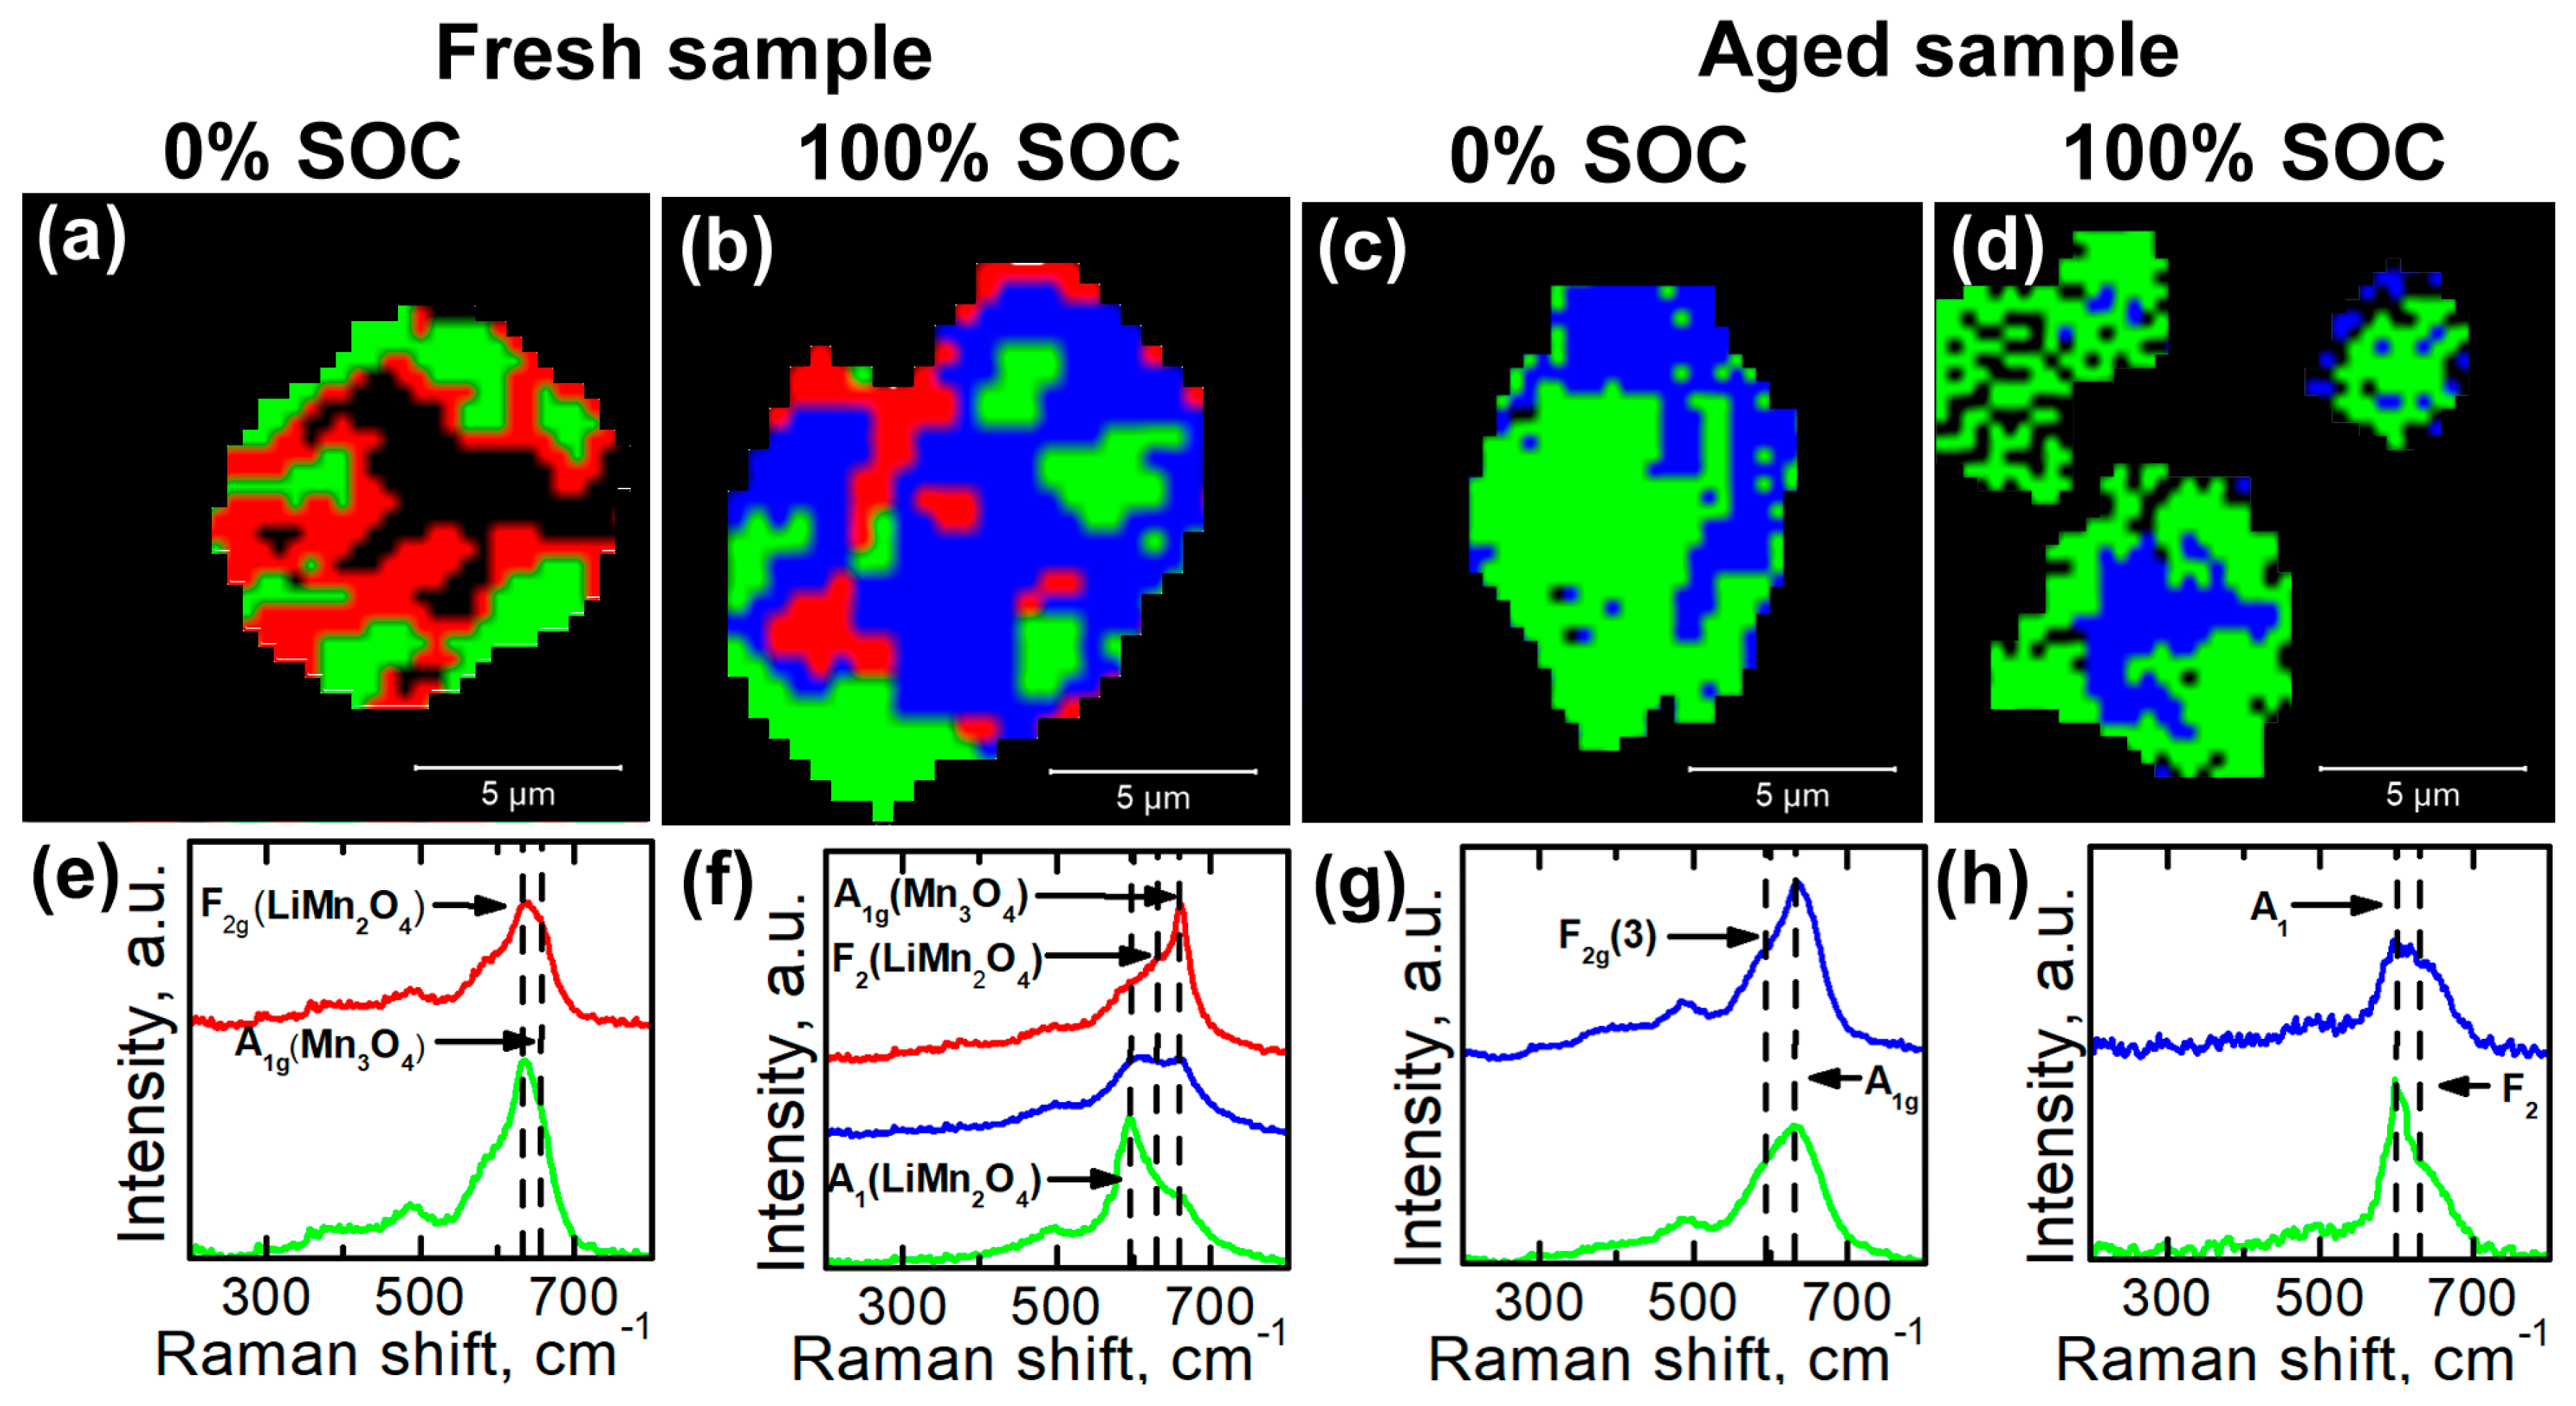
3.4. Cluster Analysis of the confocal Raman Spectroscopy Images
4. Conclusions
Author Contributions
Acknowledgments
Conflicts of Interest
References
- Thackeray, M.M.; Johnson, P.J.; De Picciotto, L.A.; Bruce, P.G.; Goodenough, J.B. Electrochemical Extraction of Lithium from LiMn2O4. Mater. Res. Bull. 1984, 19, 179–187. [Google Scholar] [CrossRef]
- Ohzuku, T.; Kitagawa, M.; Hirai, T. Electrochemistry of Manganese Dioxide in Lithium Nonaqueous Cell. J. Electrochem. Soc. 1990, 137, 769–775. [Google Scholar] [CrossRef]
- Thackeray, M.M.; David, W.I.F.; Bruce, P.G.; Goodenough, J.B. Lithium Insertion into Manganese Spinels. Mater. Res. Bull. 1983, 18, 461–472. [Google Scholar] [CrossRef]
- Fridman, K.; Sharabi, R.; Elazari, R.; Gershinsky, G.; Markevich, E.; Salitra, G.; Aurbach, D.; Garsuch, A.; Lampert, J. A New Advanced Lithium Ion Battery: Combination of High Performance Amorphous Columnar Silicon Thin Film Anode, 5V LiNi0.5Mn1.5O4 Spinel Cathode and Fluoroethylene Carbonate-Based Electrolyte Solution. Electrochem. Commun. 2013, 33, 31–34. [Google Scholar] [CrossRef]
- Julien, C.M.; Massot, M. Lattice Vibrations of Materials for Lithium Rechargeable Batteries I. Lithium Manganese Oxide Spinel. Mater. Sci. Eng. B 2003, 97, 217–230. [Google Scholar] [CrossRef]
- Baddour-Hadjean, R.; Pereira-Ramos, J.-P. Raman Microspectrometry Applied to the Study of Electrode Materials for Lithium Batteries. Chem. Rev. 2010, 110, 1278–1319. [Google Scholar] [CrossRef] [PubMed]
- Tang, D.; Sun, Y.; Yang, Z.; Ben, L.; Gu, L.; Huang, X. Surface Structure Evolution of LiMn2O4 Cathode Material upon Charge/discharge. Chem. Mater. 2014, 26, 3535–3543. [Google Scholar] [CrossRef]
- Xia, Y.; Zhou, Y.; Yoshiot, M. Capacily Fading on Cycling of 4V Li/LiMn2O4. Cells 1997, 144, 4–11. [Google Scholar] [CrossRef]
- Gummow, R.J.; de Kock, A.; Thackeray, M.M. Improved Capacity Retention in Rechargeable 4V Lithium/Lithium-Manganese Oxide (Spinel) Cells. Solid State Ionics 1994, 69, 59–67. [Google Scholar] [CrossRef]
- Julien, C.; Mauger, A.; Vijh, A.; Zaghib, K. Lithium Batteries. Science and Technology; Springer International Publishing: Cham, Switzerland, 2007; pp. 175–184. ISBN 978–3-319-19108-9. [Google Scholar]
- Du Pasquier, A. Mechanism for Limited 55 °C Storage Performance of Li1.05Mn1.95O4 Electrodes. J. Electrochem. Soc. 1999, 146, 428. [Google Scholar] [CrossRef]
- Zhan, C.; Wu, T.; Lu, J.; Amine, K. Dissolution, Migration, and Deposition of Transition Metal Ions in Li-Ion Batteries Exampled by Mn-Based Cathodes—A Critical Review. Energy Environ. Sci. 2018, 11, 243–257. [Google Scholar] [CrossRef]
- Ebner, M.; Marone, F.; Stampanoni, M.; Wood, V. Visualization and Quantification of Electrochemical and Mechanical Degradation in Li Ion Batteries. Science 2013, 342, 716–721. [Google Scholar] [CrossRef] [PubMed]
- Alikin, D.O.; Romanyuk, K.N.; Slautin, B.N.; Rosato, D.; Shur, V.Y.; Kholkin, A.L. Quantitative Characterization of the Ionic Mobility and Concentration in Li-Battery Cathodes via Low Frequency Electrochemical Strain Microscopy. Nanoscale 2018, 10, 2503–2511. [Google Scholar] [CrossRef] [PubMed]
- Sun, Y.K.; Hong, K.J.; Prakash, J. The Effect of ZnO Coating on Electrochemical Cycling Behavior of Spinel LiMn2O4 Cathode Materials at Elevated Temperature. J. Electrochem. Soc. 2003, 150, A970. [Google Scholar] [CrossRef]
- Thackeray, M.M.; Johnson, C.S.; Kim, J.S.; Lauzze, K.C.; Vaughey, J.T.; Dietz, N.; Abraham, D.; Hackney, S.A.; Zeltner, W.; Anderson, M.A. ZrO2- and Li2ZrO3-Stabilized Spinel and Layered Electrodes for Lithium Batteries. Electrochem. Commun. 2003, 5, 752–758. [Google Scholar] [CrossRef]
- Ram, P.; Gören, A.; Ferdov, S.; Silva, M.M.; Singhal, R.; Costa, C.M.; Sharma, R.K.; Lanceros-Méndez, S. Improved Performance of Rare Earth Doped LiMn2O4 Cathodes for Lithium-Ion Battery Applications. New J. Chem. 2016, 40, 6244–6252. [Google Scholar] [CrossRef]
- Liu, Q.; Wang, S.; Tan, H.; Yang, Z.; Zeng, J. Preparation and Doping Mode of Doped LiMn2O4 for Li-Ion Batteries. Energies 2013, 6, 1718–1730. [Google Scholar] [CrossRef]
- Leger, C.; Bach, S.; Soudan, P.; Pereira-Ramos, J.P. Structural and Electrochemical Properties of ω LixV2O5 (0.4 ≤ X ≤ 3) as Rechargeable Cathodic Material for Lithium Batteries. J. Electrochem. Soc. 2005, 152, A236–A241. [Google Scholar] [CrossRef]
- Itoh, T.; Sato, H.; Nishina, T.; Matue, T.; Uchida, I. In Situ Raman Spectroscopic Study of LixCoO2 Electrodes in Propylene Carbonate Solvent Systems. J. Power Sources 1997, 68, 333–337. [Google Scholar] [CrossRef]
- Inaba, M.; Iriyama, Y.; Ogumi, Z.; Todzuka, Y.; Tasaka, A. Raman Study of Layered Rock-Salt LiCoO2 and Its Electrochemical Lithium Deintercalation. J. Raman Spectrosc. 1997, 28, 613–617. [Google Scholar] [CrossRef]
- Dokko, K.; Mohamedi, M.; Anzue, N.; Itoh, T.; Uchida, I. In Situ Raman Spectroscopic Studies of LiNixMn2 − XO4 Thin Film Cathode Materials for Lithium Ion Secondary Batteries. J. Mater. Chem. 2002, 12, 3688–3693. [Google Scholar] [CrossRef]
- Harris, S.J.; Rahani, E.K.; Shenoy, V.B. Direct In Situ Observation and Numerical Simulations of Non-Shrinking-Core Behavior in an MCMB Graphite Composite Electrode. J. Electrochem. Soc. 2012, 159, A1501–A1507. [Google Scholar] [CrossRef]
- Harris, S.J.; Timmons, A.; Baker, D.R.; Monroe, C. Direct in Situ Measurements of Li Transport in Li-Ion Battery Negative Electrodes. Chem. Phys. Lett. 2010, 485, 265–274. [Google Scholar] [CrossRef]
- Migge, S.; Sandmann, G.; Rahner, D.; Dietz, H.; Plieth, W. Studying Lithium Intercalation into Graphite Particles via in Situ Raman Spectroscopy and Confocal Microscopy. J. Solid State Electrochem. 2005, 9, 132–137. [Google Scholar] [CrossRef]
- Kostecki, R.; McLarnon, F. Local-Probe Studies of Degradation of Composite LiNi0.8Co0.15Al0.05O2 Cathodes in High-Power Lithium-Ion Cells. Electrochem. Solid-State Lett. 2004, 7, A380. [Google Scholar] [CrossRef]
- Kerlau, M.; Marcinek, M.; Srinivasan, V.; Kostecki, R.M. Reprint of “Studies of Local Degradation Phenomena in Composite Cathodes for Lithium-Ion Batteries. ” Electrochim. Acta 2007, 53, 1386–1393. [Google Scholar] [CrossRef]
- Nishi, T.; Nakai, H.; Kita, A. Visualization of the State-of-Charge Distribution in a LiCoO2 Cathode by In Situ Raman Imaging. J. Electrochem. Soc. 2013, 160, A1785–A1788. [Google Scholar] [CrossRef]
- Nanda, J.; Remillard, J.; O’Neill, A.; Bernardi, D.; Ro, T.; Nietering, K.E.; Go, J.Y.; Miller, T.J. Local State-of-Charge Mapping of Lithium-Ion Battery Electrodes. Adv. Funct. Mater. 2011, 21, 3282–3290. [Google Scholar] [CrossRef]
- Pelegov, D.V.; Slautin, B.N.; Gorshkov, V.S.; Zelenovskiy, P.S.; Kiselev, E.A.; Kholkin, A.L.; Shur, V.Y. Raman Spectroscopy, “Big Data”, and Local Heterogeneity of Solid State Synthesized Lithium Titanate. J. Power Sources 2017, 346, 143–150. [Google Scholar] [CrossRef]
- Ammundsen, B.; Burns, G.R.; Islam, M.S.; Kanoh, H.; Roziere, J. Lattice Dynamics and Vibrational Spectra of Lithium Manganese Oxides: A Computer Simulation and Spectroscopic Study. J. Phys. Chem. B 1999, 103, 5175–5180. [Google Scholar] [CrossRef]
- Sinha, M.M.; Gupta, H.C. Study of Zone-Center Phonons in Lithium Manganese Oxide. Phys. B Condens. Matter 2002, 316, 166–169. [Google Scholar] [CrossRef]
- Anzue, N. In Situ Raman Spectroscopic Study of Thin-Film Li1−xMn2O4 Electrodes. Solid State Ionics 2003, 156, 301–307. [Google Scholar] [CrossRef]
- Kanoh, H.; Tang, W.; Ooi, K. In Situ Raman Spectroscopic Study on Electroinsertion of Li+ into a Pt/λ-MnO2 Electrode in Aqueous Solution. Electrochem. Solid-State Lett. 1998, 1, 17–19. [Google Scholar] [CrossRef]
- Ramana, C.V.; Massot, M.; Julien, C.M. XPS and Raman Spectroscopic Characterization of LiMn2O4 Spinels. Surf. Interface Anal. 2005, 37, 412–416. [Google Scholar] [CrossRef]
- Gao, Y.; Reimers, J.N.; Dahn, J.R. Changes in the Voltage pro Le of Li/Li1-xMn2-xO4 Cells as a Function of X. Phys. Rev. B 1996, 54, 3878–3883. [Google Scholar] [CrossRef]
- Nishizawa, M.; Ise, T.; Koshika, H.; Itoh, T.; Uchida, I. Electrochemical In-Situ Conductivity Measurements for Thin Film of Li1-xMn2O4 Spinel. Chem. Mater. 2000, 12, 1367–1371. [Google Scholar] [CrossRef]
- Luchkin, S.Y.; Amanieu, H.Y.; Rosato, D.; Kholkin, A.L. Li Distribution in Graphite Anodes: A Kelvin Probe Force Microscopy Approach. J. Power Sources 2014, 268, 887–894. [Google Scholar] [CrossRef]
- Alikin, D.O.; Ievlev, A.V.; Luchkin, S.Y.; Turygin, A.P.; Shur, V.Y.; Kalinin, S.V.; Kholkin, A.L. Characterization of LiMn2O4 Cathodes by Electrochemical Strain Microscopy. Appl. Phys. Lett. 2016, 108, 113106. [Google Scholar] [CrossRef]
- Amanieu, H.Y.; Aramfard, M.; Rosato, D.; Batista, L.; Rabe, U.; Lupascu, D.C. Mechanical Properties of commercial LixMn2O4 cathode under Different States of Charge. Acta Mater. 2015, 89, 153–162. [Google Scholar] [CrossRef]
- Dieing, T.; Hollricher, O.; Toporski, J. Confocal Raman Microscopy; Springer-Verlag: Berlin, Germany, 2010; pp. 75–83. ISBN 978-3-642-12521-8. [Google Scholar]
- Andersson, A.S.; Thomas, J.O. The Source of First-Cycle Capacity Loss in LiFePO4. J. Power Sources 2001, 97, 498–502. [Google Scholar] [CrossRef]


| № of Sample | State of Health | State of Charge | Composition | Lattice Parameter, Å |
|---|---|---|---|---|
| S1 | 100% | 0% | Li0.94Mn2O4 | 8.18 |
| S2 | 100% | 100% | Li0.61Mn2O4 | 8.09 |
| S3 | 80% | 0% | Li0.89Mn2O4 | 8.18 |
| S4 | 80% | 100% | Li0.65Mn2O4 | 8.11 |
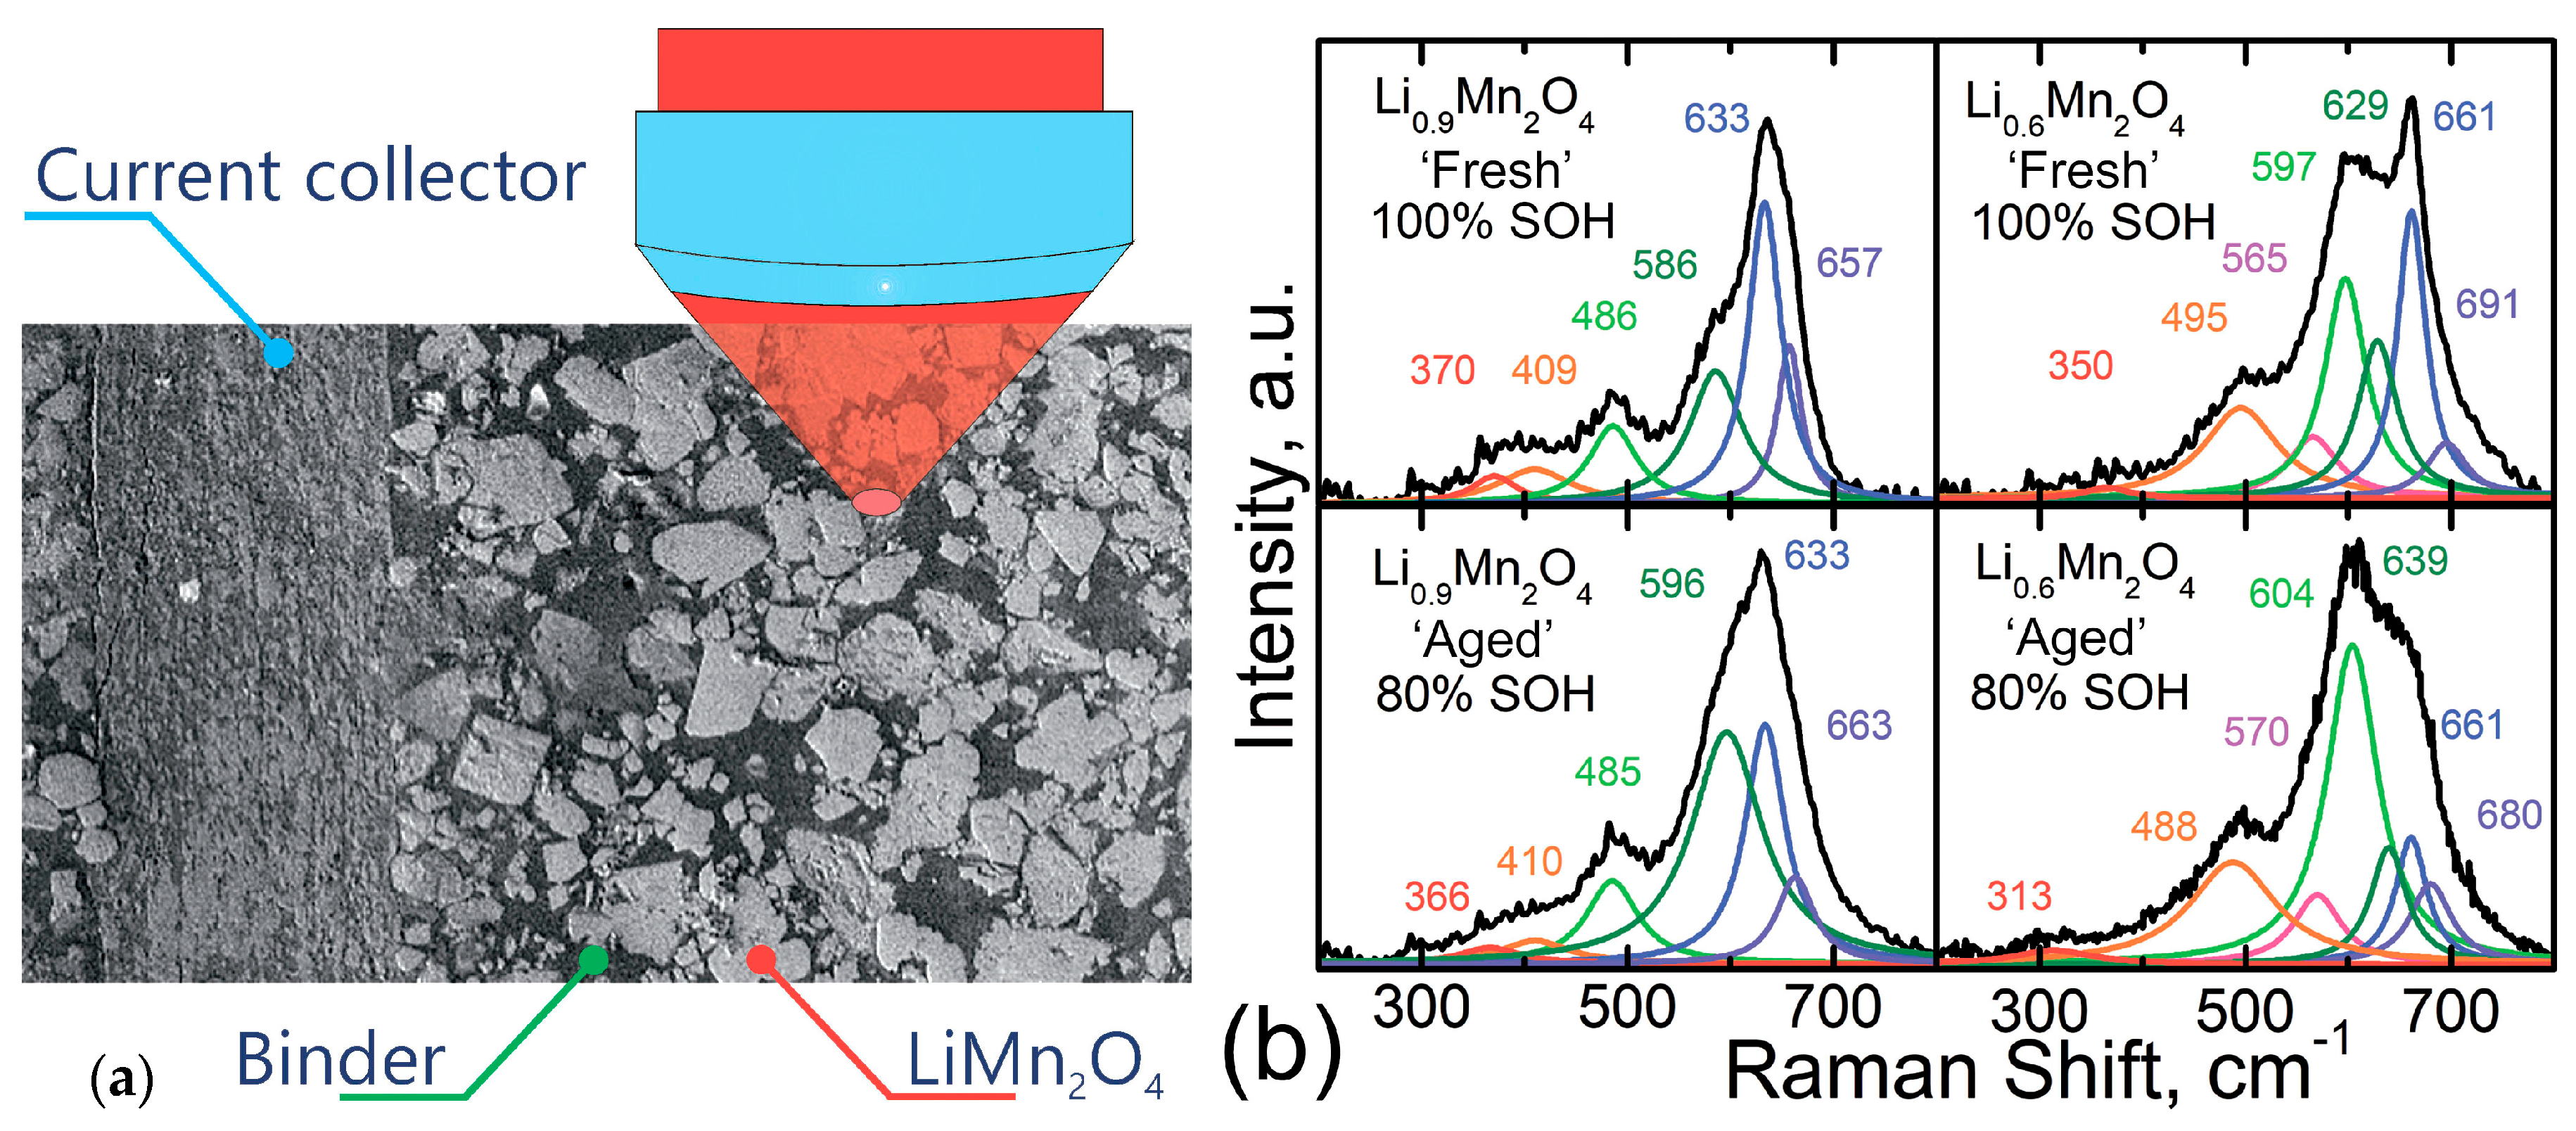
| Li0.9Mn2O4 | Fresh | Aged | Li0.6Mn2O4 | Fresh | Aged |
|---|---|---|---|---|---|
| F2g(1) | 370 cm−1 | 366 cm−1 | F2 | 350 cm−1 | 313 cm−1 |
| Eg | 409 cm−1 | 410 cm−1 | F2 | 495 cm−1 | 488 cm−1 |
| F2g(2) | 486 cm−1 | 485 cm−1 | A1 | 565 cm−1 | 570 cm−1 |
| F2g(3) | 586 cm−1 | 596 cm−1 | A1 | 597 cm−1 | 604 cm−1 |
| A1g | 629 cm−1 | 633 cm−1 | F2 | 629 cm−1 | 639 cm−1 |
| A1g(Mn3O4) | 657 cm−1 | 663 cm−1 | A1g(Mn3O4) | 661 cm−1 | 661 cm−1 |
| ν(Mn2O3) | 691 cm−1 | 680 cm−1 |
© 2018 by the authors. Licensee MDPI, Basel, Switzerland. This article is an open access article distributed under the terms and conditions of the Creative Commons Attribution (CC BY) license (http://creativecommons.org/licenses/by/4.0/).
Share and Cite
Slautin, B.; Alikin, D.; Rosato, D.; Pelegov, D.; Shur, V.; Kholkin, A. Local Study of Lithiation and Degradation Paths in LiMn2O4 Battery Cathodes: Confocal Raman Microscopy Approach. Batteries 2018, 4, 21. https://doi.org/10.3390/batteries4020021
Slautin B, Alikin D, Rosato D, Pelegov D, Shur V, Kholkin A. Local Study of Lithiation and Degradation Paths in LiMn2O4 Battery Cathodes: Confocal Raman Microscopy Approach. Batteries. 2018; 4(2):21. https://doi.org/10.3390/batteries4020021
Chicago/Turabian StyleSlautin, Boris, Denis Alikin, Daniele Rosato, Dmitry Pelegov, Vladimir Shur, and Andrei Kholkin. 2018. "Local Study of Lithiation and Degradation Paths in LiMn2O4 Battery Cathodes: Confocal Raman Microscopy Approach" Batteries 4, no. 2: 21. https://doi.org/10.3390/batteries4020021
APA StyleSlautin, B., Alikin, D., Rosato, D., Pelegov, D., Shur, V., & Kholkin, A. (2018). Local Study of Lithiation and Degradation Paths in LiMn2O4 Battery Cathodes: Confocal Raman Microscopy Approach. Batteries, 4(2), 21. https://doi.org/10.3390/batteries4020021