Optimal Charging of Vanadium Redox Flow Battery with Time-Varying Input Power
by
 , ,
, ,
Md. Parvez Akter
1 ,
,
Yifeng Li
1,
Jie Bao
1,*,
Maria Skyllas-Kazacos
1 and
Muhammed Fazlur Rahman
2 1
School of Chemical Engineering, The University of New South Wales, Sydney, NSW 2052, Australia
2
School of Electrical Eng. and Telecom., The University of New South Wales, Sydney, NSW 2052, Australia
*
Author to whom correspondence should be addressed.
Batteries 2019, 5(1), 20; https://doi.org/10.3390/batteries5010020
Submission received: 14 November 2018
/
Revised: 19 January 2019
/
Accepted: 31 January 2019
/
Published: 10 February 2019
(This article belongs to the Special Issue Vanadium Redox Flow Battery and Its Applications)
Abstract
:The battery energy storage system has become an indispensable part of the current electricity network due to the vast integration of renewable energy sources (RESs). This paper proposes an optimal charging method of a vanadium redox flow battery (VRB)-based energy storage system, which ensures the maximum harvesting of the free energy from RESs by maintaining safe operations of the battery. The VRB has a deep discharging capability, long cycle life, and high energy efficiency with no issues of cell-balancing, which make it suitable for large-scale energy storage systems. The proposed approach determines the appropriate charging current and the optimal electrolyte flow rate based on the available time-varying input power. Moreover, the charging current is bounded by the limiting current, which prevents the gassing side-reactions and protects the VRB from overcharging. The proposed optimal charging method is investigated by simulation studies using MATLAB/Simulink.
1. Introduction
The rapid integration of renewable energy generation in the current electricity network can help in relieving climate change, ensuring future energy security and providing some economic benefits [1]. However, the electrical energy generated by renewable energy sources (RESs) is criticized for being variable or intermittent, which can affect the stability and reliability of the electricity network. These issues can be overcome by deploying highly efficient energy storage systems in RES-based electricity network [2]. Batteries are the key elements of energy storage system. Among all the battery technologies, the vanadium redox flow battery (VRB), invented by Skyllas-Kazacos et al. [3], is the most promising technology for the RES-based electricity networks due to its scale-integration capability [4]. The VRB has a deep discharging capability, very long cycle life, and high energy efficiency, such that it provides more reliable operations compared with other battery technologies [5]. The chemical reactions occurring in the cell stack during charging can be presented as:
The power flow control system plays an important role in battery operation especially if the input power is time-varying. Several battery charging methods such as constant-current (CC), constant-voltage (CV) and constant-current followed by constant-voltage (CC-CV) have been reported in literature [6]. The existing control approaches fail to capture the maximum available power from RESs. Moreover, the tracking of constant charging current is a challenge if the available input power is insufficient. If the power from RESs is sufficient, the conventional charging scheme can track the charging current accurately but often fails to protect the VRB from overcharging. The CC-CV charging technique shows a better performance in protecting VRBs from overcharging compared with the CC and CV methods [7]. This CC-CV charging approach protects batteries from overcharging by pre-setting a voltage limit. This voltage limit is generally determined based on the state-of-charge (SOC) of the battery system. However, gassing side-reactions, namely oxygen and hydrogen evolutions, can take place before the preset limit depending on the variation of charging current.
As the voltage limiting method cannot ensure the safe operation of VRB, the limiting current constraint-based control technique could be a better alternative. Moreover, the charging scheme also needs to deal with the time-varying nature of the input power for capturing the maximum amount of free energy from RESs. Several research activities have been performed for determining the optimal charging [8,9] and limiting current [10] based on the battery operating efficiency. These charging methods did not consider the variable available power. A limiting current constraint-based advanced charging scheme is proposed in [11], which considers the variable available input power condition. However, this advanced charging scheme losses its optimality due to the constant electrolyte flow rate of the VRB system.
The electrolyte flow rate is an important factor in the VRB operations. Several flow-rate optimization studies such as constant flow rates in different pre-defined battery terminal voltage level [12], model-based flow-rate optimization [13], optimized flow rate based on parametric study [14], optimized flow rate considering pump energy loss [15], pulsating flow rate for the minimal pump energy consumption [16], and variable flow rate based on the thermal model [17] have been reported in the literature. The electrolyte flow rate depends on the system SOC and the charging current. Furthermore, the constraints of pressure-drop in the VRB hydraulic system (main pipes, channels, and porous electrodes) and pump power consumption rating is also an important factor in determining the optimal electrolyte flow rate. These constraints of pump energy consumption can be calculated from a pre-defined look-up table and the concentration distribution can be estimated from the mass balance model of the VRB system.
This paper proposes an optimal charging scheme of a VRB system, which calculates the optimal charging and limiting current and dynamically optimizes the electrolyte flow rate to capture the maximum power from RESs, ensure proper safe operation of VRB and minimize the power loss in the energy storage system. The proposed control technique efficiently charges the energy storage system through a bidirectional isolated dc-dc converter [18]. A single phase-shifted PI controller is used to operate the dc-dc converter as reported in [19]. The rest of the paper is organized as follows: the nonlinear VRB model considering the concentration distribution of vanadium ions, mass balance, stack voltage, and the hydraulic system is presented in Section 2. Section 3 describes the isolated dc-dc converter topology and its control technique. The calculation of charging and limiting current, flow-rate optimization and the proposed control algorithm are demonstrated in Section 4. The proposed optimal charging control scheme is investigated with a MATLAB/Simulink simulation, and the results and comparison studies are discussed in Section 5 and Section 6, respectively. Finally, the conclusions are drawn in Section 7.
2. VRB Model
The schematic diagram of the VRB stack is presented in Figure 1. This paper assumes that all the vanadium species are fully balanced in the VRB stack. The concentration distribution of all four vanadium ions can be accurately determined from the system SOC. The VRB offers a special advantage that the open circuit potential of inlet and outlet of VRB stack can be measured during real-time operation [20]. The SOC of the battery cell () and tank () can be determined from the outlet and inlet open circuit potential as:
and
where, is the formal potential, n is the number of electrons transferred in the redox reaction, F and R are the Faraday and gas constant, and T is temperature.
The concentration distribution of all four vanadium ions in the VRB system (cell and tank) becomes:
where, the concentration distribution of all vanadium ions in VRB cell and tank can be determined based on the total vanadium concentration () and SOC as:
and
2.1. VRB Stack Voltage
The total potential across a VRB cell can be described as:
where, i is the current density, () is the ohmic resistivity, and is the over-potential in each VRB cell. Many research articles published to date use the geometric surface area of the porous electrode for determining the current density . This geometrical surface area-based current density is only valid for the compact electrodes. In the case of the practical porous electrode, the actual electrochemically active surface area can be significantly larger than the geometrical surface area. However, the determination of this actual surface area of the porous electrode can be difficult. Therefore, in this paper, we adopt a scaling factor to represent the effect of the actual electrochemical surface area of the porous electrodes, as in [21]. Considering this actual electrode surface area, the current density of the VRB system can be calculated as follows:
where, is the charging current. The value of k varies with the cell/stack design and the active electrode areas.
This cell over-potential is the summation of concentration () and activation over-potential (). The is usually small and can be neglected when the surface area of porous electrode is large. On the other hand, the expression of concentration over-potential is:
where, and are the bulk and surface concentrations, respectively.
The concentrations of and ions in the electrode surface (, ) depend on the bulk concentrations (, ), and the current density as:
and
where, and are the mass transfer coefficients in the negative ( or ions) and positive ( or ions) half-cell, respectively. The mass transfer coefficient for vanadium species i, adopted from [21], can be calculated as follows:
where, is the diffusion coefficient of the vanadium species i, in the electrode surface, is the electrode fiber diameter, and are the electrolyte density and viscosity, respectively. is the fluid velocity of the electrolyte, which can be calculated from the volumetric electrolyte flow rate () in the cell and the available electrode cross-sectional area () by assuming the isotropic behavior of the porous electrode, as follows:
Therefore, the stack voltage of the complete VRB system can be presented as:
2.2. Hydraulic System
The total pressure-drop of the VRB hydraulic system consists the pressure drops in the main piping system, channel and the porous electrodes as reported in [22]. Therefore the total pressure-drop () in VRB system can be presented as:
where is the dynamic viscosity of the electrolyte and is the permeability of the porous electrode. This can be described by Kozeny-Carman equation as:
where, is the fiber diameter, K is the Kozeny-Carman constant and is the porosity of the porous electrode.
Hence, the total power consumed by the two pumps () of the VRB system can be presented as:
where, is the pump efficiency. This paper considers a typical variable speed pump efficiency profile as presented in Figure 2.
3. Design of Dual-Active-Bridge (DAB) Isolated dc-dc Converter
Energy storage system requires power electronic converters for sharing the electrical power between the battery storage devices and electricity networks. The dual-active-bridge (DAB) dc-dc converter offers high power transfer capabilities with galvanic isolation and works in a wide operating range [19]. These characteristics enhance the uses of DAB dc-dc converter in the RES-based energy storage systems. The schematic diagram of the bidirectional dc-dc converter is presented in Figure 3, which has two identical bridge converters. These two bridge converters are denoted as bridge 1 and bridge 2, which are isolated with a 20-kHz high-frequency transformer. Two different switching devices such as IGBT for bridge-1 and MOSFET for bridge 2 are used due to the operating voltage requirement of these two bridges. The soft-switching characteristics are also achieved by inserting a snubber circuit parallel with each semiconductor power switches.
The amount of power transfer (P) through this bidirectional dc-dc converter is controlled by the phase-shift between the two half-bridges as [23]:
where, and are the voltage of the high and low voltage bus respectively, N is transformer turns ration, is switching frequency, and L is the leakage inductance. Using the above relation of (18), the current at the bridge 2 () can be controlled by the phase-shift as:
4. Proposed Charging Control Method
4.1. Determination of Charging Current with Variable Input Power
Charging power consumed by the VRB-based energy storage system is the product of VRB charging current and its terminal voltage . Hence, the expression of the VRB charging power can be elaborated from Equations (7), (9) and (14) as:
The main target of the proposed optimal VRB charging scheme is to harvest the maximum free energy from the RESs as well as to ensure the proper safety operation of the energy storage system. Ideally, the charging power should be equal to the available input power to capture the maximum amount of energy. Therefore, the charging current (I), which ensures the maximum energy harvesting can be determined by numerically solving the nonlinear input power input power () equation as:
4.2. Limiting Current
As mentioned in the earlier section, the voltage limiting constraint-based charging techniques often fail to maintain the proper safety operation of the VRB system. To overcome these limitations, this paper proposes a limiting current constraint-based optimal charging method to avoid overcharging and gassing side-reactions. This limiting current is calculated from the boundary of the concentration over-potential. Surface concentration limit is considered in this paper for pre-setting the boundary of concentration over-potential. Therefore, the limiting current can be determined from (10) and (11) by considering the boundary condition as:
4.3. Flow-Rate Optimization
It is important to control the electrolyte volumetric flow rate during charging/discharging. Insufficient flow rate can lead to gassing side-reactions, while maintaining a high flow rate will lead to a poor system energy efficiency. In this study, a flow rate control approach is proposed to determine the optimal volumetric flow rate based on the recent history of charging current. Because the time response of charging current is much faster than the electrolyte flow rate, an average charging current () within a specified time period () is used to determine the flow rate during the above time period. This paper considers that the average current during the current time period will remain the same until the next sampling time period :
Based on this average current, the integrated energy consumed by the VRB system and the pump is calculated during the next specified time period . Then, the optimum electrolyte flow rate, which minimizes this energy consumption is applied to VRB system. Beside of this energy consumption minimization, the electrolyte flow rate and battery SOC need to be bounded within a specified limit for ensuring the proper safe operation of the VRB system. The maximum electrolyte flow rate () is the flow rate, which allows VRB system to charge up to (or discharge up to ) SOC at nominal rated current by using a specified flow factor and the minimum flow rate () is chosen a smaller non-zero value. On the other hand, 10–90% operating range of the SOC is considered in this paper as a SOC boundary ( to ). Considering the above-mentioned control problem, the optimal flow rate during the time from t to (updated every time period) can be determined in real time by solving the following optimization problem:
This optimal flow rate is applied to a variable speed pump fitted in each electrolyte tank. Figure 4 shows the proposed optimal charging control scheme, which firstly measured the available input power from the RESs. Then, the charging current, which ensures the maximum harvesting of this free energy as well as maintains the limiting current constraints is calculated based on the nonlinear model of VRB and available input power. The bidirectional isolated dc-dc converter accurately tracks this charging current to charge the VRB system by using (19).
5. Results and Discussion
A MATLAB/Simulink model of VRB system with a power rating of 2.0 kW is used to verify the proposed optimal charging control scheme under the variable power condition. The detail dynamic model of the process is presented in the Appendix A. The model assumes the battery cell stack acts as a continuous stir tank reactor (CSTR). Table 1 and Table 2 show all the parameters, which are used in design and simulation.
This paper considers the power loss associated with the VRB hydraulic system. This hydraulic power loss consists the power consumption by two pumps and the pressure losses across the piping system, flow frame, and porous electrodes. In this case, study, we consider the same cell/stack/electrode design (with the same active electrode area) as in [21] and adopt the value of the scaling factor from [21]. Table 3 shows the parameters, which are considered for the hydraulic system and the Figure 5 presents the pressure-drop and total power consumption by the electrical pumps of VRB.
The real-time experimental data from a 3.0 kW (peak) photovoltaic (PV) system is considered in this paper as a variable input power. The power consumption by the VRB system and the available variable input power are presented in Figure 6a. This Figure 6a confirms that the proposed control algorithm provides a significant amount of charging power when the input power is low. Moreover, the proposed controller maintains minimum electrolyte flow under the low power to reduce the power loss in the VRB system as presented in Figure 6d.
The optimal charging control scheme determines the current limit considering the available time-varying input power from RESs, current SOC, and electrolyte flow rate. This limiting current constraint protects the VRB system from gassing side-reactions and overcharging when the input power is high. Figure 6b,e shows the battery voltage , charging current and limiting current , which shows that the terminal voltage of the VRB system and the charging current are within their limit.
Using the charging current, the proposed optimal charging control algorithm effectively determine the optimized electrolyte flow rate () at a specified time-step according to the optimal cost function (24). Figure 6d shows the optimal flow, which ensures the maximum power consumed by the VRB system. Finally, the electrolyte flow rate and the charging current are switched off when the system SOC reached 90% as presented in Figure 6c.
6. Comparison Studies
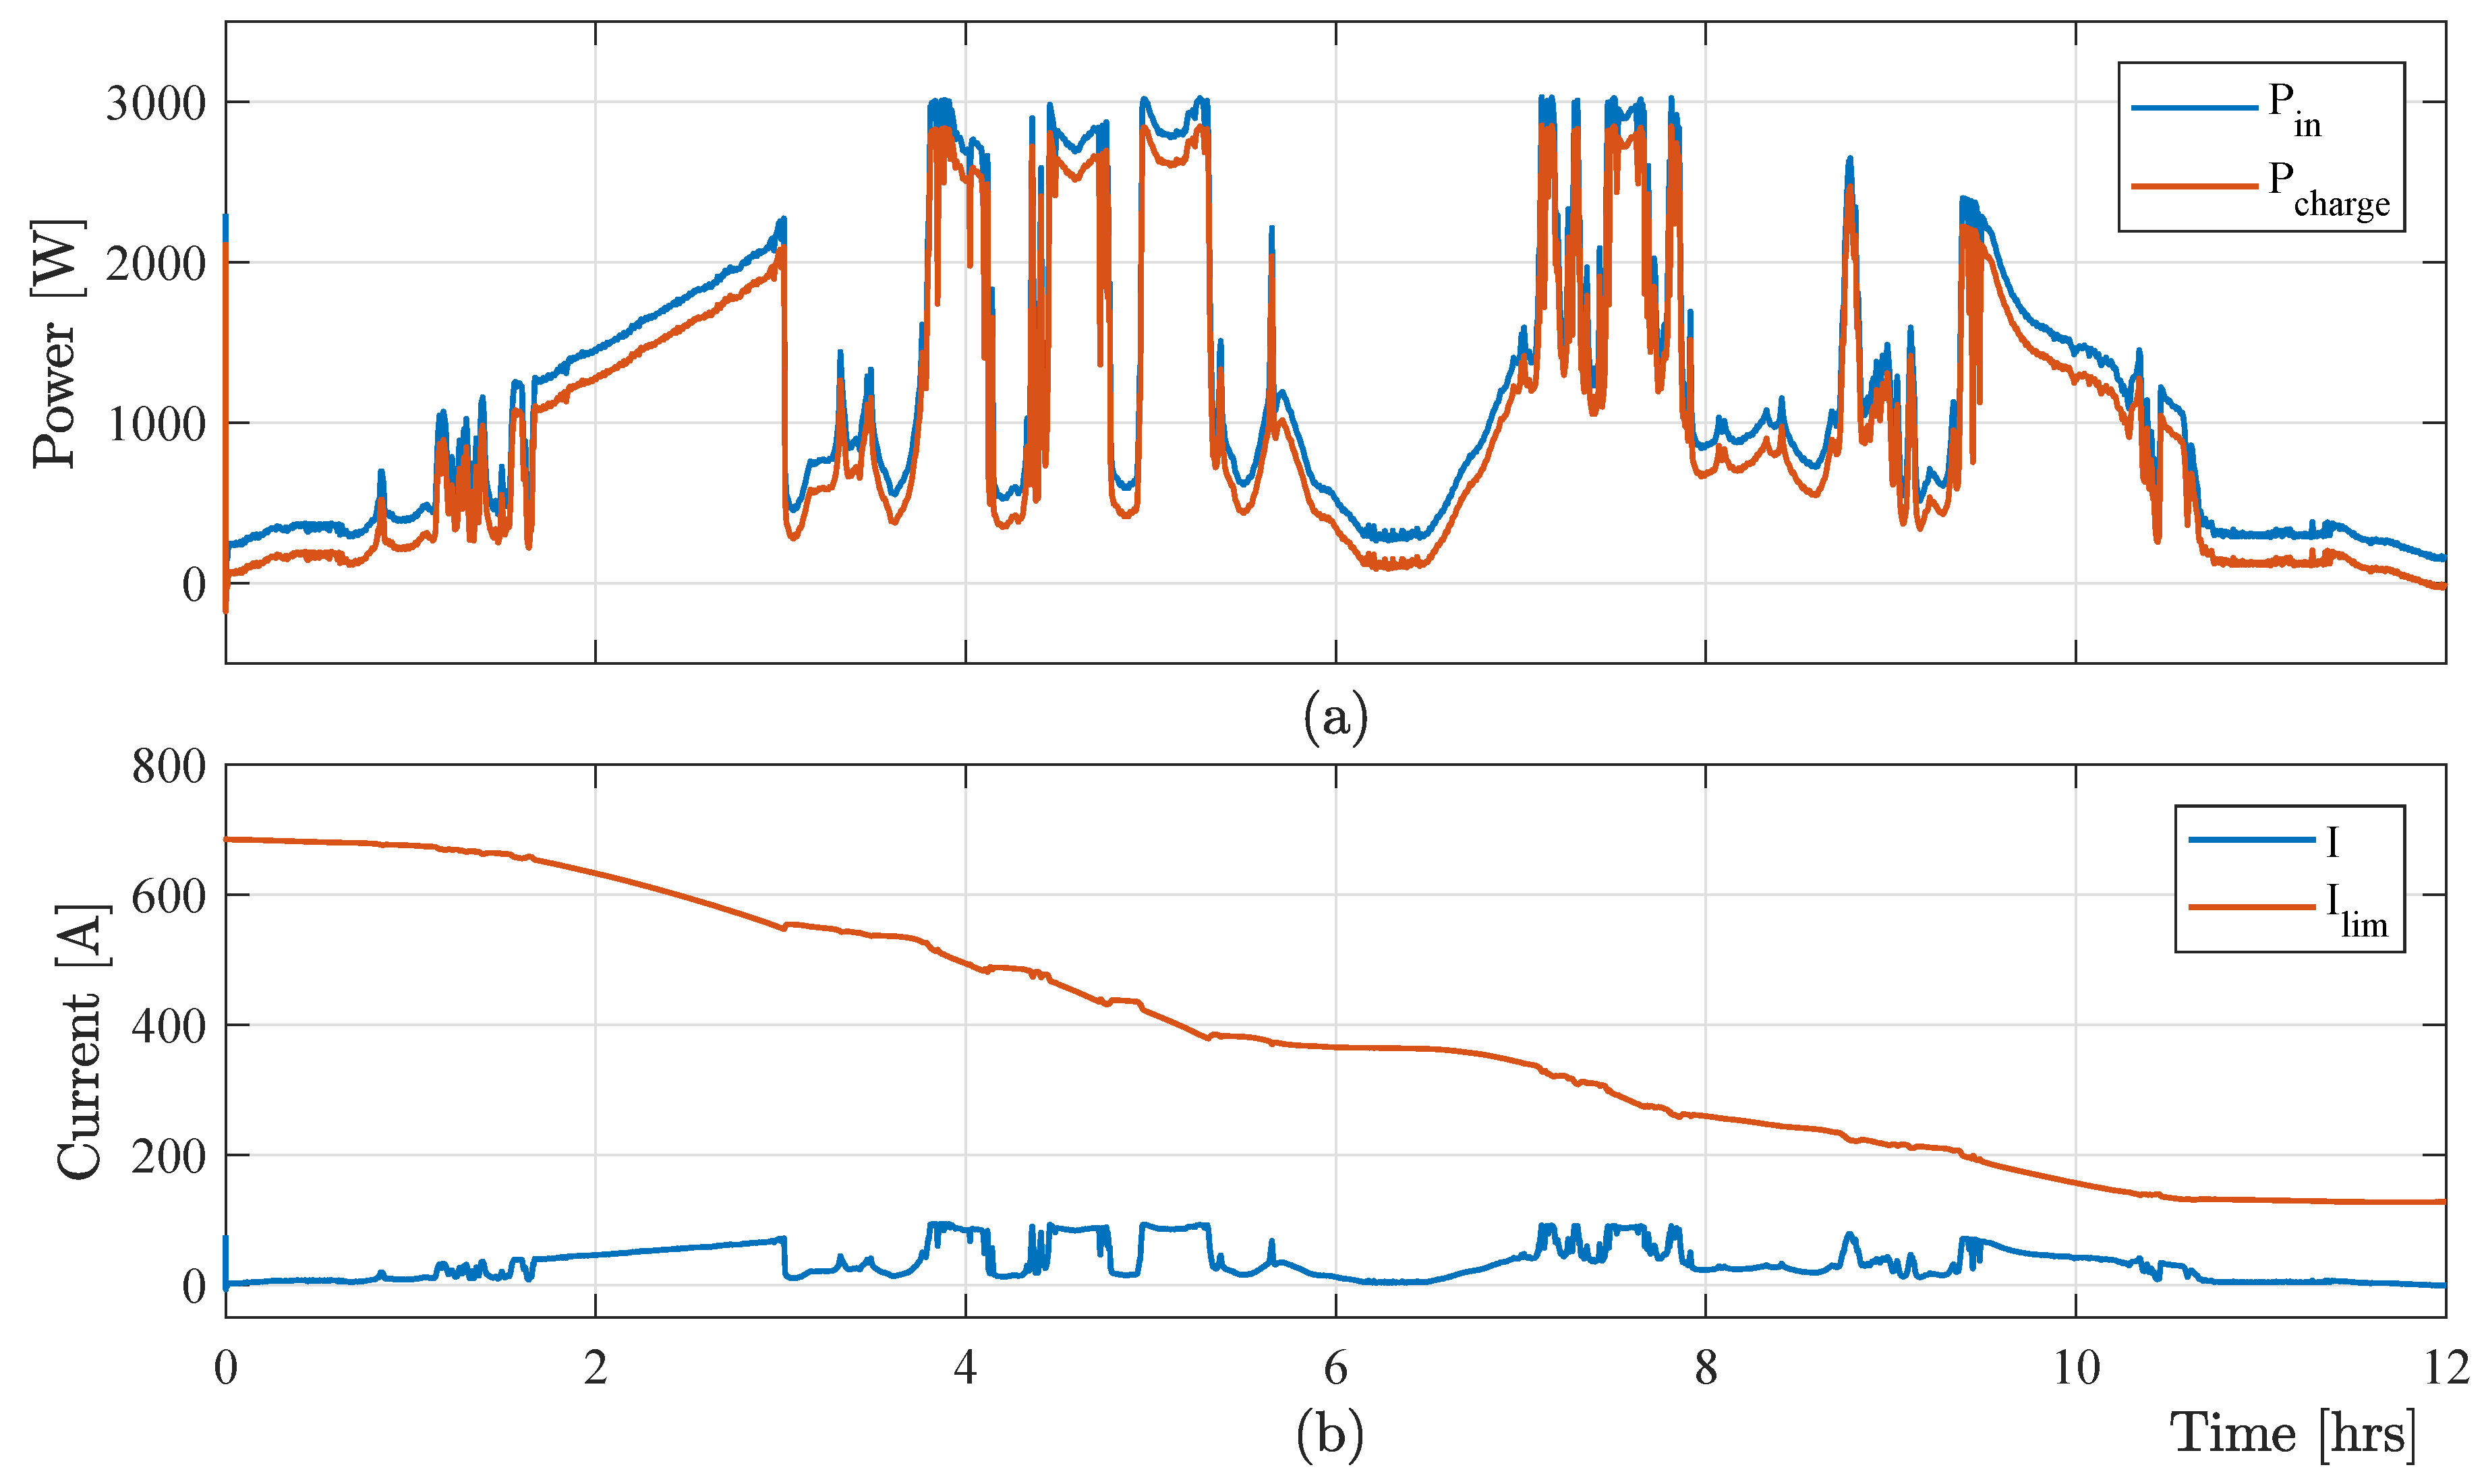
A comparative study of VRB charging system with different flow rate has been performed in this section to verify the effectiveness of the proposed optimal charging scheme. Figure 7 the shows variable input power from RES and charging power , and measured charging and limiting with the minimum electrolyte flow rate (). As the lower electrolyte flow minimizes the limiting current, the charging scheme associated with the minimum electrolyte flow rate losses significant amount of free energy from the RESs. Figure 7 confirms the loss of free energy from RESs, which limits the effectiveness of the minimum flow-rate-based charging controller. On the other hand, the maximum flow-rate-based VRB charging scheme also fails to charge the battery optimally as it increases the power losses in the hydraulic system. Figure 8 shows that the maximum electrolyte flow-rate-based control method increases the limiting current, which ensures the maximum capturing of the free energy from RESs. This method causes huge power losses in the hydraulic system, which finally reduces the power harvesting of the VRB-based energy storage system from the RESs.
The limitations associated with the different constant flow-rate-based charging method can be overcome with the proposed optimal charging scheme, which applies the optimal variable electrolyte flow rate with a specific sampling time (). The simulations results presented in Figure 6a,e confirm that the proposed optimal charging algorithm ensures maximum capturing of free energy from RESs by changing the flow rate optimally. The optimal capturing of variable input power can be further verified with a variation of change with different flow-rate condition as shown in Figure 9. Figure 9 shows that the VRB system takes 10.6 h minimum time to charge up to with the optimal flow rate while other constant charging methods cannot charge fully within this time frame. Moreover, Table 4 shows that at the minimum flow rate (), only of the available energy is used for charging due to the high concentration over-voltage at high currents and SOCs. At the maximum flow rate, only of the available energy is used for charging since more energy is consumed by the pumps ( in this case). On the other hand, the optimal flow-rate control algorithm uses of free energy, which is much higher compared with these constant flow-rate-based control algorithms.
7. Conclusions
An optimal charging scheme is presented in this paper for harvesting the maximum amount of “free” energy from RES as well as maintaining a safe operation of the VRB system. The proposed control approach determines the appropriate charging current by considering the available input power and optimizes the electrolyte flow rate to efficiently charge the VRB. The contributions of the research include limiting current determination and optimal flow-rate control, which protect the VRB system from gassing side-reactions. The simulation study shows that the proposed optimal charging control scheme achieves high energy efficiency while capturing maximum amount of time-varying input power. Future work includes experimental studies and validation of the proposed control approach.
Author Contributions
M.P.A. conducted simulation studies, analyzed simulation results and prepared the manuscript. Y.L. validated the results and revised the manuscript. J.B. conceptualized the idea, revised the manuscript and supervised the research project. M.S.-K. revised the manuscript and co-supervised the research project. M.F.R. co-supervised the project.
Funding
This research was funded by the Australian Research Council Discovery Projects DP150103100.
Acknowledgments
The first author would like to acknowledge the Graduate Research School, University of New South Wales (UNSW) for providing financial support through the 2017 Scientia PhD Scholarship.
Conflicts of Interest
The authors declare no conflict of interest.
Appendix A. Mass Balance Model
The concentration balance of all four vanadium ions in the cell can be described by the following ordinary differential equation (ODE) model by assuming the cell stack acts as a CSTR:
where, I is the charging current, Q is the electrolyte flow rate, M is total number of cells, are length, height, and width of the electrode, respectively, are the diffusion coefficients of ions across the membrane, respectively, and d is the thickness of membrane.
The concentration balance of vanadium ions in tanks can be written as:
where, is the volume of electrolyte in reservoir tanks.
References
- Karunathilake, H.; Perera, P.; Ruparathna, R.; Hewage, K.; Sadiq, R. Renewable energy integration into community energy systems: A case study of new urban residential development. J. Clean. Prod. 2018, 173, 292–307. [Google Scholar] [CrossRef]
- Akter, M.P.; Mekhilef, S.; Tan, N.M.L.; Akagi, H. Model predictive control of bidirectional AC-DC converter for energy storage system. J. Electr. Eng. Technol. 2015, 10, 165–175. [Google Scholar] [CrossRef]
- Skyllas-Kazacos, M.; Rychcik, M.; Robins, R.G.; Fane, A.; Green, M. New all-vanadium redox flow cell. J. Electrochem. Soc. 1986, 133, 1057. [Google Scholar] [CrossRef]
- Divya, K.; Østergaard, J. Battery energy storage technology for power systems—An overview. Electr. Power Syst. Res. 2009, 79, 511–520. [Google Scholar] [CrossRef]
- Wei, Z.; Bhattarai, A.; Zou, C.; Meng, S.; Lim, T.M.; Skyllas-Kazacos, M. Real-time monitoring of capacity loss for vanadium redox flow battery. J. Power Sources 2018, 390, 261–269. [Google Scholar] [CrossRef]
- Banguero, E.; Correcher, A.; Pérez-Navarro, Á.; Morant, F.; Aristizabal, A. A Review on Battery Charging and Discharging Control Strategies: Application to Renewable Energy Systems. Energies 2018, 11, 1021. [Google Scholar] [CrossRef]
- Takahashi, T.; Sato, B. Battery Pack and Charging Method. U.S. Patent 12/725,109, 2010. [Google Scholar]
- Li, Y.; Zhang, X.; Bao, J.; Skyllas-Kazacos, M. Studies on optimal charging conditions for vanadium redox flow batteries. J. Energy Storage 2017, 11, 191–199. [Google Scholar] [CrossRef]
- Blanc, C.; Rufer, A. Optimization of the operating point of a vanadium redox flow battery. In Proceedings of the IEEE Energy Conversion Congress and Exposition (ECCE-2009), San Jose, CA, USA, 20–24 September 2009; pp. 2600–2605. [Google Scholar]
- Chen, J.Y.; Hsieh, C.L.; Hsu, N.Y.; Chou, Y.S.; Chen, Y.S. Determining the Limiting Current Density of Vanadium Redox Flow Batteries. Energies 2014, 7, 5863–5873. [Google Scholar] [CrossRef]
- Akter, M.P.; Li, Y.; Bao, J.; Skyllas-Kazacos, M.; Rahman, M.; Fletcher, J.E.; Zhang, X. Charging Control of Vanadium Redox Battery Based Energy Storage Systems with Variable Input Power. In Proceedings of the 2018 IEEE 27th International Symposium on Industrial Electronics (ISIE), Cairns, Australia, 13–15 June 2018; pp. 489–494. [Google Scholar]
- Ma, X.; Zhang, H.; Sun, C.; Zou, Y.; Zhang, T. An optimal strategy of electrolyte flow rate for vanadium redox flow battery. J. Power Sources 2012, 203, 153–158. [Google Scholar] [CrossRef]
- König, S.; Suriyah, M.; Leibfried, T. Innovative model-based flow rate optimization for vanadium redox flow batteries. J. Power Sources 2016, 333, 134–144. [Google Scholar] [CrossRef]
- Kim, D.K.; Yoon, S.J.; Lee, J.; Kim, S. Parametric study and flow rate optimization of all-vanadium redox flow batteries. Appl. Energy 2018, 228, 891–901. [Google Scholar] [CrossRef]
- Xiao, W.; Tan, L. Control strategy optimization of electrolyte flow rate for all vanadium redox flow battery with consideration of pump. Renew. Energy 2018, in press. [Google Scholar] [CrossRef]
- Ling, C.; Cao, H.; Chng, M.; Han, M.; Birgersson, E. Pulsating electrolyte flow in a full vanadium redox battery. J. Power Sources 2015, 294, 305–311. [Google Scholar] [CrossRef]
- Xiong, B.; Zhao, J.; Tseng, K.J.; Skyllas-Kazacos, M.; Lim, T.M.; Zhang, Y. Thermal hydraulic behavior and efficiency analysis of an all-vanadium redox flow battery. J. Power Sources 2013, 242, 314–324. [Google Scholar] [CrossRef]
- Akter, P.; Uddin, M.; Mekhilef, S.; Tan, N.M.L.; Akagi, H. Model predictive control of bidirectional isolated DC–DC converter for energy conversion system. Int. J. Electron. 2015, 102, 1407–1427. [Google Scholar] [CrossRef]
- Tan, N.M.L.; Abe, T.; Akagi, H. Design and performance of a bidirectional isolated DC–DC converter for a battery energy storage system. IEEE Trans. Power Electro. 2012, 27, 1237–1248. [Google Scholar] [CrossRef]
- Li, Y.; Zhang, X.; Bao, J.; Skyllas-Kazacos, M. Control of electrolyte flow rate for the vanadium redox flow battery by gain scheduling. J. Energy Storage 2017, 14, 125–133. [Google Scholar] [CrossRef]
- König, S.; Suriyah, M.; Leibfried, T. Validating and improving a zero-dimensional stack voltage model of the Vanadium Redox Flow Battery. J. Power Sources 2018, 378, 10–18. [Google Scholar] [CrossRef]
- Tang, A.; Bao, J.; Skyllas-Kazacos, M. Studies on pressure losses and flow rate optimization in vanadium redox flow battery. J. Power Sources 2014, 248, 154–162. [Google Scholar] [CrossRef]
- Guacaneme, J.; Garcerá, G.; Figueres, E.; Patrao, I.; González-Medina, R. Dynamic modeling of a dual active bridge DC to DC converter with average current control and load-current feed-forward. Int. J. Circuit Theory Appl. 2015, 43, 1311–1332. [Google Scholar] [CrossRef]
Figure 1.
Schematic diagram of a VRB stack.

Figure 2.
Efficiency distribution of a typical variable speed pump.

Figure 3.
Bidirectional isolated dc-dc converter-based VRB energy storage system.

Figure 4.
Proposed optimal charging control approach.

Figure 5.
Total pressure-drop [blue line] and power consumption [red line] by the hydraulic system with respect to the electrolyte flow rate (Q).
Figure 5.
Total pressure-drop [blue line] and power consumption [red line] by the hydraulic system with respect to the electrolyte flow rate (Q).

Figure 6.
Simulation results: (a) input power and charging power , (b) battery voltage , (c) SOC, (d) optimal flow rate , and (e) measured charging and limiting current with the proposed optimal charging scheme.
Figure 6.
Simulation results: (a) input power and charging power , (b) battery voltage , (c) SOC, (d) optimal flow rate , and (e) measured charging and limiting current with the proposed optimal charging scheme.
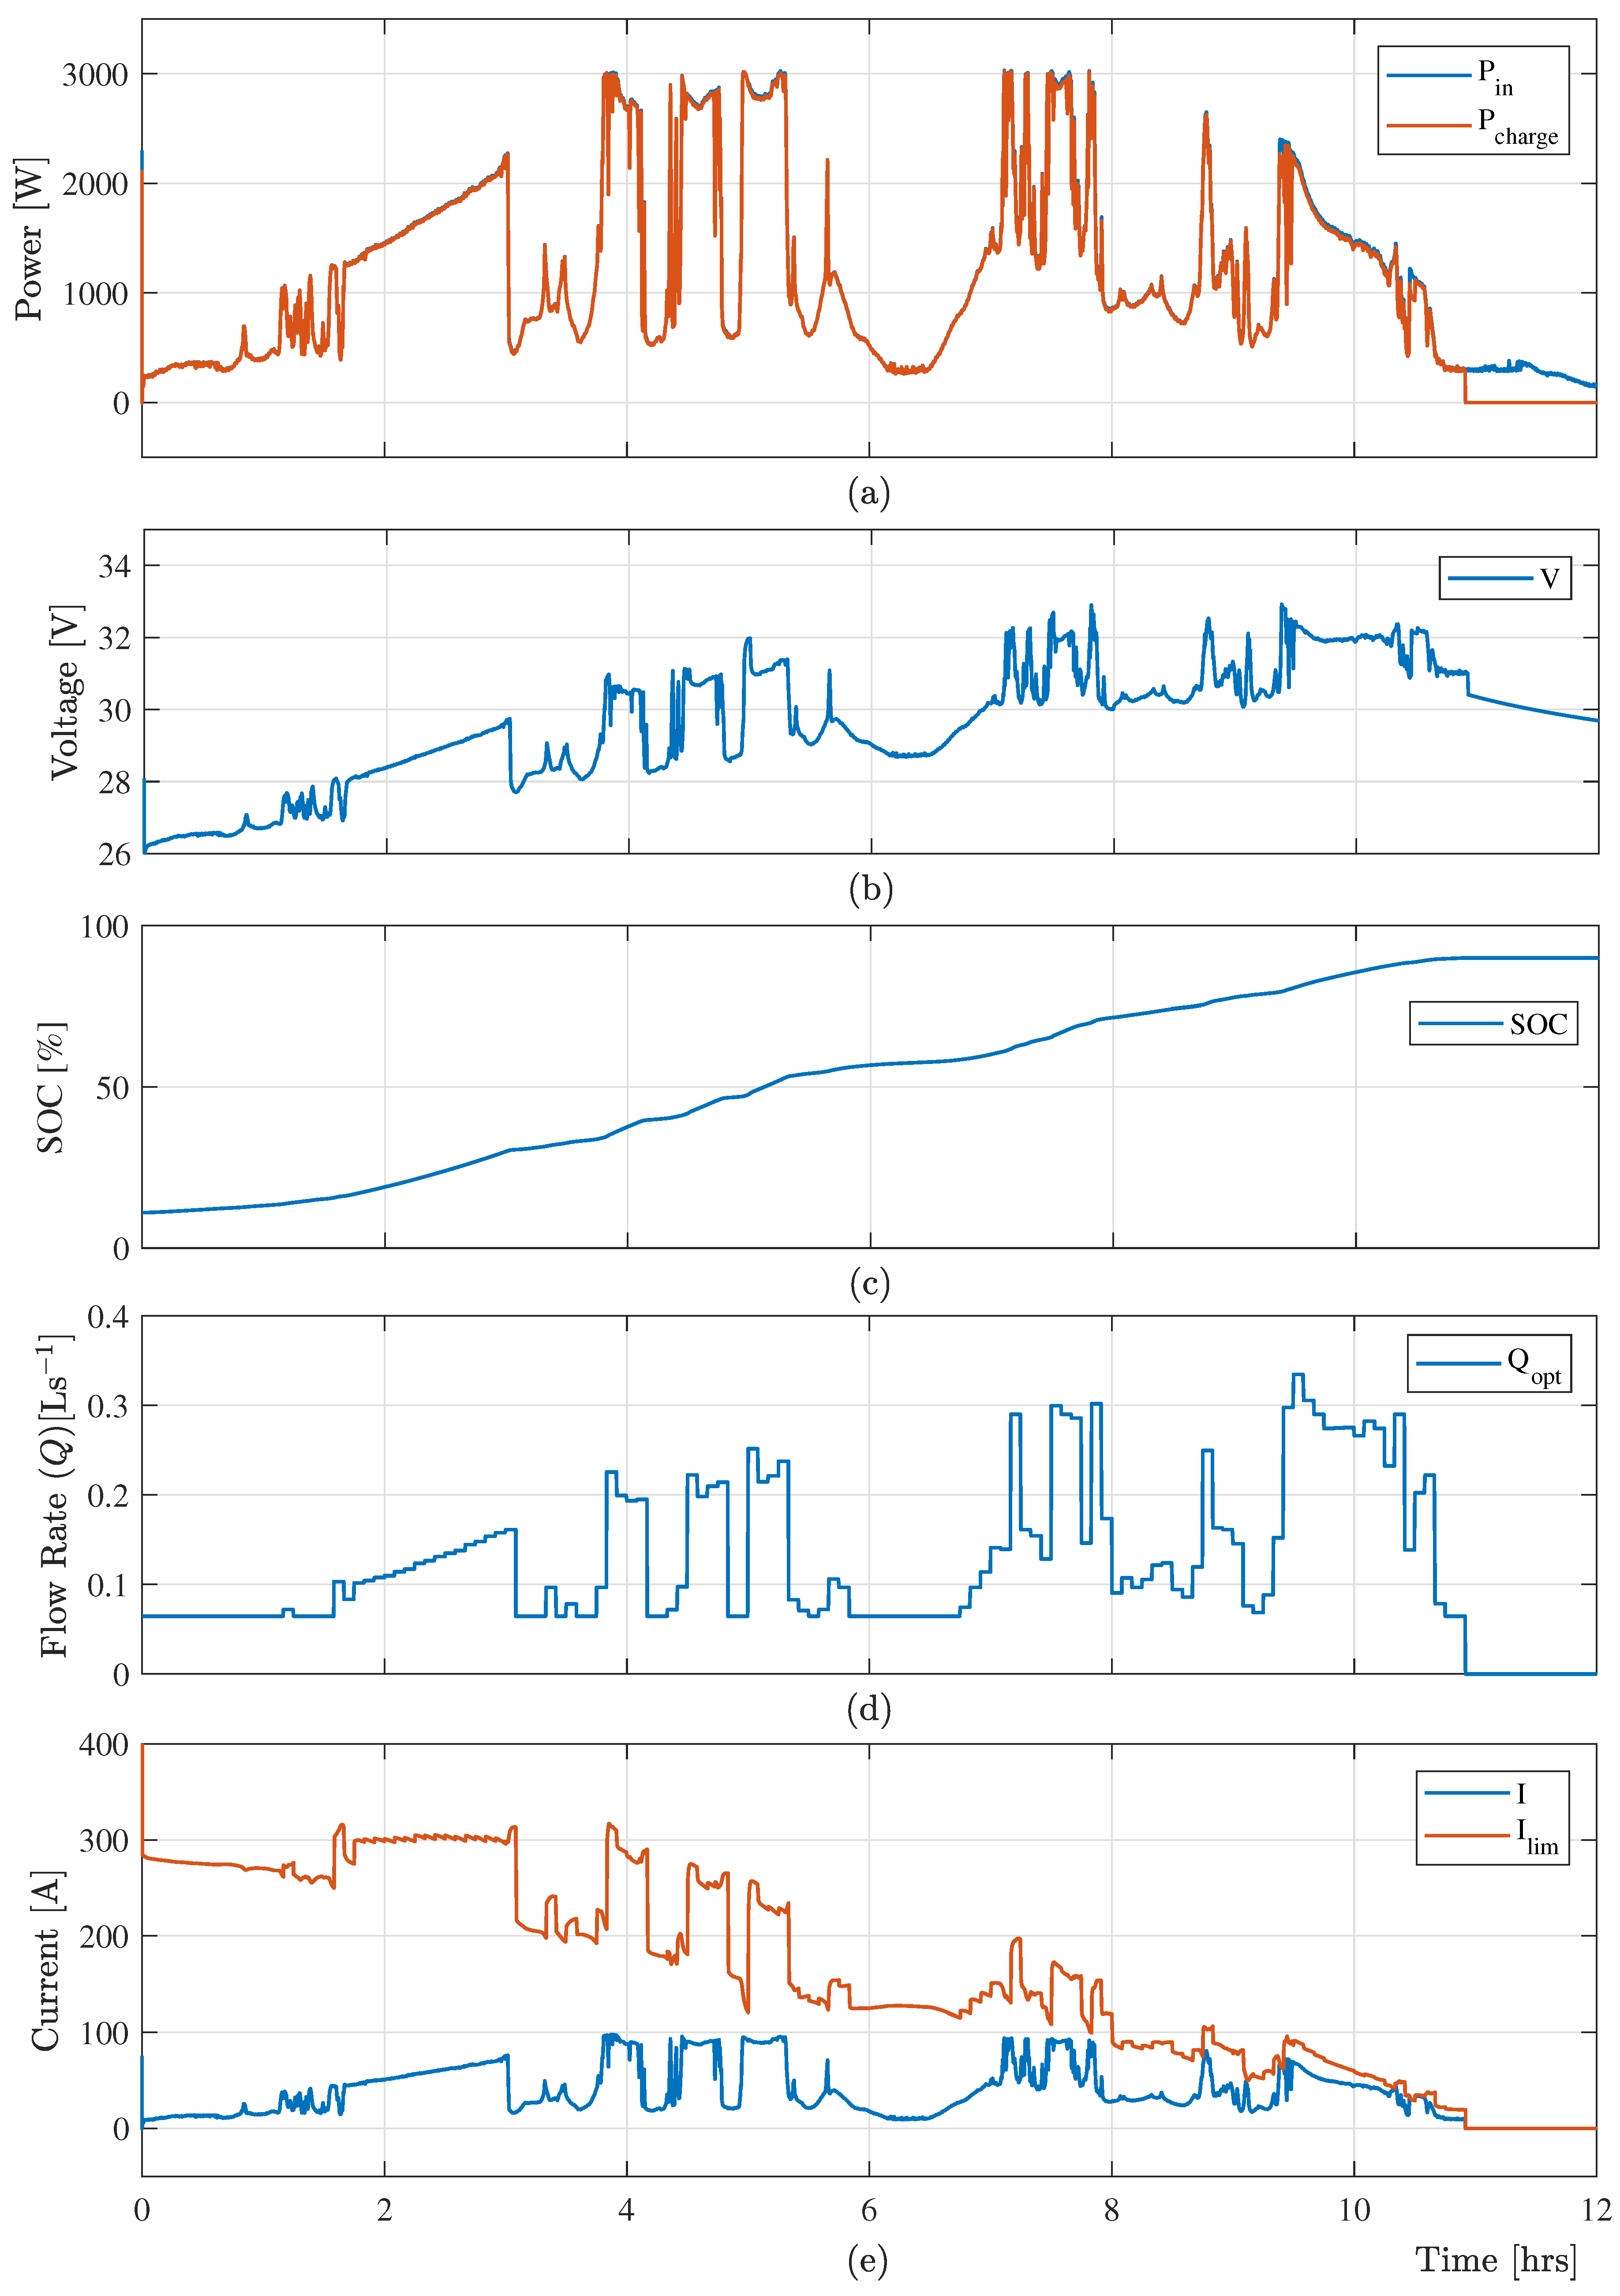
Figure 7.
Simulation results: (a) variable input power from RES and charging power , and (b) measured charging and limiting current with electrolyte flow rate .
Figure 7.
Simulation results: (a) variable input power from RES and charging power , and (b) measured charging and limiting current with electrolyte flow rate .

Figure 8.
Simulation results: (a) variable input power from RES and charging power , and (b) measured charging and limiting current with electrolyte flow rate .
Figure 8.
Simulation results: (a) variable input power from RES and charging power , and (b) measured charging and limiting current with electrolyte flow rate .

Figure 9.
Simulation results of with different electrolyte flow rate.


Table 1.
Simulation Parameters DAB Isolated dc-dc Converter.
| Parameters | Symbols | Values | Units |
|---|---|---|---|
| Rated power | kW | ||
| Equivalent Leakage inductor | L | 300 | H |
| Filter capacitor | C | mF | |
| Transformer turns ratio | N | ||
| Snubber capacitor (IGBT) | 10 | nF | |
| Snubber capacitor (MOSFET) | 141 | nF | |
| Snubber resistor (MOSFET) |
Table 2.
Simulation Parameters of Multi-cell VRB Stack.
| Parameters | Symbols | Values | Units |
|---|---|---|---|
| Rated power | P | kW | |
| Rated capacity | C | 16 | kWh |
| Nominal current density | 80 | mA·cm | |
| Cell number | M | 20 | - |
| Volume of electrolyte in each tank | 200 | L | |
| Length of porous electrode | 40 | cm | |
| Width of porous electrode | cm | ||
| Hight of porous electrode | 25 | cm | |
| Cell internal resistivity | 2 | ·cm | |
| Formal VRB cell potential | V | ||
| No. of transferred electrons | n | 1 | - |
| Temperature | T | K | |
| Faraday constant | F | 96485 | C·mol |
| Gas constant | R | J·mol·K | |
| Surface concentration limit | mol·L | ||
| Diffusion coefficient of across membrane | cm·s | ||
| Diffusion coefficient of across membrane | cm·s | ||
| Diffusion coefficient of across membrane | cm·s | ||
| Diffusion coefficient of across membrane | cm·s | ||
| Maximum flow rate | L·s | ||
| Minimum flow rate | L·s | ||
| Maximum | - | ||
| Minimum | - | ||
| Flow-rate sampling time | 1 | min |
Table 3.
Simulation Parameters of VRB Hydraulic System.
| Parameters | Symbols | Values | Units |
|---|---|---|---|
| Electrolyte density | 1354 | kg·m | |
| Electrolyte viscosity | Pa·s | ||
| Length of main pipes | 300 | cm | |
| Main pipe diameter | 3 | cm | |
| Length of channel | 40 | cm | |
| Channel diameter | cm | ||
| Minor loss factor | - | ||
| Electrode fiber diameter | cm | ||
| Electrode porosity | - | ||
| Kozenu-Carman constant | K | - | |
| Diffusion coefficient of in electrode surface | cm·s | ||
| Diffusion coefficient of in electrode surface | cm·s | ||
| Diffusion coefficient of in electrode surface | cm·s | ||
| Diffusion coefficient of in porous electrode | cm·s | ||
| Scaling factor | k | - |
Table 4.
Percentage of Energy Use with Different Electrolyte Flow Rates.
| Electrolyte Flow Rate | Available Energy | Charging Energy | Pump Energy | Energy Use |
|---|---|---|---|---|
| kWh | kWh | kWh | 96.96% | |
| kWh | kWh | kWh | 94.58% | |
| kWh | kWh | kWh | 84.68% |
© 2019 by the authors. Licensee MDPI, Basel, Switzerland. This article is an open access article distributed under the terms and conditions of the Creative Commons Attribution (CC BY) license (http://creativecommons.org/licenses/by/4.0/).
Share and Cite
MDPI and ACS Style
Akter, M.P.; Li, Y.; Bao, J.; Skyllas-Kazacos, M.; Rahman, M.F. Optimal Charging of Vanadium Redox Flow Battery with Time-Varying Input Power. Batteries 2019, 5, 20. https://doi.org/10.3390/batteries5010020
AMA Style
Akter MP, Li Y, Bao J, Skyllas-Kazacos M, Rahman MF. Optimal Charging of Vanadium Redox Flow Battery with Time-Varying Input Power. Batteries. 2019; 5(1):20. https://doi.org/10.3390/batteries5010020
Chicago/Turabian StyleAkter, Md. Parvez, Yifeng Li, Jie Bao, Maria Skyllas-Kazacos, and Muhammed Fazlur Rahman. 2019. "Optimal Charging of Vanadium Redox Flow Battery with Time-Varying Input Power" Batteries 5, no. 1: 20. https://doi.org/10.3390/batteries5010020
Note that from the first issue of 2016, this journal uses article numbers instead of page numbers. See further details here.