Real-Time Performance Optimization and Diagnostics during Long-Term Operation of a Solid Anolyte Microbial Fuel Cell Biobattery


1
Bioresource Engineering Department, McGill University, 21111 Lakeshore Rd., Ste-Anne-de-Bellevue, QC H9X 3V9, Canada
2
National Research Council of Canada, 6100 Royalmount Ave, Montreal, QC H4P 2R2, Canada
*
Author to whom correspondence should be addressed.
Batteries 2019, 5(1), 9; https://doi.org/10.3390/batteries5010009
Submission received: 15 August 2018
/
Revised: 12 December 2018
/
Accepted: 25 December 2018
/
Published: 15 January 2019
(This article belongs to the Special Issue Bio-Batteries)
Abstract
:This study describes a novel approach for real-time energy harvesting and performance diagnostics of a solid anolyte microbial fuel cell (SA-MFC) representing a prototype smart biobattery. The biobattery power output was maximized in real time by combining intermittent power generation with a Perturbation-and-Observation algorithm for maximum power point tracking. The proposed approach was validated by operating the biobattery under a broad range of environmental conditions affecting power production, such as temperature (4–25 °C), NaCl concentration (up to 2 g L−1), and carbon source concentration. Real-time biobattery performance diagnostics was achieved by estimating key internal parameters (resistance, capacitance, open circuit voltage) using an equivalent electrical circuit model. The real time optimization approach ensured maximum power production during 388 days of biobattery operation under varying environmental conditions, thus confirming the feasibility of biobattery application for powering small electronic devices in field applications.
1. Introduction
Direct production of electricity from renewable biomass in microbial fuel cells (MFCs) has been extensively studied over the last two decades. In an MFC electricity production is driven by electron transfer reactions catalyzed by electrochemically active (anodophilic) bacteria, which utilize anode as a terminal electron acceptor. Detailed description of the working principle and electron transfer mechanisms can be found in literature [1,2]. Most MFC studies are concerned with electricity production from a continuously supplied carbon source, such as wastewater [3,4,5]. MFC operation on a solid source of carbon recently emerged as an approach aimed at developing a long-lasting MFC (biobattery) for powering small electronic devices [6,7,8]. This approach capitalizes on the slow release of soluble organic carbon from solid biodegradable organic materials, which can be placed in the anode compartment to provide constant organic carbon supply to anodophilic bacteria without the need for energy-intensive feed pumps or periodic manual replenishment of the anolyte solution. Carbon sources that have been used in solid anolyte MFCs (SA-MFCs) include soil, marine and freshwater sediments, manure, compost, and synthetic substrates such as agar [6,9,10,11,12]. However, unlike the well-known sediment MFC applications [6,10,13], SA-MFCs have a potential for applications beyond marine or freshwater environments.
Considering long-term autonomous operation as an end-goal, the most feasible biobattery application might be for powering devices with low power requirements, such as environmental sensors for temperature, humidity, and other measurements. MFC application for powering IoT (Internet of Things)—enabled sensors have been recently proposed by Ivars-Barceló, et al. [14]. However, this type of application exposes the biobattery to significant fluctuations in operating conditions (temperature, anolyte salinity, carbon source composition, and availability, etc.), necessitating the optimization of energy harvesting in real time. In addition, changes in electrochemical parameters such as internal resistance, capacitance, and open circuit voltage need to be followed in real time in order to achieve timely diagnosis and troubleshooting of the biobattery performance. Notably, traditional electrochemical characterization methods, such as impedance spectroscopy, cyclic voltammetry, and polarization tests are laborious and require the MFC to be brought off-line, i.e., disconnected from the electrical load for a considerable period of time. A recently proposed approach for real-time MFC performance diagnostics uses a simple equivalent electrical circuit (EEC) model and an on-line parameter estimation procedure [15]. In general, model based approaches offer a reliable and convenient method for MFC electrochemical characterization [15,16], since they are non-disruptive (no need for electrical load disconnection) and may not require specialized equipment such as a potentiostat. The applicability of an EEC model based approach for biobattery performance monitoring and diagnostics has not yet been proven.
This study describes a novel approach for real-time energy harvesting and performance diagnostics of a solid anolyte microbial fuel cell (SA-MFC) representing a prototype smart biobattery. A cuboid-shaped (3D) design of the biobattery is adapted. Such design was used in several previous MFC studies [17,18] to increase electrode (e.g., carbon brush anode) volume. Since performance of a SA-MFC is limited by the slow release of biodegradable organic materials [9], the 3D design can be used to increase the solid anolyte volume. In our study, a 3D biobattery filled with a mix of humus and sawdust is used. After the startup of the biobattery, the impact of environmental factors on the power extraction is investigated. Changes in electrochemical parameters of the biobattery are estimated in real-time during biobattery exposure to changes in temperature, salinity, and organic matter availability. Finally, the biobattery’s long-term performance during 388 days and 123 days tests is evaluated.
2. Materials and Methods
2.1. Biobattery Design, Operation, and Tests
The schematic of a single chamber air-breathing cathode MFC design adopted for the construction of a 3D biobattery is shown in Figure 1A. The design consisted of a cuboid frame with four open sides. On each open side of this cuboid, a cathode-anode assembly measuring 17 cm × 7 cm was placed, while the central chamber was filled with the solid anolyte. Therefore, the biobattery was equipped with four cathodes-anode pairs with the anodes placed inside the 2 L anolyte reservoir in the central chamber. The cathodes contained manganese oxide as the oxygen reducing catalyst (Electric Fuel Ltd., Bet Shemesh, Israel). The anodes were made of two layers of a 0.5 cm thick carbon felt (SGL Canada, Kitchener, ON, Canada) and placed against each cathode, as shown in Figure 1A. The total volume of all anodes was estimated at 476 mL. A 150 mL water reservoir was attached to the top plate of the biobattery to ensure that the anodic compartment is filled with water at all times. A second, single electrode pair flat-plate (2D), biobattery with a total anode volume of 70 mL was built according to the design used in our previous study [9]. The 2D biobattery was equipped with a 50 mL water reservoir. This biobattery was mainly used to investigate the effect of freeze/thaw cycle on electricity production.
The solid anolyte (carbon source) was an equal part mix of humus (soil with decaying detritus) collected at the Morgan Arboretum forest reserve, (McGill Macdonald Campus, QC, Canada) and sawdust from maple wood. After 388 days of operation, the 3D biobattery’s anolyte was replaced and the biobattery was operated for an additional 120 days. For the second test, the solid anolyte composition was enhanced by adding 20 g of gellan gum (Sigma Aldrich, MO, USA) to increase the total biodegradable organic carbon content. The biobatteries were operated at room temperature (22–25 °C) with the exception of the low temperature tests. Water reservoirs were replenished with tap water on a weekly basis. After an initial 9 days of 3D biobattery operation in open circuit mode, each anode-cathode pair was connected to a 1000 Ω resistor for 7 days. Thereafter the electrode pairs were connected in parallel to a capacitor and electricity was harvested using an on/off energy harvesting system described elsewhere [9]. When a pseudo steady-state power generation was achieved, a polarization test was carried out as described in Mehta et al. [19].
The effect of increasing salt concentration was examined by changing the water in the reservoir of the 3D biobattery to solutions containing 1 g L−1, 1.5 g L−1 or 2 g L−1 NaCl. Water was allowed to percolate into the biobattery during a 23 days test. Thereafter, the effect of a temperature decreased from 25 °C to 4 °C was examined by placing the biobattery in a refrigerator and monitoring performance at 12 °C and 4 °C. The effect of freeze/thaw cycle on electricity production (as determined by polarization tests) was investigated by freezing the smaller (2D) biobattery at −30 °C for 5 days and then thawing at room temperature for 24 h. Finally, the effect of organic matter influx into the 3D biobattery was investigated following the temperature test by replacing the water in the reservoir with brewery wastewater (Fleischmann’s Yeast LTD, Calgary, AB, Canada) containing 5 g L−1 total COD of soluble biodegradable organic materials. After completion of the tests, the 3D biobattery was operated until day 388 at room temperature and without carbon source addition.
Throughout all tests, energy harvesting was optimized with the Perturbation and Observation (P/O) algorithm described below. Biobattery (MFC) internal parameters were monitored in real-time using a non-disruptive equivalent electrical circuit (EEC) model parameter estimation procedure [15]. The software for implementing these procedures was written in MATLAB 2017a (Mathworks, Natick, MA, USA). This software was capable of real-time data acquisition and controlling relays for connecting and disconnecting external resistance using a Labjack U3-LV data acquisition board (LabJack Corp., Lakewood, CO, USA). Figure 2 explains the power management algorithm of the biobattery.
2.2. Optimal Energy Harvesting
The energy harvesting method was based on an intermittent connection of the 3D biobattery to a capacitor using the high/low voltage boundary algorithm. A detailed description of the algorithm can be found elsewhere [9]. Briefly, to implement this algorithm the biobattery is connected to a capacitor until the voltage at the capacitor (Vc) exceeds a predefined high voltage threshold (Vhigh). The electrodes are then disconnected from the capacitor and the capacitor is connected to an electrical load (a 1 Ohm resistor was used, i.e., Rload = 1 Ohm) until its voltage drops below a low voltage threshold (Vlow), which is also preset. To maximize energy production, the Vhigh value is dynamically changed using the P/O algorithm, while Vlow is fixed.
In the P/O algorithm, the direction of parameter (Vhigh) change depends on the sign of the gradient, which is determined using the finite difference method by comparing the value of the biobattery power output obtained in a single on/off cycle with the power output obtained in the preceding cycle. If the comparison of the power of two successive cycles shows an increase in power, Vhigh is changed by a predefined small voltage step (ΔV = 0.025V) in the same direction as in the previous step, otherwise Vhigh is changed by the same step in the opposite direction. If k is the iteration number, as k→∞, Vhigh oscillates around an equilibrium value (Vhigh, eq) with an amplitude of ΔV. The method can be expressed as follows
where P is the average MFC power output in a single on/off cycle, and the function returns +1, if the expression f is positive and −1, if f is negative. A more detailed description of the algorithm can be found elsewhere [20].
2.3. Performance Diagnostics
Real-time biobattery state (health) monitoring was achieved using a simple equivalent electrical circuit (EEC) model. A detailed model description can be found elsewhere [15]. In the proposed approach, EEC model parameters such as open circuit voltage (Voc), internal resistances corresponding to ohmic and activation losses (R1 and R2, respectively), and internal capacitance (C), are estimated based on the pulse-width mode of external resistance (Rext) connection at two frequencies [15].
At a high frequency of on/off operation, e.g., 100 Hz, the observed high and low voltages (VH and VL) are used to estimate R1 as
At a low frequency of Rext connection/disconnection (e.g., 0.1 Hz) and a 20% duty cycle, the voltage of the biobattery at the end of the OFF period can be used for VOC estimation. Thereafter, at a duty cycle of 80%, R2 is estimated using the following equation [15]
where VF is the voltage at the end of the ON part of the cycle.
To calculate C, parameter τ (time required to attain 63% of the voltage variation) is estimated by linearizing the exponential voltage change over time when the external resistance is connected (ON period) and calculating the slope. Thereafter, C is estimated using the equation below:
The parameter estimation procedure was carried out every 6 h by intermittently connecting a 48 Ohm external resistor (Rext) to the biobattery. A frequency of 100 Hz and a duty cycle of 50%, was used for R1 estimation. Voc was estimated at a frequency of 0.005 Hz and a duty cycle of 20%. Finally, R2 and C were estimated by connecting Rext at a frequency of 0.05 Hz and a duty cycle of 80%.
2.4. Determination of Solid Anolyte Organic Matter Composition
Solid anolyte composition was assessed at the startup and end (day 388) of the 3D biobattery operation by estimating the high-reactive and less-reactive fractions of the total organic carbon (TOC) using the following method [21]. A solid anolyte sample (500 mg) was hydrolyzed with 20 mL of 5 N H2SO4 for 30 min at 105 °C and the hydrolysate (high-reactive fraction) was recovered by decanting after centrifugation at 10,000× g for 10 min. The residue was then further hydrolyzed overnight in a shaker at room temperature for a total of 15 h with 2 mL of 26 N H2SO4. Thereafter, water was added into the mix to dilute the acid concentration to 2 N and heated for 3 h at 105 °C. The hydrolysate from this step was also recovered with centrifugation and decantation and is referred to as the less-reactive fraction. The TOC in the high-reactive and less-reactive fractions was analyzed using a TOC analyzer (TOC-VCSH, Shimadzu, Japan).
3. Results and Discussion
This chapter describes biobattery start-up and results of real-time power output optimization during biobattery exposure to changes in temperature, salinity and carbon source availability. Also, changes in the biobattery electrochemical parameters are discussed. Finally, results obtained during the long-term biobattery operation are described.
3.1. Biobattery Start-Up
The biobattery operation was initiated in open circuit mode. The open circuit voltage (OCV) of each electrode pair was observed to rapidly increase reaching 450–520 mV after first 9 days of biobattery operation. The mixed microbial community of the solid anolyte composed of humus and saw dust contained a sufficient quantity of anodophilic microorganisms, which colonized the carbon felt electrodes forming an anodophilic biofilm [22]. Biofilm formation at the anode of a microbial fuel cell has been extensively studied [23,24,25] showing progressive development of the anodophilic biofilm. Upon connecting 1000 Ohm resistors to each electrode pair on day 9, an average power output of 0.25 mW was obtained almost instantly (Figure 3). The short startup time can be attributed to a rapid development of the anodophilic biofilm and the associated increase of internal capacitance [15].
All electrode pairs were connected to a single electrical load on day 24 (Figure 3) and the P/O algorithm for maximizing power output by dynamically adjusting the Vhigh (MFC open circuit voltage at which the electrical load is connected) was started. Details of the P/O algorithm are provided in the Materials and Methods section. Essentially, this optimization algorithm matched the external resistance (electrical load) to the internal resistance of the biobattery. It should be mentioned that in order to increase the biobattery current all electrode pairs were connected in parallel to the electrical load, as opposed to connection in series, which can be used to obtain a higher output voltage. Even minor differences in carbon source distribution and availability within the solid anolyte could affect electrochemical characteristics (OCV, internal resistance and capacitance) of each electrode pair. If electrodes are connected in series, these differences could lead to inferior MFC performance due to the internal resistance mismatch, as demonstrated in several studies [26,27,28]. In addition, four circuits for on/off connection of the electrical load would be required. Consequently, parallel, rather than in series electrode connection was chosen for the test.
The 3D biobattery power output observed during the first two days after parallel connection of the electrodes and startup of the P/O algorithm for power output maximization varied between 1.3 mW and 1.5 mW (Figure 3). This is higher than a summation of the power outputs from each electrode pair connected to a fixed 1000 Ohm resistor. This performance improvement was achieved due to real-time Vhigh optimization. Also, a decrease of the internal resistance due to growth of anodophilic microorganisms under optimal operating conditions can be hypothesized [29]. Over time, power output decreases until it reaches 0.51 mW (1.05 mW L−1, where power density is calculated using an anode volume of 476 mL), about 44 days from start-up (Figure 3). This volumetric power density is comparable to an earlier study using the same solid anolyte in an MFC with a 70 mL anode compartment volume. High power output immediately after connection of the electrical load was followed by a decrease in energy production attributable to carbon source–limited conditions due to fast consumption of the available dissolved organic matter and slow hydrolysis of solid organic materials.
3.2. The Impact of Environmental Conditions on Power Production
Practical applications of 3D biobattery for powering environmental sensors could lead to biobattery exposure to various environmental conditions that might affect electricity generation, such as changes in temperature, salt content (salinity) of water in the anode compartment, and organic matter availability. Accordingly, performance of the biobattery equipped with real-time power-output optimizing algorithm was evaluated in a broad range of these environmental conditions. In particular, conductivity and organic matter availability was changed by adding either NaCl or carbon source solutions to the water holding reservoir of the 3D biobattery. Also, temperature was varied by placing the biobattery in a temperature-controlled chamber or freezing a smaller (2D) biobattery, as described in the Materials and Methods section.
Higher conductivity could enhance MFC performance due to reduced ohmic resistance. At the same time, an increase in salt concentration can negatively affect Coulombic efficiency due to the sensitivity of freshwater anodophilic microorganisms to NaCl [30]. Organic matter availability is another important limitation in SA-MFCs, therefore the presence of even relatively low dissolved organic carbon in water is expected to boost power production therefore affecting the optimal operating point. Performance testing under differing environmental conditions was initiated with an increase in anolyte conductivity by adding NaCl to water reservoir of the 3D biobattery. Once NaCl was added, the anolyte conductivity started to increase due to a combination of water percolation and evaporation through cathode walls. Anolyte liquid conductivity measurements obtained by withdrawing liquid sample from the middle section of the biobattery showed an increase from 0.03 mS cm−1 to 0.8 mS cm−1. The increase in conductivity was accompanied by initial increase of power output, followed by a power output decrease to 0.36 mW (Figure 4A). The initial increase in the power output from 0.46 mW to 0.61 mW can be attributed to a decrease in ohmic resistance of the amended anolyte solution. Indeed, laboratory MFCs are typically operated at a conductivity much greater than 1 mS cm−1 [31], therefore at a conductivity of 0.03 mS cm−1, high ohmic losses are expected. As mentioned above, addition of NaCl increases anolyte conductivity, but also could inhibit several microbial trophic groups responsible for organic matter hydrolysis [30]. NaCl toxicity towards hydrolyzing microorganisms could explain the observed decrease in power production in spite of the increased anolyte conductivity during biobattery operation at the highest NaCl concentration. Overall, it is concluded that the biobattery performance can be improved by adding salts and nutrients to dilution water, but the composition of nutrients should be optimized to avoid NaCl-related toxicity.
Temperature is another important factor affecting biobattery performance by influencing microbial growth and metabolic activity as well as the oxygen reduction reaction (ORR) rate of the cathode. Biological activity is often positively correlated with temperature as long as the temperature does not exceed the optimal point [32]. In the experiment aimed at studying the sensitivity of the 3D biobattery to temperature variations, the temperature was decreased from 25 °C to 4 °C in two steps. Accordingly, the biobattery power output decreased from 0.3 mW to 0.01 mW (Figure 4B). Interestingly, a spike in power production (0.59 mW) was noticeable upon return to biobattery operation at 25 °C. Apparently, carbon source hydrolysis continued at low temperatures, while the consumption rate was reduced, thus leading to a power output surge once the temperature was increased. The surplus carbon source was quickly consumed, and power returned to approximately the same value of 0.37 mW.
A biobattery can be deployed in a region with below zero temperatures during winter months. Although biofilms can be adapted to low temperatures, biological activity stops once the biofilm is frozen. The resumption of bioelectrochemical activity once temperature increases (i.e., in the spring) and the effects of solid anolyte freezing on biobattery performance were investigated using a smaller 2D (single electrode pair) biobattery placed in a −30 °C chamber for 5 days and then removed and thawed at room temperature for 24 h. Polarization curves acquired before the test and after thawing were used to evaluate the impact of the freeze-thaw cycle on the biobattery performance. Figure 4C compares polarization curves before freezing and after thawing. The OCV remained nearly unchanged at approximately 352 mV and the maximum power densities were also similar at 1.1 mW L−1. The estimated internal resistance of 294 Ω before freezing increased slightly to 315 Ω after thawing. Overall, the ability of the biobattery (SA-MFC) to resume performance within short time after freezing shows its resilience and suitability for field applications in temperate regions.
Another important factor in determining MFC performance is organic matter availability. Power production in an MFC was observed to follow a Monod-type dependence on carbon source concentration [33]. In a solid anolyte MFC dissolved organic matter is produced through hydrolysis of solids, which is a rate-limiting step. A substantial increase in power when there is an influx of organic matter is therefore expected. To test the impact of carbon source availability on the biobattery performance, the water reservoir was filled with diluted brewery wastewater. As the carbon source percolation from the reservoir (with subsequent concentrations of 0.2 g L−1, 1 g L−1 and 5 g L−1 of brewery wastewater) began to increase organic matter availability in the biobattery, the power output increased from an average of 0.23 mW to 0.90 mW. (Figure 4D). This test proved carbon source availability as one of the most limiting factors determining MFC power output.
Overall, the tests showed that power production in the 3D biobattery is strongly influenced by the environmental conditions and is expected to significantly vary over time. To maximize power output, the biobattery was operated with periodic connection of the electrical load with real time optimization of Vhigh (MFC OCV voltage at which the electrical load is reconnected). This approach proved to provide stable biobattery performance at all tested conditions, including biobattery exposure to low temperatures and carbon source availability fluctuations.
3.3. Real Time Biobattery Performance Diagnostics
In addition to enabling optimal performance of the biobattery under changing environmental conditions, periodic connection of the external resistor at an optimal value of Vhigh (on/off mode of operation) also facilitated real time estimation of key internal parameters, such as open circuit voltage (OCV), resistance, and capacitance. Such real-time internal parameters monitoring allowed for constant performance diagnostics. The approach was implemented using the electrical equivalent circuit (EEC) model [15]. Throughout all tests, the parameter estimation procedure described in Materials and Methods was carried out at six-hour intervals.
Overall, real-time monitoring of internal parameters provided timely detection of all external disturbances. For example, the change in anolyte conductivity due to the addition of NaCl was observed as a reduction of ohmic resistance (R1) from 8.68 to 6.65 Ohm, as can be seen from the on-line monitoring results shown in Figure 5A. In addition, the R2 component of the internal resistance, which can be related to activation and concentration losses, decreased from 36.5 to 28.2 Ohm, suggesting enhanced electron transfer to carbon felt anodes. (Figure 5B). However, the OCV and the internal capacitance, which could be related to the activity of the anodophilic microorganisms [15] were reduced (Figure 5C). Average OCV decreased from 396 mV to 369 mV, while internal capacitance estimation decreased from 5.1 F to 3.0 F, indicating that the anodophilic microorganisms were inhibited at the increased concentration of NaCl. Although anodophilic bacteria, such as Geobacter spp., may withstand NaCl content up to 10 g L−1 under carbon source replete conditions [30], soil microorganisms can be stressed by increased salinity [34]. Since these soil microorganisms are likely responsible for organic matter hydrolysis in the solid anolyte MFC, a higher NaCl content (salinity) could lead to decreased power production. Importantly, the salt content of water in the anode compartment of a biobattery could vary significantly during field applications. The real-time performance diagnostics enables timely detection of increasing salt content before the onset of microbial activity inhibition.
Temperature variation is another example of external disturbance significantly affecting biobattery performance. The effect of 3D biobattery exposure to progressively lower temperatures (from 25 °C to 4 °C) on the estimated internal parameters can be seen in Figure 5D. The temperature decrease is reflected by the initial increase of R1 from 7.0 to 105.0 Ohm, apparently due to a lower microbial activity. On the other hand, average R2 reduced from 28.2 to 9.8 Ohm. As discussed previously, it can be hypothesized that organic matter degradation continued at low temperatures, while the consumption rate decreased, thus somewhat increasing the availability as the temperature dropped (Figure 5E). Nevertheless, a general increase in the total internal resistance (Rint = R1 + R2) of the biobattery due to the dominance of ohmic losses led to a significantly lower power output. It should be mentioned that a prolonged exposure of mixed microbial populations of the biobattery to low temperatures could result in microbial community adaptation to psychrophilic conditions [25], and improved power output with time. By using real-time parameter monitoring, such adaptation to low temperatures could be clearly observed. In fact, the observed increase in the biobattery capacitance from 3 F to 20.6 F over the duration of this experiment could be attributed to increased biofilm thickness. However, the increased capacitance did not lead to higher power production, perhaps due to high ohmic losses. Also, low temperature led to a decline in the OCV from 367 mV to 145 mV (Figure 5F). Increasing the temperature from 4 °C to 25 °C decreased the internal resistance from 114.92 to 76 Ohm, reduced capacitance to 9.2 F and increased OCV to 285 mV. When the temperature was returned to 25 °C, R2 resistance was only slightly higher than before the low temperature test.
Brewery wastewater is rich in organic matter and high in conductivity, factors which can improve MFC performance [3]. As expected, signs of improved performance included reduction of R1 from 12.7 to 8.2 Ohm (Figure 5G,H). Improved organic matter availability is expected to increase anodophilic microbial populations and, by extension, power production. Indeed, internal capacitance increased (from 17.1 to 32.1 F) as did OCV (from 235 mV to 343 mV, Figure 5I). It should be noted that increased growth of microbial populations (increased biofilm thickness) may cause an accumulation of extracellular polymeric substances (EPS) within the solid anolyte matrix of the biobattery [35], thereby reducing transport of water and ions in the solid anolyte. The reduced species transport could also affect the rate of hydrolysis, and low pH zones might be created [36]. This could explain why the average R2, which can be associated with diffusion limitations, increased from 60.0 to 82.7 Ohm towards the end of the experiment and power production declined.
Importantly, the real-time biobattery performance diagnostics successfully detected all external disturbances. When initial operating conditions were restored (e.g., in the temperature test), internal biobattery parameters also returned to initially estimated values. Analysis of the estimated internal parameters confirmed the importance of real-time monitoring, which enabled timely diagnostics of key performance issues, such as increasing salinity, changes in carbon source composition, and the related changes in internal resistance and capacitance. For example, a sharp drop in internal capacitance is indicative of biofilm deterioration, while an increase in internal resistance is indicative of carbon source limitation (solid anolyte deterioration) [37]. However, care must be taken to consider multiple factors, such as simultaneous temperature and salinity fluctuations in the macro environment of the biobattery. In addition, this information can be used to schedule biobattery maintenance (e.g., cleaning or replacing the electrodes and solid anolyte).
3.4. Long-Term Biobattery Operation
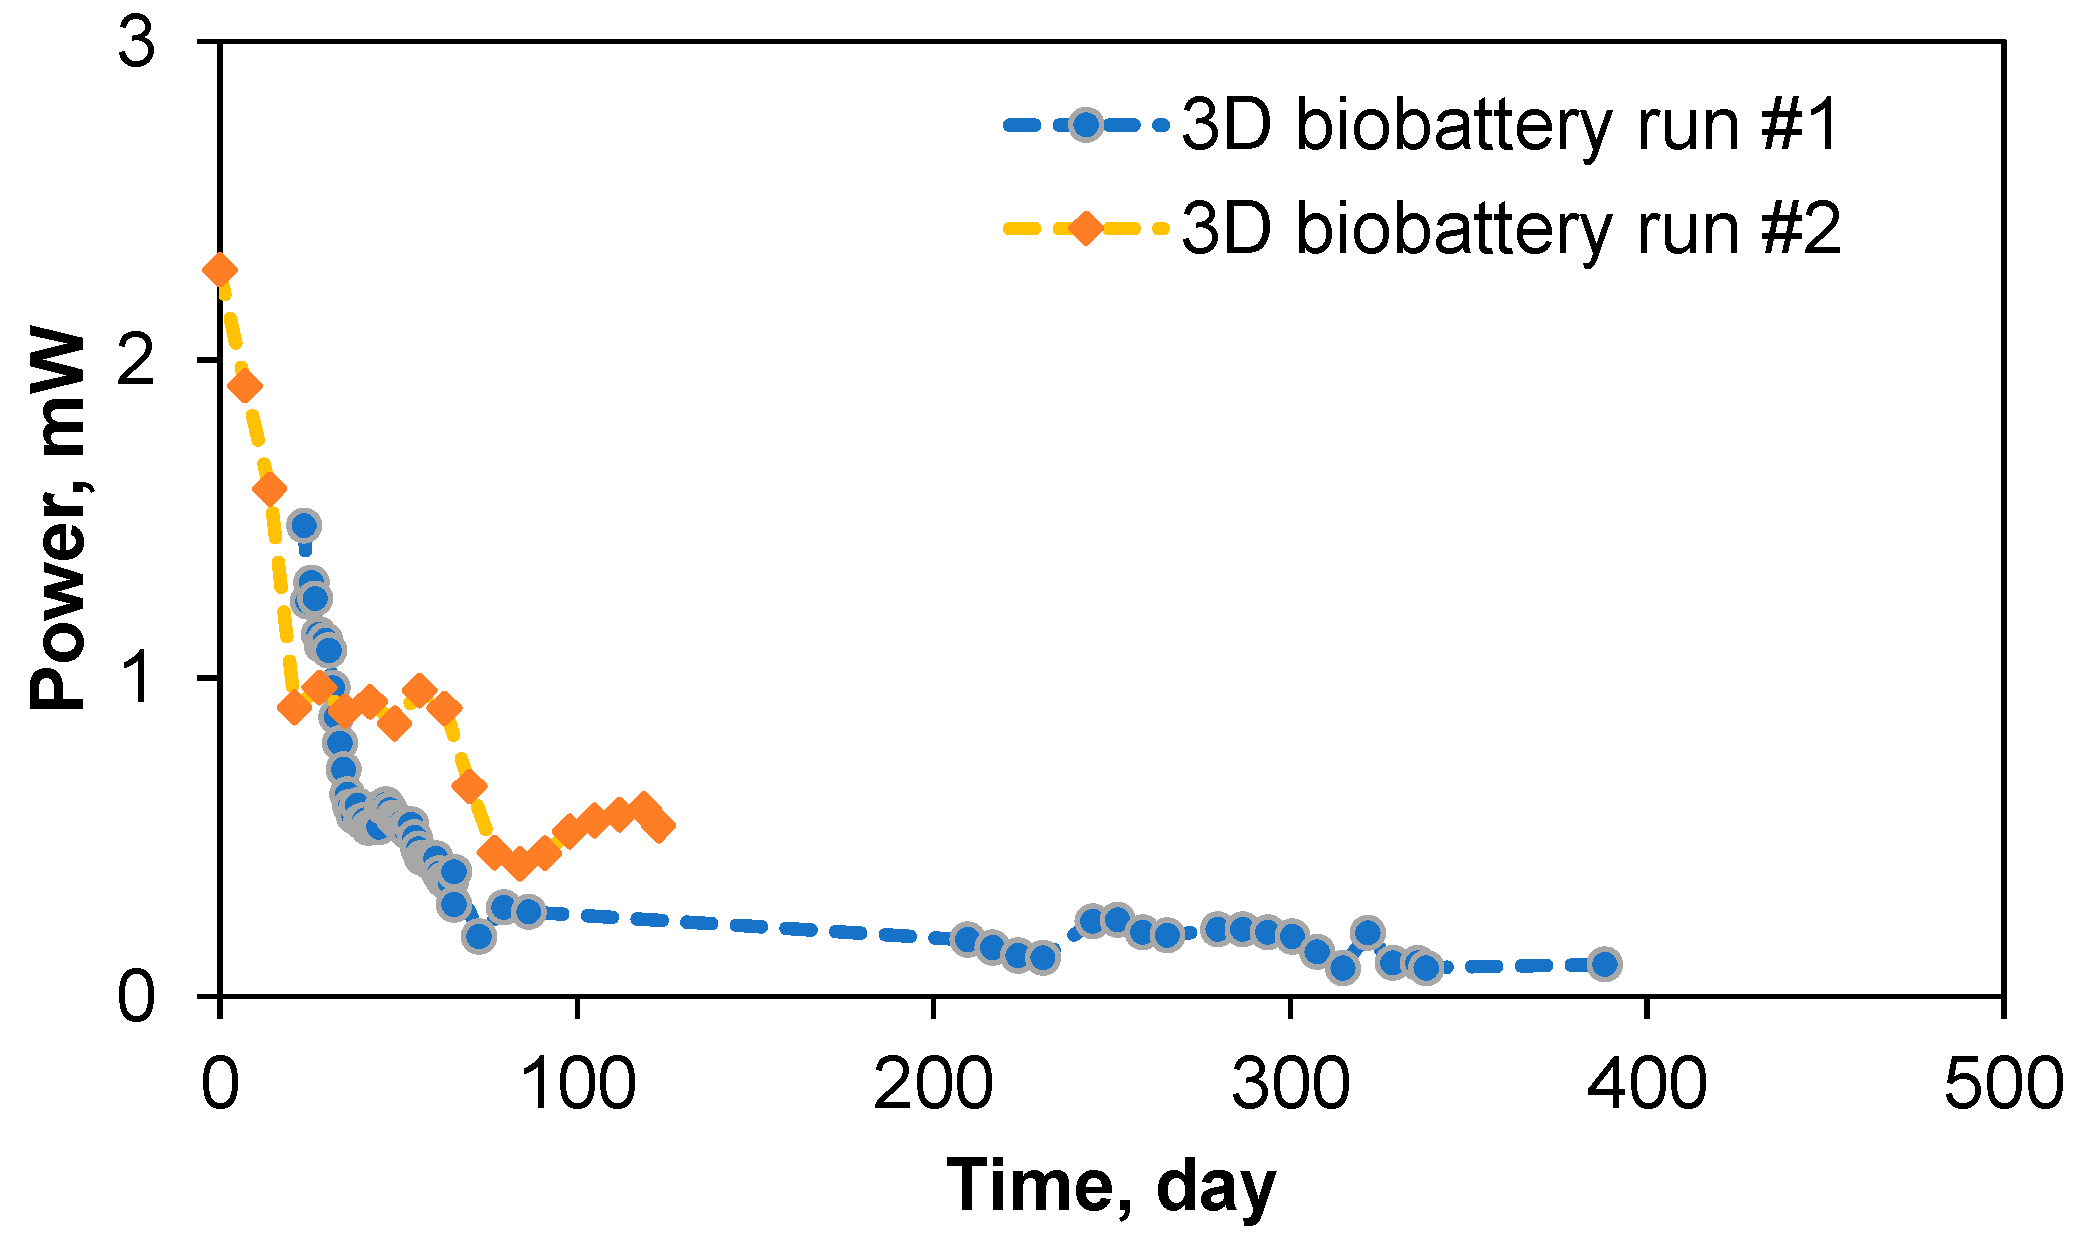
After the completion of experiments aimed at studying the 3D biobattery response to various external perturbations, the biobattery operation was continued for a total of 388 days (run 1) as shown in Figure 6. Data points corresponding to biobattery operation at different temperatures, NaCl concentration, and carbon source addition were excluded in this graph. As can be seen from this plot, the power output decreased with time, and was around 0.1 mW after 388 days of operation. Thereafter, the solid anolyte was replaced and the biobattery was operated for another 123 days (run 2). The power output profiles in both runs were similar, reflecting progressive depletion of the solid carbon source (fuel) in the biobattery.
As suggested by Westrich et al. [38], solid anolyte organic matter can be considered to include a high-reactive fraction and a less-reactive fraction. Power production can thus be expected to be high in the first few months of operation due to a relatively fast hydrolysis of the high-reactive fraction. Once the less-reactive fraction is dominant, power production is expected to decrease. It can be suggested that it is the slow hydrolysis of the less-reactive fraction of organic matter that enables the biobattery to generate power for an extended period of time. Eventually, the less-reactive fraction will also be depleted, at which point the biobattery needs to be “recharged” by replenishing the solid anolyte.
Analytical determination of the reactive fractions of the solid anolyte in the first run showed that it contained 0.37 g g−1 of high-reactive fraction and 0.25 g g−1 of the less-reactive fraction. During the long-term operation of the biobattery shown in Figure 6, power production exponentially decreases in the first 1–2 months of operation and it can be hypothesized that the high-reactive fraction of the solid anolyte was degraded in this period. The initial high power output (up to 1.6 mW) can thus be attributed to readily degradable dissolved organic matter, such as volatile fatty acids, from the high-reactive fraction. Thereafter, power production decreased at a slower rate, apparently corresponding to the much slower degradation of the less-reactive fraction. Once the biobattery was “recharged” and Run #2 started, the power output profile was reproduced (Figure 6). Notably, the slightly higher power during Run #2 was due to the addition of 20 g of gellan gum (a polysaccharide) to the solid anolyte mix.
4. Conclusions
This study demonstrated continuous electricity production in a biobattery (solid anolyte MFC) operated for over a year on a mix of humus and sawdust. Throughout the experiment, the biobattery was exposed to significant external perturbations, including changes in anolyte salinity, dissolved organic carbon concentration, and temperature. Stable power output was provided by the real-time optimization algorithm with on/off mode of operation and optimal estimation of Vmax (reconnection voltage). It can be hypothesized that real time performance optimization facilitated the proliferation of electroactive microorganisms at the anode, thus increasing the fraction of organic materials consumed by the electroactive microorganisms and decreasing carbon source consumption by other anaerobic populations, such as the methanogens. Furthermore, the software developed for biobattery operation included real time performance diagnostics based on a simple EEC model. The proposed “smart biobattery” approach for non-invasive real-time estimation of key electrochemical parameters successfully detected all changes in environmental conditions. Laboratory tests confirmed stable long-term power production and demonstrated the resilience of the biobattery to harsh environmental conditions, including freeze-thaw cycles.
It should be noted that the power management system used in this study needs to be improved, considering that a personal computer and a Matlab-based software result in high energy consumption. Therefore, an important future work being planned is the development of a high efficiency power management system based on a microcontroller with ultra-low energy consumption. Overall, this study is a step forward in the practical deployment of microbial fuel cell technology as an electricity source for powering environmental sensors and other electronic devices in remote locations.
Author Contributions
The authors equally contributed to this study.
Funding
This research received no external funding.
Conflicts of Interest
The authors declare no conflict of interest.
References
- Du, Z.; Li, H.; Gu, T. A state of the art review on microbial fuel cells: A promising technology for wastewater treatment and bioenergy. Biotechnol. Adv. 2007, 25, 464–482. [Google Scholar] [CrossRef] [PubMed]
- Rabaey, K.V.W. Microbial fuel cells: Novel biotechnology for energy generation. Trends Biotechnol. 2005, 23, 291–298. [Google Scholar] [CrossRef] [PubMed]
- Feng, Y.; Wang, X.; Logan, B.E.; Lee, H. Brewery wastewater treatment using air-cathode microbial fuel cells. Appl. Microbiol. Biotechnol. 2008, 78, 873–880. [Google Scholar] [CrossRef] [PubMed]
- Liu, H.; Ramnarayanan, R.; Logan, B.E. Production of electricity during wastewater treatment using a single chamber microbial fuel cell. Environ. Sci. Technol. 2004, 38, 2281–2285. [Google Scholar] [CrossRef] [PubMed]
- Min, B.; Kim, J.; Oh, S.; Regan, J.M.; Logan, B.E. Electricity generation from swine wastewater using microbial fuel cells. Water Res. 2005, 39, 4961–4968. [Google Scholar] [CrossRef] [PubMed]
- Donovan, C.; Dewan, A.; Heo, D.; Beyenal, H. Batteryless, Wireless Sensor Powered by a Sediment Microbial Fuel Cell. Environ. Sci. Technol. 2008, 42, 8591–8596. [Google Scholar] [CrossRef]
- Pietrelli, A.; Micangeli, A.; Ferrara, V.; Raffi, A. Wireless sensor network powered by a terrestrial microbial fuel cell as a sustainable land monitoring energy system. Sustainability 2014, 6, 7263–7275. [Google Scholar] [CrossRef]
- Shantaram, A.; Beyenal, H.; Veluchamy, R.R.A.; Lewandowski, Z. Wireless sensors powered by microbial fuel cells. Environ. Sci. Technol. 2005, 39, 5037–5042. [Google Scholar] [CrossRef]
- Adekunle, A.; Raghavan, V.; Tartakovsky, B. Carbon source and energy harvesting optimization in solid anolyte microbial fuel cells. J. Power Sources 2017, 356, 324–330. [Google Scholar] [CrossRef]
- Thomas, Y.R.J.; Picot, M.; Carer, A.; Berder, O.; Sentieys, O.; Barrière, F. A single sediment-microbial fuel cell powering a wireless telecommunication system. J. Power Sources 2013, 241, 703–708. [Google Scholar] [CrossRef] [Green Version]
- Tommasi, T.; Salvador, G.P.; Quaglio, M. New insights in Microbial Fuel Cells: Novel solid phase anolyte. Sci. Rep. 2016, 6, 290–291. [Google Scholar] [CrossRef] [PubMed]
- Zhang, G.; Zhao, Q.; Jiao, Y.; Lee, D.-J. Long-term operation of manure-microbial fuel cell. Bioresour. Technol. 2015, 180, 365–369. [Google Scholar] [CrossRef] [PubMed]
- Reimers, C.E.; Tender, L.M.; Fertig, S.; Wang, W. Harvesting Energy from the Marine Sediment−Water Interface. Environ. Sci. Technol. 2001, 35, 192–195. [Google Scholar] [CrossRef] [PubMed]
- Ivars-Barceló, F.; Zuliani, A.; Fallah, M.; Mashkour, M.; Rahimnejad, M.; Luque, R. Novel Applications of Microbial Fuel Cells in Sensors and Biosensors. Appl. Sci. 2018, 8, 1184. [Google Scholar] [CrossRef]
- Coronado, J.; Tartakovsky, B.; Perrier, M. On-line monitoring of microbial fuel cells operated with pulse-width modulated electrical load. J. Process Control 2015, 35, 59–64. [Google Scholar] [CrossRef]
- Lin, H.; Wu, S.X.; Zhu, J. Modeling Power Generation and Energy Efficiencies in Air-Cathode Microbial Fuel Cells Based on Freter Equations. Appl. Sci. 2018, 8, 1983. [Google Scholar] [CrossRef]
- Lefebvre, O.; Tang, Z.; Fung, M.P.; Chua, D.H.; Chang, I.S.; Ng, H.Y. Electrical performance of low cost cathodes prepared by plasma sputtering deposition in microbial fuel cells. Biosens. Bioelectron. 2012, 31, 164–169. [Google Scholar] [CrossRef]
- Logan, B.; Cheng, S.; Watson, V.; Estadt, G. Graphite Fiber Brush Anodes for Increased Power Production in Air-Cathode Microbial Fuel Cells. Environ. Sci. Technol. 2007, 41, 3341–3346. [Google Scholar] [CrossRef]
- Mehta, P.; Hussain, A.; Tartakovsky, B.; Neburchilov, V.; Raghavan, V.; Wang, H.; Guiot, S.R. Electricity generation from carbon monoxide in a single chamber microbial fuel cell. Enzyme Microb. Technol. 2010, 46, 450–455. [Google Scholar] [CrossRef] [Green Version]
- Woodward, L.; Perrier, M.; Srinivasan, B.; Pinto, R.; Tartakovsky, B. Comparison of real-time methods for maximizing power output in microbial fuel cells. AIChE J. 2010, 56, 2742–2750. [Google Scholar] [CrossRef] [Green Version]
- Rovira, P.; Vallejo, V.R. Labile and recalcitrant pools of carbon and nitrogen in organic matter decomposing at different depths in soil: An acid hydrolysis approach. Geoderma 2002, 107, 109–141. [Google Scholar] [CrossRef]
- Chaudhuri, S.K.; Lovley, D.R. Electricity generation by direct oxidation of glucose in mediatorless microbial fuel cells. Nat. Biotechnol. 2003, 21, 1229–1232. [Google Scholar] [CrossRef] [PubMed]
- Zhang, L.; Zhu, X.; Li, J.; Liao, Q.; Ye, D. Biofilm formation and electricity generation of a microbial fuel cell started up under different external resistances. J. Power Sources 2011, 196, 6029–6035. [Google Scholar] [CrossRef]
- Kiely, P.D.; Call, D.F.; Yates, M.D.; Regan, J.M.; Logan, B.E. Anodic biofilms in microbial fuel cells harbor low numbers of higher-power-producing bacteria than abundant genera. Appl. Microbiol. Biotechnol. 2010, 88, 371–380. [Google Scholar] [CrossRef] [PubMed]
- Patil, S.A.; Harnisch, F.; Kapadnis, B.; Schröder, U. Electroactive mixed culture biofilms in microbial bioelectrochemical systems: The role of temperature for biofilm formation and performance. Biosens. Bioelectron. 2010, 26, 803–808. [Google Scholar] [CrossRef]
- Kim, Y.; Hatzell, M.C.; Hutchinson, A.J.; Logan, B.E. Capturing power at higher voltages from arrays of microbial fuel cells without voltage reversal. Energy Environ. Sci. 2011, 4, 4662–4667. [Google Scholar] [CrossRef]
- Wang, B.; Han, J.-I. A single chamber stackable microbial fuel cell with air cathode. Biotechnol. Lett. 2009, 31, 387–393. [Google Scholar] [CrossRef] [PubMed]
- Zhuang, L.; Zheng, Y.; Zhou, S.; Yuan, Y.; Yuan, H.; Chen, Y. Scalable microbial fuel cell (MFC) stack for continuous real wastewater treatment. Bioresour. Technol. 2012, 106, 82–88. [Google Scholar] [CrossRef] [PubMed]
- Coronado, J.; Perrier, M.; Tartakovsky, B. Pulse-width modulated external resistance increases the microbial fuel cell power output. Bioresour. Technol. 2013, 147, 65–70. [Google Scholar] [CrossRef] [PubMed] [Green Version]
- Lefebvre, O.; Tan, Z.; Kharkwal, S.; Ng, H.Y. Effect of increasing anodic NaCl concentration on microbial fuel cell performance. Bioresour. Technol. 2012, 112, 336–340. [Google Scholar] [CrossRef] [PubMed]
- Pant, D.; Van Bogaert, G.; Diels, L.; Vanbroekhoven, K. A review of the substrates used in microbial fuel cells (MFCs) for sustainable energy production. Bioresour. Technol. 2010, 101, 1533–1543. [Google Scholar] [CrossRef] [PubMed]
- Liu, H.; Cheng, S.; Logan, B.E. Power Generation in Fed-Batch Microbial Fuel Cells as a Function of Ionic Strength, Temperature, and Reactor Configuration. Environ. Sci. Technol. 2005, 39, 5488–5493. [Google Scholar] [CrossRef] [PubMed]
- Min, B.; Logan, B.E. Continuous electricity generation from domestic wastewater and organic substrates in a flat plate microbial fuel cell. Environ. Sci. Technol. 2004, 38, 5809–5814. [Google Scholar] [CrossRef] [PubMed]
- Sardinha, M.; Müller, T.; Schmeisky, H.; Joergensen, R.G. Microbial performance in soils along a salinity gradient under acidic conditions. Appl. Soil Ecol. 2003, 23, 237–244. [Google Scholar] [CrossRef]
- Allison, L.E. Effect of microorganisms on permeability of soil under prolonged submergence. Soil Sci. 1947, 63, 439–450. [Google Scholar] [CrossRef]
- Rozendal, R.; Hamelers, H.; Buisman, C. Effects of membrane cation transport on pH and microbial fuel cell performance. Environ. Sci. Technol. 2006, 40, 5206–5211. [Google Scholar] [CrossRef] [PubMed]
- Martin, E.; Savadogo, O.; Guiot, S.R.; Tartakovsky, B. Electrochemical characterization of anodic biofilm development in a microbial fuel cell. Appl. Electrochem. 2013, 43, 533–540. [Google Scholar] [CrossRef]
- Westrich, J.T.; Berner, R.A. The role of sedimentary organic matter in bacterial sulfate reduction: The G model tested. Limnol. Oceanogr. 1984, 29, 236–249. [Google Scholar] [CrossRef] [Green Version]
Figure 1.
(A) Schematic diagram of a SA-MFC biobattery; (B) pictures of the assembled setup.

Figure 2.
Flowchart of the power management algorithm of the biobattery.

Figure 3.
Power production by the biobattery. Between days 9–24 each anode-cathode pair was connected to a 1000 Ohm external resistance. From day 24 onward all anode-cathode pairs were connected in parallel and power production was optimized with the P/O algorithm.
Figure 3.
Power production by the biobattery. Between days 9–24 each anode-cathode pair was connected to a 1000 Ohm external resistance. From day 24 onward all anode-cathode pairs were connected in parallel and power production was optimized with the P/O algorithm.

Figure 4.
Effect of operational conditions on biobattery performance. (A) Increase in anodic liquid salt concentration (3D biobattery), (B) Temperature variations (3D biobattery), (C) Polarization curves of a 2D biobattery before a freeze test (−30 °C) and after thawing. (D) Variations in soluble carbon source concentration in the water storage reservoir (3D biobattery).

Figure 5.
Results of real-time monitoring of 3D biobattery internal parameters. (A) Changes in salt content of anodic liquid and (B,C) resulting changes in internal resistance, capacitance, and OCV; (D) Temperature changes and (E,F) resulting changes in internal resistance, capacitance, and OCV; (G) Changes of soluble COD concentration and (H,I) resulting changes in internal resistance, capacitance, and OCV. Between days 6.2–7.3 of the temperature test the biobattery was accidentally frozen (no measurements).

Figure 6.
Experimentally measured power outputs of the biobattery for 388 days (run #1) and 123 days (run #2). Power outputs during temperature, salinity, and carbon source tests (day 100–210) are excluded for run #1.
Figure 6.
Experimentally measured power outputs of the biobattery for 388 days (run #1) and 123 days (run #2). Power outputs during temperature, salinity, and carbon source tests (day 100–210) are excluded for run #1.

© 2019 by the authors. Licensee MDPI, Basel, Switzerland. This article is an open access article distributed under the terms and conditions of the Creative Commons Attribution (CC BY) license (http://creativecommons.org/licenses/by/4.0/).
Share and Cite
MDPI and ACS Style
Adekunle, A.; Raghavan, V.; Tartakovsky, B. Real-Time Performance Optimization and Diagnostics during Long-Term Operation of a Solid Anolyte Microbial Fuel Cell Biobattery. Batteries 2019, 5, 9. https://doi.org/10.3390/batteries5010009
AMA Style
Adekunle A, Raghavan V, Tartakovsky B. Real-Time Performance Optimization and Diagnostics during Long-Term Operation of a Solid Anolyte Microbial Fuel Cell Biobattery. Batteries. 2019; 5(1):9. https://doi.org/10.3390/batteries5010009
Chicago/Turabian StyleAdekunle, Ademola, Vijaya Raghavan, and Boris Tartakovsky. 2019. "Real-Time Performance Optimization and Diagnostics during Long-Term Operation of a Solid Anolyte Microbial Fuel Cell Biobattery" Batteries 5, no. 1: 9. https://doi.org/10.3390/batteries5010009
Note that from the first issue of 2016, this journal uses article numbers instead of page numbers. See further details here.