Synthetic vs. Real Driving Cycles: A Comparison of Electric Vehicle Battery Degradation


Hawai’i Natural Energy Institute, SOEST, University of Hawai’i at Mānoa, 1680 East-West Road, POST 109, Honolulu, HI 96822, USA
*
Author to whom correspondence should be addressed.
Batteries 2019, 5(2), 42; https://doi.org/10.3390/batteries5020042
Submission received: 4 April 2019
/
Revised: 17 April 2019
/
Accepted: 19 April 2019
/
Published: 1 May 2019
(This article belongs to the Special Issue Batteries and Supercapacitors Aging)
Abstract
:Automobile dependency and the inexorable proliferation of electric vehicles (EVs) compels accurate predictions of cycle life across multiple usage conditions and for multiple lithium-ion battery systems. Synthetic driving cycles have been essential in accumulating data on EV battery lifetimes. However, since battery deterioration is path-dependent, the representability of synthetic cycles must be questioned. Hence, this work compared three different synthetic driving cycles to real driving data in terms of mimicking actual EV battery degradation. It was found that the average current and charge capacity during discharge were important parameters in determining the appropriate synthetic profile, and traffic conditions have a significant impact on cell lifetimes. In addition, a stage of accelerated capacity fade was observed and shown to be induced by an increased loss of lithium inventory (LLI) resulting from irreversible Li plating. New metrics, the ratio of the loss of active material at the negative electrode (LAMNE) to the LLI and the plating threshold, were proposed as possible predictors for a stage of accelerated degradation. The results presented here demonstrated tracking properties, such as capacity loss and resistance increase, were insufficient in predicting cell lifetimes, supporting the adoption of metrics based on the analysis of degradation modes.
1. Introduction
Because of its isolation, Hawai’i has been on the forefront of the sustainable energy movement, as evidenced by the Hawai’i Clean Energy Initiative, which endeavors to have 100% clean energy both on the grid and in all ground transportation by 2045. Reaching that goal will involve more renewable energy sources being incorporated into the grid and more electric vehicles (EVs) on the roads. Success will hinge on the integration and the combination of these technologies. What gets lost is how this integration, combination, and escalation in use will affect the durability of lithium-ion batteries that are essential to the efficacy of both.
What is more, battery degradation is path-dependent [1]. Different driving, storage, and charging conditions can all lead the battery down different paths of degradation. Hence, while testing for the effect of the evolving usage of EV batteries, it is crucial to evaluate correctly the impact of driving and not to just base prognoses on capacity loss or resistance increase. Several synthetic driving profiles were proposed in the literature to determine the range and durability of EV batteries, but a comparison with the real degradation upon driving was, to the best of our knowledge, never reported. Knowing the path dependency of degradation, it is essential to determine how well these profiles simulate typical real-world driving behavior.
The most common driving profiles are tested in this work: the Federal Urban Driving Schedule (FUDS), which a US standard, the dynamic stress test (DST), which is a simplified version of the FUDS cycle [2], and the New European Driving Cycle (NEDC), which is a European standard. Using properties such as capacity fade at C/35 as metrics, the measurements from these profiles are compared to the results from real driving data from the Hawai’i Natural Energy Institute’s (HNEI) in-house 60,000 miles database [3] gathered in the early 2000s. In this work, a set of 30 commutes is used for two different tests that are compared to elucidate any effect of traffic. For the first test, a single commute with similar characteristics (power and average discharge current) to the synthetic cycles is chosen; while, for the second test, the entire set of commutes is used.
In addition, the mechanistic model detailed in previous work [4] and incremental capacity (IC) analyses were employed to determine if degradation of the cells subjected to simulated driving profiles differed from reality. IC analysis can enhance subtle changes in a cell’s electrochemical behavior during aging [5], and it has been used to define degradation processes in different types of battery systems [6] and in different real-world scenarios [1,7,8,9]. This analysis is non-destructive [6] and can be used in operando [9,10] to provide real-time diagnoses. The novelty of this diagnostic and prognostic technique lies in its ability to anticipate breaks in initial trends and relate them with physical phenomena [1,9,11]. Other prognostic techniques have issues with dynamic conditions and sudden changes in cell properties [12].
This study aims to elucidate any significant discrepancies between simulated and real driving outcomes, expose the effect of traffic conditions, diagnose the cell as it ages throughout driving, and discover a technique to better predict cell lifetimes. The work presented here is part of ongoing research that delves into the effect of grid–vehicle interactions on the performance of Li-ion batteries and facilitates the determination of the causes of cell deterioration and the accurate prediction of capacity loss during real-world use. The knowledge gained is expected to provide suggestions that will improve property retention via highlighting best practices. The overall project, which spans several publications [1,13,14], is meant to investigate EV battery degradation when it is being driven, resting, charging, or interacting with the grid. Such complete understanding is essential to achieve the goal of 100% clean energy.
2. Materials and Methods
Panasonic cylindrical 3350 mAh NCR 18650B batteries were used in this work. They were consistent with the type of cells used by EVs such as the Tesla Model S [15,16]. A set of 15 batteries were selected from a batch of 100. Details on the entire batch of cylindrical 18650-size graphite (GIC)/LiNixCo1-x-yAlyO2 (NCA) cells, as well as the cell-to-cell variation analysis, were presented in previous work [13,17]. The properties of the 15 cells chosen for this investigation were within the outlier boundaries of the cell-to-cell variation distribution [13].
As described in a previous publication [13], all cells were subjected to initial conditioning and characterization tests prior to the beginning of the experiment. Following these formation cycles and before the start of the duty cycle testing, a reference performance test (RPT) consisting of C/35, C/5, and C/3 full cycles was performed on all cells [13]. All RPTs and duty cycles were performed in an Amerex IC500-R chamber, which was set at 25 °C. During testing, the skin temperatures of each of the cells were recorded. The average skin temperature was 25.1 ± 0.95 °C. The voltage range tested was 2.5 to 4.2 V. The formation cycles were performed by a 40-channel Arbin BT-5HC tester, while the first RPTs were performed using a Biologic BCS-815 battery cycler. The following duty cycles and RPTs were carried out by a 40-channel Arbin BT-5HC tester.
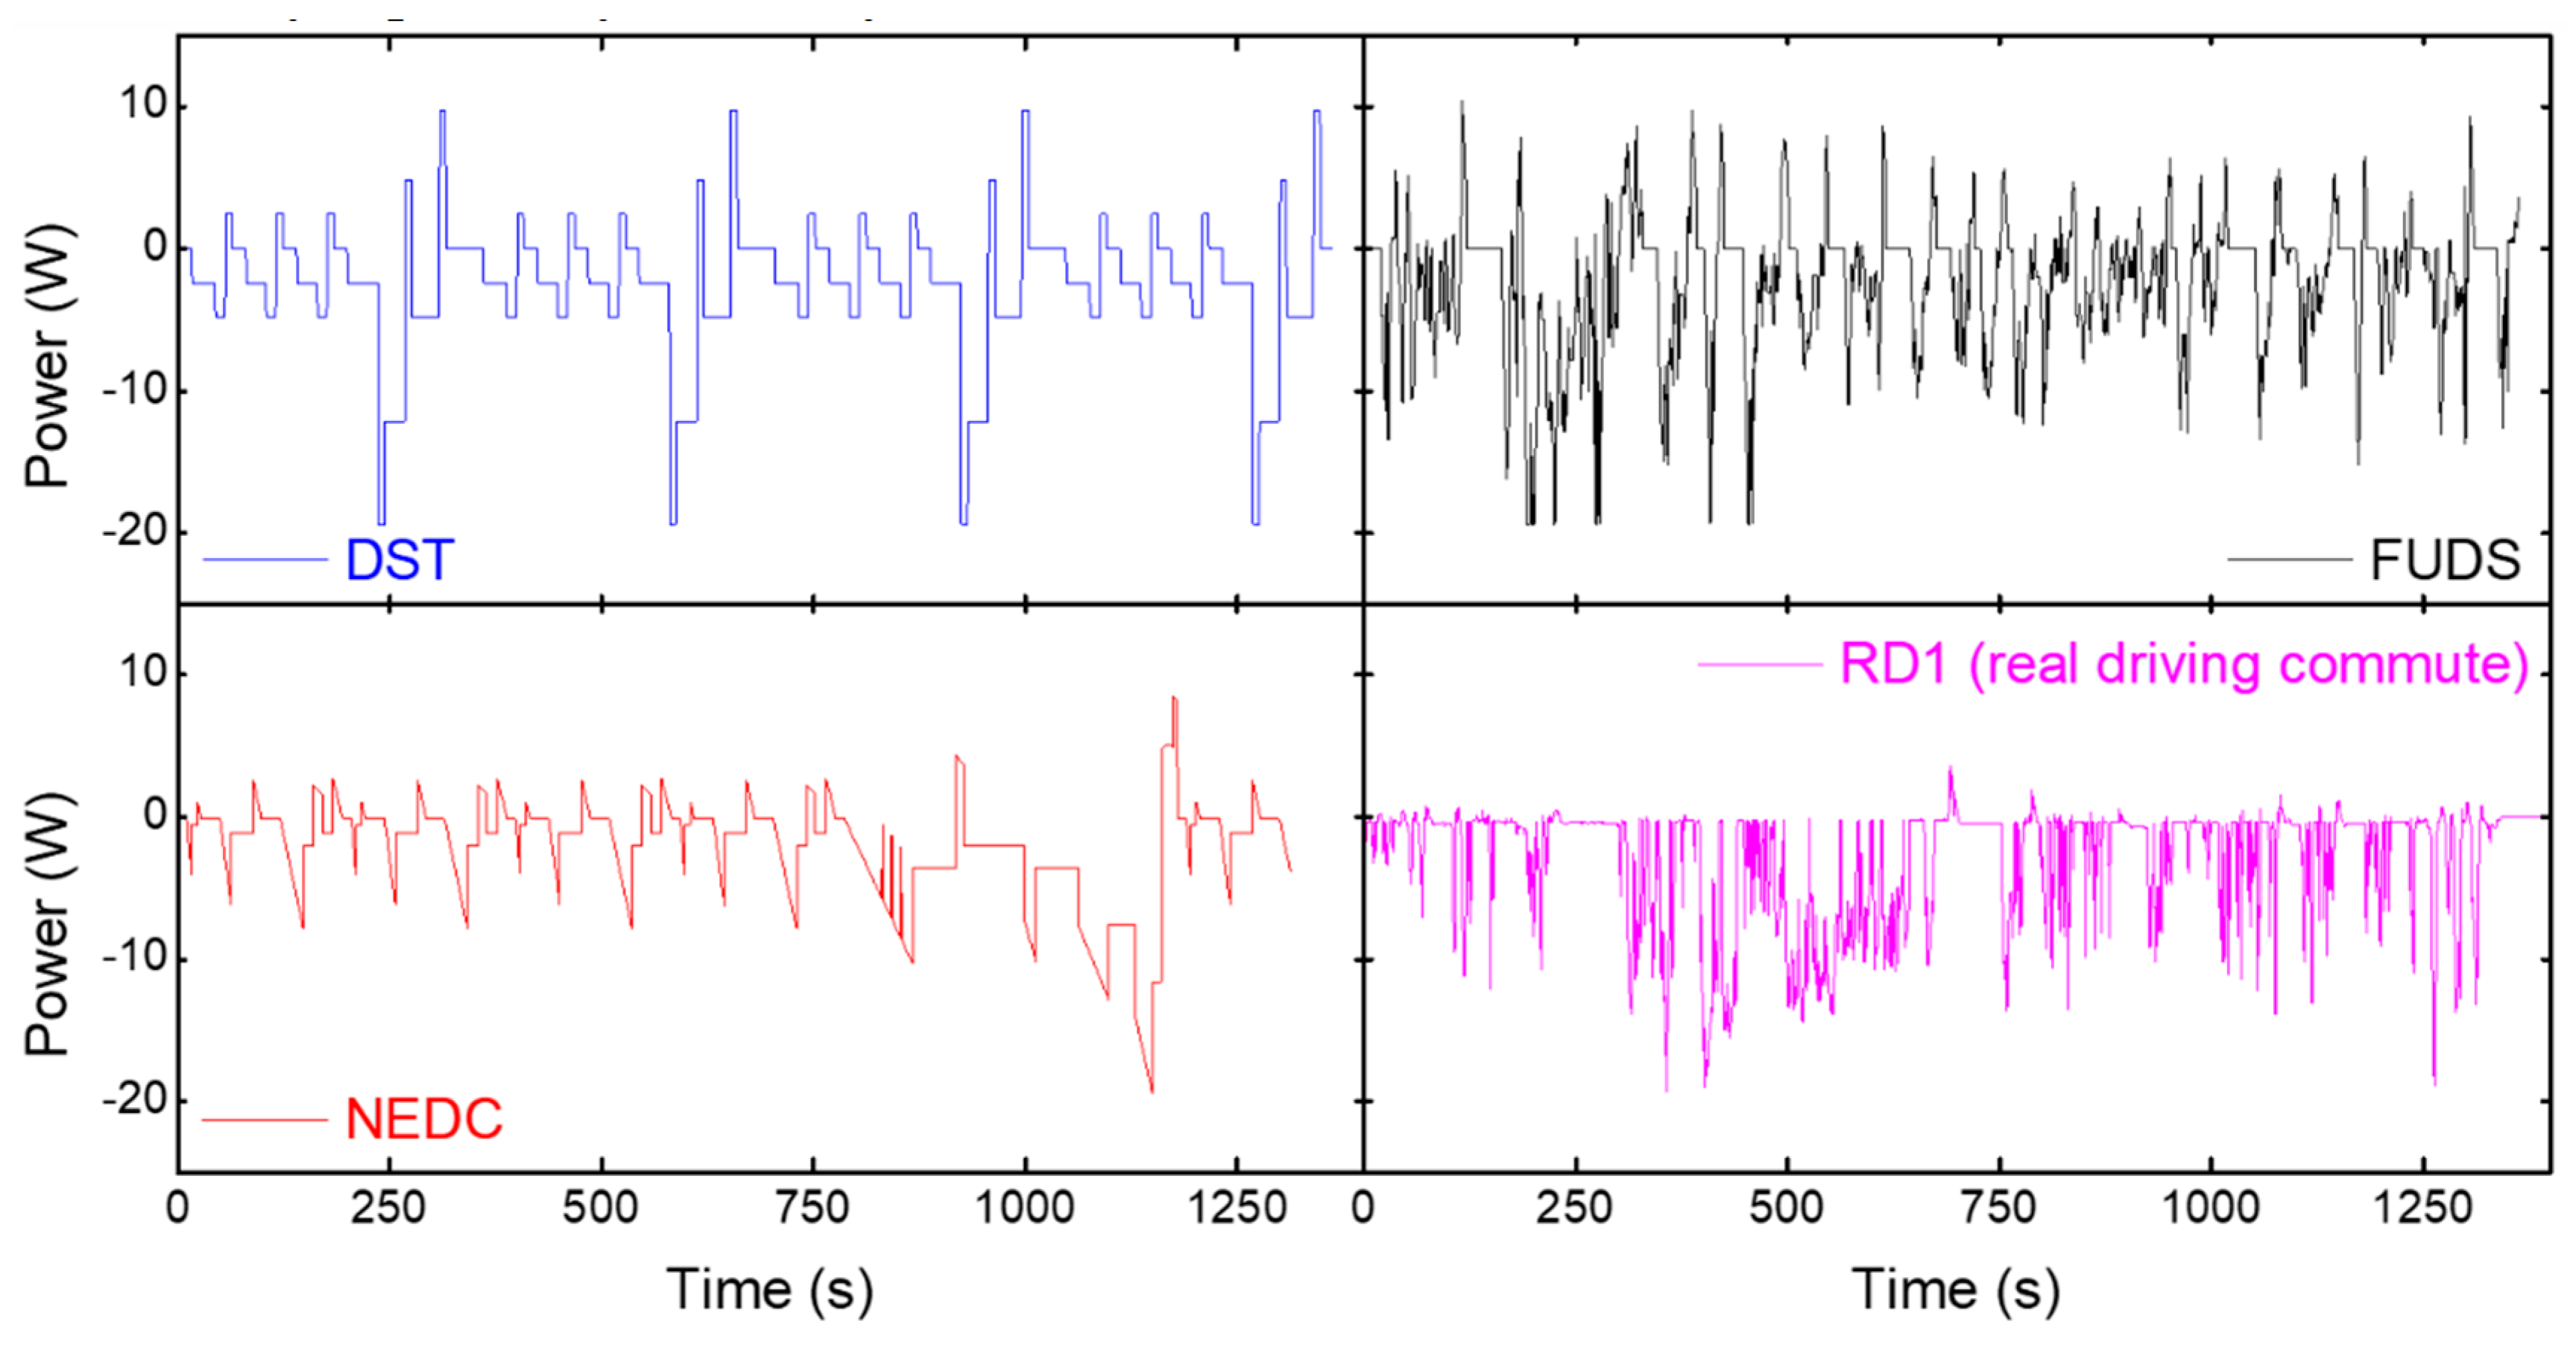
The duty cycles consisted of a full charge at a constant C/5 rate followed by a constant voltage step with a 65 mA cut-off and a 2 h rest step. The cells were then discharged by applying the appropriate driving cycle as a power profile scaled to a maximum power of 400 W/kg (the U.S. Advanced Battery Consortium, USABC, goal). The synthetic power profiles for the DST and FUDS were taken from the USABC manual [2], while the NEDC power profile was extracted from literature [18]. Those three synthetic driving cycles are shown in Figure 1 with one of the real driving profiles (RD1). RD1 was the portion of the real-world data whose values for average discharge current (Table 1) most closely equaled synthetic cycles.
Figure 2 showcases the power profiles from several commutes similar to RD1 but with different traffic conditions. The real driving data were obtained from vehicles with limited regenerative braking. RD1 testing consisted of the single commute repeated over and over, while RD2 testing consisted of a set of 30 unique commutes in a loop.
All the driving cycles were applied continuously, end-to-end until the end-of-discharge (EOD) condition was met. For the cells subjected to the RD2 discharge, each of the commutes were applied for the same amount of time. The EOD condition was a measured cell voltage of less than 2.5 V. The cells rested for 4 h prior to a full charge, after which the cells were discharged with the same power profile again. Cycling was periodically interrupted to perform RPTs. Initially, cycling was interrupted every four weeks, but that decreased as the cell aged and exhibited significant capacity loss. Testing was stopped when the cell exhibited a capacity loss of at least 20% at C/35. The polarization resistance of the cells was estimated from the IR drop induced by the C/3 discharge using Ohm’s law. The total test time of the cells ranged from 10 to 16 months. Three cells for each of the five driving profiles were tested to assess reproducibility, for a total of 15 cells were used in the experiment.
Computer simulations were performed using the proprietary ‘alawa toolbox that served as a user interface to facilitate application of the mechanistic degradation model [4]. Experimental validation supporting the simulation results based on the loss of lithium inventory (LLI) and the loss of active material (LAM) degradation modes has been reported by other groups [19,20,21]. More details in the emulation process and the analysis of the data can be found in previous work [1,13].
3. Results and Discussion
Figure 3 plots the average normalized capacity and resistance increase for the driving conditions versus exchanged capacity. Initially, all cells lost capacity linearly (R2 > 0.98) at about 0.008% ± 0.001% per Ah of exchanged capacity or 0.023% ± 0.003% per cycle. All 15 cells experienced an accelerated stage of degradation, 0.05% ± 0.02% per Ah of exchanged capacity, after a capacity loss of around 10%. This second stage of aging was predicted in a previous work using the ‘alawa toolbox [1]. The cell with the longest lifetime was subjected to the RD2 profile and proceeded to the accelerated aging stage after over 20% capacity loss, but most reached that stage by 11%. The cells subjected to the NEDC and RD1 driving cycles failed on average sooner than the others. Those cells reached the second stage of aging at an average exchanged capacity of 1191 ± 183 and 1216 ± 199 Ah, respectively. These values corresponded to around 350 cycles, in line with what was observed for C/1 charges and discharges [22]. Those profiles were also the ones that were charged the least during driving (see Table 1), indicating that regenerative braking could help capacity retention. This result corroborated what was found in literature [23]. The cells subjected to the DST and FUDS profiles experienced onset of the accelerated aging stage at similar values of capacity exchanged (1438 ± 38 and 1490 ± 78 Ah, respectively, and around 450 cycles). This outcome was unsurprising since DST was derived from FUDS [2]. The RD2 cells were cycled the longest before succumbing to the second stage (2146 ± 251 Ah, 650 cycles). These cells were subjected to a lower average discharge current (see Table 1), which might account for their comparatively long cell lifetimes.
In the initial stage, resistance increased more in the cells aged with the real driving profiles than the simulated ones (Figure 3b). It must be noted that the cells with the highest rates of resistance increase (RD2) were the ones with the longest lives. This highlighted that resistance increase and life expectancy were not correlated. Resistance increased linearly during the first stage of aging, then escalated nonlinearly in the second stage of degradation. Although there was an increase in rate of change of the resistance during the second stage of aging, in general, the disparity between stages was not as pronounced as the one seen in the plot of the capacity fade (Figure 3a).
Most interestingly, there was a considerable difference (>900 Ah or 275 cycles on average) between the final exchanged capacity of the cells subjected to the RD1 and RD2 profiles revealing a sizeable effect of traffic on property retention. This average difference between driving profiles was the largest in the experiment. From the C-rates of those two profiles (Table 1), time to complete discharge could vary by 3 h. As a consequence of these observations, it was reasonable to conclude that not one cycling profile with a fixed set of properties could account for the breadth of real driving outcomes. It may be possible to simulate the range of cell lifetimes by adjusting parameters, such as the maximum power, of a single driving cycle. Although, this range of outcomes may indicate unique degradation mechanisms leading to failure. Diagnosis of the cells was performed to illuminate disparities in the degradation induced by the five duty cycles.
To diagnose the cells, IC analysis was employed in conjunction with the features of interest approach [10,24] to quantify the different degradation modes and determine path dependency. This analysis was shown to identify metallic lithium deposition [7] as well as gas evolution in cells [11]. An extensive discussion on the IC analysis for these cells was previously published [14] and will not be repeated here.
Figure 4a shows the representative IC curve evolution of the C/35 charge. The most noticeable change to the IC signatures during the first few months of cycle aging was the disappearance of a local minimum, or arch, between 3.7 and 3.8 V. Figure 4b–e compares the IC curves at 5%, 10%, 15%, and 20% capacity loss for all the cells. Overall, the evolution of the curves was similar. At 5% capacity loss, the arch was barely visible (Figure 4b) and completely gone by 10% loss (Figure 4c). There was a sharp peak at low voltages that shrank and shifted to higher voltages during aging, but it did not quite disappear, even at 20% loss (Figure 4e). A slow shift to higher voltages of the beginning of charge was also observed, but there was no shift in the end-of-charge (EOC) voltage. It must be noted, however, that differences between duty cycles were visible in the IC curves at 15% and 20% capacity loss. The highest voltage peak between 4.1 and 4.2 V flattened with age more in the cells exposed to the real driving cycles (RD1 and RD2) than the synthetic ones. In addition, except for one of the RD1 cells, cycle aging with the real driving profiles caused a greater voltage shift and intensity decrease to the peak at 3.4 V. These disparities suggested that real-world battery degradation might not be the same as synthetically induced degradation.
Quantifying changes to the IC curves allowed determination of relative magnitudes of degradation modes occurring during aging, uncovering the differences in the effect of the five driving cycles. Similar to previous work [1], experimental changes were compared to the emulated IC evolution of a single mode using the ‘alawa toolbox and the degradation table (Figure 5) [14]. No single degradation matched the experimental variations; therefore, degradation was induced by a combination of separate modes. This complex combination included the loss of lithium inventory, loss of active material at both electrodes (LAMPE and LAMNE for the positive and negative electrodes, respectively), and some kinetic limitations (rate degradation factor, RDF). Scanning all the possible contributions would require an enormous amount of calculation [10], but a careful observation of Figure 4a and Figure 5 reduced the number of cases to consider and allowed direct quantification of LLI, LAMPE, and the rate degradation factor at the negative electrode (RDFNE).
First, it can be deduced that capacity fade was not caused by loss of active material. Capacity loss from LAMNE would shift and change the features at the end-of-charge (the peak above 4 V), and capacity fade from LAMPE would make the sharp peak between 3.3 and 3.4 V disappear—none of which were observed experimentally. Therefore, capacity loss was solely induced by LLI. As a result, LLI could be estimated directly from capacity loss. LLI was found to increase linearly during the initial aging stage to about 10% loss for most of the cells, then the value rose dramatically during the second stage.
Second, the decrease in intensity at 4 V could be used as a direct indicator of LAMPE (Figure 5) since it was the only degradation that was shown to affect this intensity without receding the highest voltage peak. With exception of the RD2 cells, the LAMPE remained below 10% during the initial stage. During the initial stage of aging, the real driving cycles induced LAMPE at a faster rate than the synthetic cycles. At an exchanged capacity of 1000 Ah when all the cells were at the initial stage, the difference was about 2.5%. This degradation mode also accelerated during the secondary stage following the trend in capacity loss, though its value was always less than LLI regardless of the driving cycle.
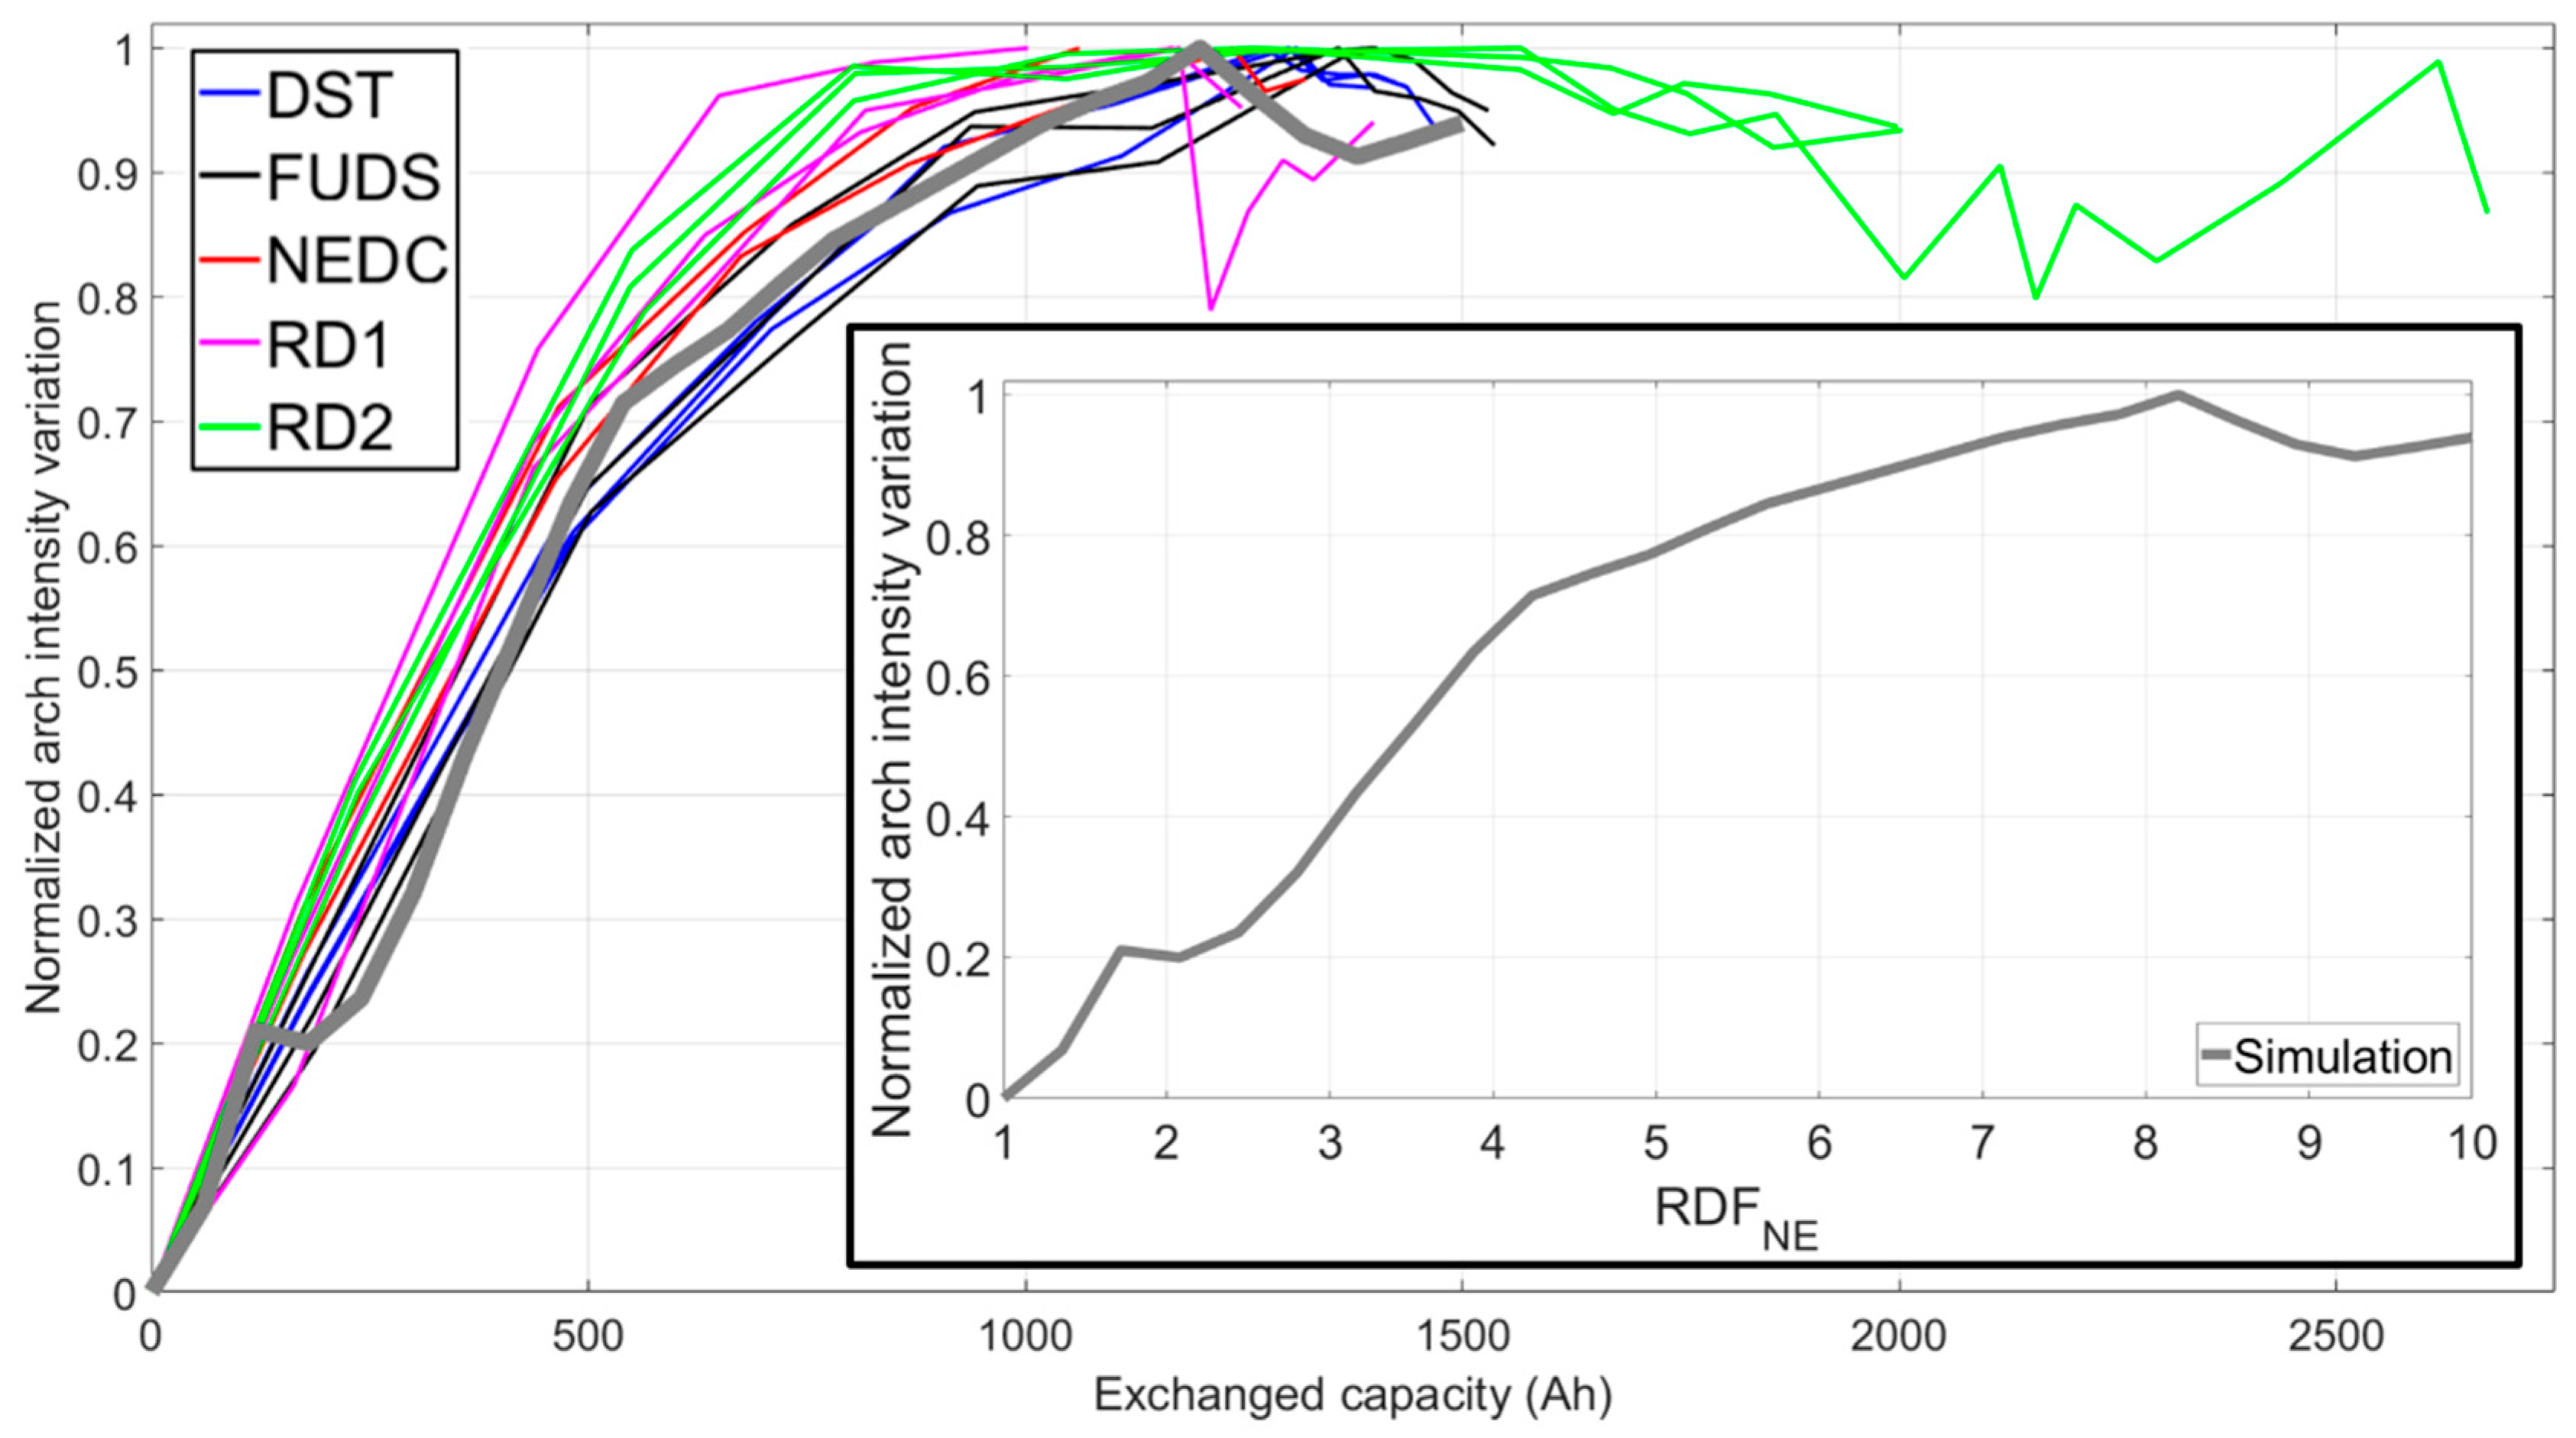
Third, according to the ‘alawa simulation and Figure 5, the disappearance of the arch between 3.7 and 3.8 V could only be attributed to decreasing reaction kinetics at the negative electrode, as all the other degradation modes only shifted this feature to lower or higher voltages. Thus, quantifying this change as the cell aged could allow direct estimation of the RDFNE. It had to be noted that, according to simulations, the intensity of the arch increased then plateaued with increasing RDFNE (inset of Figure 6); therefore, after reaching the plateau beyond a value of 10, the RDFNE could not be estimated. Experimental data exhibited the plateau, but also a decrease in arch intensity after the second stage of aging started (Figure 6). This decrease in arch intensity during the second stage was unlikely to be induced by improving reaction kinetics at the negative electrode. Hence, the intensity change within this voltage range during the stage of accelerated capacity fade must be caused by some combination of all the degradation modes. The arch intensity decrease was not observed in previous work [1] since the cycle-aged cells experienced less than 10% capacity loss and did not undergo this level of degradation. The approach of the RDFNE towards the plateau value was considered as an indicator of the changes to come, but the RD2 cells were among the first to reach the plateau value (Figure 6) yet remained at that level for a couple hundred cycles. All cells reached the RDFNE plateau at different exchanged capacity values, and no distinctions between driving cycles were discerned using this metric.
The last parameter to decipher was LAMNE. LAMNE could not be estimated automatically from any single feature on the IC curve because of its combined effect with all other degradation modes. Based on the abovementioned assumptions, the relative values of three of the degradation modes, LLI, LAMPE, and RDFNE, were calculated and used to fit the IC curves for all the cells as they aged. Those simulations were performed with various amounts of LAMNE, with 1% intervals, until the best fit to experimental data was obtained (Figure 7a). Since this was the only degradation mode that had to be obtained manually, the estimated values may not have been as reliable as the others, because it accounted for all (or a big part of) fitting errors from the other mechanisms. Initially, little to no LAMNE was needed to fit the experimental curves. However, as the cell aged, the LAMNE value became more significant. Figure 7b compares the experimental and the simulated IC curves with no LAMNE (solid red curve) and 15% LAMNE (solid blue curve) at the start of the second aging stage for one of the cells. Adding LAMNE better simulated the shape and position of the peaks at low and high voltages (at 3.4 and 4.1 V, respectively) without significantly changing the fit of the features between those two peaks. The LAMNE value shifted the peak around 3.4 V, and this shift was necessary to simulate the experimental IC curves approaching and during the second stage of aging. There were no clear differences in the LAMNE induced by the five duty cycles during the initial aging stage. All LAMNE values increased considerably at the onset of the second stage of aging for each cell.
To highlight differences in degradation caused by the five driving profiles, the cells were analyzed at a similar point in their aging process: the transition from the initial to the advanced aging stage. Hence, the degradation modes for all the cells at the onset of the second stage were calculated and summarized in a spider plot, presented in Figure 8. The plot revealed that the real driving profiles degraded the battery differently than the synthetic ones, with the former on average inducing more LAMPE and LAMNE. The RD1 and RD2 profiles induced 6.2% ± 1.4% and 10.2% ± 2.6% LAMPE, respectively, while the average LAMPE caused by the synthetic driving cycles at the transition was 4.7% ± 0.5%. In the case of the negative electrode, the RD1 and RD2 profiles induced 15.5% ± 1.3% and 19.5% ± 2.0% LAMNE, respectively, whereas the synthetic driving cycles induced an average LAMNE of 14.5% ± 0.5% at the transition. Interestingly, the percent LLI caused by both real driving profiles was higher at the transition (11.9% ± 1.7% for RD1 and 17.8% ± 3.2% for RD2) than the loss of lithium inventory induced by the synthetic ones (10.6% ± 0.3% for DST, 10.5% ± 0.3% for FUDS, and 9.9% ± 1.6% for NEDC) despite, on average, the RD1 cells advancing to the second stage sooner than all the other cells, while the RD2 cells reached the transition the latest. Thus, the magnitude of LLI did not portend the coming of a secondary aging stage, as the average LLI value of the RD2 cells at the onset was much higher than the others. There was a clear difference between degradation induced by the two real driving cycles. Conversely, the distinction between degradation caused by DST and FUDS was negligible. The average LAMNE caused by both driving cycles was equal (14.6% ± 0.2%), and the average RDFNE values were very close (7.7% ± 1.9% for DST vs. 7.6% ± 1.7% for FUDS). This comparison proved similar aging paths led to similar degradation.
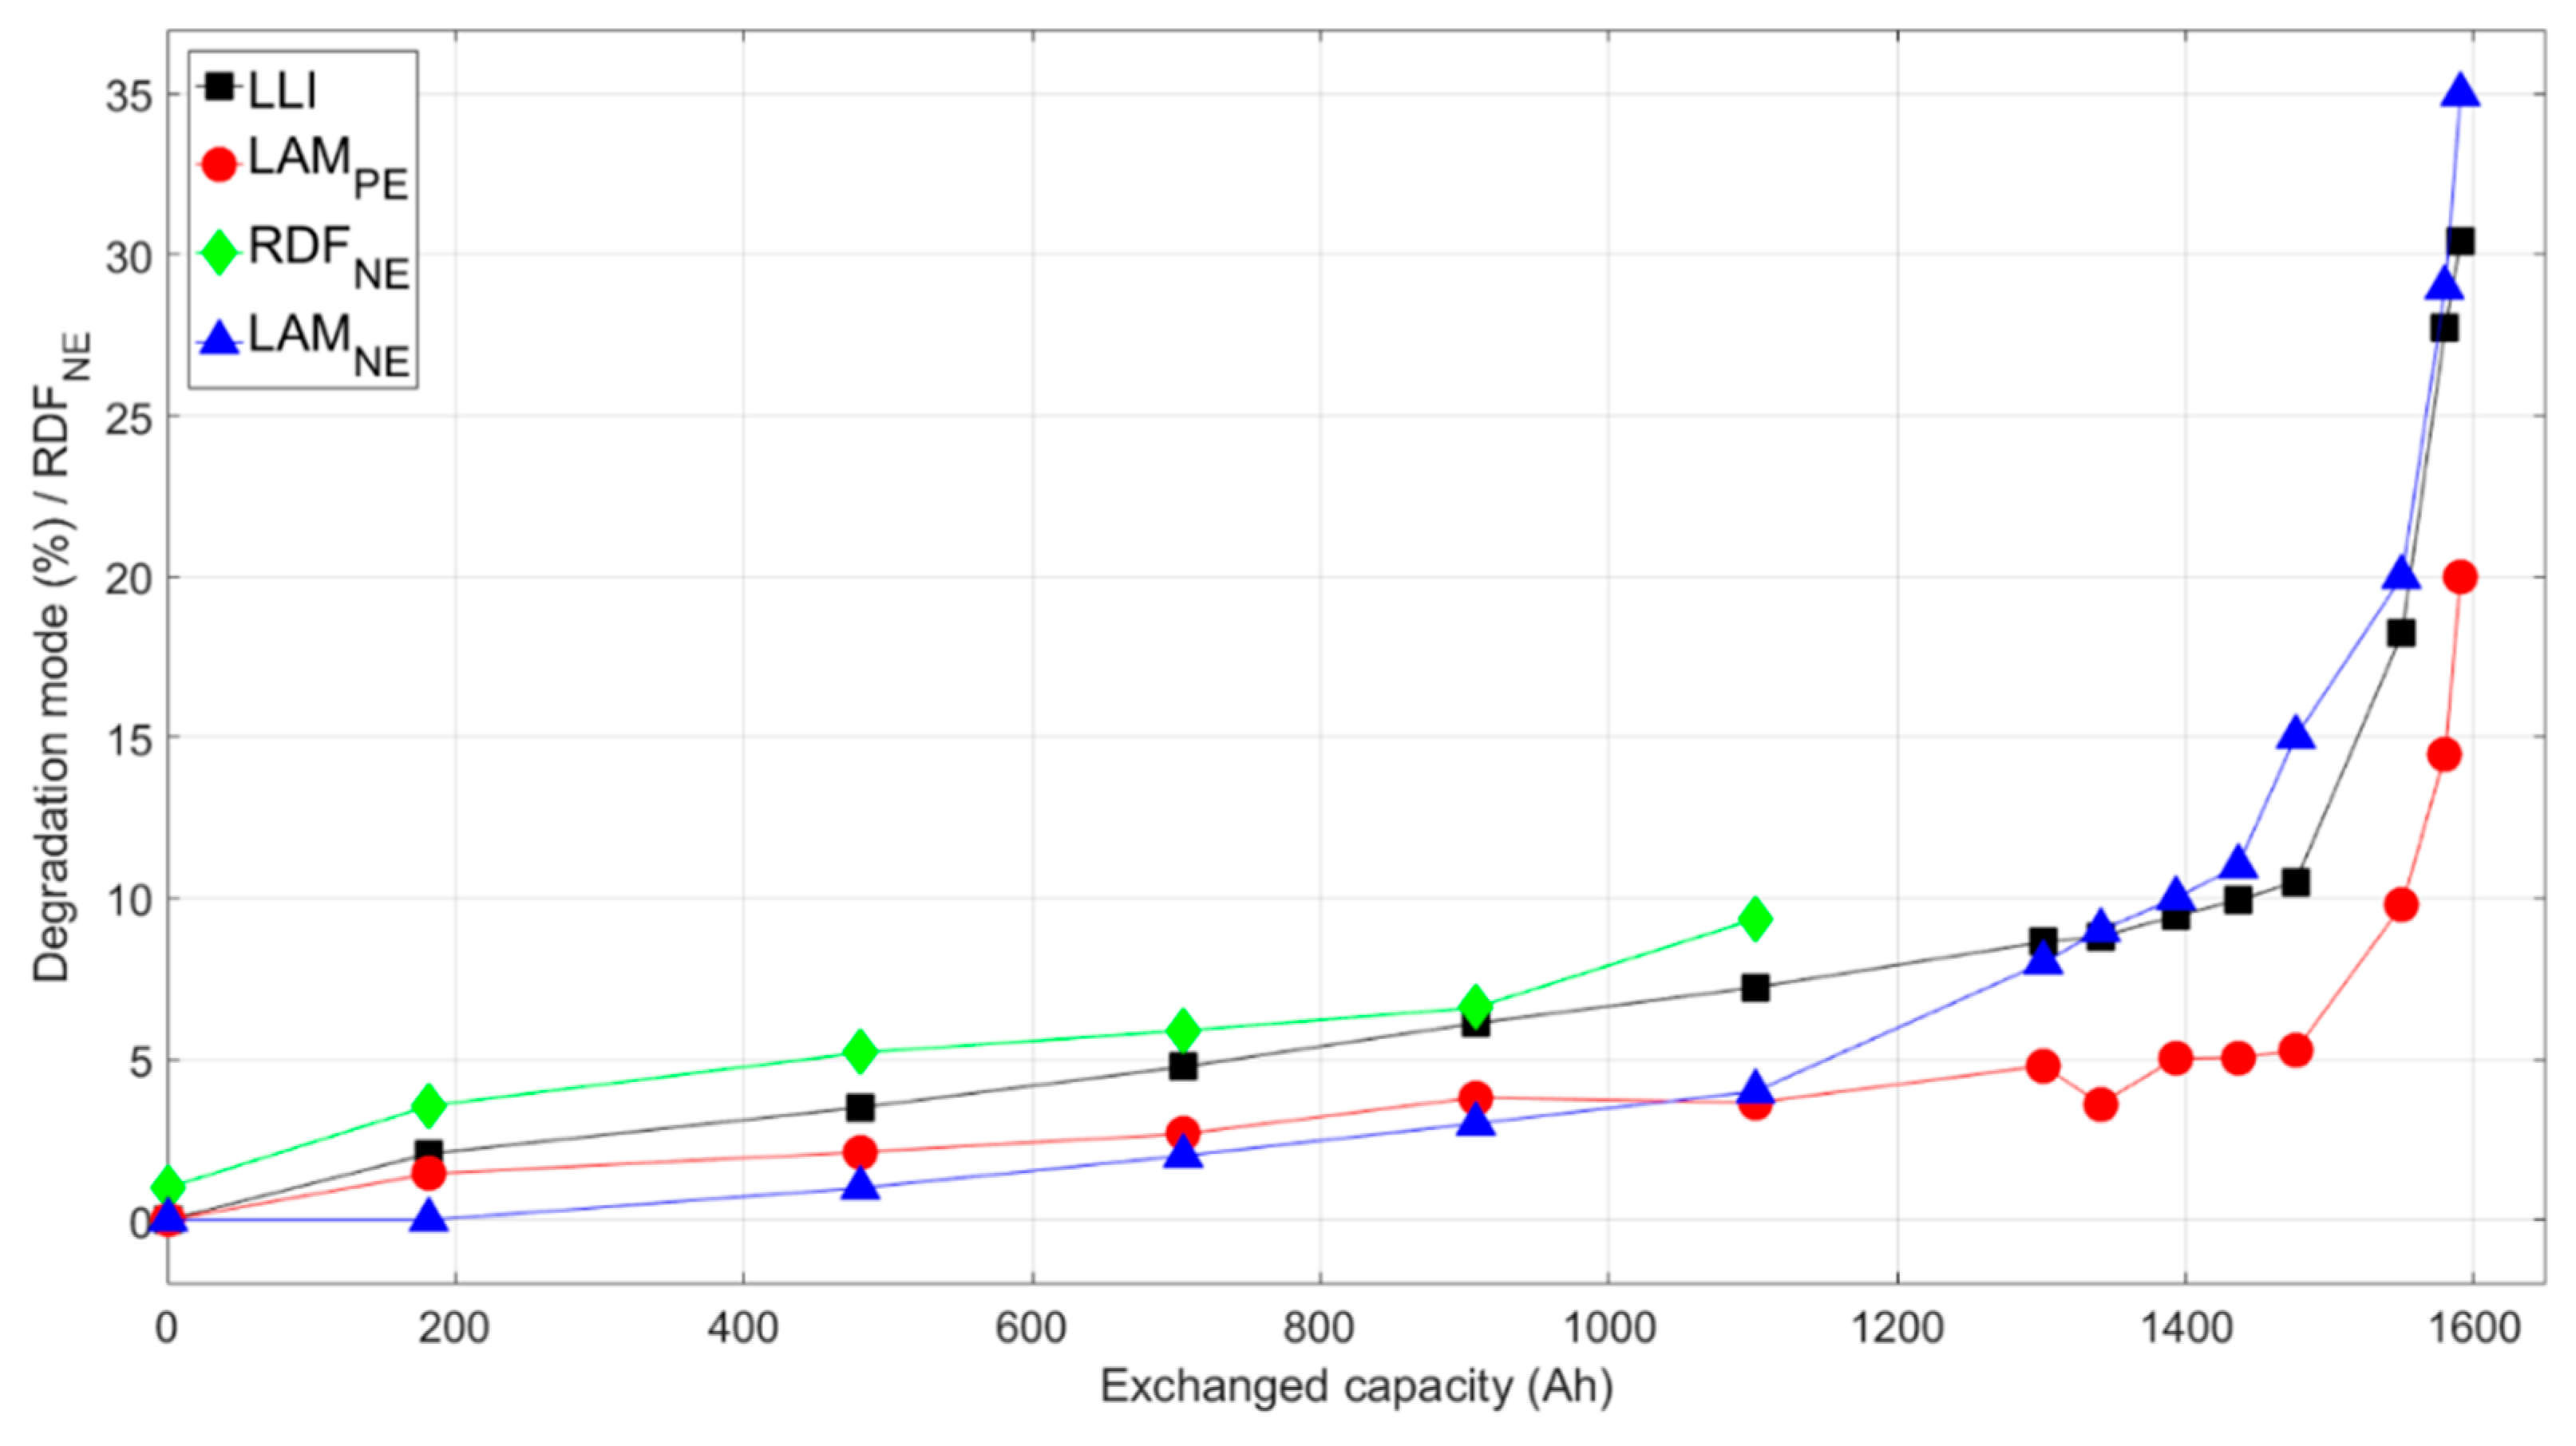
Although the values varied, there were clear trends for each of the degradation modes irrespective of the driving cycle. Figure 9 presents the results of the IC curve analysis throughout aging for one of the cells. The plots revealed the representative trend that the degradation modes followed as all the cells aged. LLI, LAMPE, and LAMNE all accelerated, seemingly exponentially, during the secondary stage. As the cell aged, the LAMNE value increased until it equaled or surpassed the LLI. The RDFNE value tended to reach its plateau value before the acceleration of the other degradation modes. Beyond this point, RDFNE could not be estimated correctly.
In brief, none of the synthetic driving cycles adequately simulated the effect of either of the real driving profiles in terms of cell lifetime or degradation. There was a range of outcomes from the real driving data made evident by the difference in the capacity loss, resistance, and degradation mode calculations, elucidating the impact of traffic conditions and further complicating the representability of synthetic cycling. In contrast, those same metrics indicated the DST and FUDS cycles aged the cells almost identically. The cells aged with NEDC cycle exhibited similar lifetimes to the RD1 cells but with a different degradation profile. Despite the relative values being dissimilar, the degradation modes followed the same general trend for all cells, suggesting that the range in property retention and degradation can be mimicked by identifying and adjusting certain cycle parameters such as the maximum power.
The quantified degradation modes were then investigated further to determine the cause of the accelerated aging. This battery chemistry has been shown to be susceptible to fast capacity fade instigated by lithium deposition [25]. In a previous work [1], it was hypothesized that when the effect of the LAMNE overcame the influence of the LLI, an accelerated stage of aging would transpire brought on by plating and its repercussions [26]. Hence, the LAMNE value in relation to the LLI may be significant as it could, nondestructively, hint at the possible initiation of the secondary stage of degradation observed in the experiment. This hypothesis was developed from the states of charge (SOC) of the electrodes at the full cell’s EOC voltage. The EOC condition was assumed to be attained when the state of charge of the positive electrode (SOCPE) was 100%. As expected [27] and confirmed by half-cell testing, the GIC negative electrode (NE) exhibited a higher capacity than the positive electrode (PE). In other words, at full charge, the SOCPE was 100%, but the state of charge of the NE (SOCNE) was greater than 0%, and the NE was not fully lithiated [4]. If lithium plating was to occur during aging, provided that the resistance increase was limited (Figure 3b) and the cells were kept at ambient temperature, the NE would have to lose enough active material to be unable to store the totality of incoming lithium ions, Figure S1. As the cell approached full charge, SOCNE would be 0% before 100% SOC was reached by the PE, necessitating the deposition of lithium onto the NE. Therefore, in battery chemistries with GIC as NE, for Li plating to occur, there must be a threshold value at which the PE attains 100% SOC while SOCNE equals 0%. This threshold value was dubbed the plating threshold (LAMNE,PT) and was influenced by the cell characteristics (loading ratio and initial offset), the capacity loss, and the other degradation modes, LLI and LAMPE. Values above this threshold would lead to deposition of lithium on the NE [4].
The plating threshold, for LAMPEs < 10%, was estimated from EOC conditions of the graphite using Equation (1). The derivation of this equation is provided in Supplementary Materials. It was important to note that the lithium plating was completely irreversible, as evidenced by the absence of additional electrochemical features in the voltage response during discharge [9,28,29,30] and the shift in the voltage at the beginning of discharge to lower values (Figure 10). Lithium stripping was not observed in the C/35 IC curves during the accelerated stage or even at failure for all the cells tested. Hence, the plating only added to the rate of the LLI, which accelerated capacity fade. If only irreversible lithium plating were to occur in these cells, the transition to the accelerated aging stage would correspond with the point at which the plating threshold was reached. From this hypothesis, the percent LAMNE during the second stage could be determined from Equation (1), where LRini is the initial ratio between the capacities of the negative and positive electrodes or loading ratio, and OFSini is the SOCPE offset, relative to the negative electrode, due to the formation of the SEI layer [4]. The term in parentheses is constant and only depends on initial characteristics. The percentage of LLI, %LLI, is the value that increases during aging. Using this equation, plating threshold values were estimated throughout aging and compared to the LAMNE obtained manually from the best fit to the IC curves (Figure 11). During initial aging, the LAMNE values estimated from the fit were well under the plating threshold. However, at the onset of the second stage, the fit LAMNE percentages came within 2% of the equation values, indicating that irreversible plating could lead to accelerating aging. This conclusion will be validated further by postmortem analysis in a subsequent work.
Although diagnosis via IC analysis was achieved, accurate, reliable prognosis of lithium plating was challenging because of the complexity and path dependency involved in cell degradation. Tracking capacity and resistance were simply incapable of anticipating this phenomenon. From the evolution of the IC curve, the disappearance of the arch feature between 3.7 and 3.8 V always occurred before the transition in aging, but it could not be used to detect if the transition was forthcoming. Degradation mode quantification led to a metric, LAMNE,PT, directly related to Li plating. Though promising, plating threshold analysis needed further investigation for confirmation. Moreover, it was logical to conclude a combination of metrics would be required for such a complicated prognosis. Hence, data at the transition from the initial to the secondary stage were scrutinized further. As suggested by a previous paper [1], the ratio of the LAMNE to the LLI may be a more decisive parameter in predicting the relative lifetimes of these cells. As shown by Figure 12, the second stage began sooner for the cells that exhibited a higher LAMNE: LLI ratio at the transition. The cell with the lowest ratio (RD2, cell 2) exhibited a large decrease in capacity much later in life than the other cells. The LAMNE: LLI ratio was significant phenomenologically because a value greater than one meant the plating threshold would be reached during aging and prompted a precipitous dip in capacity. Once the cell reached this point, the second stage of aging began, the loss of lithium inventory increased nonlinearly, and complete deterioration of the battery quickly followed. This ratio in conjunction with the RDFNE value and the plating threshold may lead to a non-heuristic approach to diagnosis and prognosis of batteries.
4. Conclusions
This study addressed three important points for the battery community. First, it determined whether synthetic driving cycles were representative of real driving. Second, it investigated the origin of the second stage of aging. Third, it proposed metrics to forecast the inception of this second stage.
Based on conventional metrics of capacity and resistance, NEDC was the synthetic driving profile that most closely replicated the trend in capacity fade caused by one of the real driving profiles used in this study (RD1). Since the NEDC driving cycle had the lowest charge capacity during discharge, it best simulated the capacity loss in EVs that traveled a regular daily commute. However, any charge-while-driving technology can change this evaluation. Because of the below average discharge current of real driving data from a varied commute (RD2), none of the synthetic driving profiles reproduced the relatively long lifetimes of those cells. Therefore, it was found that the average current and charge capacity during discharge were important parameters, and they should be considered in determining the appropriate synthetic profile for any EV battery lifetime test. More importantly, traffic greatly influenced cell degradation and cycle life. As a result, realistic EV battery testing might also require looping several iterations of the same synthetic cycle at different intensities since none of the synthetic cycles sufficiently imitated the range of lifetimes and degradation profiles caused by real driving.
All cells experienced this second stage of aging, in which the capacity fade accelerated by more than a factor of six. Changes to certain features in the charging IC curves during aging, such as the decrease in the intensity of the arch between 3.7 and 3.8 V and the shifting of the sharp peak at 3.4 V, were found to coincide with this steep increase in cell degradation. The accelerated aging stage was forecasted by the ‘alawa software, which was used to quantify the degradation mechanisms at play in previous studies. Using advanced IC analysis techniques, the cells were diagnosed with presenting symptoms of irreversible lithium plating leading to the accelerated deterioration of properties.
It was found that the LAMNE: LLI ratio was an important parameter in diagnosing the cell. Ratios greater than one were prerequisites to a second stage of aging characterized by lithium plating and accelerated degradation if the plating was irreversible. Values close to or less than one can delay or prevent the appearance of an accelerated aging stage. In addition, the LAMNE value, which is needed to instigate Li plating at any moment of aging, can be calculated using the analysis outlined in this paper.
These findings also expose a critical flaw in conventional state of health (SOH) estimations. SOH is usually defined from capacity loss and/or resistance increase, but this study showed that those measurements were ineffective in predicting the second stage of degradation, consequently leaving the devices vulnerable to unexpected cell failure. A different set of criteria incorporating new parameters (such as the LAMNE: LLI ratio, potentially) might be crucial to accurately define SOH in the future.
The change in arch intensity, the plating threshold, and the ratio of the LAMNE to LLI were identified as possible harbingers of lithium plating and imminent cell death. These metrics can be evaluated in operando without opening the cell. Furthermore, property retention strategies can be proposed based on these metrics. These are capabilities that the conventional examination of capacity loss and resistance increase lack. Parameters based on IC analysis should be monitored and evaluated collectively to determine if intervention, such as applying different rest conditions or preventing complete charging, is required to lengthen cell lifetimes. This promising diagnosis and prognosis technique will be used and refined in future investigations to predict Li-ion battery degradation induced by different grid–EV interactions.
Supplementary Materials
The derivation of Equation (1) and Figure S1 are available online at www.mdpi.com/2313-0105/5/2/42.
Author Contributions
All the authors designed and performed the experiments, analyzed the results, and wrote the manuscript.
Funding
This work was funded by the state of Hawai’i and ONR Asia Pacific Research Initiative for Sustainable Energy Systems (APRISES) award number N00014-17-1-2206.
Acknowledgments
The authors are grateful to the Hawai’i an Electric Company for their support to the operations of the Hawai’i Sustainable Energy Research Facility (HiSERF). Lastly, the authors would like to acknowledge the advice and cooperation of Keith Bethune.
Conflicts of Interest
The authors declare no conflict of interest.
References
- Dubarry, M.; Baure, G.; Devie, A. Durability and Reliability of EV Batteries under Electric Utility Grid Operations: Path Dependence of Battery Degradation. J. Electrochem. Soc. 2018, 165, A773–A783. [Google Scholar] [CrossRef]
- Electric Vehicle Battery Test Procedures Manual, Rev. 2; USABC/US DOE/INEL, 1996. Available online: http://avt.inl.gov/sites/default/files/pdf/battery/usabc_manual_rev2.pdf (accessed on 28 March 2019).
- Liaw, B.Y.; Dubarry, M. From driving cycle analysis to understanding battery performance in real-life electric hybrid vehicle operation. J. Power Sources 2007, 174, 76–88. [Google Scholar] [CrossRef]
- Dubarry, M.; Truchot, C.; Liaw, B.Y. Synthesize battery degradation modes via a diagnostic and prognostic model. J. Power Sources 2012, 219, 204–216. [Google Scholar] [CrossRef]
- Dubarry, M.; Svoboda, V.; Hwu, R.; Liaw, B.Y. Incremental capacity analysis and close-to-equilibrium OCV measurements to quantify capacity fade in commercial rechargeable lithium batteries. Electrochem. Solid State Lett. 2006, 9, A454–A457. [Google Scholar] [CrossRef]
- Han, X.B.; Ouyang, M.G.; Lu, L.G.; Li, J.Q.; Zheng, Y.J.; Li, Z. A comparative study of commercial lithium ion battery cycle life in electrical vehicle: Aging mechanism identification. J. Power Sources 2014, 251, 38–54. [Google Scholar] [CrossRef]
- Ouyang, M.G.; Ren, D.S.; Lu, L.G.; Li, J.Q.; Feng, X.N.; Han, X.B.; Liu, G.M. Overcharge-induced capacity fading analysis for large format lithium-ion batteries with LiyNi1/3Co1/3Mn1/3O2 + LiyMn2O4 composite cathode. J. Power Sources 2015, 279, 626–635. [Google Scholar] [CrossRef]
- Devie, A.; Dubarry, M.; Liaw, B.Y. Overcharge Study in Li4Ti5O12 Based Lithium-Ion Pouch Cell I. Quantitative Diagnosis of Degradation Modes. J. Electrochem. Soc. 2015, 162, A1033–A1040. [Google Scholar] [CrossRef]
- Ansean, D.; Dubarry, M.; Devie, A.; Liaw, B.Y.; Garcia, V.M.; Viera, J.C.; Gonzalez, M. Operando lithium plating quantification and early detection of a commercial LiFePO4 cell cycled under dynamic driving schedule. J. Power Sources 2017, 356, 36–46. [Google Scholar] [CrossRef]
- Dubarry, M.; Berecibar, M.; Devie, A.; Ansean, D.; Omar, N.; Villarreal, I. State of health battery estimator enabling degradation diagnosis: Model and algorithm description. J. Power Sources 2017, 360, 59–69. [Google Scholar] [CrossRef]
- Devie, A.; Dubarry, M.; Wu, H.P.; Wu, T.H.; Liaw, B.Y. Overcharge Study in Li4Ti5O12 Based Lithium-Ion Pouch Cell II. Experimental Investigation of the Degradation Mechanism. J. Electrochem. Soc. 2016, 163, A2611–A2617. [Google Scholar] [CrossRef]
- Rezvanizaniani, S.M.; Liu, Z.C.; Chen, Y.; Lee, J. Review and recent advances in battery health monitoring and prognostics technologies for electric vehicle (EV) safety and mobility. J. Power Sources 2014, 256, 110–124. [Google Scholar] [CrossRef]
- Devie, A.; Dubarry, M. Durability and Reliability of Electric Vehicle Batteries under Electric Utility Grid Operations. Part 1: Cell-to-Cell Variations and Preliminary Testing. Batteries 2016, 2, 28. [Google Scholar] [CrossRef]
- Dubarry, M.; Devie, A. Battery durability and reliability under electric utility grid operations: Representative usage aging and calendar aging. J. Energy Storage 2018, 18, 185–195. [Google Scholar] [CrossRef]
- Berdichevsky, G.; Kelty, K.; Straubel, J.B.; Toomre, E. The Tesla Roadster Battery System; Tesla Motors: Palo Alto, CA, USA, 2007; pp. 1–5. [Google Scholar]
- Uitz, M.; Sternad, M.; Breuer, S.; Täubert, C.; Traußnig, T.; Hennige, V.; Hanzu, I.; Wilkening, M. Aging of Tesla’s 18650 Lithium-Ion Cells: Correlating Solid-Electrolyte-Interphase Evolution with Fading in Capacity and Power. J. Electrochem. Soc. 2017, 164, A3503–A3510. [Google Scholar] [CrossRef]
- Dubarry, M.; Vuillaume, N.; Liaw, B.Y. Origins and accommodation of cell variations in Li-ion battery pack modeling. Int. J. Energy Res. 2010, 34, 216–231. [Google Scholar] [CrossRef]
- Li, J.H.; Barillas, J.K.; Guenther, C.; Danzer, M.A. A comparative study of state of charge estimation algorithms for LiFePO4 batteries used in electric vehicles. J. Power Sources 2013, 230, 244–250. [Google Scholar] [CrossRef]
- Kassem, M.; Delacourt, C. Postmortem analysis of calendar-aged graphite/LiFePO4 cells. J. Power Sources 2013, 235, 159–171. [Google Scholar] [CrossRef]
- Schmidt, J.P.; Tran, H.Y.; Richter, J.; Ivers-Tiffee, E.; Wohlfahrt-Mehrens, M. Analysis and prediction of the open circuit potential of lithium-ion cells. J. Power Sources 2013, 239, 696–704. [Google Scholar] [CrossRef]
- Birkl, C.R.; Roberts, M.R.; McTurk, E.; Bruce, P.G.; Howey, D.A. Degradation diagnostics for lithium ion cells. J. Power Sources 2017, 341, 373–386. [Google Scholar] [CrossRef]
- Frisco, S.; Kumar, A.; Whitacre, J.F.; Litster, S. Understanding Li-Ion Battery Anode Degradation and Pore Morphological Changes through Nano-Resolution X-ray Computed Tomography. J. Electrochem. Soc. 2016, 163, A2636–A2640. [Google Scholar] [CrossRef]
- Keil, P.; Jossen, A. Impact of Dynamic Driving Loads and Regenerative Braking on the Aging of Lithium-Ion Batteries in Electric Vehicles. J. Electrochem. Soc. 2017, 164, A3081–A3092. [Google Scholar] [CrossRef]
- Berecibar, M.; Devriendt, F.; Dubarry, M.; Villarreal, I.; Omar, N.; Verbeke, W.; Van Mierlo, J. Online state of health estimation on NMC cells based on predictive analytics. J. Power Sources 2016, 320, 239–250. [Google Scholar] [CrossRef]
- Waldmann, T.; Kasper, M.; Wohlfahrt-Mehrens, M. Optimization of Charging Strategy by Prevention of Lithium Deposition on Anodes in high-energy Lithium-ion Batteries—Electrochemical Experiments. Electrochim. Acta 2015, 178, 525–532. [Google Scholar] [CrossRef]
- Zhang, S.S. The effect of the charging protocol on the cycle life of a Li-ion battery. J. Power Sources 2006, 161, 1385–1391. [Google Scholar] [CrossRef]
- Nitta, N.; Wu, F.X.; Lee, J.T.; Yushin, G. Li-ion battery materials: Present and future. Mater. Today 2015, 18, 252–264. [Google Scholar] [CrossRef]
- Kim, C.S.; Jeong, K.M.; Kim, K.; Yi, C.W. Effects of Capacity Ratios between Anode and Cathode on Electrochemical Properties for Lithium Polymer Batteries. Electrochim. Acta 2015, 155, 431–436. [Google Scholar] [CrossRef]
- Fan, J.; Tan, S. Studies on charging lithium-ion cells at low temperatures. J. Electrochem. Soc. 2006, 153, A1081–A1092. [Google Scholar] [CrossRef]
- Petzl, M.; Danzer, M.A. Nondestructive detection, characterization, and quantification of lithium plating in commercial lithium-ion batteries. J. Power Sources 2014, 254, 80–87. [Google Scholar] [CrossRef]
Figure 1.
The power profiles for the dynamic stress test (DST), Federal Urban Driving Schedule (FUDS), New European Driving Cycle (NEDC), and real driving-1 (RD1) cycles.
Figure 1.
The power profiles for the dynamic stress test (DST), Federal Urban Driving Schedule (FUDS), New European Driving Cycle (NEDC), and real driving-1 (RD1) cycles.

Figure 2.
The power profiles from the real driving data (RD1 and RD2) selected from the Hawai’i Natural Energy Institute (HNEI) database.
Figure 2.
The power profiles from the real driving data (RD1 and RD2) selected from the Hawai’i Natural Energy Institute (HNEI) database.

Figure 3.
Plots of the average (a) normalized capacity and (b) resistance increase for each of the driving profiles vs. exchanged capacity.
Figure 3.
Plots of the average (a) normalized capacity and (b) resistance increase for each of the driving profiles vs. exchanged capacity.

Figure 4.
(a) Representative incremental capacity (IC) curve evolution up to 20% capacity loss. (b–e) Representative IC curves for each of the driving profiles at 5%, 10%, 15%, and 20% capacity loss.
Figure 4.
(a) Representative incremental capacity (IC) curve evolution up to 20% capacity loss. (b–e) Representative IC curves for each of the driving profiles at 5%, 10%, 15%, and 20% capacity loss.

Figure 5.
Simulated evolution of the IC curves for each of the prominent degradation modes generated by the ‘alawa program. More details are available in a previous work [14].
Figure 5.
Simulated evolution of the IC curves for each of the prominent degradation modes generated by the ‘alawa program. More details are available in a previous work [14].

Figure 6.
Evolution of the arch intensity during the initial stage of degradation for all the cells tested vs. the exchanged capacity. The inset is a plot of the simulated intensity variation vs. rate degradation factor at the negative electrode (RDFNE).
Figure 6.
Evolution of the arch intensity during the initial stage of degradation for all the cells tested vs. the exchanged capacity. The inset is a plot of the simulated intensity variation vs. rate degradation factor at the negative electrode (RDFNE).

Figure 7.
(a) Representative fits for the experimental IC curves at the start and end of the initial stage of aging. (b) Fits for the experimental IC curves at the end of the initial stage of aging with and without considering the loss of active material at the negative electrode (LAMNE).
Figure 7.
(a) Representative fits for the experimental IC curves at the start and end of the initial stage of aging. (b) Fits for the experimental IC curves at the end of the initial stage of aging with and without considering the loss of active material at the negative electrode (LAMNE).

Figure 8.
Spider plot of the calculated degradation modes at the onset of the accelerated stage of aging for all 15 cells.
Figure 8.
Spider plot of the calculated degradation modes at the onset of the accelerated stage of aging for all 15 cells.

Figure 9.
Plot of the calculated degradation modes vs. exchanged capacity for one cell subjected to the DST profile illustrating the representative trends of each.
Figure 9.
Plot of the calculated degradation modes vs. exchanged capacity for one cell subjected to the DST profile illustrating the representative trends of each.

Figure 10.
Representative IC curve evolution of a cell aged to failure (>20% capacity loss) during discharge.
Figure 10.
Representative IC curve evolution of a cell aged to failure (>20% capacity loss) during discharge.

Figure 11.
The percent LAMNE, plating threshold, and normalized capacity of the corresponding cell as it aged.
Figure 11.
The percent LAMNE, plating threshold, and normalized capacity of the corresponding cell as it aged.

Figure 12.
Plot of the LAMNE: loss of lithium inventory (LLI) ratio versus the exchanged capacity at the start of the accelerated aging stage for all cells tested.
Figure 12.
Plot of the LAMNE: loss of lithium inventory (LLI) ratio versus the exchanged capacity at the start of the accelerated aging stage for all cells tested.


Table 1.
Properties of the driving profiles during discharge.
| Driving Profiles | Avg. Current (A) | C-Rate Based on Avg. Current | Discharge Time (h) | Charge Capacity (Ah) | Discharge Capacity (Ah) |
|---|---|---|---|---|---|
| Dynamic Stress Test (DST) | −0.68 | C/4.8 | 4.03 | 0.51 | 3.29 |
| Federal Urban Driving Schedule (FUDS) | −0.70 | C/4.6 | 3.74 | 0.56 | 3.20 |
| New European Driving Cycle (NEDC) | −0.66 | C/4.9 | 4.25 | 0.30 | 3.13 |
| RD1: real driving (commute comparable to simulations) | −0.73 | C/4.5 | 4.12 | 0.03 | 3.03 |
| RD2: real driving (complete dataset) | −0.45 | C/7.3 | 6.73 | 0.04 | 3.01 |
© 2019 by the authors. Licensee MDPI, Basel, Switzerland. This article is an open access article distributed under the terms and conditions of the Creative Commons Attribution (CC BY) license (http://creativecommons.org/licenses/by/4.0/).
Share and Cite
MDPI and ACS Style
Baure, G.; Dubarry, M. Synthetic vs. Real Driving Cycles: A Comparison of Electric Vehicle Battery Degradation. Batteries 2019, 5, 42. https://doi.org/10.3390/batteries5020042
AMA Style
Baure G, Dubarry M. Synthetic vs. Real Driving Cycles: A Comparison of Electric Vehicle Battery Degradation. Batteries. 2019; 5(2):42. https://doi.org/10.3390/batteries5020042
Chicago/Turabian StyleBaure, George, and Matthieu Dubarry. 2019. "Synthetic vs. Real Driving Cycles: A Comparison of Electric Vehicle Battery Degradation" Batteries 5, no. 2: 42. https://doi.org/10.3390/batteries5020042
Note that from the first issue of 2016, this journal uses article numbers instead of page numbers. See further details here.