1. Introduction
Vanadium Flow Battery (VFB) technology was invented at the University of New South Wales (UNSW, Sydney, Australia) in the 1980s [
1,
2,
3]. As shown schematically in
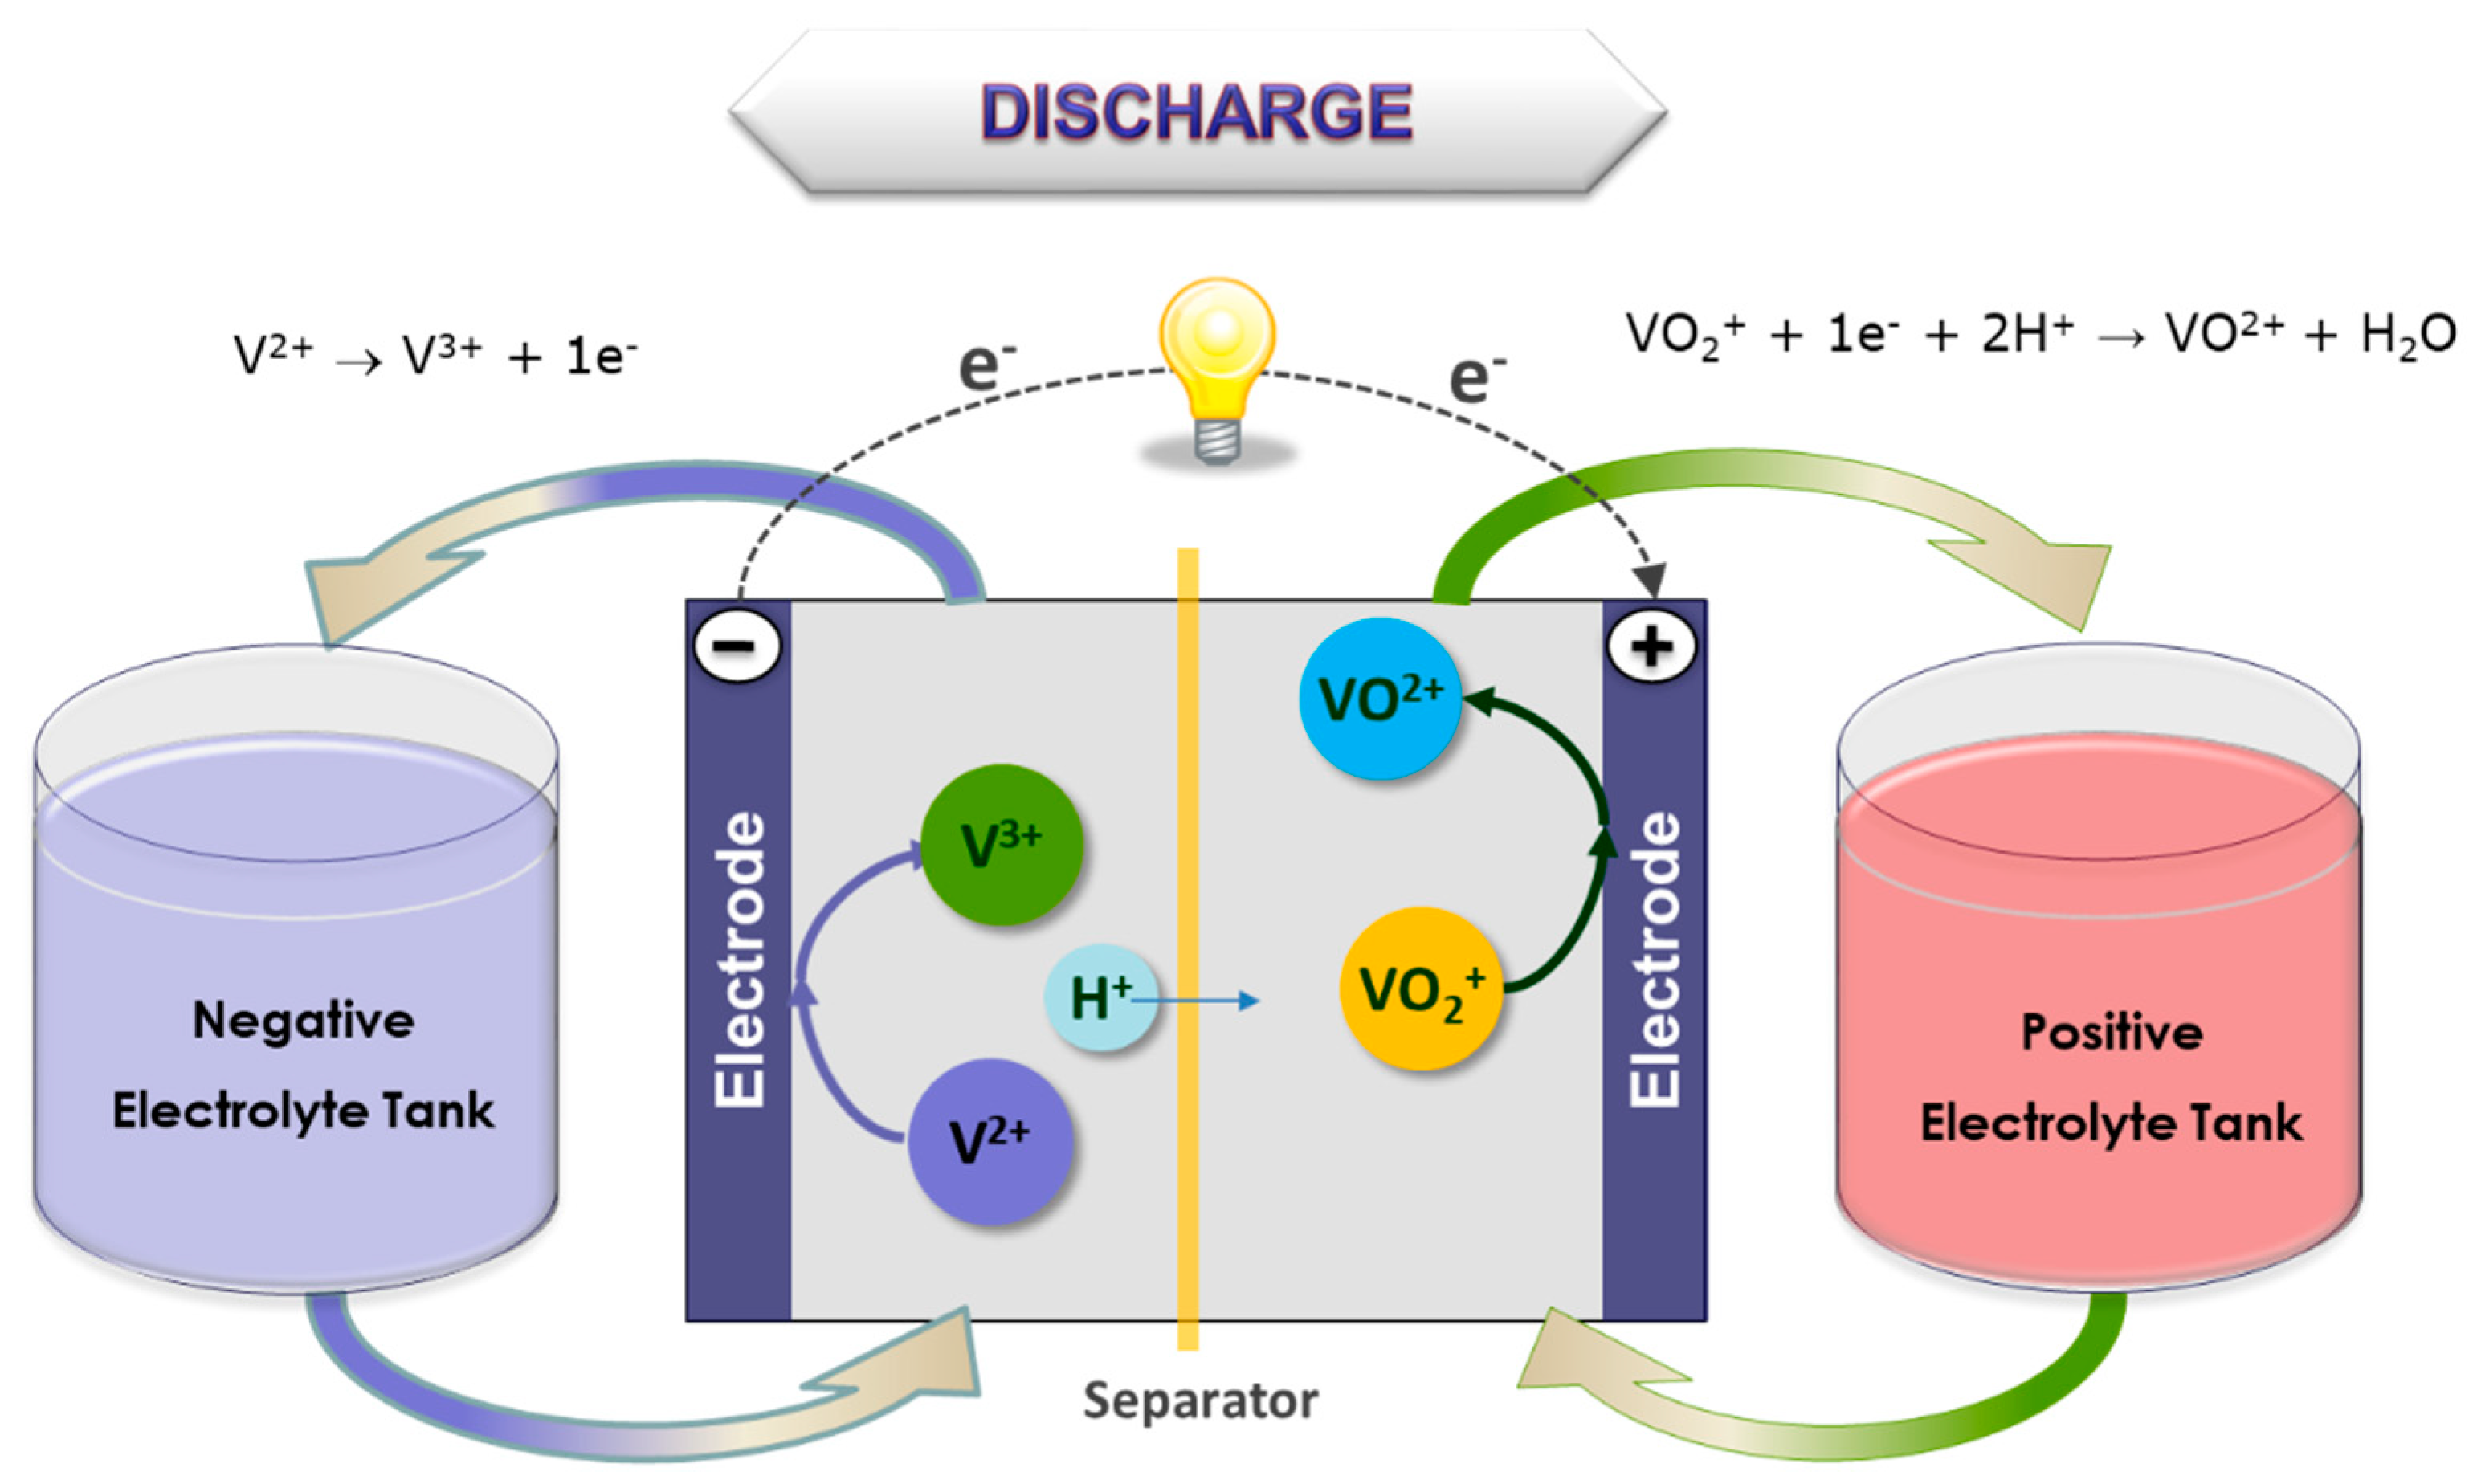
Figure 1, the system employs two electrolyte solutions stored in separate tanks that are pumped via manifolds through half-cells separated by an ion-selective membrane. The electrolytes interact across the membrane, and the concentration of each ionic species changes as the battery cycles. The electrochemical reaction produces 1.2–1.6 V per cell, depending upon the electrolyte solution, temperature, and state of charge. Furthermore, this flow cell battery is reversible, allowing deep cycling and very rapid recharging and discharging. Power and energy ratings are independent, and are a function of electrode area of the cell (power), electrolyte storage (energy) and electrolyte flow rate (both power and energy).
Due to its unique mechanism and compelling characteristics such as quick response and long cycle life, among others, VFB technology has sparked considerable research interest with respect to developing electrochemical energy storage technologies for various grid applications such as load leveling/peak shaving, emergency power backup, and renewable energy integration [
4,
5,
6,
7,
8,
9,
10].
However, despite the exceptional advantages of the VFB system, this potentially game-changing technology must be demonstrated in larger, kW scale stacks, in order to validate the practically and commercial viability of these flow batteries so as to avoid any potential risks that may not be easily observed in lab-scale systems. To perform this validation with respect to its integration into utility-scale solar power plants, we recently demonstrated a 5 kW/5 kWh scale prototype stack and system. This demonstration should help to identify and mitigate potential challenges prior to the scale-up of the technology to MW grid applications. In this paper, we report on the operating control strategies impacting the system energy efficiency of the VFB demonstrator and the performance of a kW scale stack.
2. Methodology
The control and data logging of the 5 kW/5 kWh VFB reactor has been performed using a LabVIEW system coupled with an integrated PLC. This system recorded the data successfully at specified time increments during the work sequence of this flow battery. The program allowed for work sequences to run and monitor the battery in real time. Recorded values and operational program from many cycles were performed at various levels of current to assess the electrochemical characteristic of the battery. The charge level limits were determined by allowing the battery to charge/discharge at 100 A until reaching its charge level limitations (0–100%) which were the equivalent to the state of charge (SOC) being 5–85% limits. This data allowed one to better interpret stored energy capacity and the charge/discharge profiles for the individual runs. The cycles from the battery could charge for a theoretical time that would achieve 100% charge level and immediately discharge. This provides an initial evaluation of the coulombic and voltaic efficiency of the system. The global efficiency of the system was determined based on recorded power consumption using a power meter integrated in the experimental facility. The global equation of the round trip efficiency can be described as Whout/(Whin + Whpumping) considering Whout as the energy provided by the battery in discharge. The battery was then operated using different current levels to measure the power requirements for the centrifugal pumps.
3. Battery Characteristics
The stack employed in this work, shown in
Figure 2, is a commercial product provided by Golden Energy Fuel Cell Co. Ltd. (Shuozhou Shanxi, China) and consists of 40 individual cells connected hydraulically in parallel by a network of internal distribution manifolds and electrically connected in serial by bipolar electrodes, with the positive of one cell becoming the negative of the next cell, with an average output power of 5 kW, at the charge–discharge current density of 800 A m
−2 (equivalent to 100 A). Auxiliary equipment and the hydraulic system have been designed and installed allowing us to achieve the most adequate battery operative conditions (i.e., variable flow rate, electrolyte conductivities and redox potential monitoring…). Attached to these current collectors were porous graphite felts with an active area of 1800 cm
2 (36 cm in width and 50 cm in length) for each felt electrode with 7.0 mm thickness (20% compression) and a stated surface area of 0.4 m
2g
−1. The membrane was Nafion type (Model 117, DuPont, Midland, MI, USA) meanwhile the flow frame used in the stack consists in a zigzag configuration with primary and secondary paths constituting multi-distribution channels. The design details for this stack have been extensively outlined by Wu et al. [
11].
For the operation of the battery, the positive and negative electrolytes were pumped under inert atmosphere into the stack using two magnetic pumps (model CTM 25–10, Tapflo, Barcelona, Spain). The total electrolyte volume was varied (100, 150 and finally 300 L) and was composed of 1.6 M vanadium species in concentrated (2 M) sulphuric acid (Oxkem Limited, Reading, UK). The tests were conducted using a 9200 Series Battery Cycling Module (NH Research, Irvine, CA, USA) controlled by LabVIEW programs which ran under the control of preset control algorithms provided by the user. Electrolyte remixing was carried out periodically to minimize the loss of capacity by cross-mixing.
The battery module also contained sensors to measure and control the temperature, conductivity, redox potential (ORP) and the electrolyte levels in the tanks. These measurements were integrated into the system and were connected to a 6251 DAQ (National Instruments, Austin, TX USA) and recorded by LabVIEW software allowing for the control of the operational temperatures, the balancing of the electrolytes during operation of the battery and to identify and detect problems within this system. Finally, a nitrogen purge was fed to the tanks to avoid the effect of an unbalance of the vanadium species.
Typically, this battery was operated between nominal charge levels of 5% to 85%.
Figure 3 illustrates the voltage time profile as 100 A of current is applied to charge the battery. A constant current level was maintained here until a given voltage level was achieved. The applied current was then linearly decreased until the required charge level was achieved.
The current applied during discharge was overall very similar to that used during charge limiting in 40 V to prevent the charge level dropping below the 0% level. For both charge and discharge, voltage limits were set so as to minimize the risk of secondary reactions, such as H
2 or O
2 evolution, or vanadium precipitation arising from a drop in electrolyte acidity or damage to the electrode materials [
12].
4. System Cyclability
Repeated charge/discharge cycles were conducted in order to determine the energy efficiency of the system during cycling. The cycles were operated at a nominal 100 A CC-CV charge/CC discharge to provide information on the cyclability of the battery over these conditions.
Figure 4 displays a typical data set achieved from these test cycles. It is worth noting here that the charge level for the 100 A charge was not taken to 100%, so as to avoid the above noted linear reduction in power near the upper limit of charge. However, the battery was set to fully discharge to a 0% charge level in order to examine how much of the input energy was returned during the discharge part of the cycle.
The energy efficiency of the system was evaluated as the ratio of the total energy returned from what was originally input into the battery. The energy efficiency of the stack was around 75% which is slightly lower than the ones reported in the literature (around 80%) [
10,
13,
14].
Table 1 shows the energy efficiencies for the cycles performed at the beginning and after three months of operation. It can be seen that at a charging/discharging power ~5 kW, a value of 65.1% was achieved. Although pumping losses account for 8–15% of the energy losses, some commercial systems reported cycle efficiencies of 70–75% [
10]. These cycle efficiency values higher than 70% might be achieved by optimizing the flow factor and reducing the pump loss of 5% [
8,
9,
10,
15,
16].
It can also be noted from the table that the capacity level shows some variation and does not correlate with the actual amount of capacity stored in the battery. This type of battery degradation has been studied by measuring the development of the internal resistance over the number of cycles. The internal resistance is given by the deviation of the voltage from the open cell voltage divided by the current (V
OCV − V
DC)/I. The internal resistance is primarily due to Ohmic resistance in the cells while activation losses and other effects play a minor role. The resistance can also change by a few percent with changes in temperature. In general, the resistance is expected to increase as the cells degrade, leading to lower efficiencies.
Figure 5 shows the resistance (and capacity) as function of the number of cycles. Results indicate that the resistance does not seem to increase over the 28 cycles of operation. Therefore, the capacity loss can only be due to the cross mixing of species through the membrane during the 3 months of operation.
5. Polarization Tests
Several polarization tests were performed as initial experiments to evaluate the kinetic polarization of the system at different power requirements (20 s pulse) over the whole range of SOC. The electrolyte used in this case had a volume of 150 L per tank and was fed to the stack at a flow rate of 900 L h
−1 (equivalent to a flow factor of 2 compared with 100 A-20–80% SOC).
Figure 6 and
Figure 7 show the IR-free kinetics of the RFB under current density and power pulses. This stack exhibits low Ohmic resistance; 1.5–1.7 ohm cm
2 measured in terms of the voltage drop at different current densities, and 1.7–1.8 ohm cm
2 in terms of the voltage vs. current slope.
In general, voltage decays in this type of reactor are associated with different factors such as electrode polarization or kinetic losses, IR losses associated with contact and ionic resistances, pseudo-IR losses related to mass transfer of redox-active species within active electrode layers, and mass transfer-limiting currents associated with bulk reagent delivery to the electrode. In the experiments performed here we observe a linear decrease in voltage with increasing current density for at each SOC condition. This indicates that we are in the middle portion of the polarization curve and that the mechanism does not show significant mass-transport limitations even at current/power densities of 900 A m−2/1.1 kW m−2.
6. Peak Power Tests
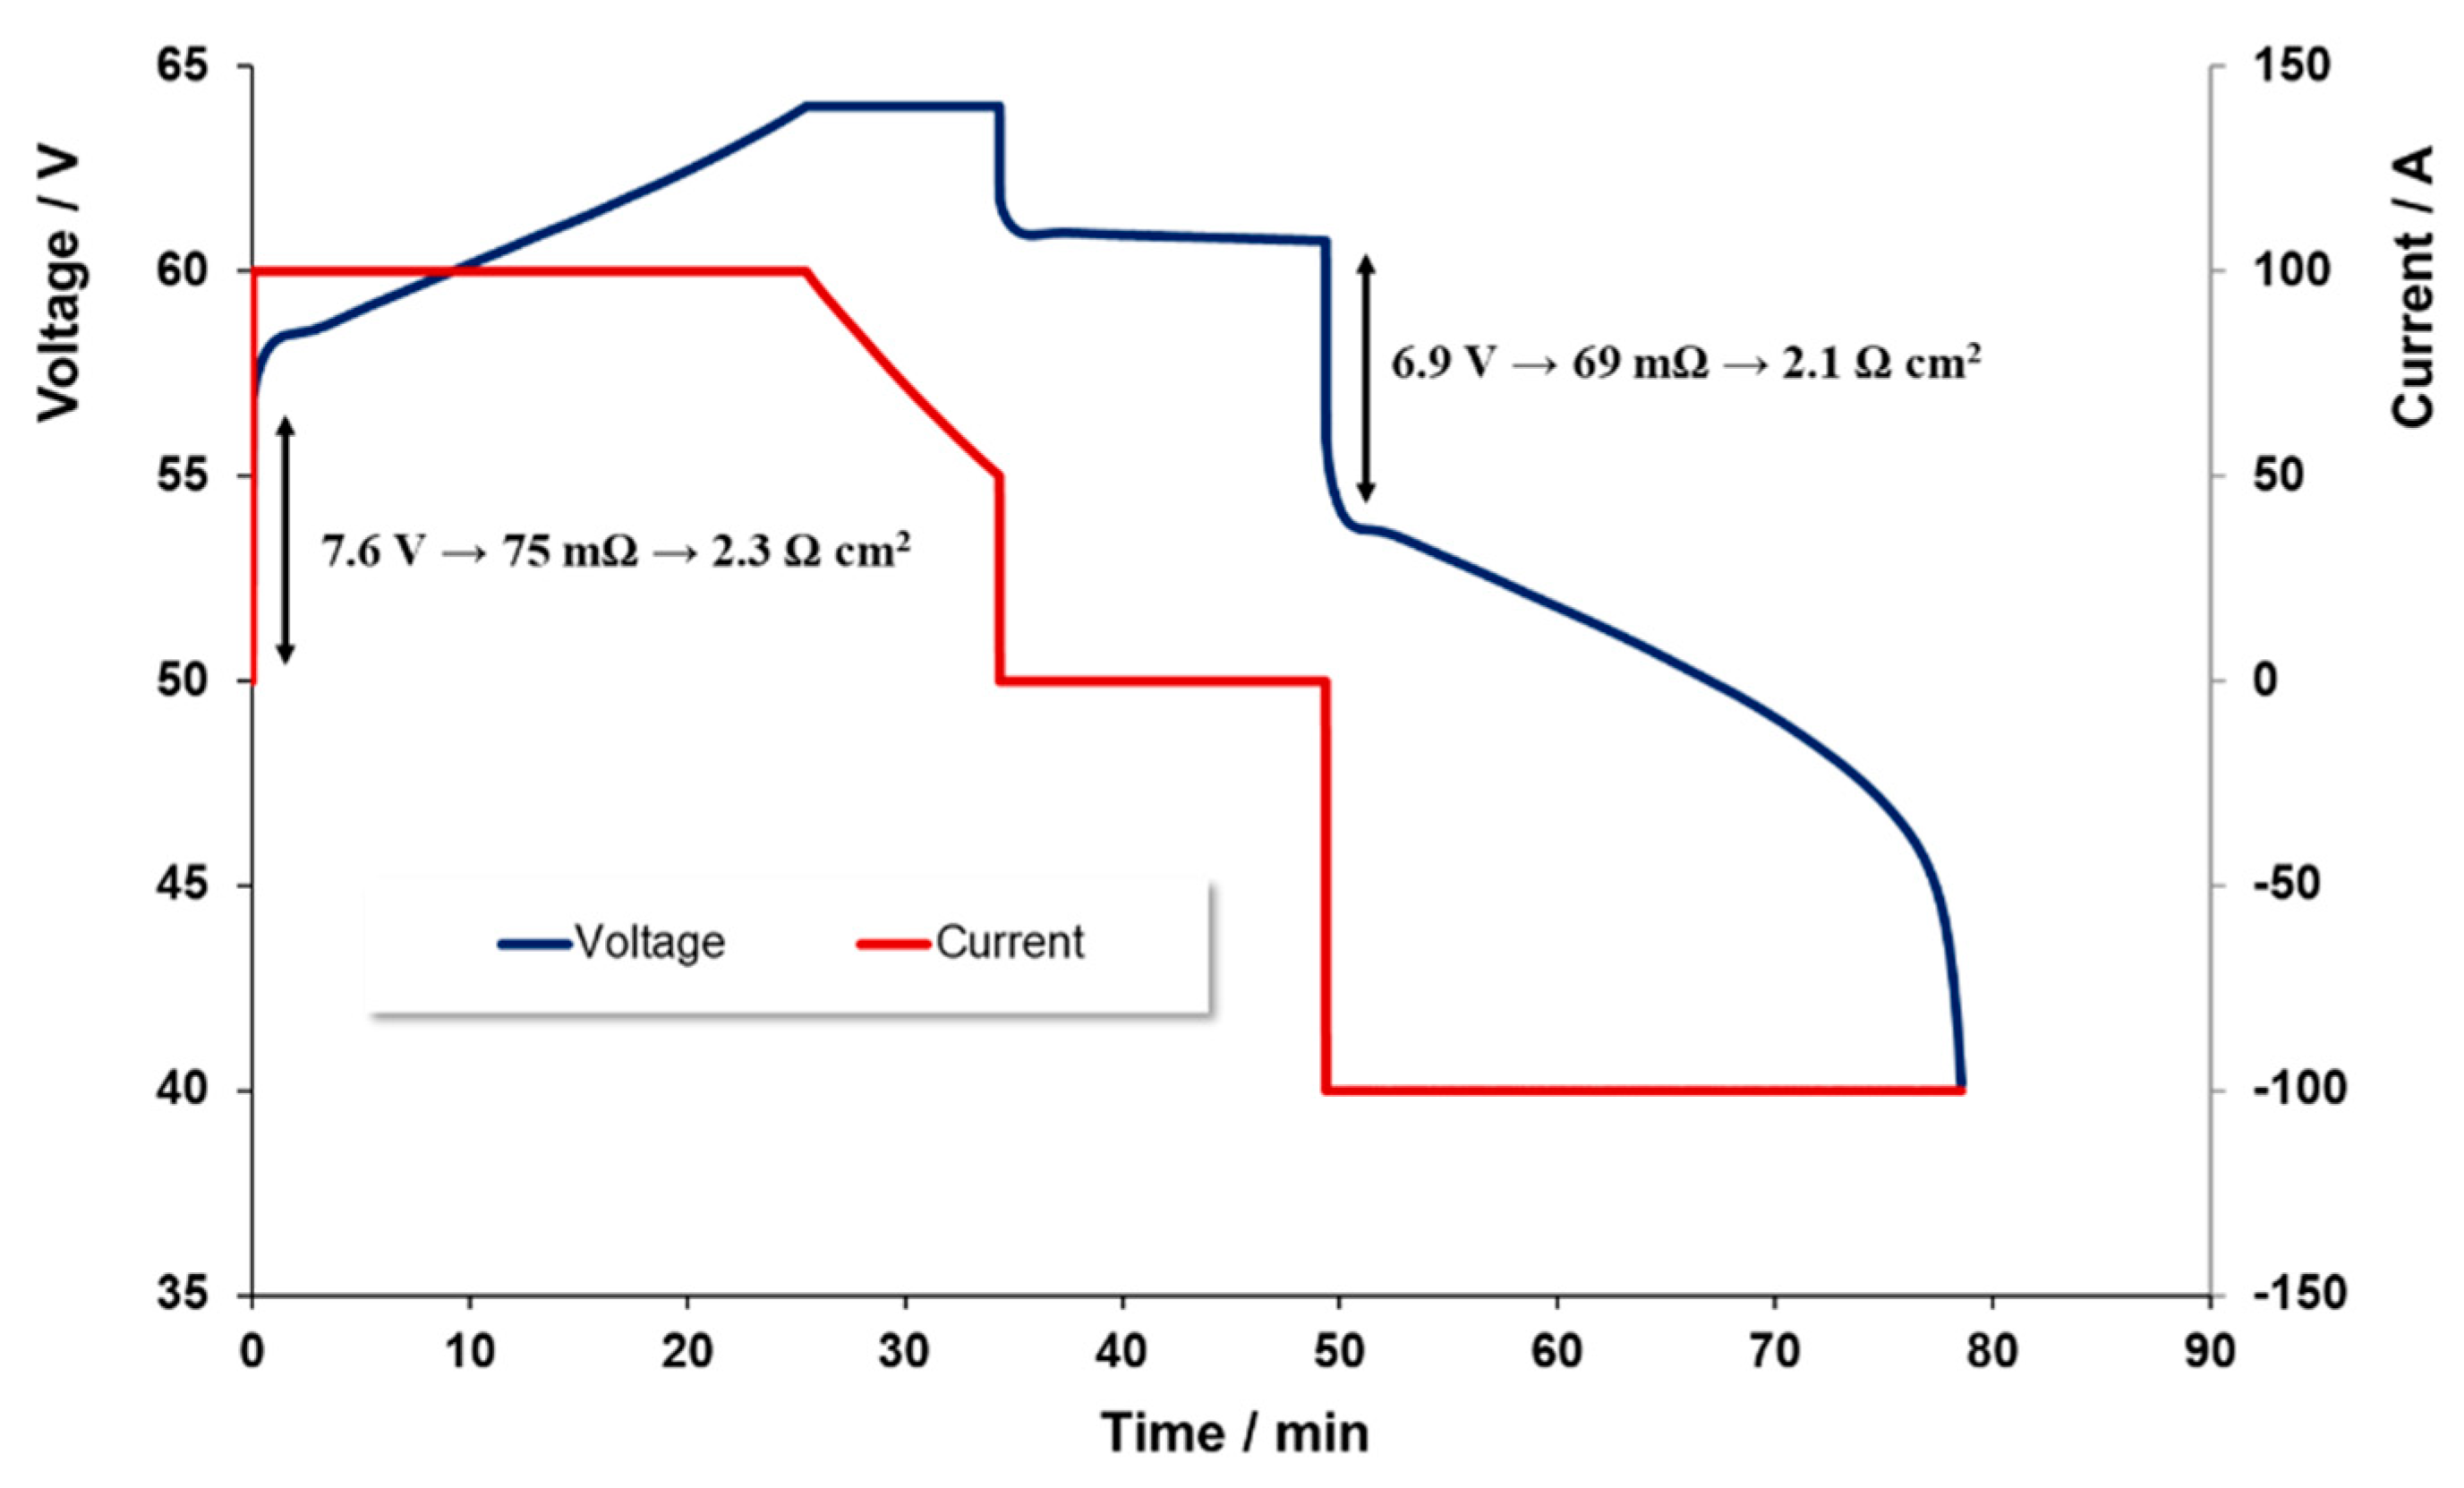
The purpose of peak power testing is to determine the sustained (30 s) discharge power capability of the battery at each of various states of charge (SOC). Note however, that this procedure does not measure the actual peak power of the battery.
The peak power test consists of performing 10 pulses at 10 states-of-charge, from 100% to 10% SOC in 10% intervals, during a single discharge. These SOC values are achieved by successively discharging the battery from a fully charged state to each % of SOC. At each specified SOC, the battery is discharged for 30 s with a current of 112.5 A or current density of A m
−2.
Figure 8 illustrates this sequence of steps. The same current values are used at all SOC levels.
The peak power capability (at a given SOC) can be calculated by deriving the battery resistance and equivalent IR-free voltage (see Equation (2)) from measured changes in battery voltage and current at that SOC. As noted by the arrows in
Figure 8, voltage and current for these calculations are measured just prior to and then near the end of each high current step to obtain the ΔV and ΔI values for that SOC. Battery resistance and IR-free voltage are computed as follows:
Peak Power Capability is then the minimum negative value calculated from any of the following four equations:
or:
or:
or:
Figure 9a shows the open circuit voltage and Ohmic resistance results, and
Figure 9b illustrates the peak power capability in the whole range of SOC for 900 A m
−2 as current density. This reactor showed a ohmic resistance increase of 25% when the electrolytes were at 13% SOC compared with the highest SOC, probably due to the limited active species availability at such a low state of charge.
The open circuit voltage may provide an indication of the SOC. The SOC measured here is the voltage value after 300 s at rest. The cell voltage is associated to the concentrations of vanadium ions in the two electrolytes by the following Nernst equations:
where E
0 is standard reduction potential, R is the gas constant, T is the temperature and F is the Faraday constant.
Figure 9a shows the relationship between the charge level and the OCV and illustrates what would be expected from the Nernst equation being applied to the stack reaction; a linear evolution with the SOC, with a narrow range of voltage, from 60 to 54 V in a range of SOC of 80 to 15%. At the lower limit, a state of charge 20%, it is observed from the figure that the OCV starts to decrease rapidly. A rapid increase would also have been observed beyond an 85% state of charge.
The results in
Figure 9b indicate a relatively high power capability at 1.38–1.49 kW m
−2 maintaining a reasonable voltage during the 30 s, performance a bit beyond the typical values of Vanadium redox flow batteries (1 kW m
−2) [
17], although commercial systems utilizing high performance electrodes reported values of 1.5 kW m
−2 [
18] and achieving 5.57 kW m
−2 in the case of the highest instantaneous value at 60% SOC obtained so far [
19].
7. Fast Charge Tests
The purpose of this test is to determine the fast charging capability of the battery. It consists of a progression of high charging rate steps where the efficiency of the system is determined.
The goal for fast charging is to recover the major quantity of the state of charge of the battery, starting from approximately 35% SOC, in 15 min.
This test has been conducted as a series of cycles at a progression of fast charge rates over a wide range attempting to define the conditions in which the 35% capacity in 15 min time is achieved efficiently.
For each charge protocol, the following sequence of steps has been performed:
- 1)
After fully charging of the battery (100 A CC-CV up to 64 V, cut-off current of 50 A), it was discharged to 35% SOC at a nominal constant current rate (800 A m−2).
- 2)
Charge the battery with constant current at the selected charge rate until the maximum voltage of 1.6 Vcell is reached.
- 3)
Fully discharge the battery at a nominal rate to determine the amount of the recharge (Ah) available for use.
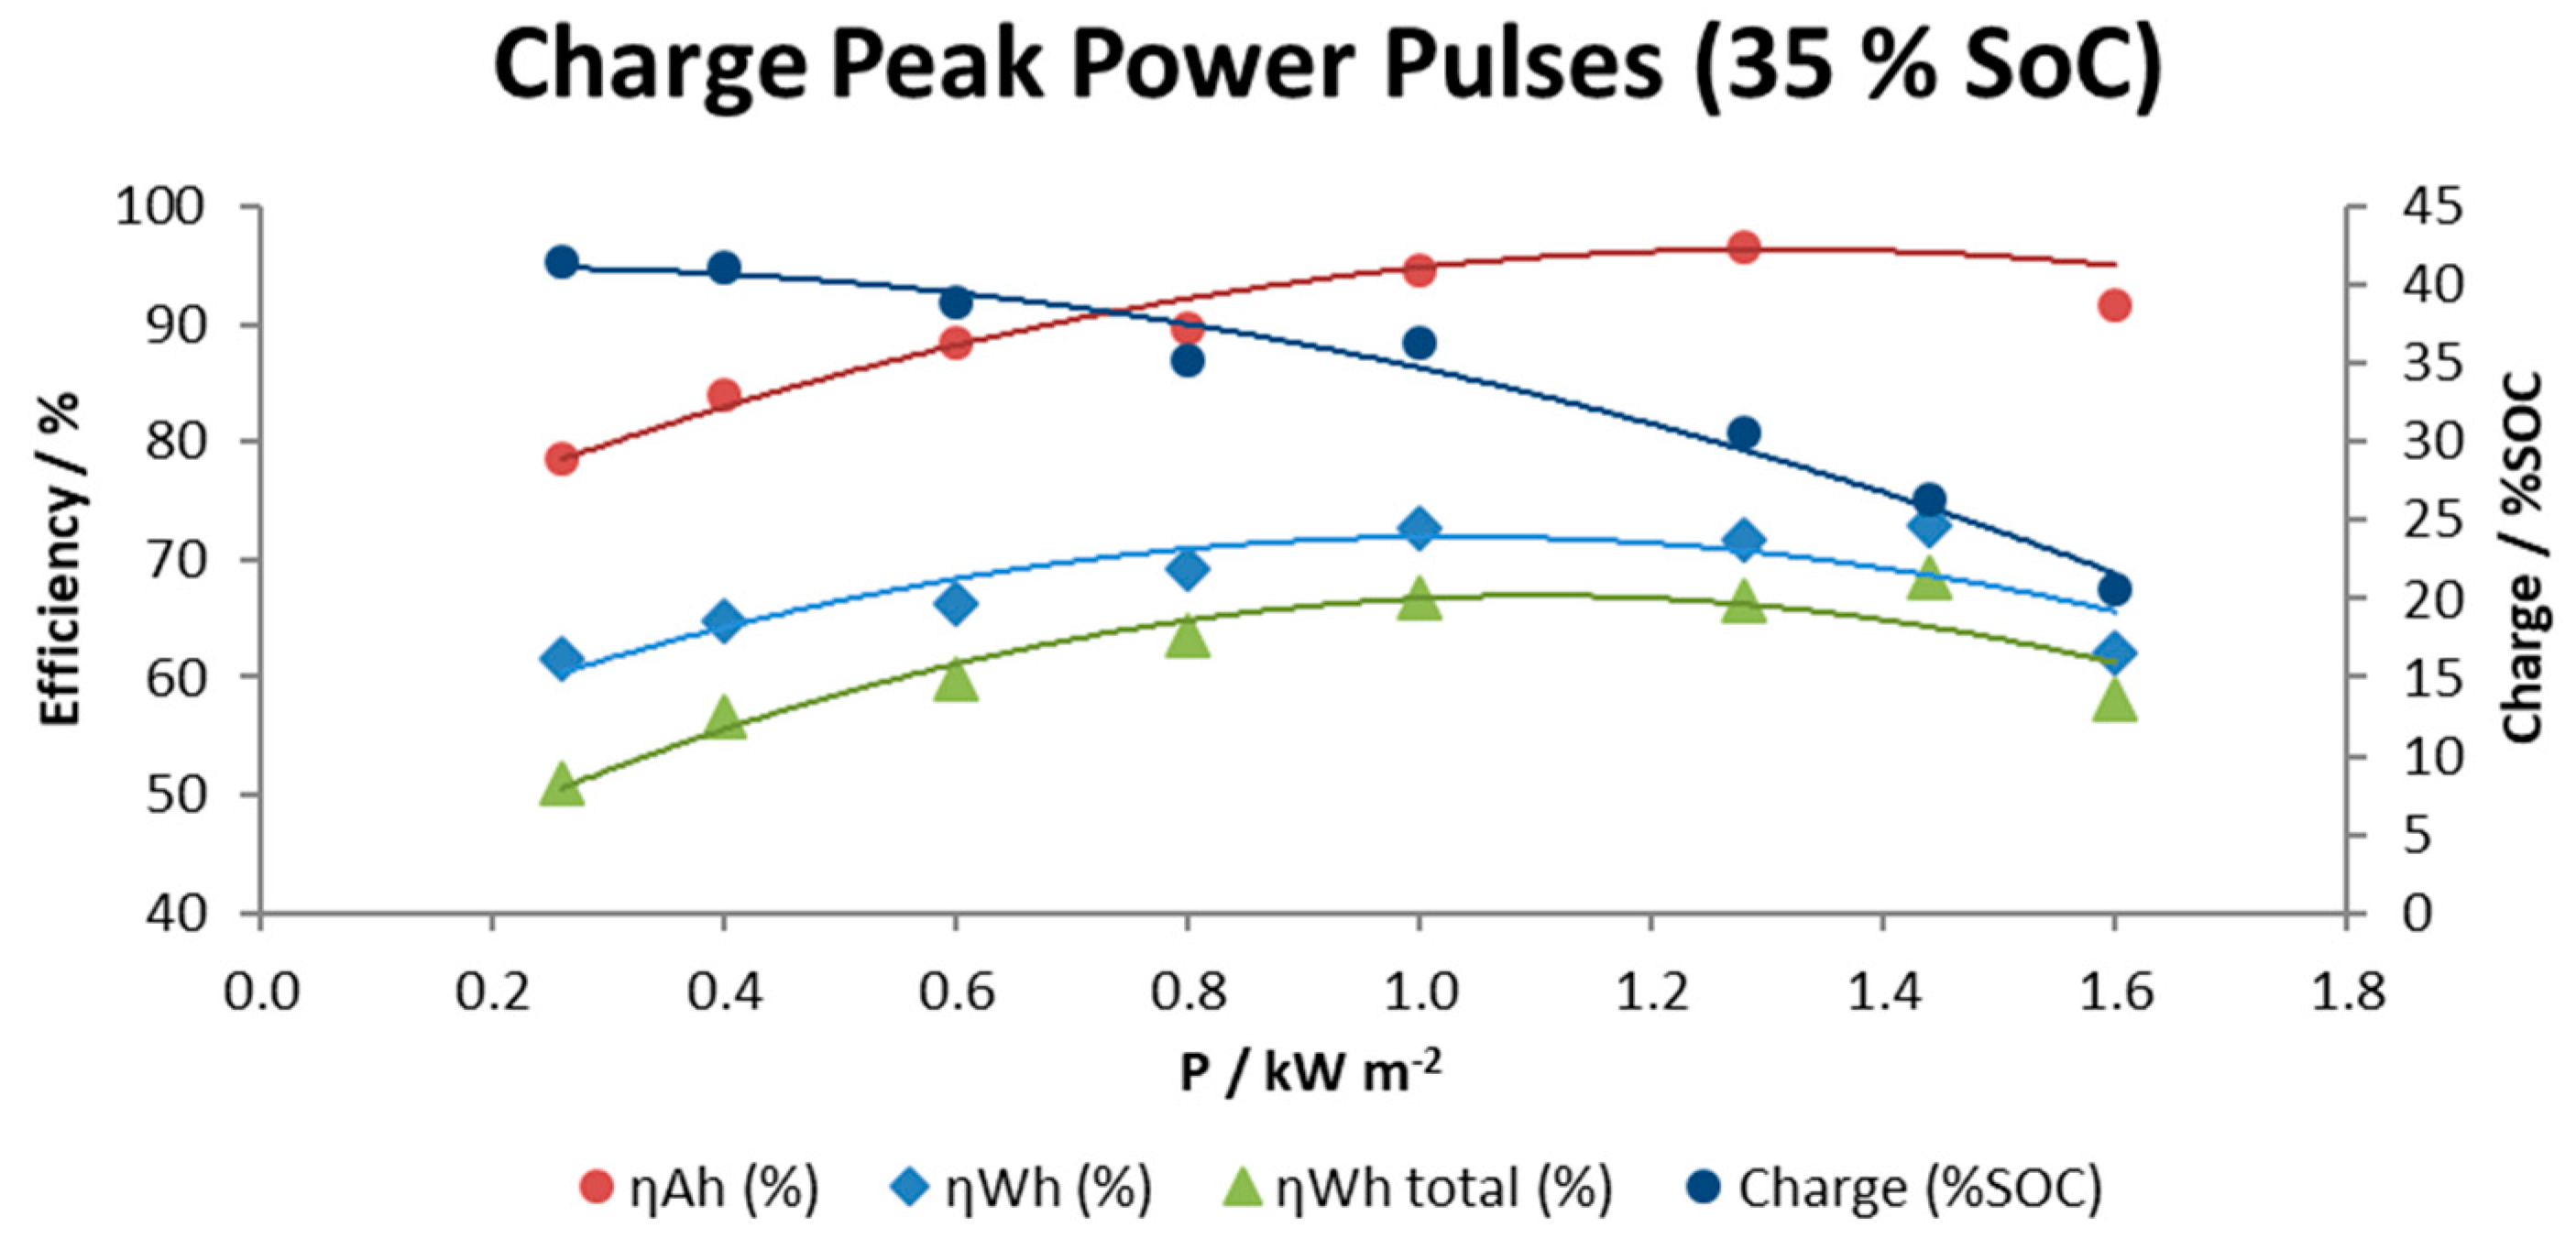
Figure 10 shows the specific data for this series of tests including plots of efficiencies (coulombic in Amps hour, energy in Watts per hour and total energy including the energy required to operate the pumps) and the percent of effective charge achieved until the maximum voltage is reached as a function of the charge rate.
Results obtained indicate that total energy efficiency is dependent on the power rate in such a way that high and very low power requirements cause a decay in global energy efficiency to values around 50–60%. However, it is possible to maintain a moderate global energy efficiency above 63% in a range between 0.8–1.4 kW m−2. As the charge rate was increased, the amount of real charge available for use was progressively lower from 42% SOC at 0.3 kW m−2 to 21% SOC at the highest charge rate 1.6 kW m−2.
8. Electrochemical Energy Efficiency and Coulombic Efficiency Optimizing the Flow Rate
In an effort to link pumping energy required to overcome the pressure losses of electrolyte circulation to the global efficiency of the battery (improving power output of the cell and/or demanding less input pumping power), we performed preliminary tests with charge–discharge cycles following a constant current–constant voltage (CC-CV) regime over a wide range of current intensities, at a constant electrolyte flow rate (900 L h−1 negative electrolyte).
This work was followed by investigating flow rate adaptation in order to develop a variable electrolyte flow rate strategy for achieving high system efficiency. In this way, the flow rate of the negative electrolyte has been modified throughout repeated charge and discharge cycles aiming to adapt the electrolyte pumping to the real electric requirement of the battery (based on Faraday’s law). The parameter used to manipulate the over-design magnitude of the flow rate was termed, “flow factor,” and is a multiple of the stoichiometric flow rate, altered at every interval of 10% state of charge (SOC) during cycling. The rationale of these tests was to flexibly adapt the flow of reactant ions so as to only provide the cell with the concentration of these species needed at a given state of charge and at a given current density. For instance, during the initial charge step, the pumps can afford to supply less reactant electrolyte, as it mostly contains the initial vanadium species that act as active material (hereinafter named creactant) and, thus, the pumps can work below the standard flow rate defined by the manufacturer (900 L h−1). Meanwhile, at the top of charge, the vanadium species that act as the active material are exhausted and the pumps should be forced to work above the standard flow rate to continue supplying reactant electrolyte to the circuit. Presumably this operational mode saves overall energy.
These variable flow rate tests, as well as standard cycling tests set at constant flow rates, were run over a range of applied current densities, which serve as an independent variable over which global efficiencies can be tracked. A trend in global efficiency with respect to current density was expected, such that an optimal current density and a maximum system global efficiency could be identified. By analyzing data from trials with currents of 50 A–112.5 A, parabolic trendlines were drawn and extrapolated to better analyze trends in battery efficiencies and understand the parameters which influence optimal battery performance. Once this performance is better understood and optimized, an on-board algorithm can be written to manage battery control and deliver a high-performance and high-efficiency system.
8.1. Charge-Discharge Cycles at Constant Flow Rate
The efficiencies vs current plots produced from the constant flow rate experiment (shown in
Figure 11) exhibit typical trends, thus validating the operational procedures and recordings of these experiments. From
Figure 11, it can be seen that when the stack is operated at constant flow rate, the Coulombic efficiency (CE) of the stack increases with an increase current density. This trend can be attributed to a shorter charge and discharge cycle time with increasing current density, thereby reducing the diffusion of the electrochemical active species through the membrane and, subsequently the rate of self-discharge of the cell. Shorter charge times are also beneficial to decrease the total losses due to shunt currents. However, with increasing current density, the overall polarization of the stack becomes larger; thus, a decrease on the VE is also observed. The change in VE causes the EE curve to have a slightly parabolic shape tending to decrease at high current intensities since EE = CE × VE.
When including the effect of pumping energy losses, a further decrease in efficiency (EEglobal) is observed at low current densities. This is due to the fact that at lower currents, excessive pumping (i.e., flow rates far above the stoichiometric) is applied which increases the energy required to operate the pumps—a parasitic loss for the battery. The global efficiency (EEglobal) also shows low efficiency at high current densities, following the voltage efficiency (VE) trend, due to concentration overpotentials which consequently lower system efficiency.
The energy density is also compromised when operating under low and high power demand, especially in this last case where values decrease to 12.5 Wh L−1. The highest values of energy density (18.0–18.9 Wh L−1) were obtained at relatively low current densities; 37.5–50 A (300–400 A m−2).
It is possible to establish a range of current densities that can maintain high overall efficiency between 68 and 76 Amps, equivalent to 544 and 608 A m
−2. From
Table 2, it can be seen that in this zone, the coulombic, voltage, energy and global energy efficiency was improved to 91.1%, 80.9%, 73.3% and 64.0%, respectively, at a current intensity of 75 A (600 A m
−2), and a maximum average output power of 3.7 kW (0.7 kW m
−2) was determined.
8.2. Charge-Discharge Cycles at Variable Flow Rate
Previous studies have introduced a variable flow rate method [
20,
21,
22] based on the theoretical flow rate derived from Faraday’s law applied during the whole charge or discharge process (see Equation (9)):
This equation determines the volumetric flow utilization and links the flow rate to the current applied and to the SOC (i.e., creactant) in such a way that the following flow rate vs SOC curves at different currents can be devised when a flow factor equivalent to 5 is used.
According to
Figure 12, adapting the flow rate to the current and the SOC may save pumping energy throughout the initial and middle states of charge/discharge while significantly reducing concentration overpotential at the end of discharge. In the graph, a reference 900 L h
−1 flow rate equivalent to constant flow procedure is also shown.
We believe that the theoretical variable flow rate could be tuned to cater to the necessities at different zones of the SOC and, even more critically, at different steps—charge versus discharge. For example, by working below a constant flow factor of 5 under certain conditions, such as at the end of the discharge, the final SOC can be adjusted by decreasing the flow factor (i.e., the flow rate) and forcing a premature discharge voltage cut-off. This is graphically described in
Figure 13 which shows the volumetric flow rate evolution at different SOCs for a 100 A discharge. Again, a line corresponding to 900 L h
−1 flow rate equivalent to the constant flow procedure is also included for purposes of comparison. The plot in
Figure 13, describes a model of system behavior. There is a maximum operable flow rate (plotted at 1200 L h
−1) determined by the manufacturer which the model can surpass but along which experimental flow rates may only taper. Therefore, the high output capability at low SOC suggested in the model below has not yet been achieved.
In order to study the effect of this variable flow factor operational mode on battery efficiency, a non-optimized flow factor profile was selected for charge and other for discharge. The flow factor profiles detailed for every 10 % SOC range can be seen in
Table 3.
The efficiencies vs current plots (
Figure 14) obtained from the variable flow factor experiments proposed here show that the curves do not have the typical forms observed at constant flow. The shape of the CE is similar but the VE trend, rather than decreasing linearly, has a curved shape at high current, indicating a mitigation of the usual fall at high currents. This effect may be due to the increase in electrolyte flow rate when c
reactant concentrations begin to run low, i.e., from the second half of the process (charge or discharge steps) until the voltage cut-off. When compared to the constant flow rate cases, adapting the flow rate reduces concentration overpotential, thus allowing lower voltage in operation in charge and higher voltage output in discharge, which increases the VE. This effect is particularly significant at high currents, when the algorithm proposed is demanding large flow rates, and this is consistent with the evolution in voltaic efficiency.
It is important to note that there is an evident limitation of cycling at intensities below 50 A since the flow rate demanded by the system (according to the algorithm proposed) is much lower than the minimum operative flow rate limits detected for the stack. Further optimization of the profile of variable flow rates would broaden the range of current intensities used.
Since EE = CE × VE, the change of VE causes the EE to have a relatively linear as opposed to a parabolic shape dependence. When considering the effect of pumping energy losses, a rather flat curve in the EEglobal is observed over the entire range of current intensity, which is an indication of the flexibility provided by this mode of operation.
Unlike the constant flow rate profile, adapting the flow rate produces energy density values stable over the whole range of current (13.5–14.5 Wh L
−1) indicating that under this control configuration the system is versatile, charging and discharging in a wide range of current without compromising performance. A similar approach was followed by Li et al. [
21] However, energy densities slightly below those of the constant flow rate profile were obtained. Under the conditions studied, the energy density obtained is 30% lower when compared with constant flow rate profile.
The calculated efficiencies and energy efficiency losses due to the consumption of the pumps (global efficiency minus energy efficiency) of the variable flow rate experiments at a range of applied current densities are summarized in
Table 4. Based on these data, it is clear that over a wide range of currents between 62.5 and 100 Amps, equivalent to 500 and 800 A m
−2 current densities, a relatively high global energy efficiency can be maintained. From
Table 4, it can be seen that in this zone the coulombic, voltage, energy and global energy efficiency was on average 91.6%, 79.8%, 73.1% and 65.0%, respectively, with a maximum average output power between 3.0 and 5.4 kW (0.6–1.1 kW m
−2).
8.3. Comparison Constant Versus Variable Flow Rate
As shown below, the performance comparison between constant and variable flow rate adapted as a function of SOC and current density may be more easily visualized graphically. In each graph, the green plot represents the efficiency for the constant flow rate experiment, and the purple plot represents the efficiency for the variable flow rate experiment. The Wh L−1 labels indicate the output energy density at a given applied current in order to keep track of output energy as it compares with efficiency.
When comparing the coulombic efficiency curves for both sets of experiments (
Figure 15), it should be noted that the shapes of both curves are very similar. A Coulombic efficiency curve is expected to show a slight decay to the right of its peak (where very high currents are demanded), and strong decay to the left [
23]. However, it should also be noted that the drop in capacity at low current densities is more significant in the constant versus the variable flow rate data. This indicates that at low current densities, by applying 900 L h
−1 one may cause a slight over pumping of the system, where the extra reactant does not need to be employed. By utilizing a variable flow rate method, the system can improve slightly the Coloumbic efficiency and save energy by applying an adequate lower flow rate at lower current densities.
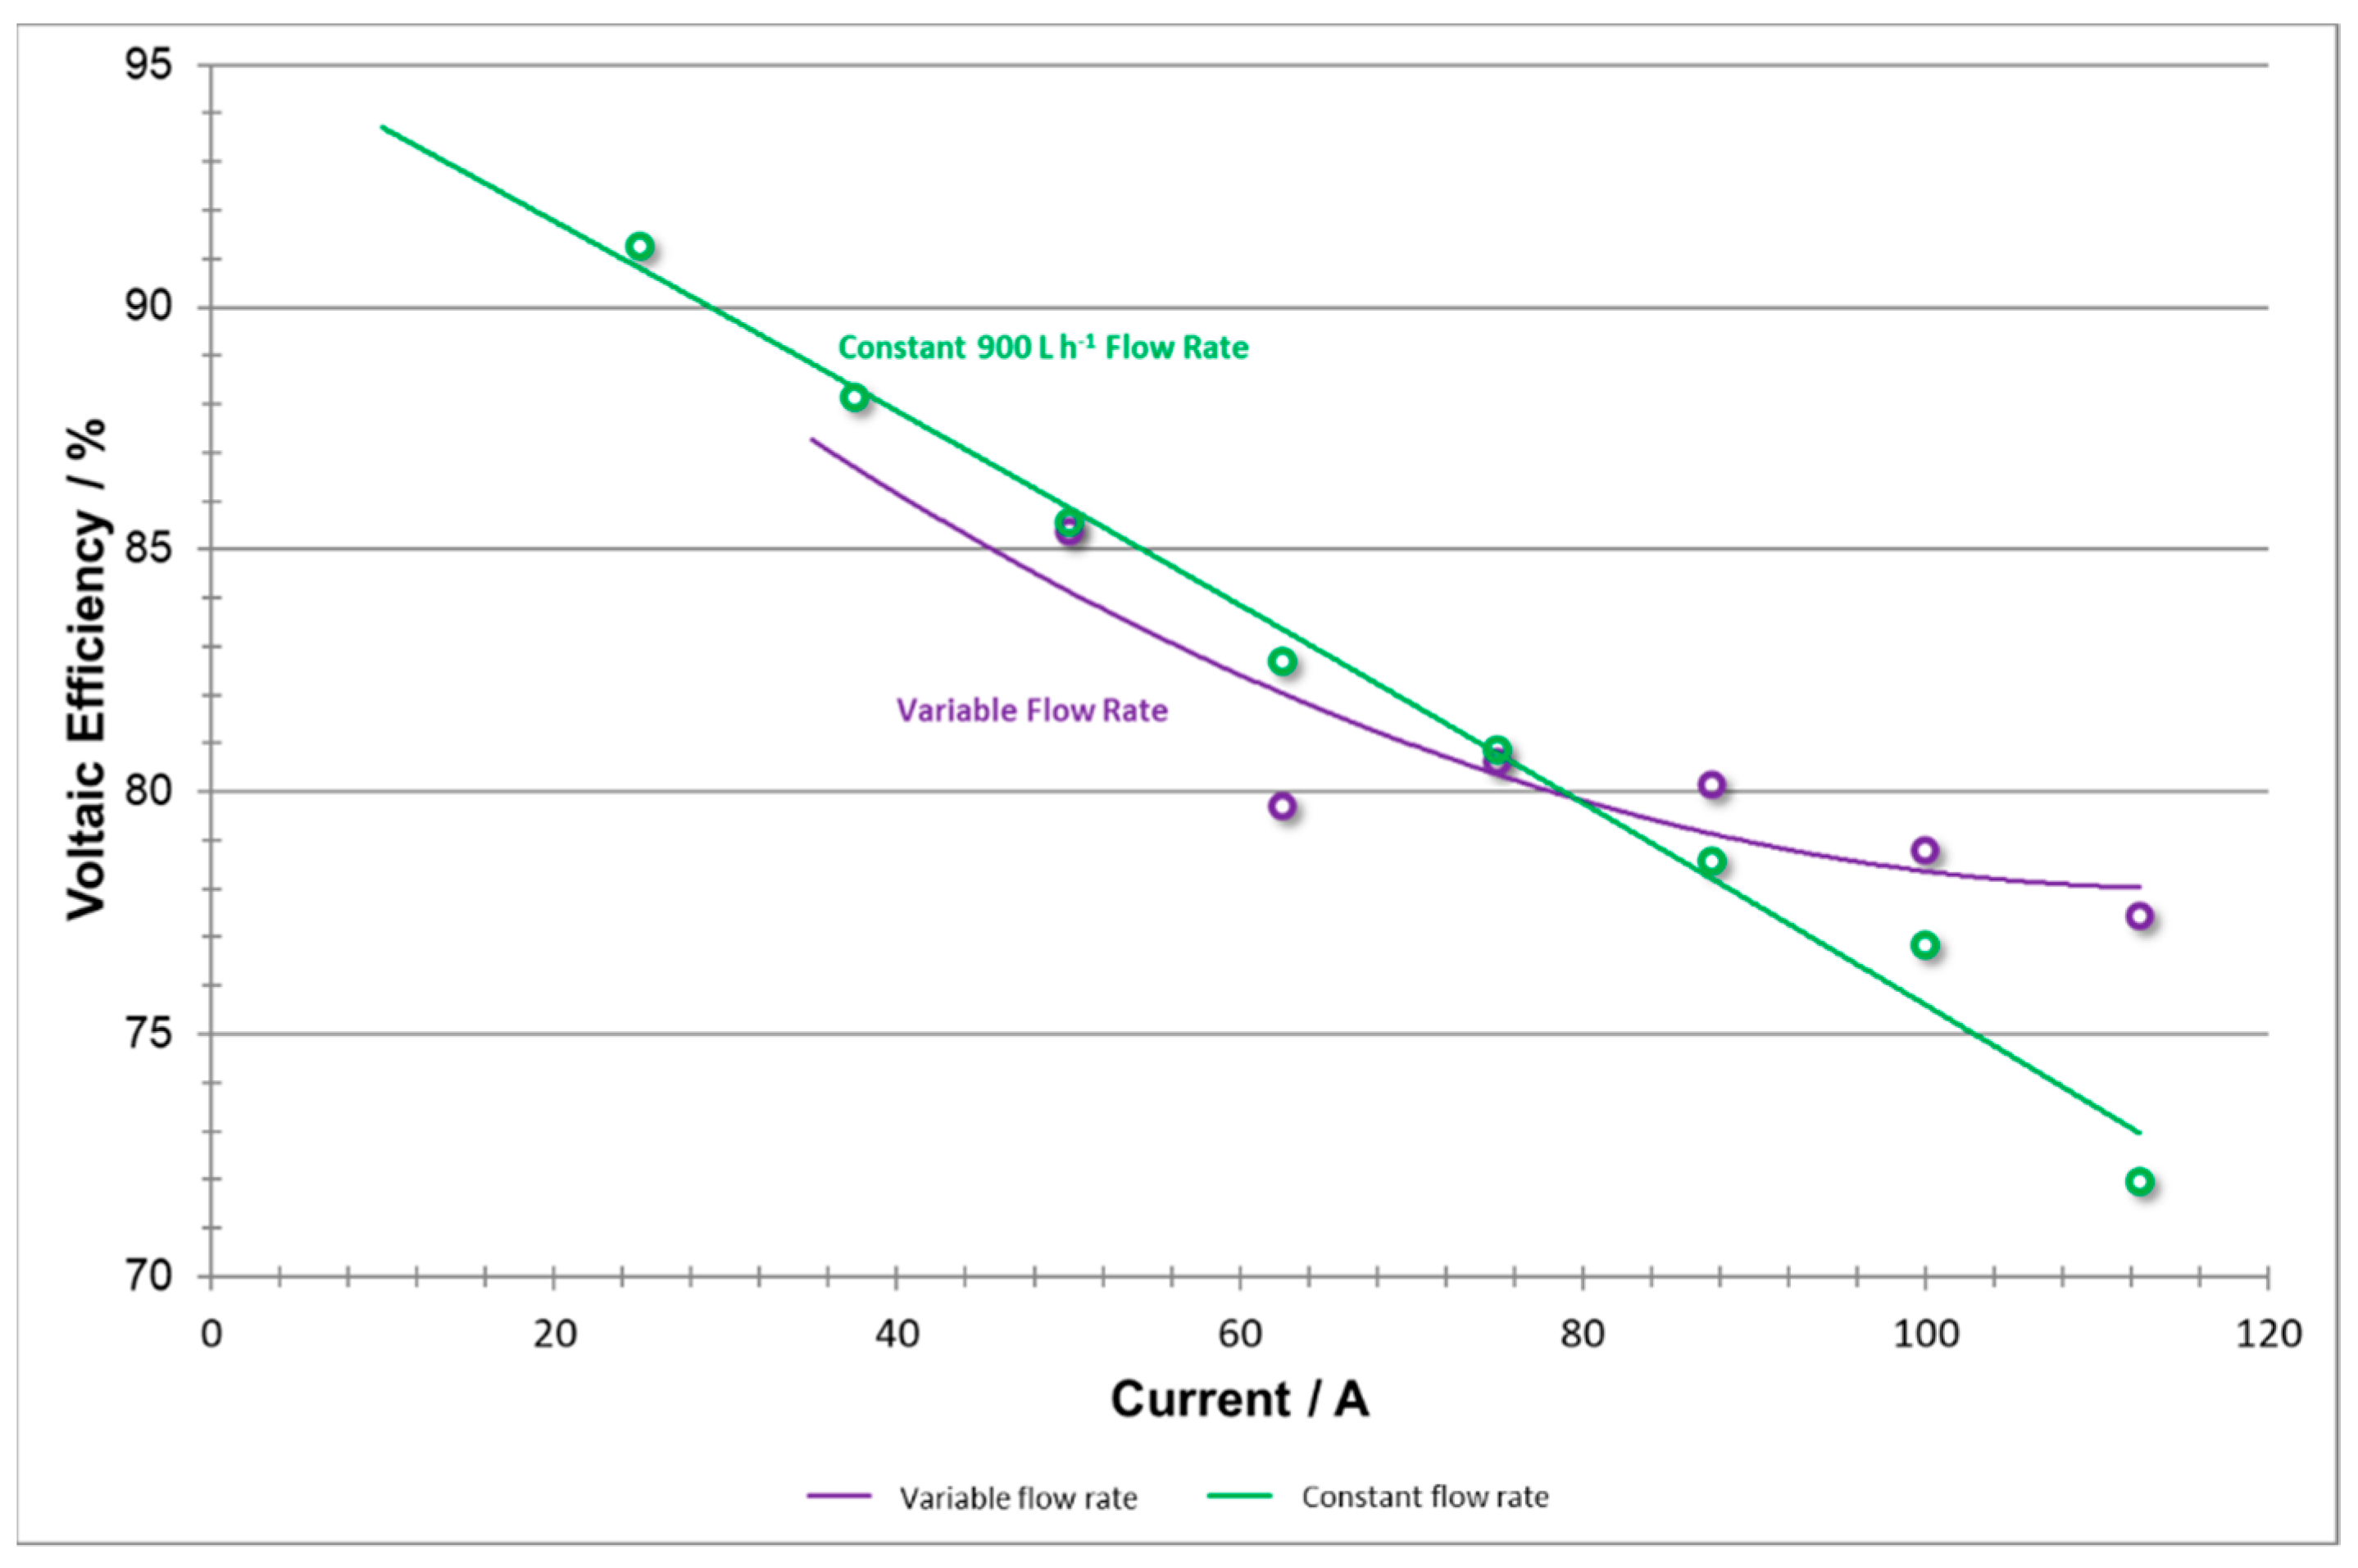
Voltaic efficiency (shown in
Figure 16) generally exhibits a negative linear trend with respect to current, as shown by the constant flow rate data [
14]. However, when the variable flow rate experiment was implemented, voltaic efficiency values were not constrained to follow this consistent downward trend. Instead, at high current densities, the data shows positive concavity. This may be explained by adapting flow rate to meet the system reaction demand which avoids concentration polarization. High coulombic efficiencies using low flow rates were also reported by Joerissen et al. [
7].
The constant flow rate method will exhibit a larger voltage drop as current density increases and amplifies the concentration overpotential. The variable flow rate method is able to adequately adjust toward meeting those demands and thus raising the voltaic efficiency.
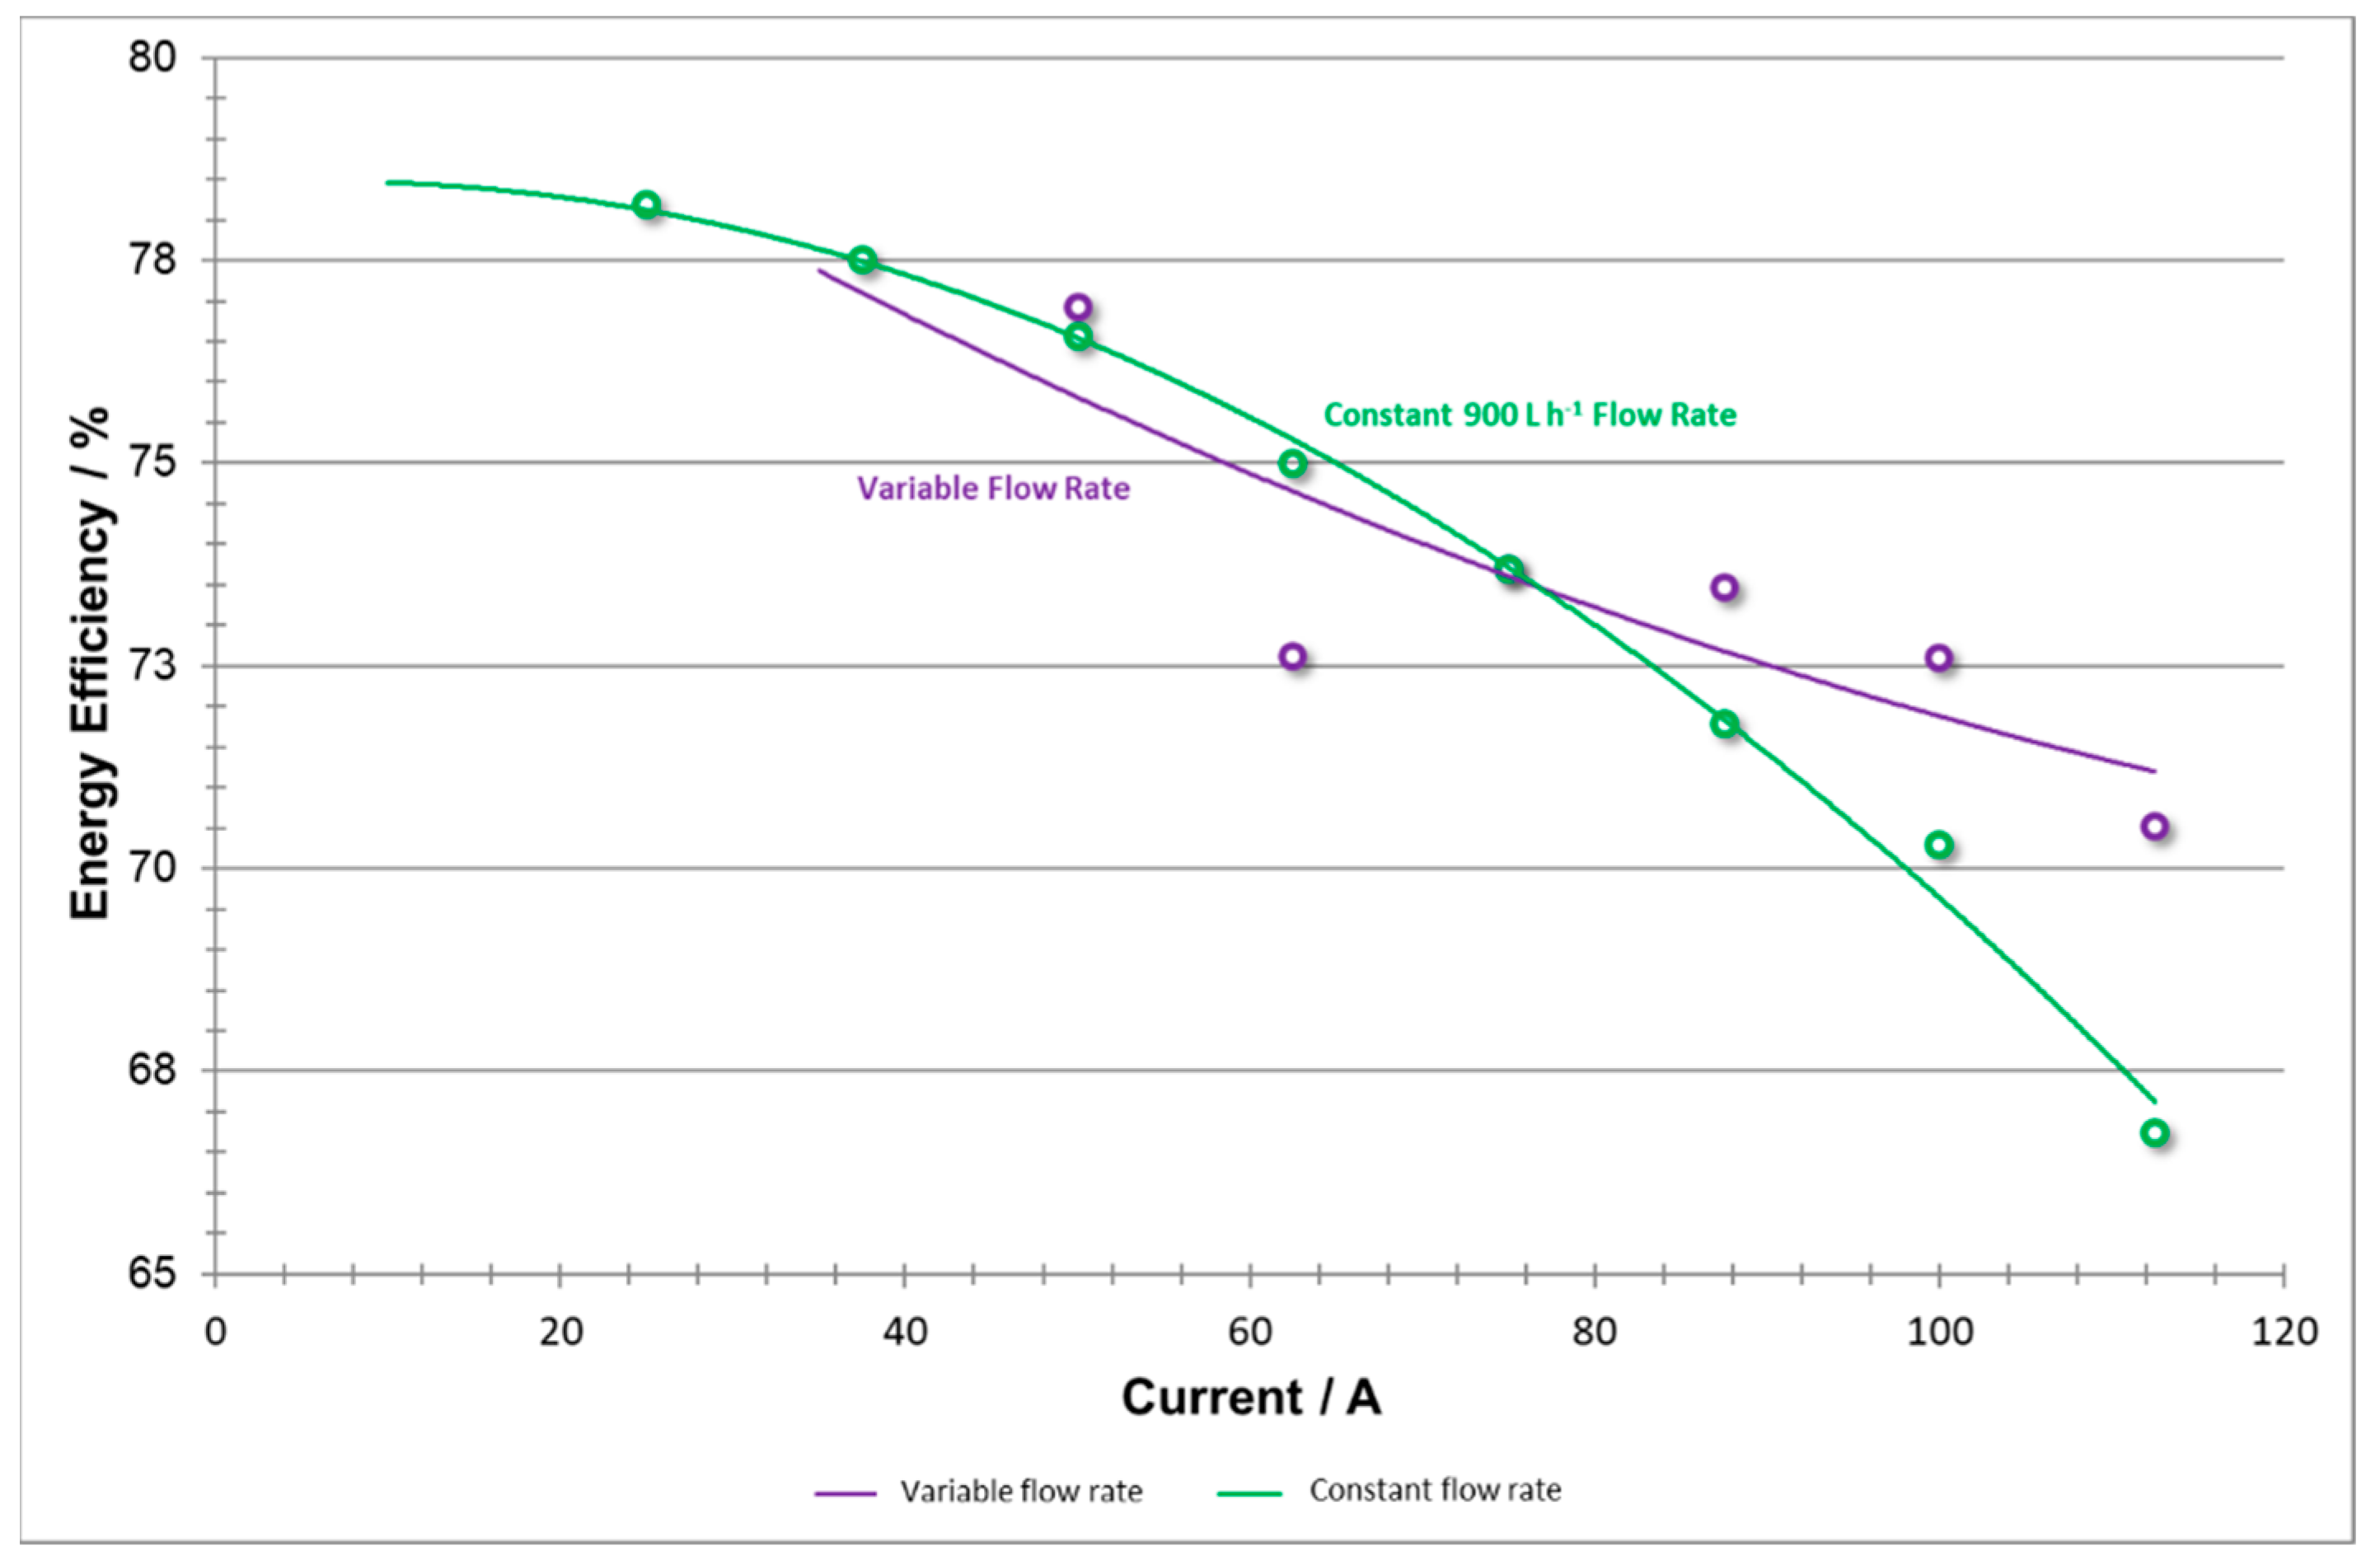
The calculations for energy efficiency (shown in
Figure 17) represent the energy output capability of the system but do not take into account the input energy consumed by the pumps. As detailed in the above analyses, low current density efficiency improvements (sourced from coulombic efficiency) can be attributed to the lesser flow rate applied by the pumps. Meanwhile, the high current density efficiency improvements (sourced from voltaic efficiency) can be associated with higher flow rates applied by the pumps which reduced concentration overpotentials and improve efficiency at the expense of intense pumping.
It is also believed that, if the pumps were not constrained by a maximum flow rate (rated at 1200 L h−1) as they were in both of these trials, the high current density phase could have used even higher flow rates to further adapt flow rates to increased efficiency.
Global energy efficiency that includes pumping energy losses (shown in
Figure 18) serves as an illustration of the overall improvements and changes introduced to the system with the variable flow rate method. By incorporating energy consumption of pumping into the total energy requirements, one provides a figure of merit towards balancing out energy output and input which at some current densities may be at odds, both increasing and decreasing the efficiency of the system. These two plots illustrate a significant change in the overall efficiency of the system at both low and high current densities as a result of reducing unnecessary pumping energies, maintaining a productive system at low currents, and avoiding over-pumping to maintain a productive system at high currents.
As stated above, if there were not a maximum flow rate setting for a further set of trials, the higher current data values might exhibit an even flatter shape in EEglobal efficiencies. Additionally, the data for energy values show that the variable test energies supplied did not lag far behind those of the constant flow rate test. However, a trade-off between pumping consumption and concentration overpotential in the stack needs to be adjusted further in order to optimize the battery performance.
In this case, an ideal system would exhibit a flat shape, as this would demonstrate a versatile system that can operate at high energy efficiencies, with low consumption costs, over a diverse range of applied current densities. By utilizing the variable flow rate system, this work has demonstrated that further research should be directed in this direction. At low current densities, efficiency values have improved by several percentage points. By further optimizing the variable flow rate and flow factor settings, increasingly higher efficiencies are likely possible.
To conclude,
Figure 19 shows that reducing unnecessary pumping vastly reduces the energy consumed by pumps, especially at relatively low power demand, whereas at high densities, the consumption remained relatively the same.
9. Conclusions
A complete and systematic set of experiments of a 5 kW/5 kWh vanadium flow system has been performed to characterize the battery from a power system point of view. The proposed evaluation uses nominal charge-discharge procedures, polarization pulses, peak power tests and fast charging capability for an industrial stack and further considers the effects of volumetric flow rate versus state of charge and current levels.
The characterization of the flow battery system revealed that it had an overall system AC efficiency of 60%. One of the main reasons for this lower efficiency is the nearly constant auxiliary power consumption from pumps that amounts to 8–9% of rated power. Power electronics also represent another small loss in efficiency. However, the electrochemical stack itself has a complete cycle efficiency around 73%, under the conditions studied, a value slightly lower than the values typically shown in the literature, around 80%.
Regarding efficiency, it has been observed that, under the conditions studied and for this specific stack technology, reducing unnecessary pumping energy consumption by adapting flow rates as a function of parameters such as state of charge and current levels is helpful in maintaining relatively high system efficiency over a wide range of power output. As both concentration overpotential and pump power are associated with flow rate, a variable flow rate is preferable for operating VRB systems where the round trip efficiency (rather than the stack energy efficiency) is highly valued.
Unfortunately, the intended improvement in the global efficiency (approximated as a 5% enhancement) has not yet been achieved by the proposed strategy based on flow rate optimization. However, the flow factor evolution selected at this stage needs further optimizing in order to determine the trade-off between concentration overpotential and pump losses. Therefore, enhancing the system performance is envisaged through a better configuration of the flow factors in order to achieve total system efficiencies of 70–75% required for achieving a marketable product.
Based on this research, the development of a 50 kW VRB battery system is now in progress at Energy Storage Solutions E22 facilities. Furthermore, IMDEA Energy Institute is working in advanced testing features that can also be used to predict stack efficiency under emerging applications and provide an insight into battery design and optimization. Both works will be reported in the near future.

 ,
, 


