


Electrode Kinetic Data: Geometric vs. Real Surface Area †

1
Institut für Chemie, Chemnitz University of Technology, D-09107 Chemnitz, Germany
2
Key Laboratory for Anisotropy and Texture of Materials (MoE), School of Materials Science and Engineering, Northeastern University, Shenyang 110819, China
3
Department of Electrochemistry, Institute of Chemistry, Saint Petersburg State University, 7/9 Universitetskaya Nab., 199034 St. Petersburg, Russia
4
State Key Laboratory of Materials-oriented Chemical Engineering, School of Energy Science and Engineering, Nanjing Tech University, Nanjing 211816, China
*
Author to whom correspondence should be addressed.
†
Poster S07a-038 presented at the 69th ISE-Meeting, Bologna, Italy, 2–7 September 2018.
Batteries 2022, 8(10), 146; https://doi.org/10.3390/batteries8100146
Submission received: 30 July 2022
/
Revised: 21 August 2022
/
Accepted: 21 September 2022
/
Published: 27 September 2022
(This article belongs to the Special Issue Feature Papers to Celebrate the First Impact Factor of Batteries)
Abstract
:Kinetic data reporting the rate of electron transfer across an electrified interface are of fundamental as well as practical importance. They report the electric current caused by coupling the flow of electrons inside the electronically conducting electrode and the flow of ions in the adjacent ionically conducting phase. At equilibrium or rest, potential currents in both directions at the established dynamic equilibrium have the same absolute value: the net current is zero. This current describes the electrocatalytic activity of an electrode and is called the exchange current; with respect to the surface area, it is called the exchange current density. This study inspected the actually used surface areas because the reported activities may depend critically on the selection of this area. Charge transfer resistances corresponding to exchange currents I0 were determined for a simple redox system using a platinum disc electrode with constant geometric surface area but variable roughness. At all studied degrees of roughness, changes in I0 were found. With an electrochemically active surface area, exchange current densities j0 could be calculated, but the obtained values showed a dependency on roughness that could not be accounted for by using this surface area instead of the geometric one. It is suggested that j0 may be reported with respect to geometric surface area, but at least roughness data of the studied electrode should be provided.
1. Introduction
Kinetic data for electrode reactions reported as exchange currents I0 are normalized with respect to the electrode surface area A and given as exchange current densities j0 = I0/A or heterogeneous rate constants, or finally for standard concentrations as standard exchange current densities j00 [1,2]. Calculation requires knowledge of the electrode surface area A. In the cases of well-defined single-crystal surfaces or liquid metal electrodes, the geometric surface area is well defined; the true surface area equals the geometric surface.
In the case of rough electrodes, the true surface area (not to be confused with the electrochemically active surface area (EASA); sometimes called ECSA [3]) may differ substantially from the geometric one. The roughness factor Rf (also named fr [4]) is defined as the ratio of true surface area Atrue vs. geometric surface area Ageo according to
reflects this ratio. With porous materials, fabrics, felts, and other 3D materials, the relationship between the geometric surface area of, e.g., a graphite felt disc, and the true surface area is possibly even more complicated. To escape this dilemma, calculation of j0 based on the surface area determined by the BET method (see below) has been proposed [5], although the relationship between the BET surface area, exchange current, exchange current density, and actually utilized electrode surface area was critically examined much earlier [6,7]. The use of the BET surface area in calculations of j0 was found to be problematic at least, and possibly inadequate. The need to take into account the actual surface area has been addressed previously [8]. Claimed improvements in electrocatalytic activity may simply have been the result of an increased surface area without any increase in catalytic activity. The definition of the total surface area as the product of the BET surface area multiplied by the sample density divided by the height of the electrode (a graphite felt in this study) according to [5,9] apparently has not added to a better understanding, and accordingly, its use appears to be rare. More recently, the lack of any relationship between the BETR surface area and the EASA has been stressed, while the use of microelectrodes as an option even for studies with applied large current densities has been suggested [10].
Rf = Atrue/Ageo
The true surface area may also differ from the EASA due to, e.g., incomplete wetting or insufficient electrolyte penetration into porous electrodes, also resulting in incomplete wetting of the internal surface area [6,11]. Measurement of the true surface area is attempted with various methods. Possibly the most frequently used method is the gas-adsorption method according to Brunauer−Emmett−Teller (BET) [12,13,14]. The choice of the analyzing gas significantly influences the obtained surface area values; thus, reporting the results must always include details regarding the employed gas. The obtained values only approach the true surface area because they include only those parts of the true surface area accessible to the adsorbed gas; the internal surface area of small or very small pores not accessible to the selected gas will not be included. Porosimetry employing various liquids (alcohols, mercury, etc.) is used to measure the pore volume inside a porous material and the pore size distribution. In a next step, the surface area may be calculated from these data. Temperature-programmed desorption of adsorbed oxygen can be used with materials showing sufficient interaction with dioxygen. The results may show different fractions of the total reported area assigned to surfaces of different reactivity, and some surfaces showing no reactivity at all might go unreported. More details on surface differences in terms of reactivity will be discussed below.
Rough surfaces of materials showing no porosity can be examined using atomic force microscopy (AFM). Using the obtained surface topographies, surface areas can be calculated [15] by utilizing the capacitive component of the equivalent circuit element in the evaluation of impedance data assigned to adsorption (presumably of species in the dioxygen evolution reaction studied in this investigation) as a reference. The authors suggest that this capacity reflects the surface area active in this process; they actually propose the use of this reaction for determination of surface area of oxidic electrocatalysts.
Overviews and reviews of at least selected methods of measurement of surface areas are available and will be addressed below.
The EASA differs from the previously mentioned surface areas in terms of numerical values and is also qualitatively different: only the interface (more precisely, the electrochemical interface) between the ionically conducting and the electronically conducting areas participating in the electrode reaction is addressed.
Determination of the EASA has been a frequent subject of research, and reviews are available [4,16,17,18]; for descriptions and details of selected methods, see also [10,15,19,20,21,22]. Specific problems encountered with substrates such as palladium also have been studied [23]. These methods included determination of the differential double layer capacity using cyclic voltammetry or impedance data [24], various electrochemical relaxation techniques [25], measurement of the charge associated with oxidation of adsorbed carbon monoxide, stripping of adsorbed hydrogen atoms, and underpotential metal deposition. Problems in data acquisition and evaluation with porous electrodes when using cyclic voltammetry have been addressed [26,27,28].
Without stating it explicitly in most reports, the geometric surface area was used nevertheless in calculations of j0. Highly porous or 3D materials such as graphite felts have an apparent or geometric surface area that is easily measured; this area (e.g., the diameter of a graphite felt disc) was mostly used in the reporting. In an attempt to determine the true surface areas using various methods, Schweiss et al. [5] noticed considerable differences in exchange current densities obtained with respect to the geometric electrode surface area and something apparently closer to the true surface area. This property, called the carbon surface area, total carbon surface area, and total surface area of carbon (within a few lines of the report) for various felt materials (carbon felt, graphite felt, and activated graphite felt) used as electrodes in a redox flow battery (RFB) was presumably the double-layer capacity reported elsewhere in this text obtained from impedance measurements performed at the electrode potentials where the negative and positive electrodes were operating. Values of j0 calculated (as commonly done) with respect to the geometric surface area of the felt supported the frequent claim of poorer kinetics of the negative electrode as compared to the kinetics of the positive one. Calculations taking into account the other measure of surface area instead showed similar values for j0 for both positive and negative electrode reactions. At first glance, this might appear to be irrelevant for the actual user interested only in small charge transfer overpotentials. When talking about methods to increase electrocatalytic activity, this conclusion becomes highly important when transferring results of electrocatalytic studies obtained with smooth materials to felt materials (for further details see, e.g., [29]). Only when taking into account the active surface area real electrocatalytic effects depending on, e.g., attachment of an expensive catalyst material or complicated surface treatment can be separated from simple surface area enlargement effects.
When dealing with electrodes prepared by, e.g., particle deposition, the geometric electrode area (beyond the apparent surface area of the support) is difficult to determine; instead, surface areas determined by various electrochemical methods are used. Obviously, the obtained j0 data for these surface areas are not exactly compatible with data based on the geometric surface area because the latter do not consider any roughness effects whereas the former implicitly and unavoidably contain such effects. Reports taking into account the EASA instead of the geometric surface area in reporting kinetic data are rare [30,31,32]. The obvious inconsistencies presented by porous materials have been addressed with respect to RFBs [5,29] and to fuel cell electrodes [33]. The use of geometric surface areas in Tafel evaluations of oxygen evolution catalytic activity of Co3O4 resulted in artificially boosted activity values [33], but a specific method to identify the relevant surface area could not be recommended. The need for careful surface area considerations also has been stressed in a comparative benchmarking study of catalysts for the oxygen evolution reaction [34] and in a study of electrocatalysts for electrochemical water splitting [35]. In a slightly misleadingly titled study, the particular role of the reference electrode and its electrode potential determination in overpotential studies was noticed [36].
In the case of electrode reactions with a very fast charge transfer; i.e., with diffusion control, it can be argued that roughness features with typical dimensions smaller than the diffusion layer thickness should have no influence on I0 because the diffusion layer will not conformally follow these small features, but instead will average them out. This has been noticed previously [37,38,39,40]. Of course, the value of the EASA as obtained typically from double-layer-capacitance determination should depend on the roughness. Accordingly, j0 should be independent of the roughness at small roughness values. Determining such “maximum roughness” at which an electrode can be assumed to be smooth with respect to determination of j0 is of considerable practical value when determining the catalytic activity of an electrode material. If this assumption is not valid, the claimed enhanced catalytic activity is actually an effect of the increased surface area (for further discussion see, e.g., [8,29]). This concern becomes even more dominant for porous electrodes.
In the present context, the term “roughness” is used in a very simplifying sense: It simply indicates the ratio of the EASA to the geometric surface area. Thus, no distinction is made between an EASA larger than the geometric surface area due to a few and very fine roughness features generated by electrodeposition of a small amount of metal or by roughening with abrasive paper, leaving scratches and other rough, almost macroscopic features. The roughness in the first case may have typical features smaller than the diffusion layer thickness with consequences outlined above, whereas the coarse roughness features caused by the mechanical roughening may be large enough to enable the diffusion layer to be conformal. If said consequences are valid only in the second case, I0 will be larger than for a surface without these features.
Of further particular interest is the range of very large roughness values. There may be a range in which roughness values typical of porous electrodes contributing to a large EASA have a significant fraction of EASA inside the rough; i.e., porous, layer. Again, the diffusion layer will not follow these features and the observed increase in the EASA will affect significantly j0 and Rct; i.e., a further increase in the EASA and Rf should not be reflected in a decreasing Rct.
The preceding considerations address only the geometric/topographic surface areas aspects and do not take into account the surface properties except for a detail regarding the temperature-programmed desorption of adsorbed oxygen. This may be sufficient for electrode reactions proceeding fast on almost every electrode surface (mostly outer-sphere reactions such as the example selected in this study). However, many redox reactions employed in redox flow batteries already have been identified as being highly sensitive to the surface properties of the electrode material [8,29]. Apparently, many of these reactions are inner-sphere reactions involving considerable adsorption of reactants on the electrode surface. Different surface sites; e.g., edge sites and basal plane sites of graphite, may show significantly different adsorption properties and accordingly different electrocatalytic activities. These differences in surface properties, which are also related to electronic solid-state properties [41], also appear in different double-layer capacities ranging, e.g., for graphite from 3 to 70 μF·cm−2 [42,43]. With more complicated electrode reactions (e.g., the electrochemical reduction of dioxygen; for an overview, see [44]) and inhomogeneous (polycrystalline) metal surfaces, the situation becomes even more complicated. The electrode reaction may proceed only or at least mostly at a high rate at selected surface sites (surface defects or heteroatoms) or surface fractions with particular crystallographic orientation (e.g., edge sites of graphite [5]), so calculating an exchange current density with respect to this “active surface” area will be even more complicated and possibly impossible. In the case of non-3D graphitic materials in which there are basically only two types of surface sites (edge and basal plane) with significantly different activities, such assignment and calculation may be feasible. With felt materials, separation of the EASA into edge plane, basal plane, and defect sites and their contribution to the EDLC is possible using a combination of results obtained from various methods [45].
For an experimental verification of the first part of the preceding line of reasoning dealing only with topographical or areal aspects with electrocatalytic influences playing no or at least an insignificant role, we selected a simple redox system ((NH4)2Fe(SO4)2/(NH4)Fe(SO4)2) with an electron transfer proceeding as an outer-sphere one. The reaction proceeded relatively fast (sometimes it has been called reversible for this reason) and diffusion control of the recorded currents was effective. Although the redox potential of this redox system was in the range of platinum hydroxide coverage formation, it was identified in earlier studies [46,47] as being stable and yielding reproducible results without interference from side reactions such as, e.g., film formation in the popular hexacyanoferrate system.
We attempted to prepare platinum electrodes with variable roughnesses via mechanical roughening of a polished surface and via electrodeposition of platinum onto a polished surface. The EASA was determined using cyclic voltammetry. Charge transfer resistances Rct were determined using electrochemical impedance measurements [48,49,50,51,52]. The exchange currents I0 could be calculated according to:
Due to n = 1 given by the selected redox system (((NH4)2Fe(SO4)2/(NH4)Fe(SO4)2; see below for details), Rct and I0 can be considered as equivalent in the following discussion, and for simplicity only Rct will be discussed below first.
In case Rct, I0, and finally j0 do not depend on roughness—implicitly assumed in most studies using solid electrodes—their values should not change with the EASA. If these values depend on the real surface area; i.e., they change with a growing surface area, the corresponding trends should be visible. Of particular interest is the range of very small roughness and of very large roughness.
2. Experimental Procedure
A platinum rod (99.99%; 2 mm diameter; Schiefer, Hamburg, Germany) was sealed into borosilicate glass (Ageom = 3.142·10−2 cm2). It was initially polished with abrasive paper and finally with Al2O3 powder with particle sizes of 13 μm, 1 μm, and in some experiments, 0.3 μm and 0.05 μm. Roughness was created with abrasive paper (CAMI grit designations 80, 360, 600, and 1000) and controlled galvanostatic platinum deposition from an aqueous hexachloroplatinate solution at j = 0.5 mA.
A three-compartment cell with porous glass frits separating the reference, working, and counter electrode compartments suitable for both cyclic voltammetry and impedance measurements was used. The polished electrode was taken as a benchmark for the following experiments. Platinum flags were used as counter and quasi-reference electrodes; for CVs, a relative hydrogen reference electrode [53,54] was used instead for measurements with the redox system.
Cyclic voltammetry in an aqueous solution of 1 M HClO4 was applied to ascertain the reproducible surface state of the platinum surface with a IVIUMSTAT Electrochemical Interface potentiostat; in the double-layer region, CVs were recorded to obtain the differential double-layer capacitance CDL from the slope of the double-layer currents vs. the scan rate. Kinetic data were determined using potentiostatic electrode impedance measurements with a potentiostat (Solartron SI 1287) connected to an SI 1255 frequency response analyzer interfaced with a PC (further experimental details were described elsewhere [55,56]) initially using an aqueous electrolyte solution of 0.01 M (NH4)2Fe(SO4)2 + 0.01 M (NH4)Fe (SO4)2 + 1 M HClO4 at the spontaneously established open circuit potential (OCP) with a modulation amplitude of 5 mV in the frequency range of 0.01 to 105 Hz. Because extraction of CDL values from the CPE at a small concentration of the redox active species resulting in large values of Rct was fraught with considerable uncertainties (for a detailed discussion, see [57]), further kinetic studies were performed using a solution containing 0.1 M (NH4)2Fe(SO4)2 + 0.1 M (NH4)Fe(SO4)2 + 1 M HClO4. Evaluation of the impedance data was performed with Boukamp software (version 2.4). For comparison, other software products (the CNLS program LEVM and Zsimpwin) were consulted; no significant differences were found. A simple equivalent circuit containing an electrolyte solution resistance, a charge transfer resistance Rct, a double-layer capacitance modeled as a constant phase element (CPE), and a Warburg diffusion element was assumed [58].
All chemicals were at least of analytical grade and were used as received; electrolyte solutions were prepared using deionized ultrapure 18 MΩ·cm water (Seralpur Pro 90 C). All solutions were purged and deoxygenated with nitrogen at 99.999%; measurements were performed at room temperature.
3. Results and Discussion
Typical CVs of the polished and the platinized platinum disc electrode in contact with the aqueous electrolyte solution of 1 M HClO4 are displayed in Figure 1; the CVs of the double-layer region at various scan rates are shown in the inset. The electrode potential range for the latter measurements was selected with attention to avoiding “pseudocapacitive” contributions.
For verification of the proper state of the platinum electrode surface in contact with the electrolyte solution containing the iron redox system, a typical CV is displayed in Figure 2.
A typical result of the impedance measurements is displayed as Nyquist (complex plane) and Bode plots in Figure 3.
Changes in the CDL (taken from CVs with a supporting electrolyte solution only) and consequently the EASA calculated while assuming 20 μF·cm−2 for a perfectly smooth surface of a metal in contact with an electrolyte solution (see [59,60,61,62]; a simple calculation discussed elsewhere also yielded this value [24]) with an electrolyte concentration high enough to avoid effects of diluted solutions [63,64,65]) as a function of surface treatment appeared as expected (Figure 4).
Starting with an electrode polished down to 1 μm, roughening with coarse abrasive paper of grit 80 resulted in an increase in the EASA; treatment with grit 360 caused a further growth. Subsequent treatment with grit 600 and 1000 followed by polishing with 13 μm and 1 μm Al2O3 powder resulted in a steady decrease in the EASA, which arrived approximately at the values observed initially with the polished electrode. The results and details are collected in Table 1. For comparison, values derived from impedance measurements are included; they followed the same trend and thus require no separate discussion.
This trend roughly followed the expectations for mechanical polishing. Values of Rct obtained from impedance measurements did not show any correlation with the observed trend of the EASA; i.e., they did not decrease with a growing EASA. In the absence of further information on the mechanically induced roughness and its properties and electrochemical effects, no further attempts were made using electrodes artificially roughened this way.
In a second approach, artificially roughened surfaces were created by the electrodeposition of platinum. The EASA was determined while again assuming 20 μF·cm−2 for a perfectly smooth surface, and again the dependency on the treatment followed expectations (Figure 5).
Based on the geometric surface area, roughness factor (Rf) defined as the ratio of the measured double-layer capacitance vs. the calculated double-layer capacitance while assuming 20 μF·cm−2 ranging from 5 to 160 were determined (for details, see Table 2); due to the mathematical relationship with the EASA, dependency of the Rf on the treatment followed expectations. Further data are collected in Table 2.
For comparison, the data obtained after polishing down to 0.05 μm are included. Even at this polishing level, which is usually applied in external reflection spectroelectrochemistry, a substantial roughness is observed, so the electrode surface could hardly be considered as smooth.
Values for CDL (and implicitly, the EASA) retrieved from impedance measurements corresponded poorly with those obtained from CVs. The uncertainty in their determination was considerable, the employed CPEs with values of n frequently significantly smaller than 0.9 showed a strongly nonideal capacitive behavior. A similar problem was reported previously [66]. Even with an increased concentration of the redox system and an associated reduction in Rct, this situation did not improve. For further consideration and display of data as shown in Figure 5 and listed in Table 2, only values of the EASA and Rf from CVs were considered, as already stated. As seen in Figure 5, the Rct decreased with a growing EASA. Neither at low nor at high roughness did approximation to a limiting value become apparent in this set of experiments; the boundary cases discussed above do not seem to be valid yet. Proceeding to even higher values of Rf by increasing the amount of deposited platinum further resulted in an even higher Rf with the Rct staying practically constant. The presumably more relevant lower roughness and the absence of a limiting value of Rct implied that the kinetic data obtained even with very carefully polished electrodes were presumably not characteristic of actually smooth (perfect) electrode surfaces.
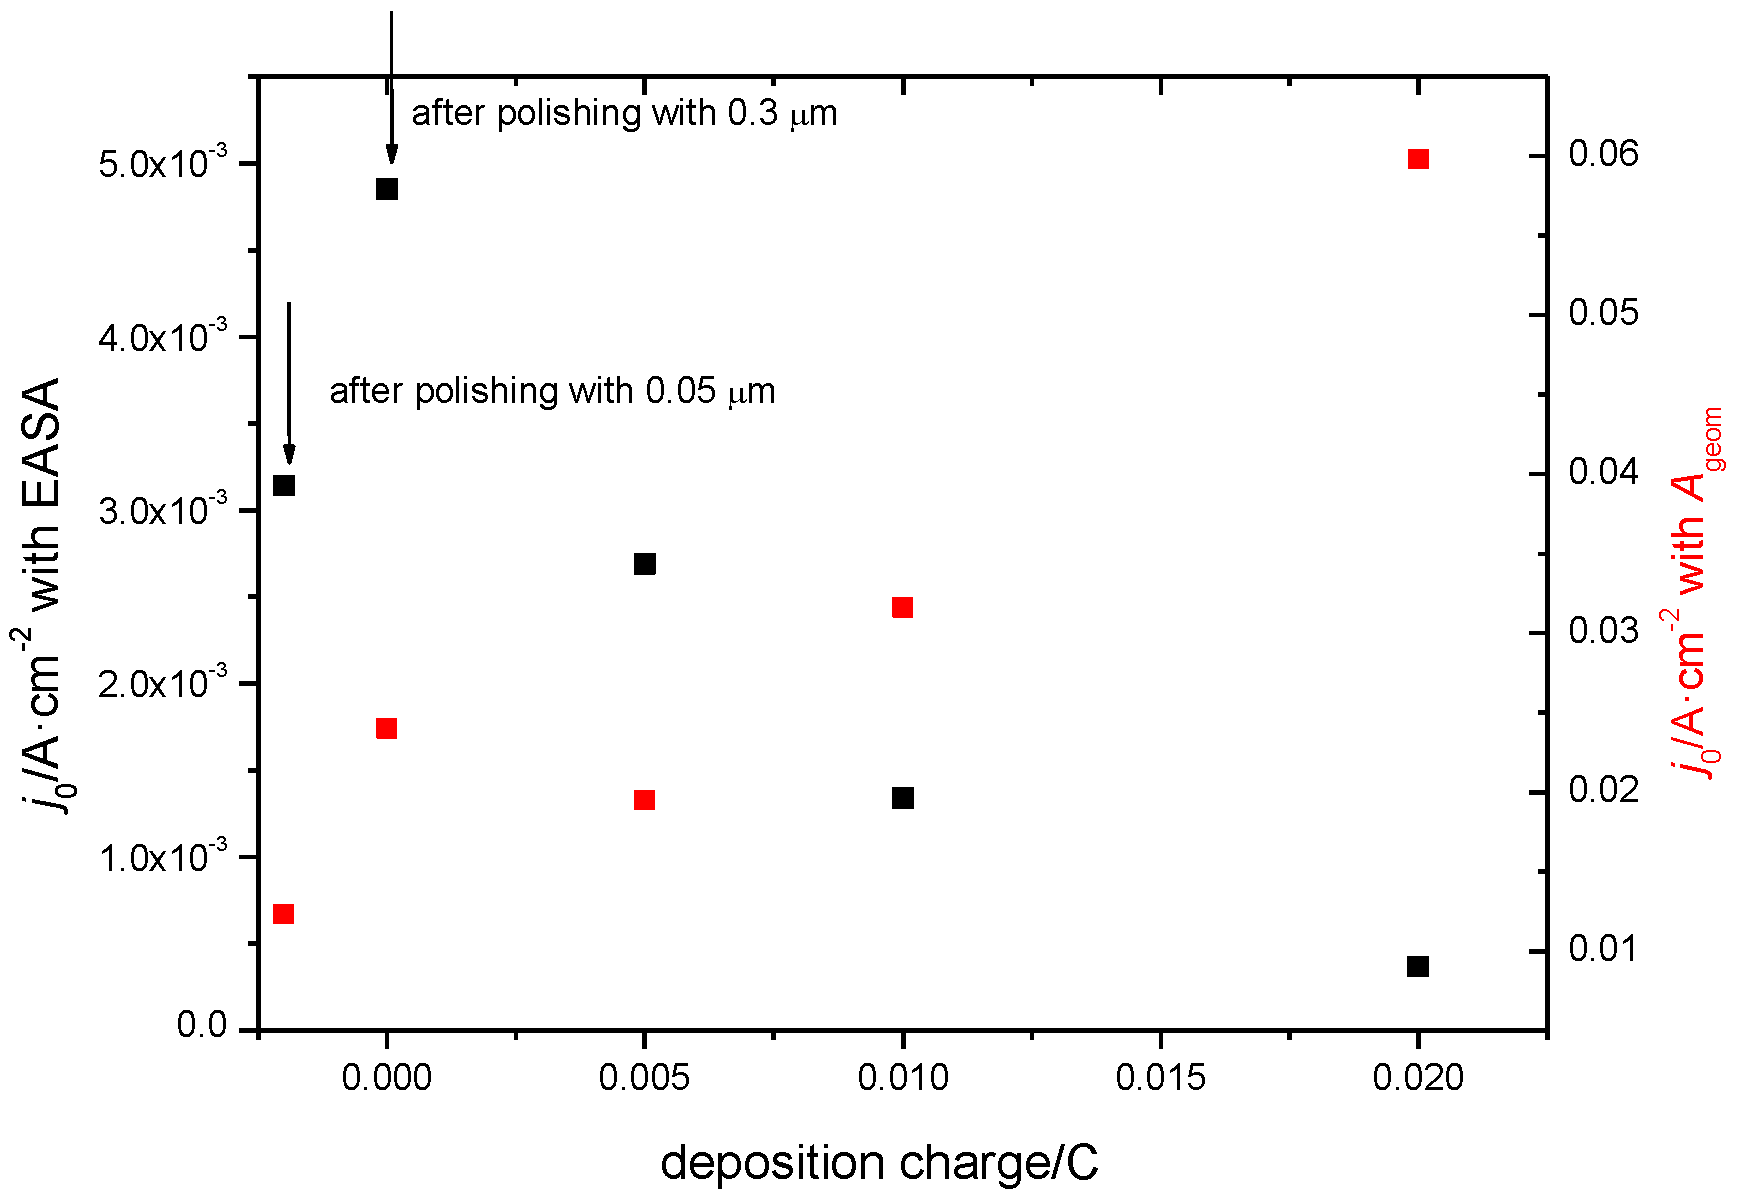
Assuming that inclusion of the EASA instead of the geometric surface area in the calculation of j0 according to j0 = I0/EASA (instead of j0 = I0/Ageo) would result in a value now more independent of electrode roughness was too optimistic, as demonstrated in Figure 6. Instead of conceivably approximate constant values of j0 steadily decreasing, ones with a growing deposition charge; i.e., with a growing EASA, were observed. The absence of a constant value possibly corresponded to the observations reported above [37,38,39,40], indicating that roughness features that resulted in increased values for CDL with typical dimensions smaller than the diffusion or transport layer thickness would have no influence on I0. The very moderate increase in currents in the CVs with a supporting electrolyte solution observed when proceeding from the polished platinum electrode (Figure 1a) to the one with electrodeposited platinum (Figure 1b) supported this assumption. The trend actually depicted in Figure 6 may have been due to other reasons beyond those considered here.
Taking the discussed assumption into account, it was expected that the values for j0 calculated with Ageom should have been independent of the EASA taken into account before. The results are shown in Figure 6. They again were not constant. The visible trend indicated an increase with the amount of the electrodeposited platinum, so possibly other reasons than the mere surface area were at work.
4. Conclusions
Evaluation of kinetic data (Rct) and values of electrochemically active surface areas for platinum electrodes with surface areas artificially increased via mechanical roughening and via platinum deposition showed variation in Rct with roughness factors and EASA values. The correlations were not clear enough to yield an exchange current density independent of the roughness by calculating the exchange current densities using the EASA instead of the geometric surface area. This may have been due to roughness features being smaller than the diffusion layer thickness affecting the EASA but not the reaction rate; further effects of the rough surface possibly were at work.
For porous or 3D electrodes with structural features exceeding the diffusion layer, the thickness exchange current densities j0 should be calculated using values of the EASA or should at least be reported with information on the actual roughness of the electrode under study.
Author Contributions
Conceptualization, methodology, investigation, writing, X.X. and R.H. All authors have read and agreed to the published version of the manuscript.
Funding
This research received no external funding.
Data Availability Statement
Not applicable.
Acknowledgments
Preparation of this communication was supported in various ways by the Alexander von Humboldt-Foundation, Deutscher Akademischer Austauschdienst, Fonds der Chemischen Industrie, Deutsche Forschungsgemeinschaft, National Basic Research Program of China, and Natural Science Foundation of China. The study included results obtained within a research project at St. Petersburg State University supported by grant No. 26455158. Experimental assistance by J. Roscher is gratefully acknowledged.
Conflicts of Interest
The authors declare no conflict of interest.
References
- Vetter, K.J. Elektrochemische Kinetik; Springer: Berlin, Germany, 1961. [Google Scholar]
- Vetter, K.J.; Bruckenstein, S. Electrochemical Kinetics; Academic Press: New York, NY, USA, 1967. [Google Scholar]
- Zhang, L.; Han, L.; Liu, H.; Liu, X.; Luo, J. Potential-Cycling Synthesis of Single Platinum Atoms for Efficient Hydrogen Evolution in Neutral Media. Angew. Chem. Int. Ed. 2017, 56, 13694–13698. [Google Scholar] [CrossRef]
- Bard, A.J.; Inzelt, G.; Scholz, F. (Eds.) Electrochemical Dictionary; Springer: Heidelberg, Germany, 2012; p. 216. [Google Scholar]
- Schweiss, R.; Meiser, C.; Goh, F.W.T. Steady-State Measurements of Vanadium Redox-Flow Batteries to Study Particular Influences of Carbon Felt Properties. ChemElectroChem 2017, 4, 1969–1974. [Google Scholar] [CrossRef]
- Holze, R. Impedanzmessungen an porösen Elektroden. Ph.D. Thesis, University of Bonn, Bonn, Germany, 1983. [Google Scholar]
- Holze, R.; Vielstich, W. Double-layer capacity measurements as a method to characterize porous fuel cell electrodes. Electrochim. Acta 1984, 29, 607–610. [Google Scholar] [CrossRef]
- Holze, R. Kinetics of Fast Redox Systems for Energy Storage. In Springer Handbook of Electrochemical Energy; Breitkopf, C., Swider-Lyons, K., Eds.; Springer: Dordrecht, The Netherlands, 2016; pp. 591–610. [Google Scholar]
- Newman, J.; Thomas-Alyea, K.E. Electrochemical Systems, 3rd ed.; Wiley-Interscience: Hoboken, NJ, USA, 2004. [Google Scholar]
- Ganassin, A.; Maljusch, A.; Colic, V.; Spanier, L.; Brandl, K.; Schuhmann, W.; Bandarenka, A. Benchmarking the Performance of Thin-Film Oxide Electrocatalysts for Gas Evolution Reactions at High Current Densities. ACS Catal. 2016, 6, 3017–3024. [Google Scholar] [CrossRef]
- Holze, R.; Vielstich, W. The Kinetics of Oxygen Reduction at Porous Teflon-Bonded Fuel Cell Electrodes. J. Electrochem. Soc. 1984, 131, 2298–2303. [Google Scholar] [CrossRef]
- Rouquerol, F.; Rouquerol, J.; Singh, K.S.W.; Llewellyn, P.; Maurin, G. Adsorption by Powders and Porous Solids, 2nd ed.; Academic Press: Oxford, UK, 2014. [Google Scholar]
- Condon, J.B. Surface Area and Porosity Determinations by Physisorption, 2nd ed.; Elsevier: Amsterdam, The Netherlands, 2020. [Google Scholar]
- Thommes, M.; Kaneko, K.; Neimark, A.V.; Olivier, J.P.; Rodriguez-Reinoso, F.; Rouquerol, J.; Sing, K.S.W. Physisorption of gases, with special reference to the evaluation of surface area and pore size distribution. Pure Appl. Chem. 2015, 87, 1051–1069. [Google Scholar] [CrossRef]
- Watzele, S.; Hauenstein, P.; Liang, Y.; Garlyyev, B.; Scieszka, D.; Bandarenka, A. Determination of real electro-active surface area of common metal oxide catalysts for the OER. Paper S21. In Proceedings of the 69th ISE-Meeting, Bologna, Italy, 2–7 September 2018. [Google Scholar]
- Trasatti, S.; Petrii, O.A. Real Surface-Area Measurements in Electrochemistry. J. Electroanal. Chem. 1992, 327, 353–376. [Google Scholar] [CrossRef]
- Trasatti, S.; Petrii, O.A. Real surface area measurements in electrochemistry. Pure Appl. Chem. 1991, 63, 711–734. [Google Scholar] [CrossRef]
- Watt-Smith, M.J.; Friedrich, J.M.; Rigby, S.P.; Ralph, T.R.; Walsh, F.C. Determination of the electrochemically active surface area of Pt/C PEM fuel cell electrodes using different adsorbates. J. Phys. D Appl. Phys. 2008, 41, 74004. [Google Scholar] [CrossRef]
- Binninger, T.; Fabbri, E.; Koetz, R.; Schmidt, T.J. Determination of the Electrochemically Active Surface Area of Metal-Oxide Supported Platinum Catalyst. J. Electrochem. Soc. 2014, 161, H121–H128. [Google Scholar] [CrossRef]
- Maksimov, Y.M.; Podlovchenko, B.I. Use of silver adatoms for the determination of the electrochemically active surface area of polycrystalline gold. Mendeleev Commun. 2017, 27, 64–66. [Google Scholar] [CrossRef]
- Watzele, S.; Bandarenka, A.S. Quick Determination of Electroactive Surface Area of Some Oxide Electrode Materials. Electroanalysis 2016, 28, 2394–2399. [Google Scholar] [CrossRef]
- Wiberg, G.K.H.; Mayrhofer, K.J.J.; Arenz, M. Investigation of the Oxygen Reduction Activity on Silver—A Rotating Disc Electrode Study. Fuel Cells 2010, 10, 575–581. [Google Scholar] [CrossRef]
- Fang, L.L.; Tao, Q.; Li, M.F.; Liao, L.W.; Chen, D.; Chen, Y.X. Determination of the Real Surface Area of Palladium Electrode. Chin. J. Chem. Phys. 2010, 23, 543–548. [Google Scholar] [CrossRef]
- Ge, Y.; Xie, X.; Roscher, J.; Holze, R.; Qu, Q. How to measure and report the capacity of electrochemical double layers, supercapacitors, and their electrode materials. J. Solid State Electr. 2020, 24, 3215–3230. [Google Scholar] [CrossRef]
- Tilak, B.V.; Rader, C.G.; Rangarajan, S.K. Techniques for Characterizing Porous Electrodes. I. Determination of the Double Layer Capacity. J. Electrochem. Soc. 1977, 124, 1879–1886. [Google Scholar] [CrossRef]
- Gagnon, E.G. The triangular voltage sweep method for determining double-layer capacity of porous-electrodes 3. Porous nickel in potassium hydroxide. J. Electrochem. Soc. 1974, 121, 512–515. [Google Scholar] [CrossRef]
- Gagnon, E.G. Determination of double-layer capacity of porous nickel in KOH in presence of Faradaic current. J. Appl. Electrochem. 1976, 6, 95–98. [Google Scholar] [CrossRef]
- Gagnon, E.G. The Triangular Voltage Sweep Methode for Determining Doubly-Layer Capacity of Porous Electrodes. J. Electrochem. Soc. 1973, 120, 1052–1056. [Google Scholar] [CrossRef]
- Wu, Y.; Holze, R. Electrocatalysis at Electrodes for Vanadium Redox Flow Batteries. Batteries 2018, 4, 47. [Google Scholar] [CrossRef] [Green Version]
- Ahn, J.; Holze, R. Bifunctional electrodes for an integrated water-electrolysis and hydrogen-oxygen fuel cell with a solid polymer electrolyte. J. Appl. Electrochem. 1992, 22, 1167–1174. [Google Scholar] [CrossRef]
- Friedl, J.; Stimming, U. Determining Electron Transfer Kinetics at Porous Electrodes. Electrochim. Acta 2017, 227, 235–245. [Google Scholar] [CrossRef]
- Friedl, J.; Bauer, C.M.; Rinaldi, A.; Stimming, U. Electron transfer kinetics of the VO2+/VO2+-Reaction on multi-walled carbon nanotubes. Carbon 2013, 63, 228–239. [Google Scholar] [CrossRef]
- Sun, S.; Li, H.; Xu, Z.J. Impact of Surface Area in Evaluation of Catalyst Activity. Joule 2018, 2, 1024–1027. [Google Scholar] [CrossRef]
- McCrory, C.C.L.; Jung, S.; Peters, J.C.; Jaramillo, T.F. Benchmarking heterogeneous electrocatalysts for the oxygen evolution reaction. J. Am. Chem. Soc. 2013, 135, 16977–16987. [Google Scholar] [CrossRef]
- Liang, H.; Gandi, A.N.; Anjum, D.H.; Wang, H.X.; Schwingenschlögl, U.; Alshareef, H.N. Plasma-Assisted Synthesis of NiCoP for Efficient Overall Water Splitting. Nano Lett. 2016, 16, 7718–7725. [Google Scholar] [CrossRef] [PubMed]
- Niu, S.; Li, S.; Du, Y.; Han, X.; Xu, P. How to Reliably Report the Overpotential of an Electrocatalyst. ACS Energy Lett. 2020, 5, 1083–1087. [Google Scholar] [CrossRef]
- Holze, R. Underpotential deposit electrocatalysis of fast redox reactions for electrochemical energy storage systems. J. Solid State Electr. 1998, 2, 73–77. [Google Scholar] [CrossRef]
- Herrmann, J. Entwicklung und Anwendung einer elektrochemischen Methode zur Untersuchung schneller zwischengelagerter Reaktionen in turbulenter Rohrströmung. Ph.D. Thesis, University of Bonn, Bonn, Germany, 1983. [Google Scholar]
- Herrmann, J.; Schmidt, H.; Vielstich, W. Electrochemical investigations of a fast chemical step between two charge transfer reactions. Z. Phys. Chem. NF 1984, 139, 83–96. [Google Scholar] [CrossRef]
- Iwasita, T.; Schmickler, W.; Herrmann, J.; Vogel, U. The Kinetic Parameters of the Fe(CN)63-/4- Redox System: New Results with the Ring Electrode in Turbulent Pipe Flow. J. Electrochem. Soc. 1983, 130, 2026–2032. [Google Scholar] [CrossRef]
- Bohnenkamp, K.; Engell, H.J. Messungen der Impedanz der Phasengrenze Germanium-Elektrolyt. Z. Elektrochem. 1957, 61, 1184–1196. [Google Scholar]
- Bauer, H.H.; Spritzer, M.S.; Elving, P.J. Double-Layer capacity at a pyrolytic graphite disk electrode. J. Electroanal. Chem. 1968, 17, 299–306. [Google Scholar] [CrossRef]
- Randin, J.P.; Yeager, E. Differential Capacitance Study of Stress-Annealed Pyrolytic Graphite Electrodes. J. Electrochem. Soc. 1971, 118, 711–714. [Google Scholar] [CrossRef]
- Wu, Y.; Holze, R. Electrochemical Energy Conversion and Storage; WILEY-VCH: Weinheim, Germany, 2022. [Google Scholar]
- Rabbow, T.J.; Whitehead, A.H. Deconvolution of electrochemical double layer capacitance between fractions of active and total surface area of graphite felts. Carbon 2017, 111, 782–788. [Google Scholar] [CrossRef]
- Kania, S.; Holze, R. Beschleunigung schneller Redoxreaktionen durch upd-modifizierte Elektroden? In GDCh-Monograhie; Stimming, U., Lehnert, W., Eds.; GDCh: Frankfurt, Germany, 1996; Volume 9, pp. 439–445. [Google Scholar]
- Kania, S.; Holze, R. On the adsorption and redox catalysis of the oxalate anion and oxalato complexes on gold and metal-modified gold electrodes. Electrochim. Acta 2003, 48, 945–950. [Google Scholar] [CrossRef]
- Lasia, A. Electrochemical Impedance Spectroscopy and its Applications; Springer: New York, NY, USA, 2014. [Google Scholar]
- Yuan, X.Z.; Song, C.; Wang, H.; Zhang, J. Electrochemical Impedance Spectroscopy in PEM Fuel Cells; Springer: London, UK, 2010. [Google Scholar]
- Orazem, M.E.; Tribollet, B. Electrochemical Impedance Spectroscopy, 2nd ed.; Wiley: Hoboken, NJ, USA, 2017. [Google Scholar]
- Holze, R. Electrode impedance measurements: A versatile tool for electrochemists. Bull. Electrochem. 1994, 10, 56–67. [Google Scholar]
- Barsoukov, E.; Macdonald, J.R. Impedance Spectroscopy; WILEY-Interscience: Hoboken, NJ, USA, 2005. [Google Scholar]
- Will, F.G.; Hess, H.J. Morphology and Capacity of a Cadmium Electrode. J. Electrochem. Soc. 1973, 120, 1. [Google Scholar] [CrossRef]
- Will, F.G. A self-contained miniature hydrogen reference electrode. J. Electrochem. Soc. 1986, 133, 454–455. [Google Scholar] [CrossRef]
- Liu, Y.; Gao, S.; Holze, R.; Shukla, A.K. The Cadmium Electrode Revisited: Kinetic Data. J. Electrochem. Soc. 2017, 164, A3858–A3861. [Google Scholar] [CrossRef]
- Liu, Y.; Wiek, A.; Dzhagan, V.; Holze, R. Improved Electrochemical Behavior of Amorphous Carbon-Coated Copper/CNT Composites as Negative Electrode Material and Their Energy Storage Mechanism. J. Electrochem. Soc. 2016, 163, A1247–A1253. [Google Scholar] [CrossRef]
- Jovic, V.D. Available online: https://www.gamry.com/application-notes/EIS/correct-value-of-cdl/ (accessed on 27 July 2022).
- Fu, L.; Qu, Q.; Holze, R.; Wu, Y. A comment on the need to distinguish between cell and electrode impedances. J. Solid State Electr. 2019, 23, 717–724. [Google Scholar] [CrossRef]
- Cooper, I.L.; Harrison, J.A.; Sandbach, D.R. Measurement and interpretation of double-layer capacity at solid metal-electrolyte interface. Electrochim. Acta 1978, 23, 527–532. [Google Scholar] [CrossRef]
- Cooper, I.L.; Harrison, J.A. A note on the caclculation and experimental-measurement of the double-layer capacity. Electrochim. Acta 1984, 29, 1165–1168. [Google Scholar] [CrossRef]
- Leikis, D.; Panin, V.; Rybalka, K. On the measurement of the electric double layer capacity at a polycrystalline cadmium electrode. J. Electroanal. Chem. 1972, 40, 9–12. [Google Scholar] [CrossRef]
- Kerner, Z.; Pajkossy, T.; Kibler, L.A.; Kolb, D.M. The double layer capacity of Pt(100) in aqueous perchlorate solutions. Electrochem. Commun. 2002, 4, 787–789. [Google Scholar] [CrossRef]
- Leiva, E.; Schmickler, W. New theories for the electric double layer at a metal/electrolyte solution interface. Proc. Indian Acad. Sci. Chem. Sci. 1986, 97, 267–296. [Google Scholar] [CrossRef]
- Parsons, R. Electrical Double Layer: Recent Experimental and Theoretical Developments. Chem. Rev. 1990, 90, 813–826. [Google Scholar] [CrossRef]
- Conway, B.E.; Birss, V.; Wojtowicz, J. The role and utilization of pseudocapacitance for energy storage by supercapacitors. J. Power Sources 1997, 66, 1–14. [Google Scholar] [CrossRef]
- Bai, L.; Gao, L.; Conway, B.E. Problem of Insitu Real-Area Determination in Evaluation of Performance of Rough or Porous, Gas-Evolving Electrocatalysts. 2. Unfolding of the Electrochemically Accessible Surface of Rough or Porous-Electrodes—A Case-Study with an Electrodeposited Porous Pt Electrode. J. Chem. Soc. Faraday Trans. 1993, 89, 243–249. [Google Scholar]
Figure 1.
CVs of the platinum disc electrode: (a) top: polished; (b) bottom: with 21.44 mC platinization) in contact with an aqueous solution of 1 M HClO4 (dE/dt = 0.1 V·s−1, solution deoxygenated with nitrogen). Insert top figure: CVs of the polished electrode in the double-layer region at various scan rates (dE/dt = 0.1 V·s−1; 0.08; 0.06; 0.04; 0.02 V·s−1) from outside in.
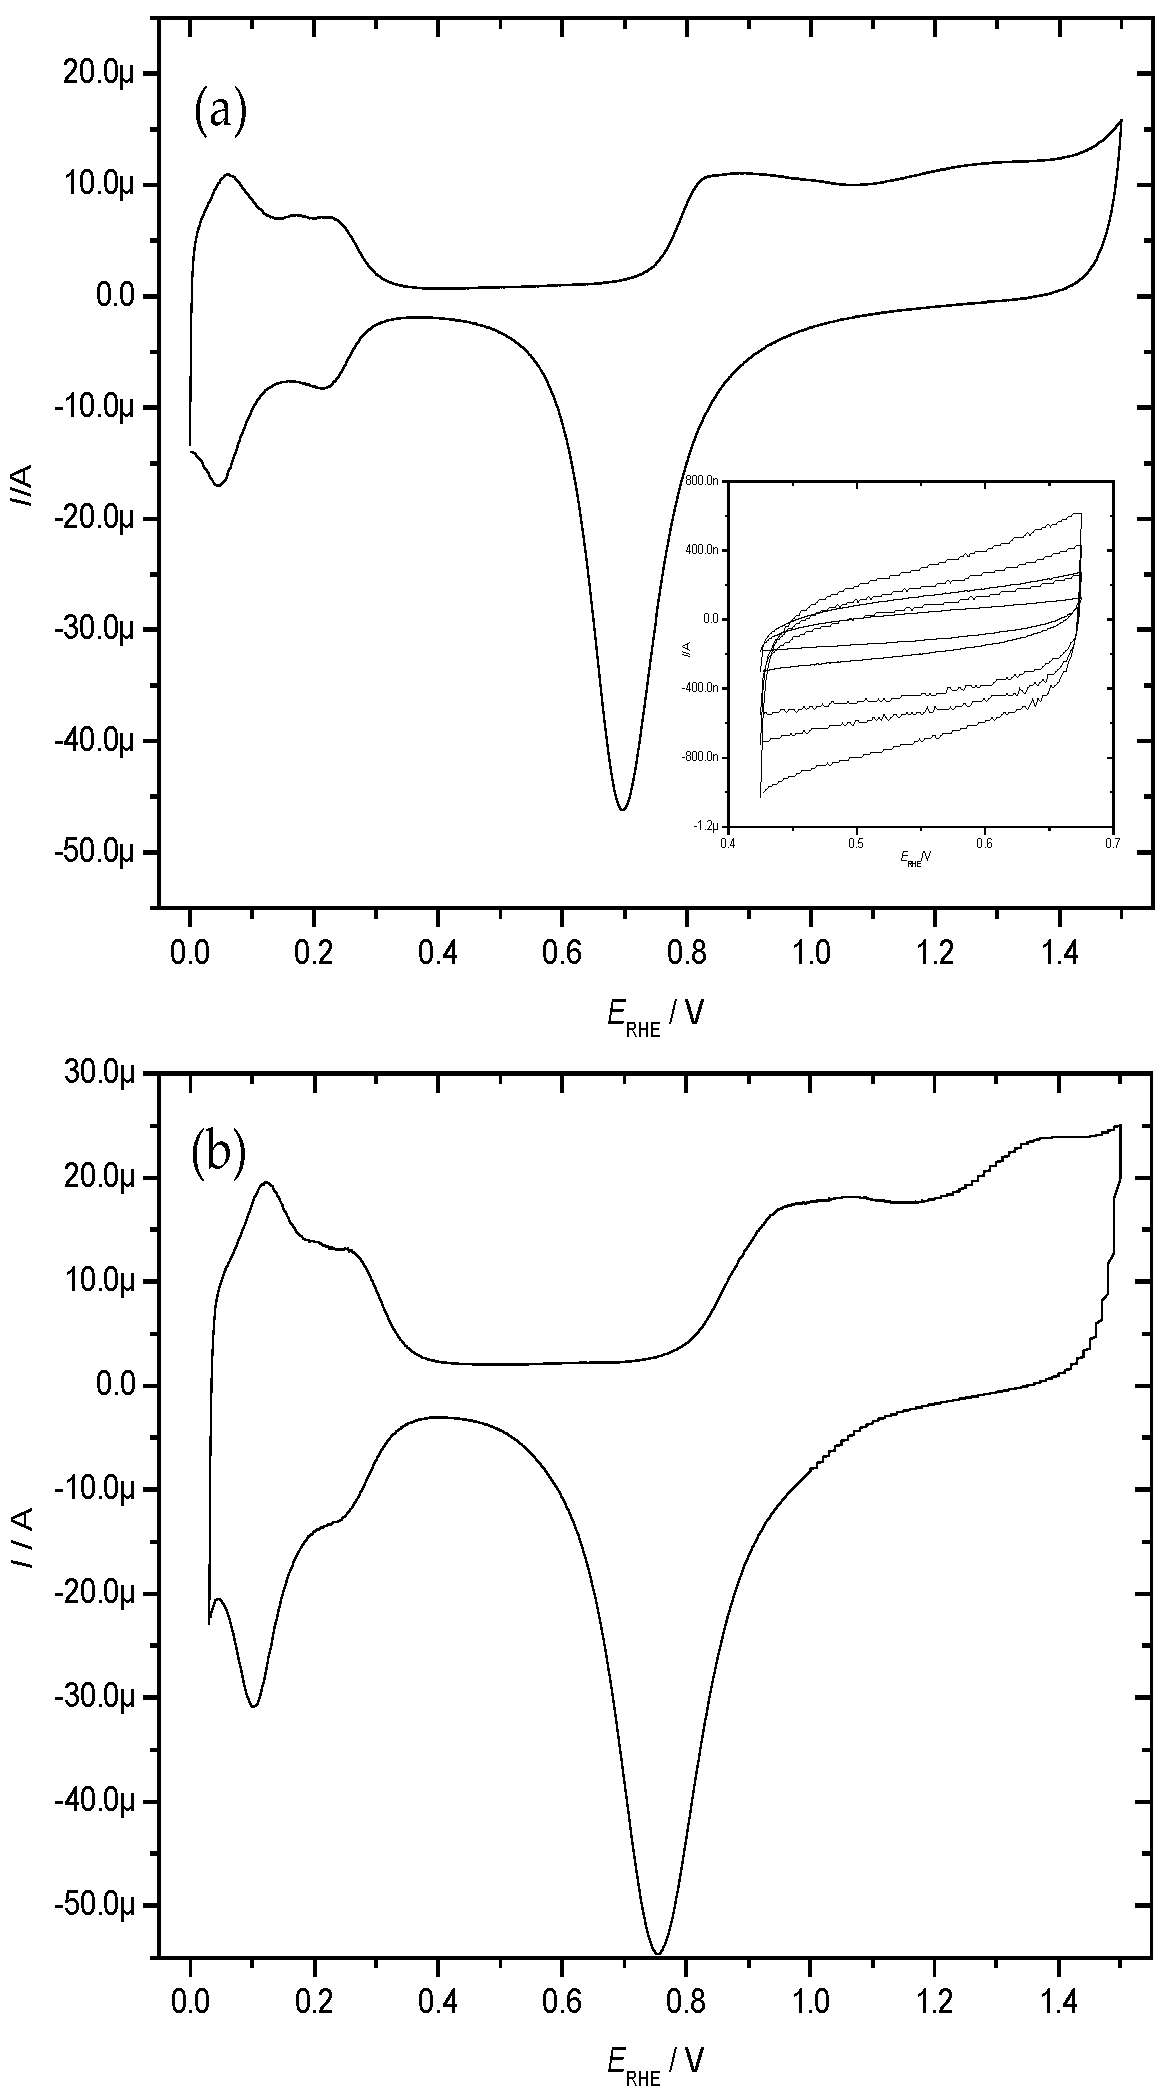
Figure 2.
CV of the platinum disc electrode in contact with an aqueous electrolyte solution of 0.01 M (NH4)2 Fe(SO4)2 + 0.01 M (NH4)Fe (SO4)2 + 1 M HClO4, dE/dt = 0.1 V·s−1, solution de-oxygenated with nitrogen.
Figure 2.
CV of the platinum disc electrode in contact with an aqueous electrolyte solution of 0.01 M (NH4)2 Fe(SO4)2 + 0.01 M (NH4)Fe (SO4)2 + 1 M HClO4, dE/dt = 0.1 V·s−1, solution de-oxygenated with nitrogen.
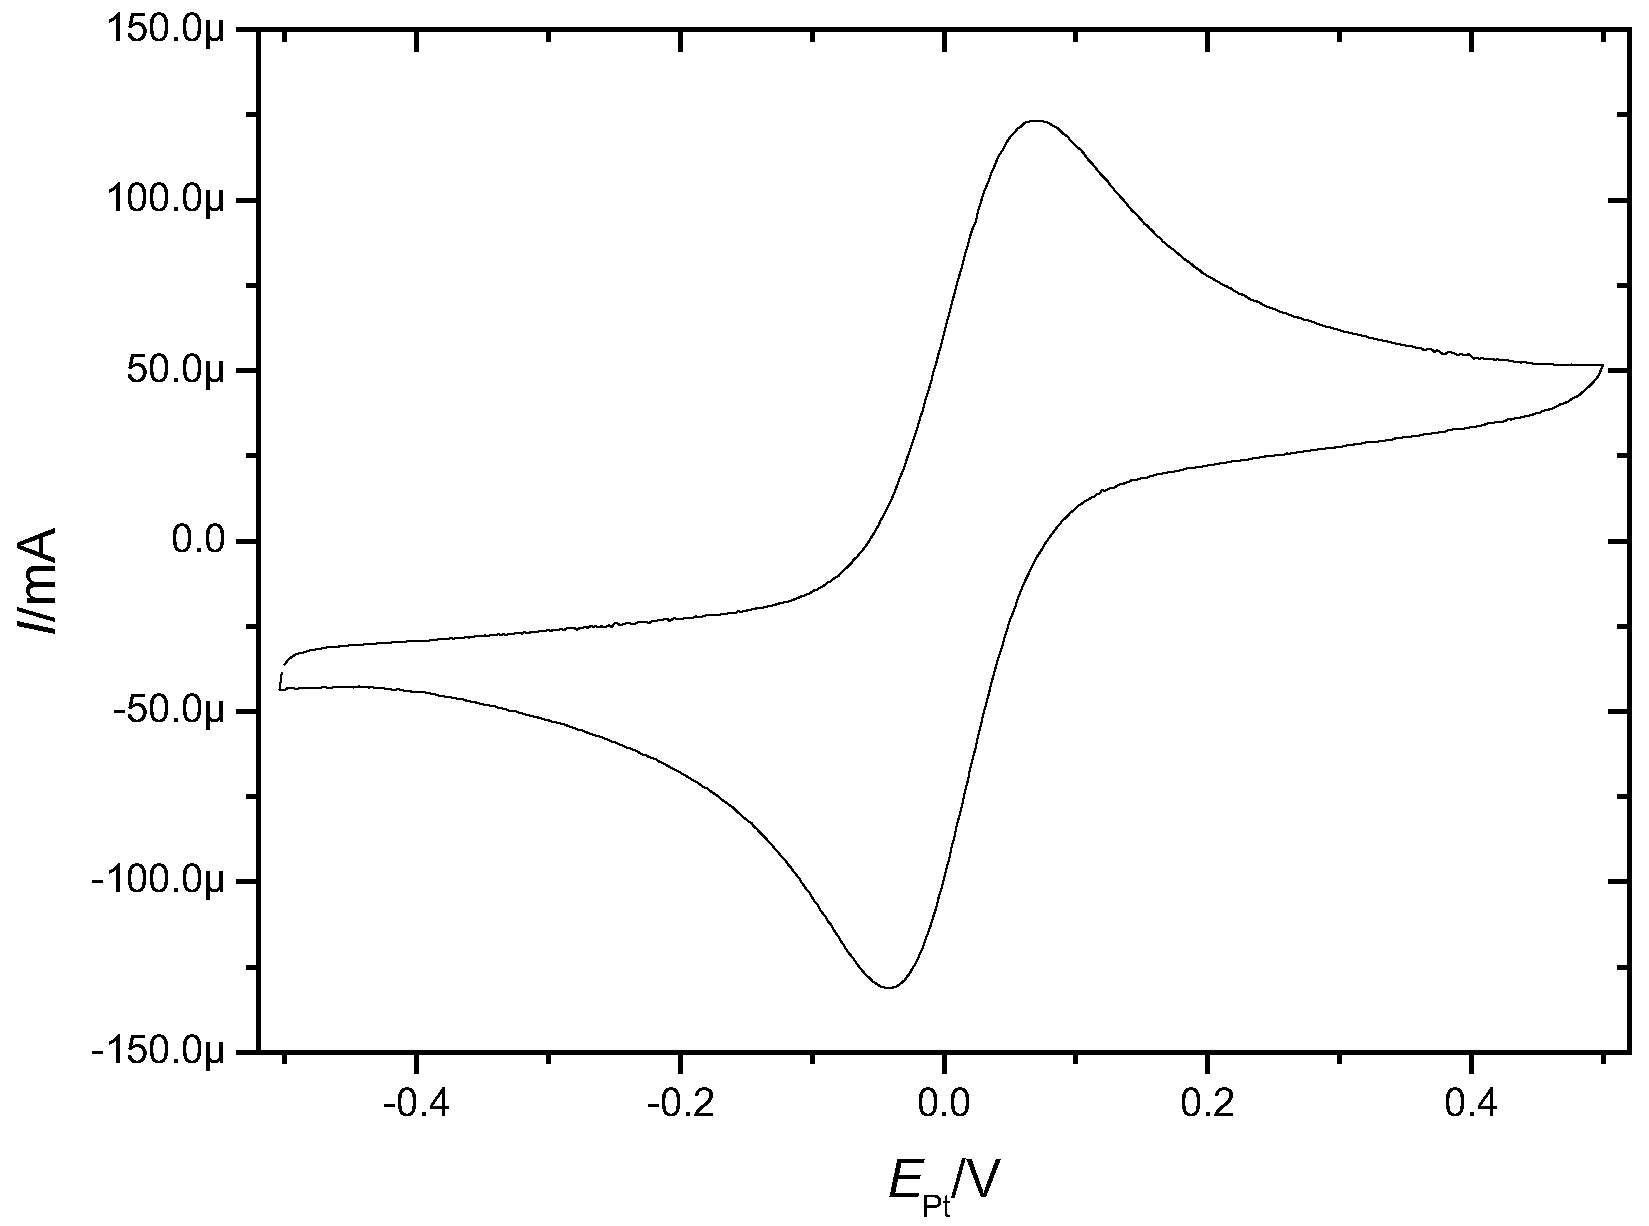
Figure 3.
Nyquist and Bode plots of the platinum disc electrode (with 9.9 mC platinum deposit) in contact with an aqueous electrolyte solution of 0.1 M (NH4)2Fe(SO4)2 + 0.1 M (NH4)Fe(SO4)2 + 1 M HClO4.
Figure 3.
Nyquist and Bode plots of the platinum disc electrode (with 9.9 mC platinum deposit) in contact with an aqueous electrolyte solution of 0.1 M (NH4)2Fe(SO4)2 + 0.1 M (NH4)Fe(SO4)2 + 1 M HClO4.
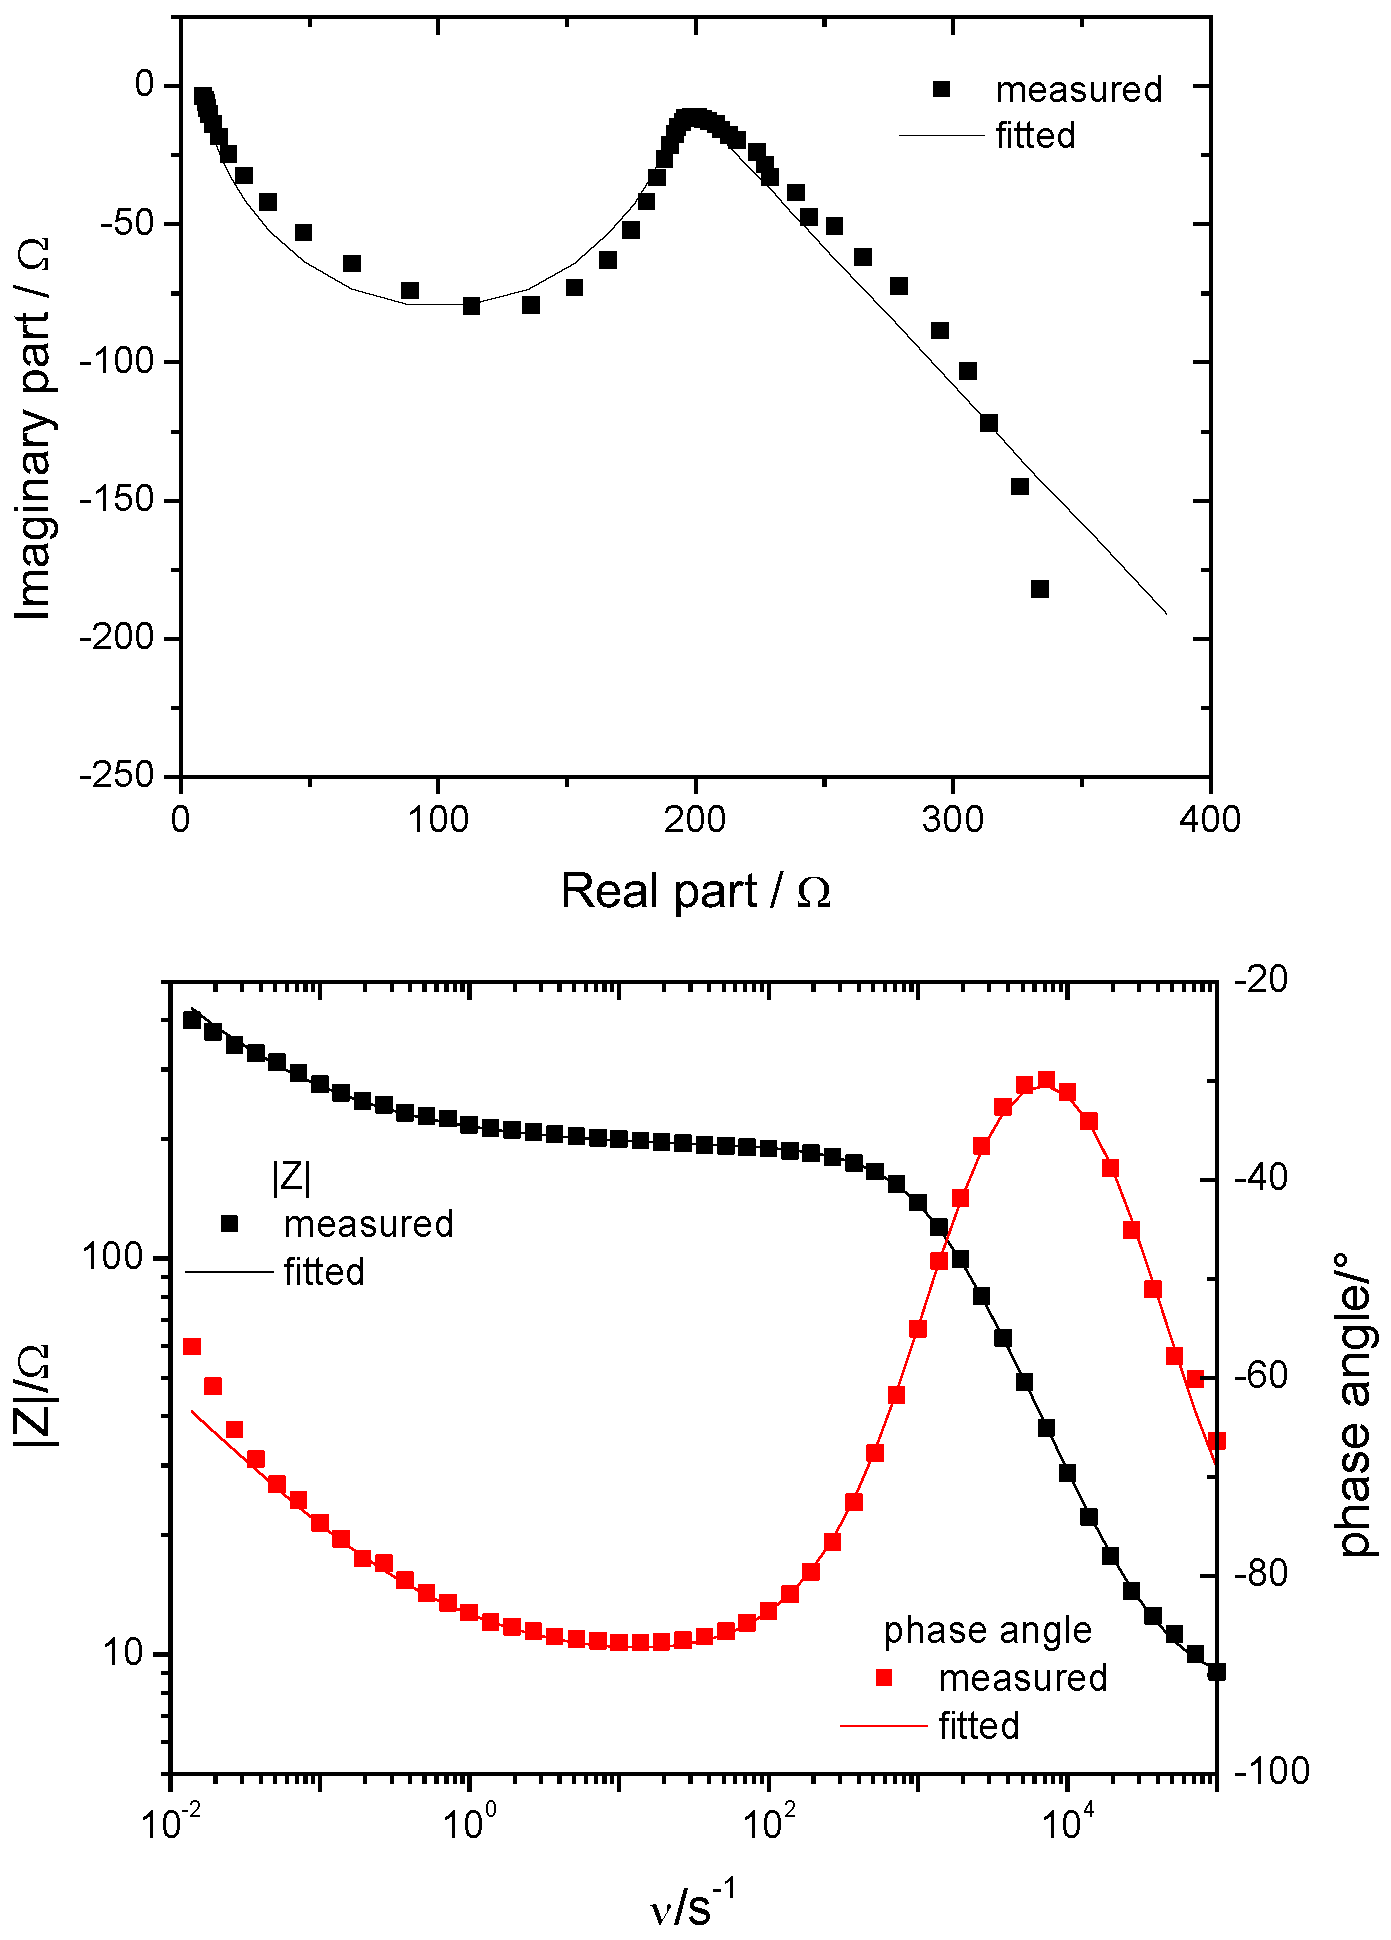
Figure 4.
Rct (black line and symbols, axis left) and EASA (red symbols and line, axis right) of a mechanically treated platinum electrode in contact with an aqueous solution of 0.01 M (NH4)2Fe(SO4)2 + 0.01 M (NH4)Fe(SO4)2 + 1 M HClO4 after various mechanical treatments with abrasive paper of grit as indicated.
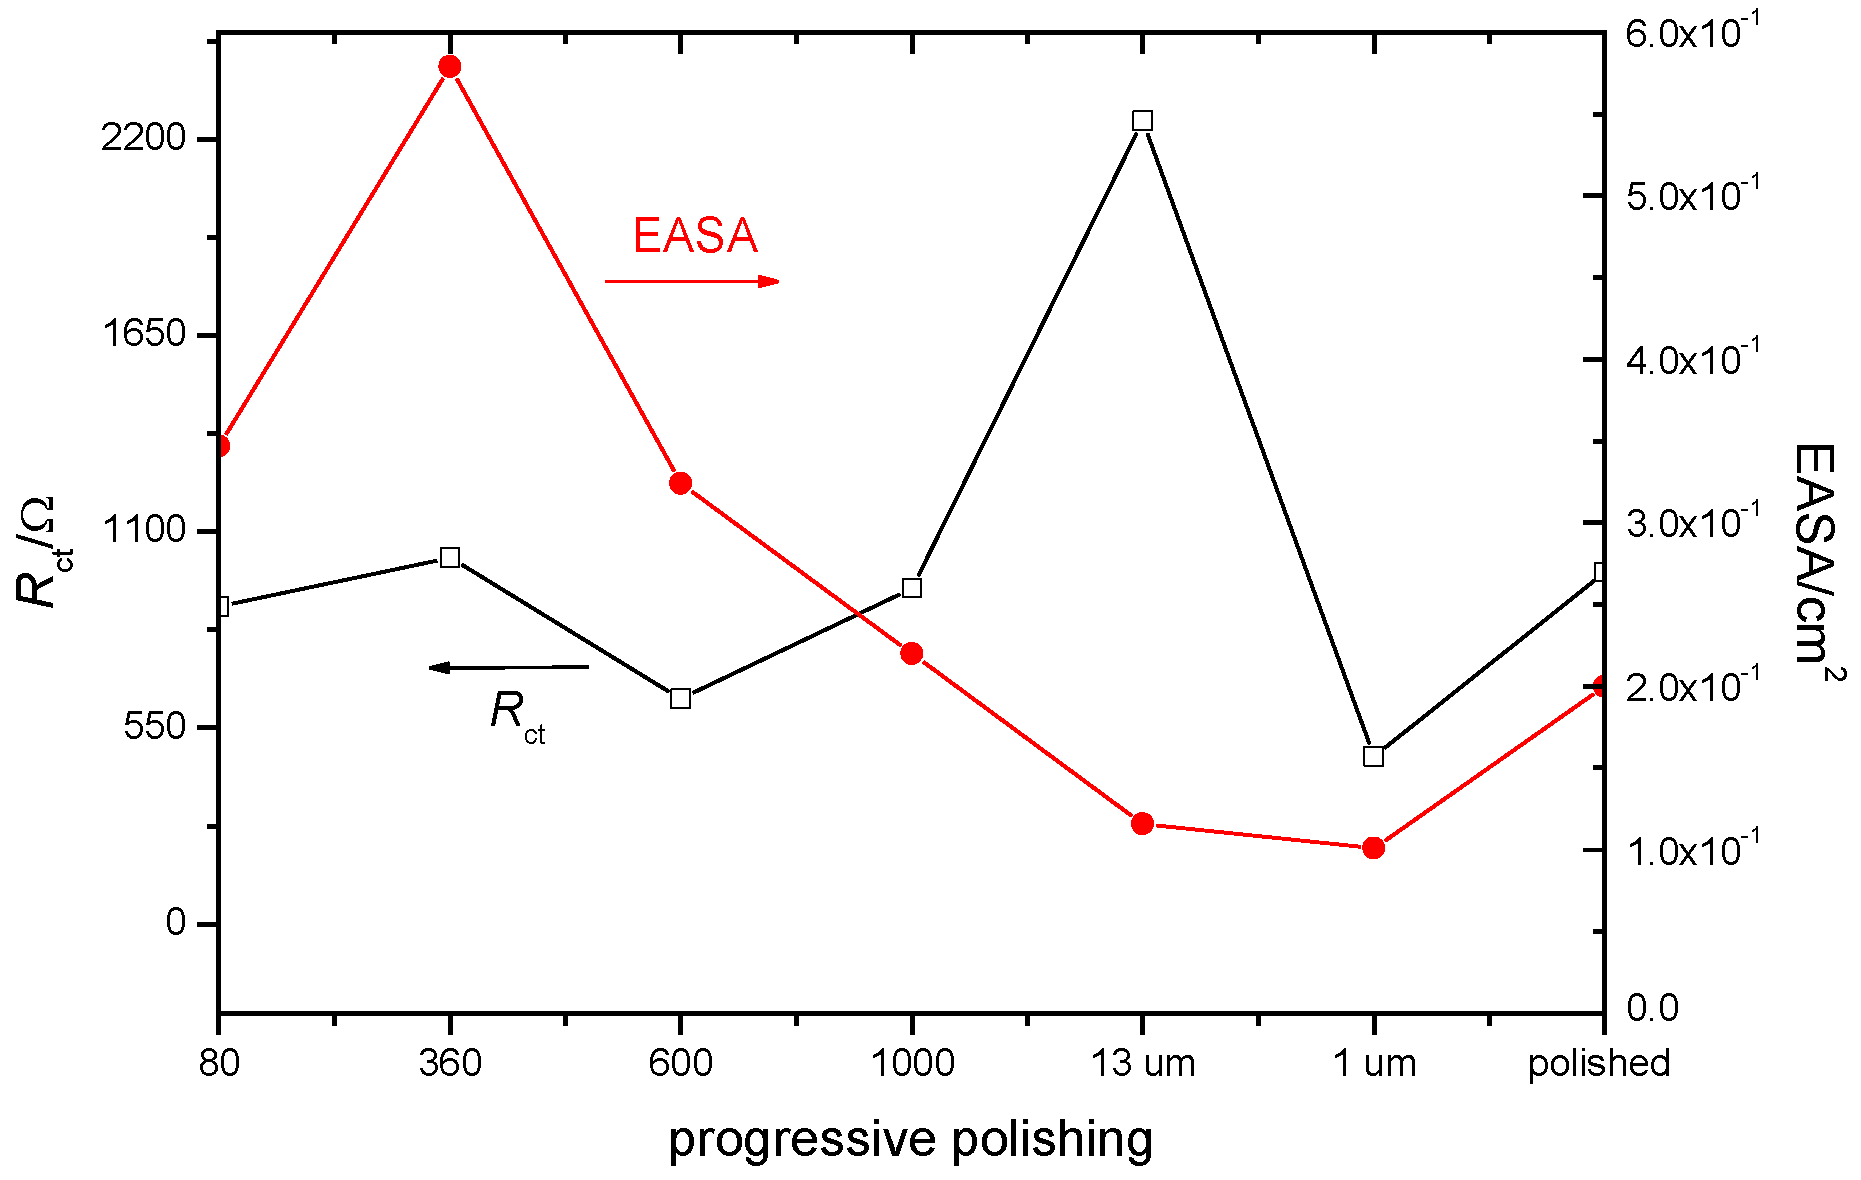
Figure 5.
Rct and EASA of a platinum electrode in contact with an aqueous solution of 0.1 M (NH4)2Fe(SO4)2 + 0.1 M (NH4)Fe(SO4)2 + 1 M HClO4 after deposition of various amounts of platinum black as indicated in terms of deposition charge.
Figure 5.
Rct and EASA of a platinum electrode in contact with an aqueous solution of 0.1 M (NH4)2Fe(SO4)2 + 0.1 M (NH4)Fe(SO4)2 + 1 M HClO4 after deposition of various amounts of platinum black as indicated in terms of deposition charge.

Figure 6.
The j0 calculated with respect to the EASA (black symbols, left) and geometric surface area (red symbols, right).
Figure 6.
The j0 calculated with respect to the EASA (black symbols, left) and geometric surface area (red symbols, right).

Table 1.
Roughness factors Rf and EASA of the platinum surface (Ageom = 3.142·10−2 cm2) mechanically roughened as obtained from impedance measurements and CVs.
Table 1.
Roughness factors Rf and EASA of the platinum surface (Ageom = 3.142·10−2 cm2) mechanically roughened as obtained from impedance measurements and CVs.
| Treatment | EASACV/cm2 | EASAimp/cm2 | RfCV |
|---|---|---|---|
| Polishing 1 μm | 1.75·10−1 | 3.2·10−1 | 5.57 |
| 80 grit | 3.47·10−1 | 6.34·10−1 | 11.06 |
| 360 grit | 5.79·10−1 | 9.79·10−1 | 18.44 |
| 600 grit | 3.24·10−1 | 1.2 | 10.33 |
| 1000 grit | 2.20·10−1 | 4.12·10−1 | 7.00 |
| Polishing 13 μm | 1.16·10−1 | 0.98·10−1 | 3.69 |
| Polishing 1 μm | 1.01·10−1 | 1.12·10−1 | 3.21 |
Table 2.
Roughness factor (Rf) and EASA of platinum surface with enhanced roughness using platinum deposition.
Table 2.
Roughness factor (Rf) and EASA of platinum surface with enhanced roughness using platinum deposition.
| Treatment | EASA/cm2 | Rf |
|---|---|---|
| Polishing 0.3 μm | 1.56·10−1 | 4.96 |
| Deposition 5 mC | 2.28·10−1 | 7.26 |
| + Deposition 5 mC | 7.41·10−1 | 23.58 |
| + Deposition 10 mC | 5.12 | 162.88 |
| Separate experiment | ||
| Polishing 0.05 μm | 1.24·10−1 | 3.93 |
Publisher’s Note: MDPI stays neutral with regard to jurisdictional claims in published maps and institutional affiliations. |
© 2022 by the authors. Licensee MDPI, Basel, Switzerland. This article is an open access article distributed under the terms and conditions of the Creative Commons Attribution (CC BY) license (https://creativecommons.org/licenses/by/4.0/).
Share and Cite
MDPI and ACS Style
Xie, X.; Holze, R. Electrode Kinetic Data: Geometric vs. Real Surface Area. Batteries 2022, 8, 146. https://doi.org/10.3390/batteries8100146
AMA Style
Xie X, Holze R. Electrode Kinetic Data: Geometric vs. Real Surface Area. Batteries. 2022; 8(10):146. https://doi.org/10.3390/batteries8100146
Chicago/Turabian StyleXie, Xuan, and Rudolf Holze. 2022. "Electrode Kinetic Data: Geometric vs. Real Surface Area" Batteries 8, no. 10: 146. https://doi.org/10.3390/batteries8100146
Note that from the first issue of 2016, this journal uses article numbers instead of page numbers. See further details here.