Article

Effect of Sample Interval on the Parameter Identification Results of RC Equivalent Circuit Models of Li-ion Battery: An Investigation Based on HPPC Test Data

1
School of Mechanical Engineering and Mechanics, Xiangtan University, Xiangtan 411105, China
2
Fengfan Co., Ltd., Baoding 071051, China
3
School of Metallurgy and Environment, Central South University, Changsha 410083, China
*
Authors to whom correspondence should be addressed.
Batteries 2023, 9(1), 1; https://doi.org/10.3390/batteries9010001
Submission received: 14 October 2022 / Revised: 11 December 2022 / Accepted: 14 December 2022 / Published: 20 December 2022
(This article belongs to the Special Issue Materials and Interface Designs for Batteries)

Abstract

:
The validity of the equivalent circuit model (ECM), which is crucial for the development of lithium-ion batteries (LIBs) and state evaluation, is primarily dependent on the precision of the findings of parameter identification. In this study, the commonly used first-order RC (1-RC) circuit and second-order RC (2-RC) circuit models were selected for parameter identification. A time series of voltage with different sample intervals were used for function fitting based on the least square method, which were extracted from the hybrid pulse power characteristic (HPPC) test data of a commercial square punch LIB, and the sample intervals were set to be 0.1 s, 0.2 s, 0.5 s, and 1.0 s to evaluate the effect of sample interval on the parameter identification results. When the sample interval is more than 0.5 s, the results reveal that the 2-RC circuit model’s goodness of fit marginally declines, and for some data scenarios, the bias between the fitted terminal voltage curve and test curve increases obviously. With all of the sample intervals under consideration, the 1-RC circuit model’s imitative effect is satisfactory. This work demonstrates that the sample interval of data samples, in addition to the method itself, affects the accuracy and robustness of parameter identification, with the 1-RC circuit model showing larger advantages under low sample frequency compared to the 2-RC circuit model.

1. Introduction

Due to their high energy and power density, environmental friendliness, and extended cycling life, lithium-ion batteries (LIBs) are frequently used in a variety of energy storage scenarios [1,2,3]. As an illustration, LIBs are currently the main energy source for electric vehicles [4]. As chemical energy storage devices, LIBs’ internal complicated chemical and electrochemical interactions have a significant role in how well they operate at work. Numerous types of theoretical models of different kinds have been established and extensively researched in order to characterize the reaction processes and further demonstrate their association with external charge and discharge behaviors. For LIBs, there are primarily three different types of models: the equivalent circuit model (ECM), the electrochemical model, and the empirical model. Based on transitive and conservation interactions of electric charges and Li-ions, the pseudo-two-dimensions (P2D) model proposed by Newman et al. [5,6] is an example of an electrochemical model. The Butler-Volmer equation is also used to describe the extremely nonlinear kinetics of the electrode process. The electrochemical model consists of a set of nonlinear differential equations with numerous parameters, and its use in LIBs products is constrained by the high cost of solving these equations and the difficulty of identifying their parameters. Contrarily, the empirical model requires no formal mechanism description and is obtained using methods for mining vast datasets, such as support vector machines and artificial neural networks [7,8,9,10]. The prediction accuracy of an empirical model is heavily dependent on the training algorithm and training data and it lacks interpretability and needs a lot of data training based on existing datasets before deployment. ECM, on the other hand, combines the shared benefits of the aforementioned two categories of models and strikes a balance between the volume of data and the complexity of development. In ECM, the LIB is represented by a particular type of equivalent circuit made up of a number of electronic components, including a power supply, resistors, and capacitors. Changes in the electrical parameters of these electronic components can, to a certain extent, reflect changes in the LIB internally [11,12,13]. As an illustration, the resistor value corresponds to the internal resistor of the battery, and the resistor and capacitor (RC) branch of the circuit closely relates to polarization behaviors. Therefore, the ECM has the advantages of explicability, low development difficulty, and convenient deployment when compared to the electrochemical model and empirical model and has grown to be a potent instrument for the design and operation of LIBs. The most common use for ECM is in the battery management of electric vehicles (EVs), where it can be quickly and readily implemented as an online control algorithm into the battery management system (BMS) [14,15,16,17]. Online predictions of the battery’s functioning status, including its state-of-charge (SOC), state-of-health (SOH), and state-of-power (SOP), can be made using the data provided by the ECM.
In recent years, significant research efforts have been undertaken to improve the reliability and accuracy of the parameter identification of ECM since the precision of its parameters largely determines the prediction accuracy of ECM. The data analysis technique is the key to the accuracy of the parameter identification of ECM, which is typically implemented based on the terminal voltage curve during pulse charge and discharge process. The least squares approach [18], which has historically been the popular method of parameter identification, was used to fit the parameters in the early stages. In an effort to increase the precision and adaptability of parameter identification, many techniques based on supervised machine learning models have been developed, such as the separate parametric particle swarm (PPS) optimization method [19] and simulated annealing algorithm [20]. Whereas, those machine learning methods have some disadvantages, such as high computational cost, poor applicability, and insufficient explainability, and the classical least squares parameter fitting method still has an absolute preponderance in off-line identification fields.
The choice of sample interval, which has largely been overlooked in recent studies, is equally important to the parameter identification process as the parameter identification technique. It is common knowledge that parameter identification is done by data analysis of the dynamic and nonlinear time series of LIB’s terminal voltage. If the sample interval is too long, some crucial data points in the time series’ abrupt change phase may be missed, which would surely lower the identification accuracy and maybe produce false findings. The sample interval cannot be infinitely small due to limitations on sampling devices, data storage capacity, communication bandwidth, and computing power; therefore, it requires urgent investigation to confirm the appropriate sample interval while taking model cost, reliability, and accuracy into account.
The charge–discharge test and its data analysis are the main methods utilized in this work to examine the effects of sample interval on the parameter identification findings. The most popular RC equivalent circuit models were chosen as the ECM for the research object. The hybrid pulse power characteristic (HPPC) test data was examined to determine the characteristics of ECM after the experiment setup and test procedure were initially introduced in this work. The sample intervals used in the test data analysis stage were 0.1, 0.2, 0.5, and 1.0 s. The parameters of the first-order RC (1-RC) circuit and second-order RC (2-RC) circuit models were both determined using the least squares parameter fitting method at the same time. The identification accuracy and reliability of various sample intervals for each circuit mode were then compared using contrastive analysis, and further discussion from the perspective of an engineering application was made. Finally, the summary was concluded in the last section of this paper.

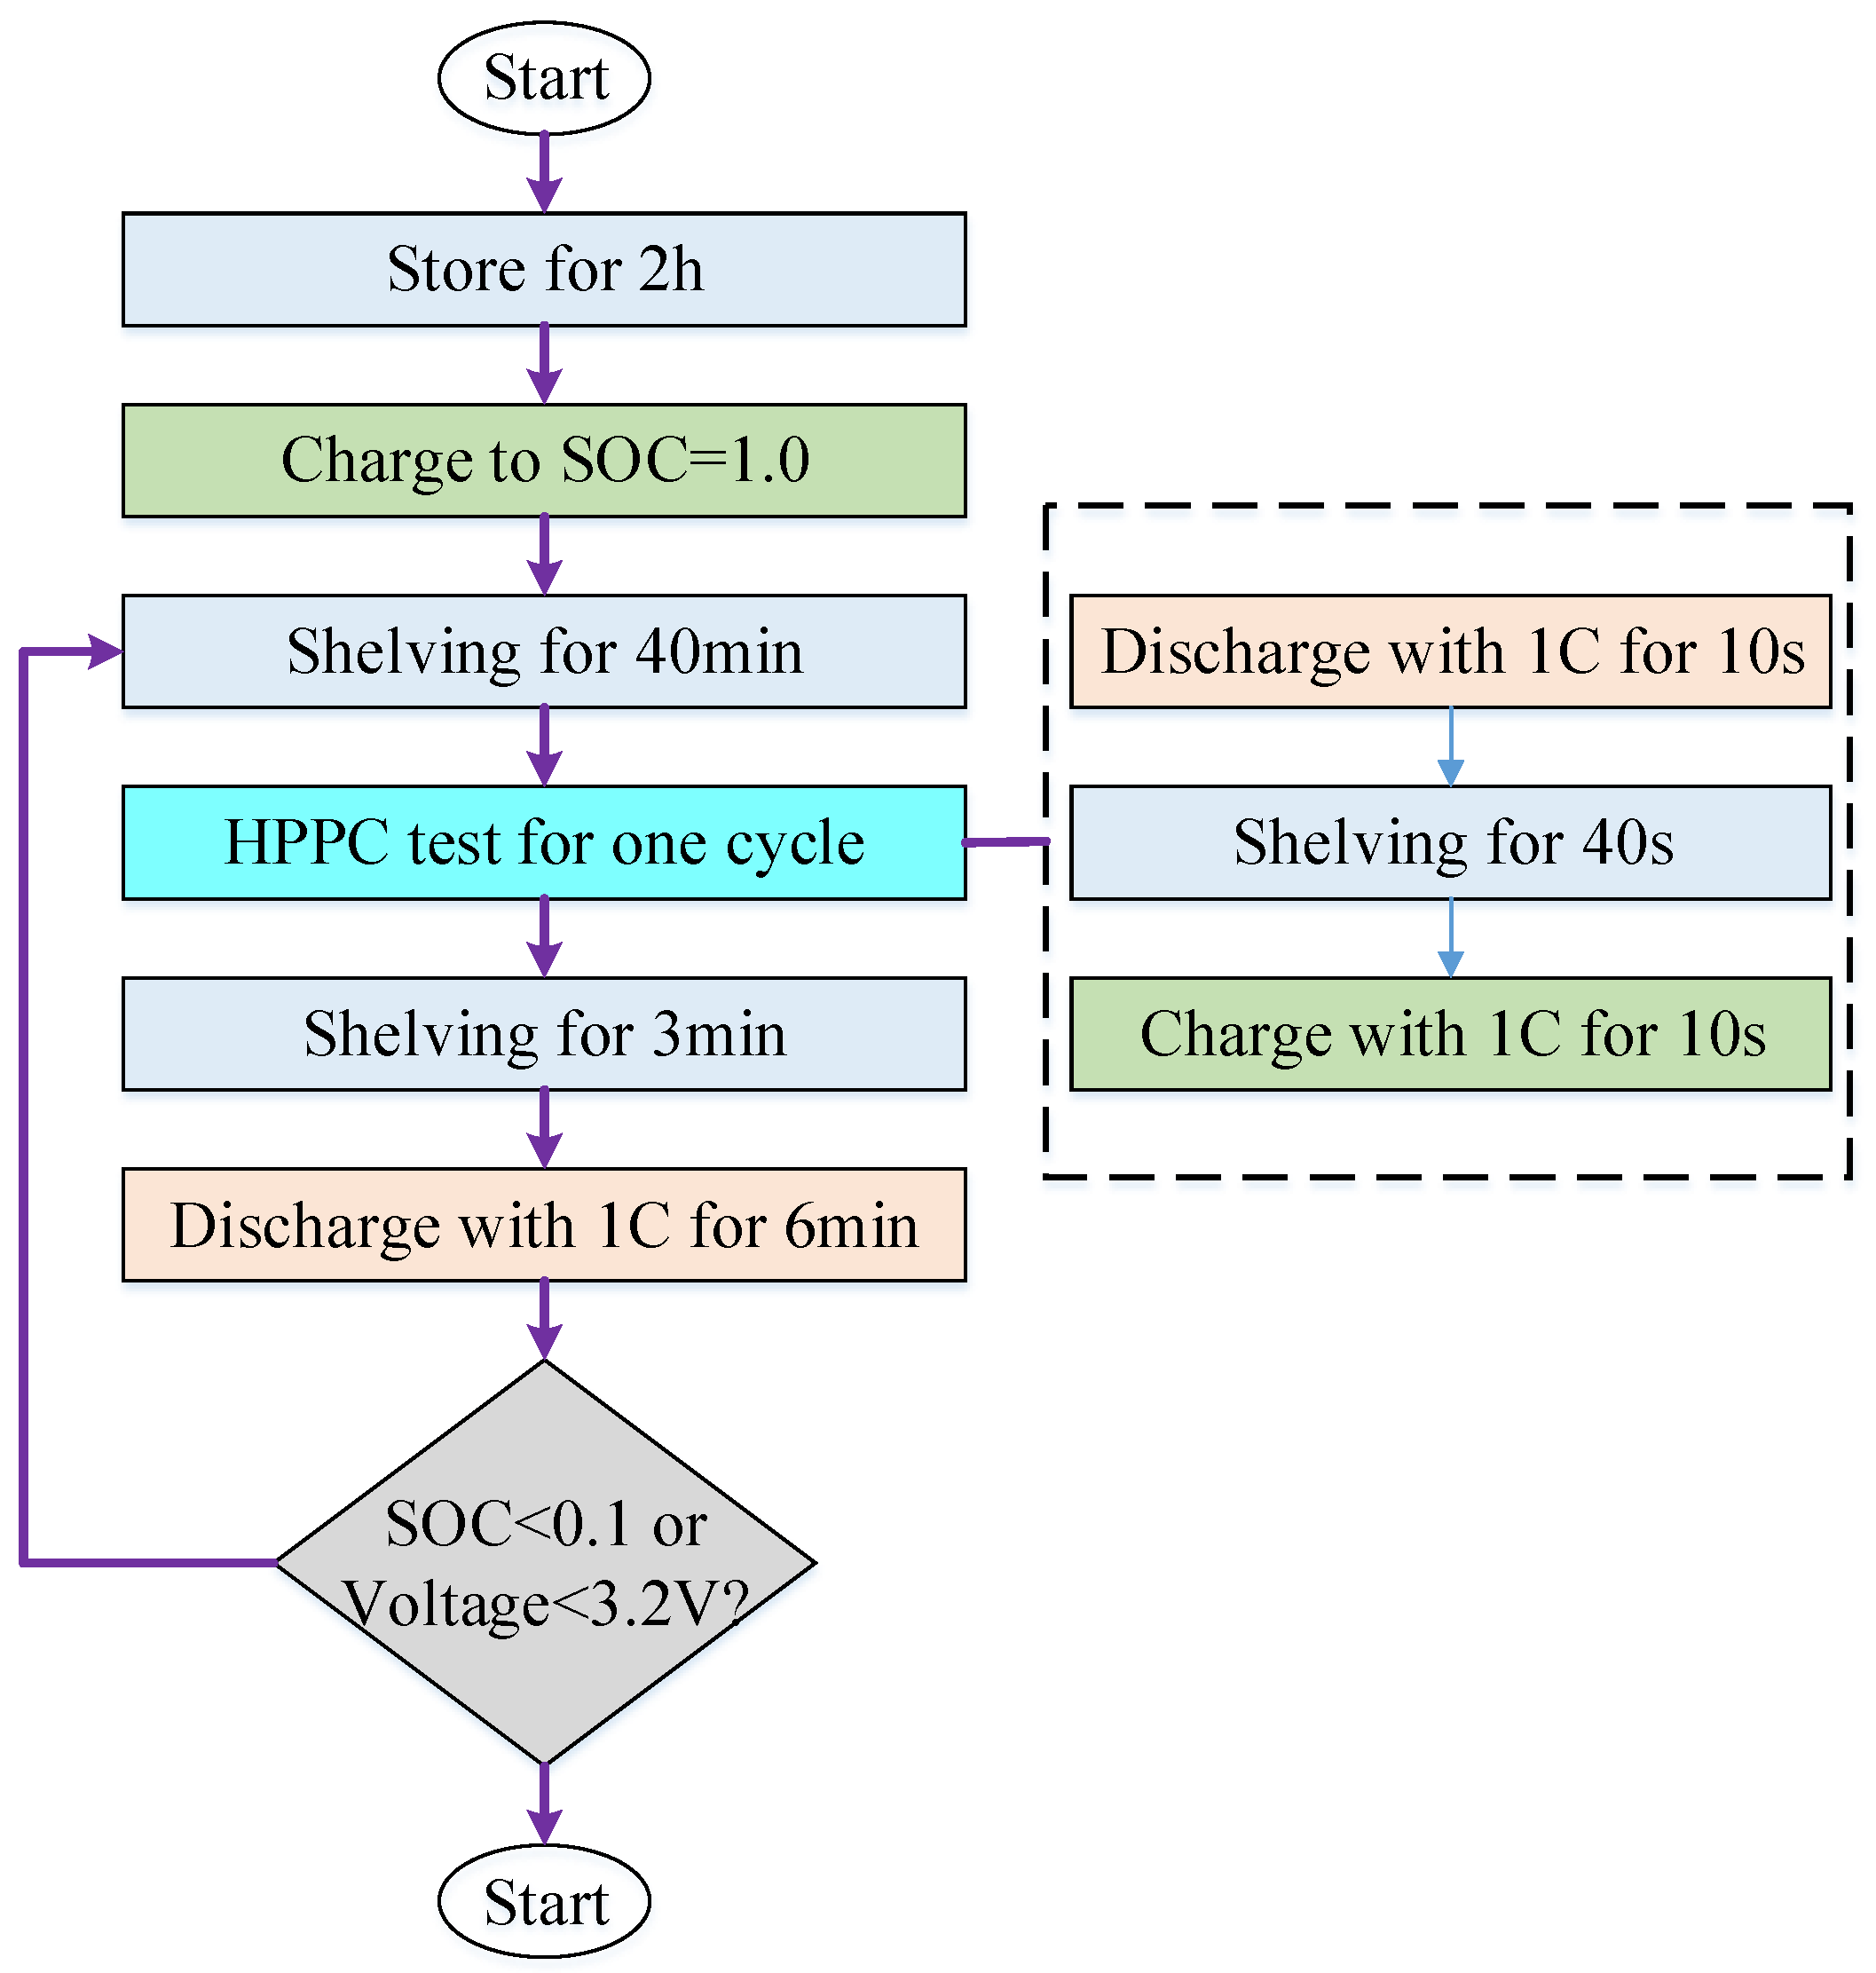
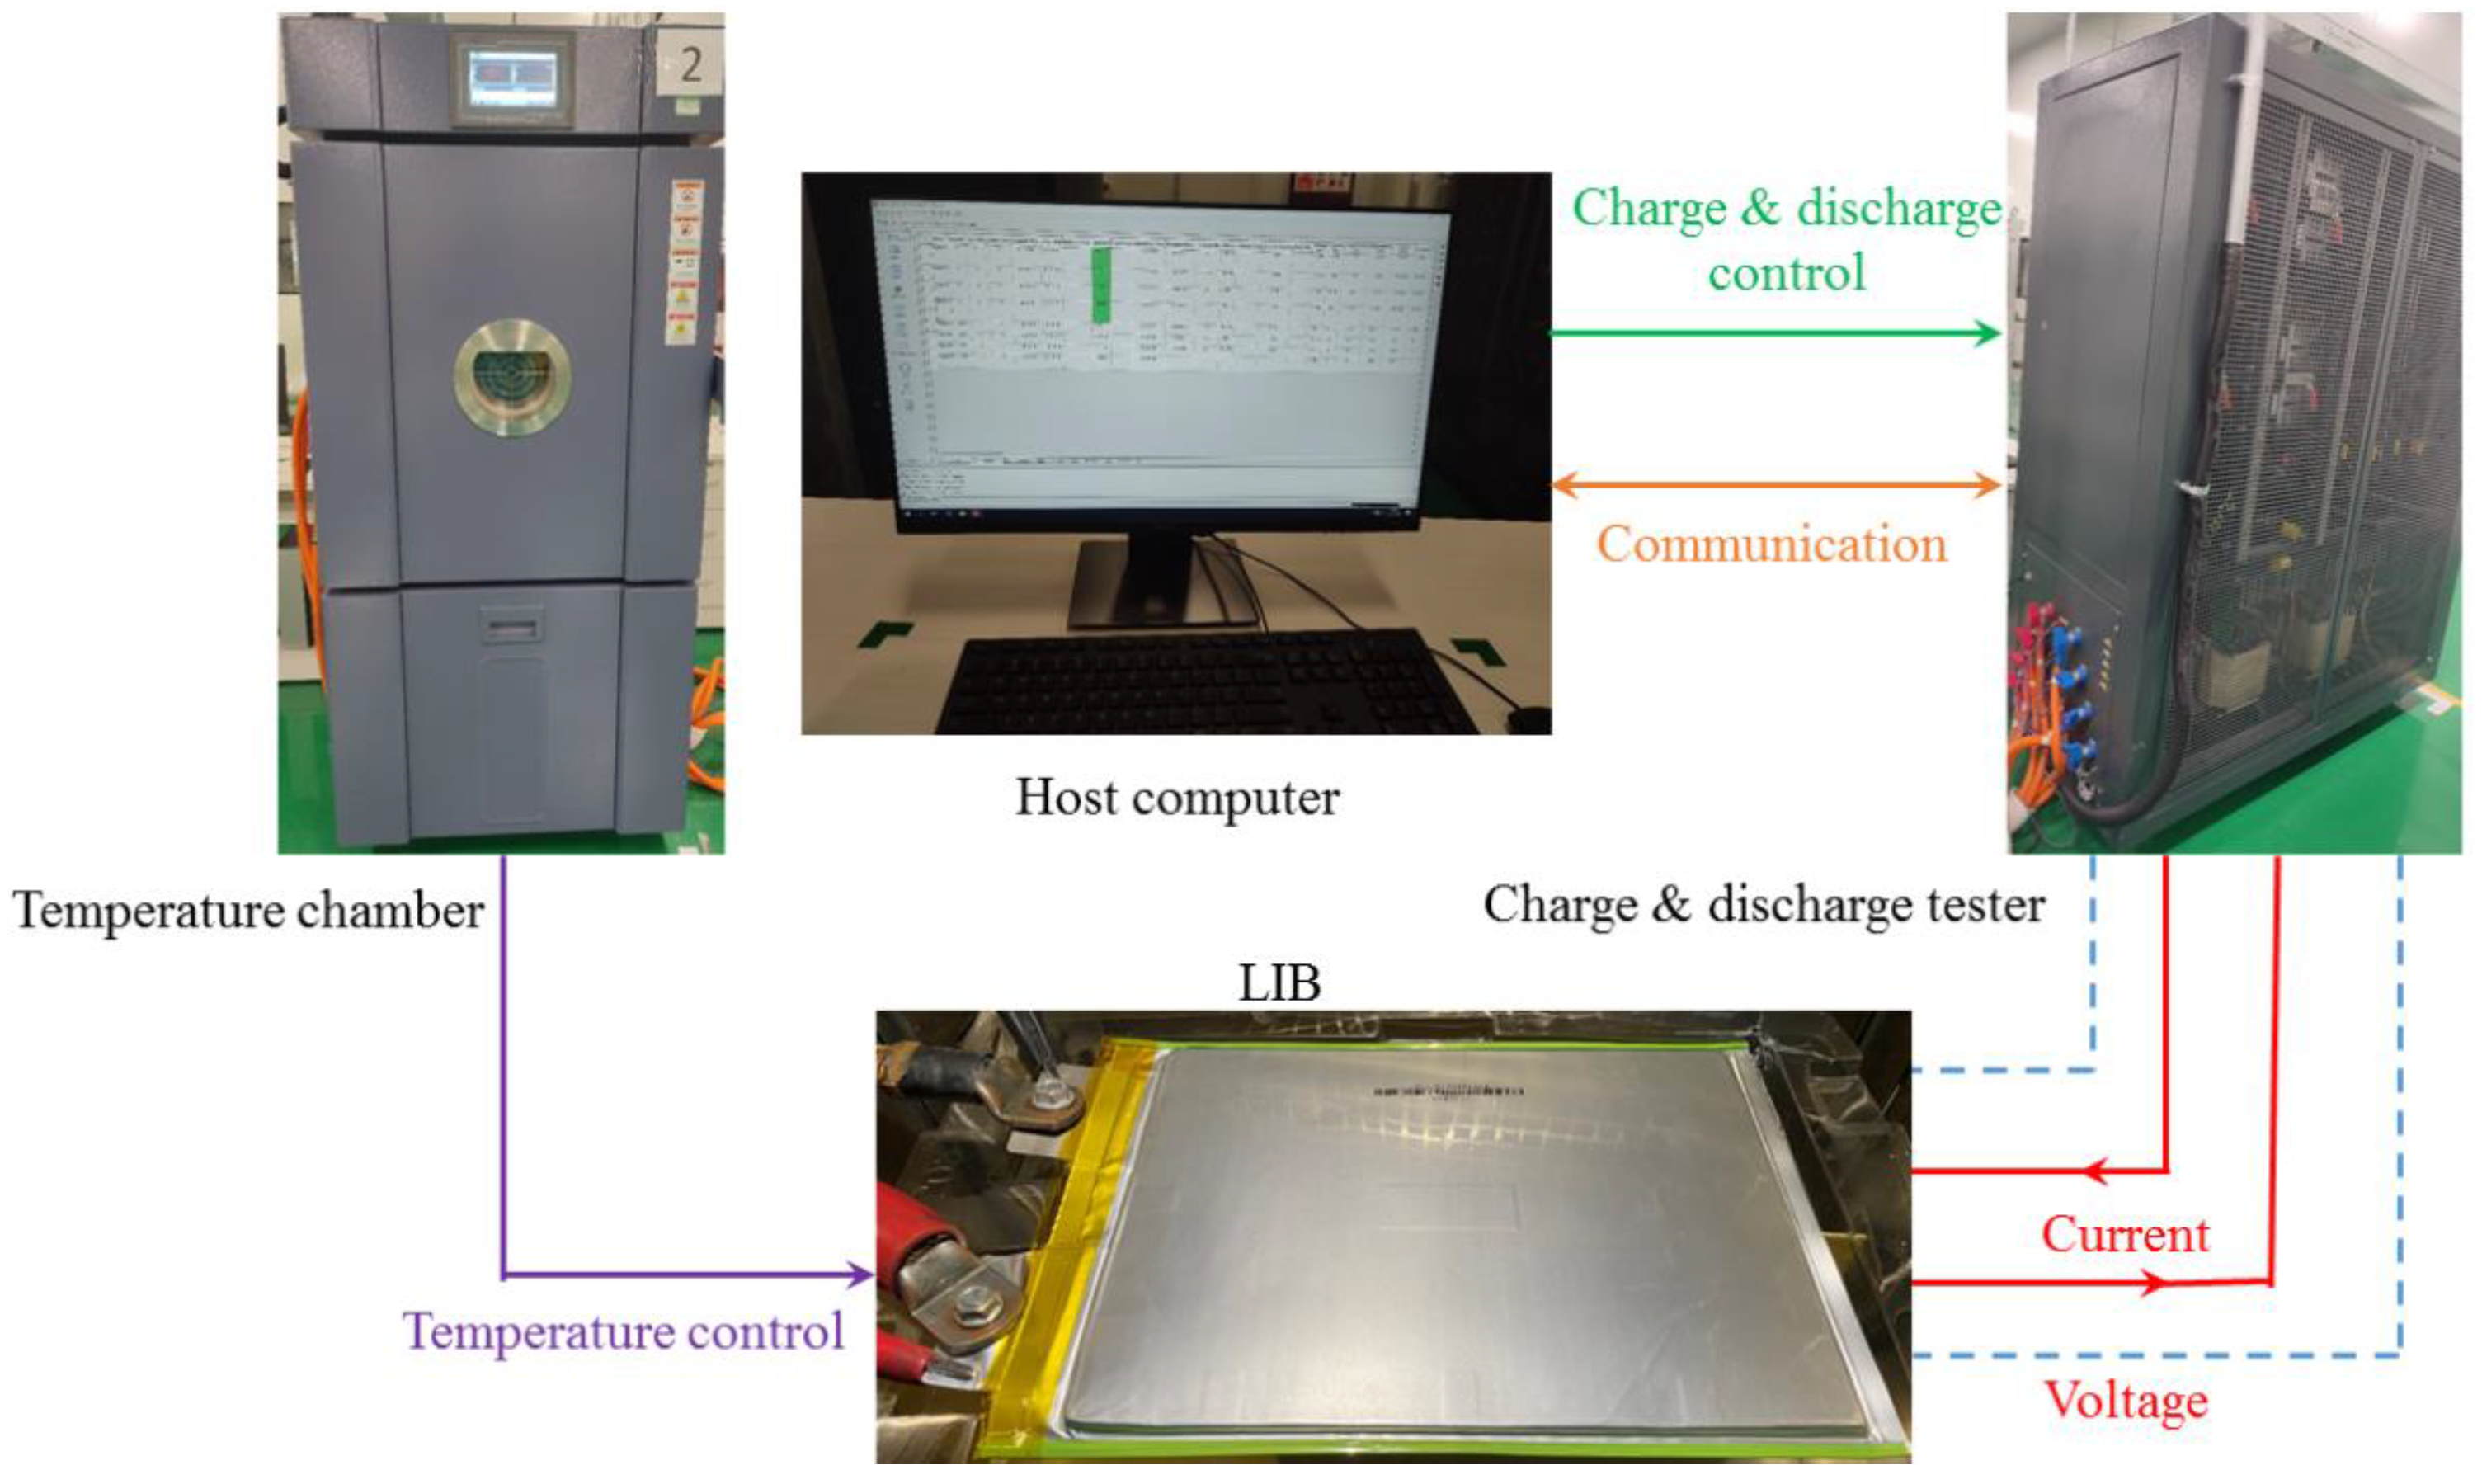
2. Experiment Setup and Test Procedure

The major design and performance parameters of the test object in this study, a square punch LIB with the NCM/C material system, are provided in Table 1. Square punch LIBs are popular in electric vehicles and electric energy storage facilities due to their benefits of thin thickness, high energy density, low internal resistance, and good safety. A host computer, a high- and low-temperature test chamber (temperature range: –60 °C to 150 °C), and a charge and discharge tester (current range for charge/discharge: 1.5–100 A, voltage range for charge/discharge: 0–5 V) make up the majority of the experimental apparatus, as depicted in Figure 1. The charge and discharge cabinet is responsible for the charge and discharge test of the LIB according to the specified current and can start or stop the test steps according to the monitored voltage and duration. The high and low temperature test chamber provides the required temperature environment for the test object. Through the TCP/IP protocol, the host computer can communicate with the charge and discharge tester. The host computer manages the entire charge and discharge test process in accordance with input order and gathers the voltage signals from the LIB online.
Since the focus of this study is on the impact of sample interval on the identification outcomes of 1-RC and 2-RC circuit models, the experiment only looked at one ambient temperature value and current magnitude. The experiment’s workflow is shown in Figure 2 as a flow chart. The LIB was kept in the temperature chamber for two hours prior to the charge and discharge test, with the environment temperature set at 20 °C. There are two parts to the charge and discharge test. The LIB was fully charged in the first stage using the 1 C constant current–constant voltage (CCCV) mode, which involved first charging the LIB at a constant 1 C rate until it reached the charge cut-off voltage, at which point the charging voltage remained the same until the current was reduced to 0.05 C. The second stage was made to accommodate the LIB’s HPPC testing for various state-of-charge (SOC) values. The second stage had 10 test cycles because the SOC range was between 0.1 and 1.0 and its test interval was 0.1. For each cycle, there was a 40 min shelving period before the HPPC test and a 3 min shelving period following the HPPC test. The LIB was discharged for 6 min at a steady current of 1 C at the end of each cycle, which caused the SOC value to decrease by 0.1 in preparation for the following test cycle. The HPPC test was conducted in accordance with the FreedomCAR battery test manual for power-assist hybrid electric vehicles [21], which calls for a pulse discharge lasting 10 s, a pulse charge lasting 10 s, and a 40 s shelving period. Both the pulse discharge and charge currents were 1 C in the test of this work.
The temperature of the test environment for the LIB was maintained at 20 °C ± 1 °C during the whole testing procedure, and the sample frequency of signals, including battery voltage and current, was set at 10 Hz, which is the maximum handling capacity of the apparatus. When the voltage of the LIB exceeds the cut-off voltage range, the charge and discharge tester can immediately end the experiment operation for reasons of security.

3. Test Data Analysis Method

3.1. Electric Circuit Model

For the parameter identification of the 1-RC circuit model and the 2-RC circuit model, experimental data from each HPPC test was selected. Figure 3 is an illustration of their circuit structures. The 1-RC circuit comprises of a voltage source VIOC, an RC branch and a resistor RI0 in series, and the RC branch includes parallel resistor RI and capacitor CI. Compared with 1-RC, there is one more RC branch in the series loop for the 2-RC circuit model, where the first RC branch includes parallel resistor RII1 and capacitor CII1, and the second RC branch includes parallel resistor RII2 and capacitor CII2. The 1-RC and 2-RC circuit models are represented by the subscripts ‘I’ and ‘II’ in the parameters. It can be assumed that the above parameter values solely relate to the SOC of the battery in practice because the effects of temperature, cycle number, and charge/discharge rate on circuit parameters are not taken into account in this study.

3.2. Parameter Identification

Establishing a correlation between the parameters using the circuit theory is essential to the parameter identification approach. The least squares method is then used to fit the parameters to the HPPC test results. For instance, the 1-RC circuit model’s electric behavior can be described in Equations (1) and (2) during the parameter identification process:
v ˙ I = 1 R I C I ν I + 1 C I i B a t
ν B a t = V O C ν I R 0 i B a t
where V o c and ν B a t are the open-circuit voltage and terminal voltage of the LIB, respectively; ν I is the voltage of the RC branch; i B a t is the battery working current ;   R 0 is the resistance of the series resistor ;   and   R I and C I are the resistance and capacitance of the RC branch, respectively.
Equations (1) and (2) must be translated into a discrete temporal description for data analysis purposes, as demonstrated in Equations (3) and (4):
ν I , k + 1 = ν I , k e T s τ I + R I ( 1 e T s τ I ) i B a t , k  
ν B a t , k = V O C ( S O C k ) ν I , k R 0 i B a t , k  
where k denotes the sample order; Ts represents the sample period; and τI is the time constant of the RC branch, which equals the products of the resistor RI and capacitor CI:
τ I = R I C I  
Later, the characteristics of the HPPC test curves must be combined with the identification of each parameter. Figure 4 displays the voltage and current variation curves that are acquired during an HPPC test cycle, which also includes a shelving period before and after the HPPC test. The current value in Figure 4b is negative when the LIB is discharging, and positive when it is charging.
Only the test curves corresponding to the discharge pulse and its neighboring shelving period are used in this work. Before the HPPC test, there is a shelving period during which the voltage is steady, and the mean voltage readings during this time can be taken as the open-circuit voltage VIOC. The discharge pulse begins at time t = t1 and finishes at time t = t2, and at these two points, only the influence of the resistor R0 can account for the abrupt decrease and jump in terminal voltage:
R 0 = Δ V 1 + Δ V 2 2 I  
Where Δ V 1 and Δ V 2   represents the abrupt changes in voltage at t = t1 and t = t2, respectively, and I denotes the discharge current.
Following the discharge pulse, there is a 40 s relaxation phase that begins at time t = t2 and ends at time t = t3. The terminal voltage over time in this time period can be described as follows:
ν B a t ( t ) = V O C ( t 1 ) ν I ( t 1 ) e t τ I  
In Equation (7), there are three unknown quantities needed for identification, namely V O C ( t 1 ) , ν I ( t 1 ) and τI, within which the time term t1 means the value of these two parameters at the moment of t = t1.
Equation (7) can be turned into an exponential function for analysis’ sake as follows:
f(t) = A + Beαt
where:
{ A = V O C ( t 1 ) B = V 1 ( t 1 ) α = 1 τ I  
At this point, two parameters of the 1-RC circuit model have been identified, specifically the source VIOC and the resistor RI0. As the product of the remaining two parameters RI and CI is obtained from the fitted value of α, the resistor RI of the RC branch can be calculated according to its relaxation characteristics.
In these conditions, it is simple to use the nonlinear least squares technique to find the optimal values of A, B, and α for fitting between the test curve and the nonlinear function curve.
At this stage, the source VIOC and the resistor RI0 have been identified as the two parameters of the 1-RC circuit model. As the product of the remaining two parameters RI and CI is obtained from the fitted value of α, the resistor RI of the RC branch can be calculated according to its relaxation characteristics:
R I = ν I ( t 1 ) ( 1 e T d i s c h a r g e τ I ) I d i s c h a r g e  
where T d i s c h a r g e is the lasting time of the pulse discharging period, and it equals 10 s in this study.
Finally, the following formula can be used to determine the value of the capacitor CI:
C I = τ I R I  
The 2-RC circuit model’s parameter identification technique is identical to that of the 1-RC circuit model, with the exception that because it includes two RC branches, an additional parameter needs to be fitted for the additional RC branch. Due to space limitations, details for the parameter identification process can be seen in reference [18].

3.3. Handling of Data Sample

The sample interval varies depending on the actual conditions of the application scenario because the sample frequency of the current and voltage signals of the LIB greatly depends on the work frequency of the sensors, the sampling capacity of the signal acquisition card, the communication rate, and the memory capacity of the hardware equipment. The explored interval time Δt includes 0.1 s, 0.2 s, 0.5 s, and 1.0 s in order to assess the impact of sample interval on the results of parameter identification for the 1-RC and 2-RC circuit models. A suitable sample frequency was chosen to gather information for parameter identification from the original test data source for each interval time. For example, Figure 5 displays sampling points for various intervals, which roughly corresponds to the voltage discharge curve in Figure 4a.

4. Results

4.1. Validity Assessment

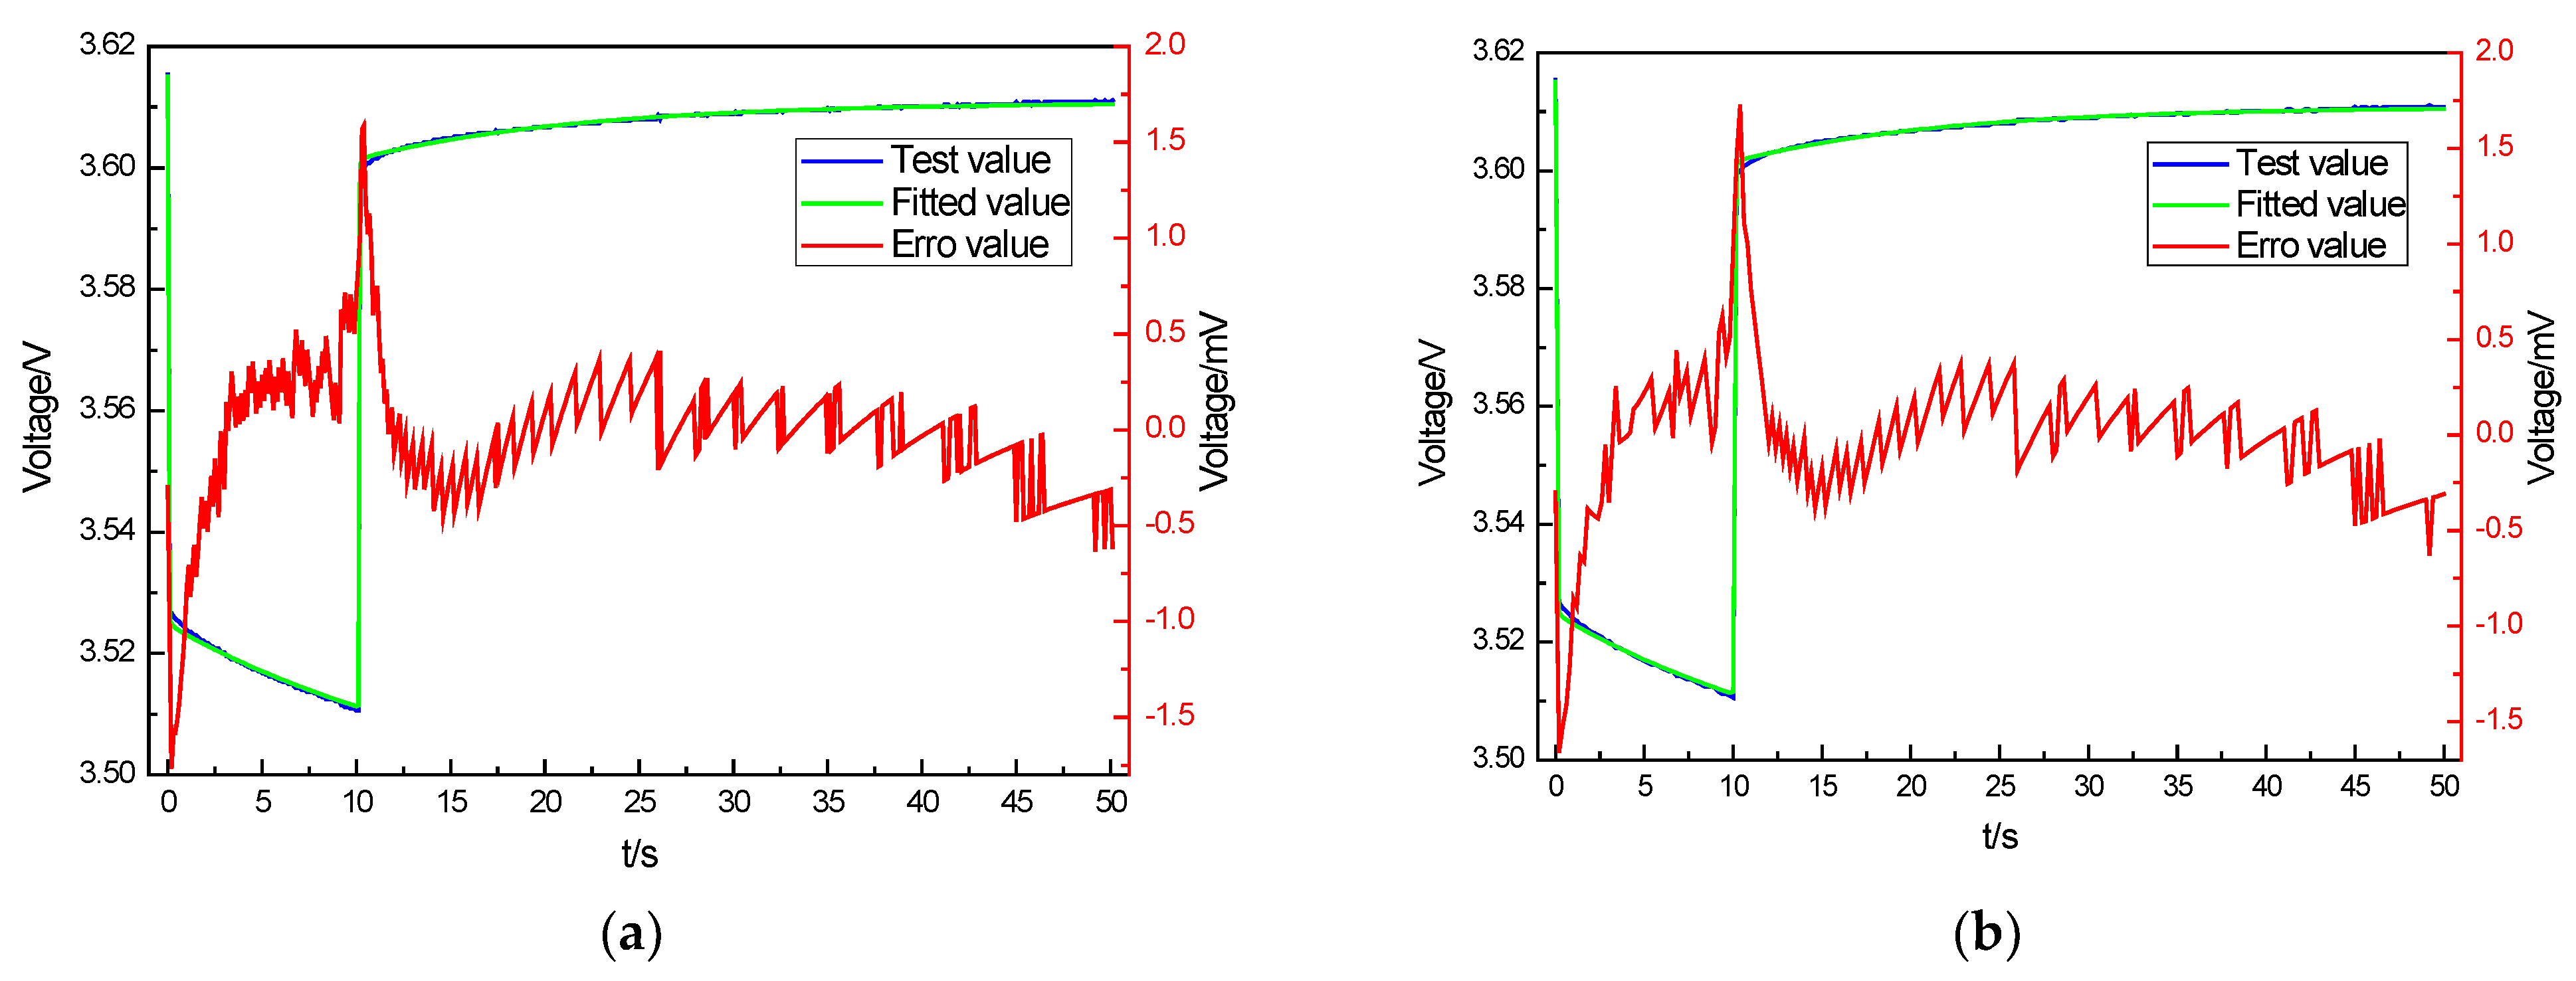
4.1.1. Goodness of Fit

The function fitness for the relaxation duration of each HPPC test, which is closely related to the identification of parameters of the RC branches, is the most crucial phase of the entire parameter identification procedure. As listed in Table 2, the perspective of goodness of fit R2 [22], which shows the degree of fitting the regression curve to the original data points, can be used to observe the general validity of data fitting for various sample intervals and circuit models.
The goodness of fit R2 for the majority of data cases exceeds 0.99, and its minimum value is still above 0.95, which appears in the function fitting for the 2-RC circuit model for the interval time Δt = 1.0 s, SOC = 0.4. This information allows us to conclude that all fitting results of the function in Equation (8) are quite acceptable. The 1-RC circuit model’s fitting effects are flawless for all data cases, and the goodness of fit R2 for each case is greater than 0.99. When the interval time Δt is 0.5 s or 1.0 s, the goodness of fit R2 of a number of data examples for the 2-RC circuit model slightly decreases in comparison to 1-RC circuit model. The aforementioned phenomenon is caused by two factors. For starters, because the 2-RC circuit model requires fitting one extra parameter during the nonlinear fitting step, the difficulty of the fitting procedure itself arises. Another factor is that when the time interval grows, there are less data points available for the fitting process, which ultimately results in a decline in goodness of fit. Consequently, for some data cases of the 2-RC circuit model, the goodness of fit R2 decreases when the two aforementioned components are combined.

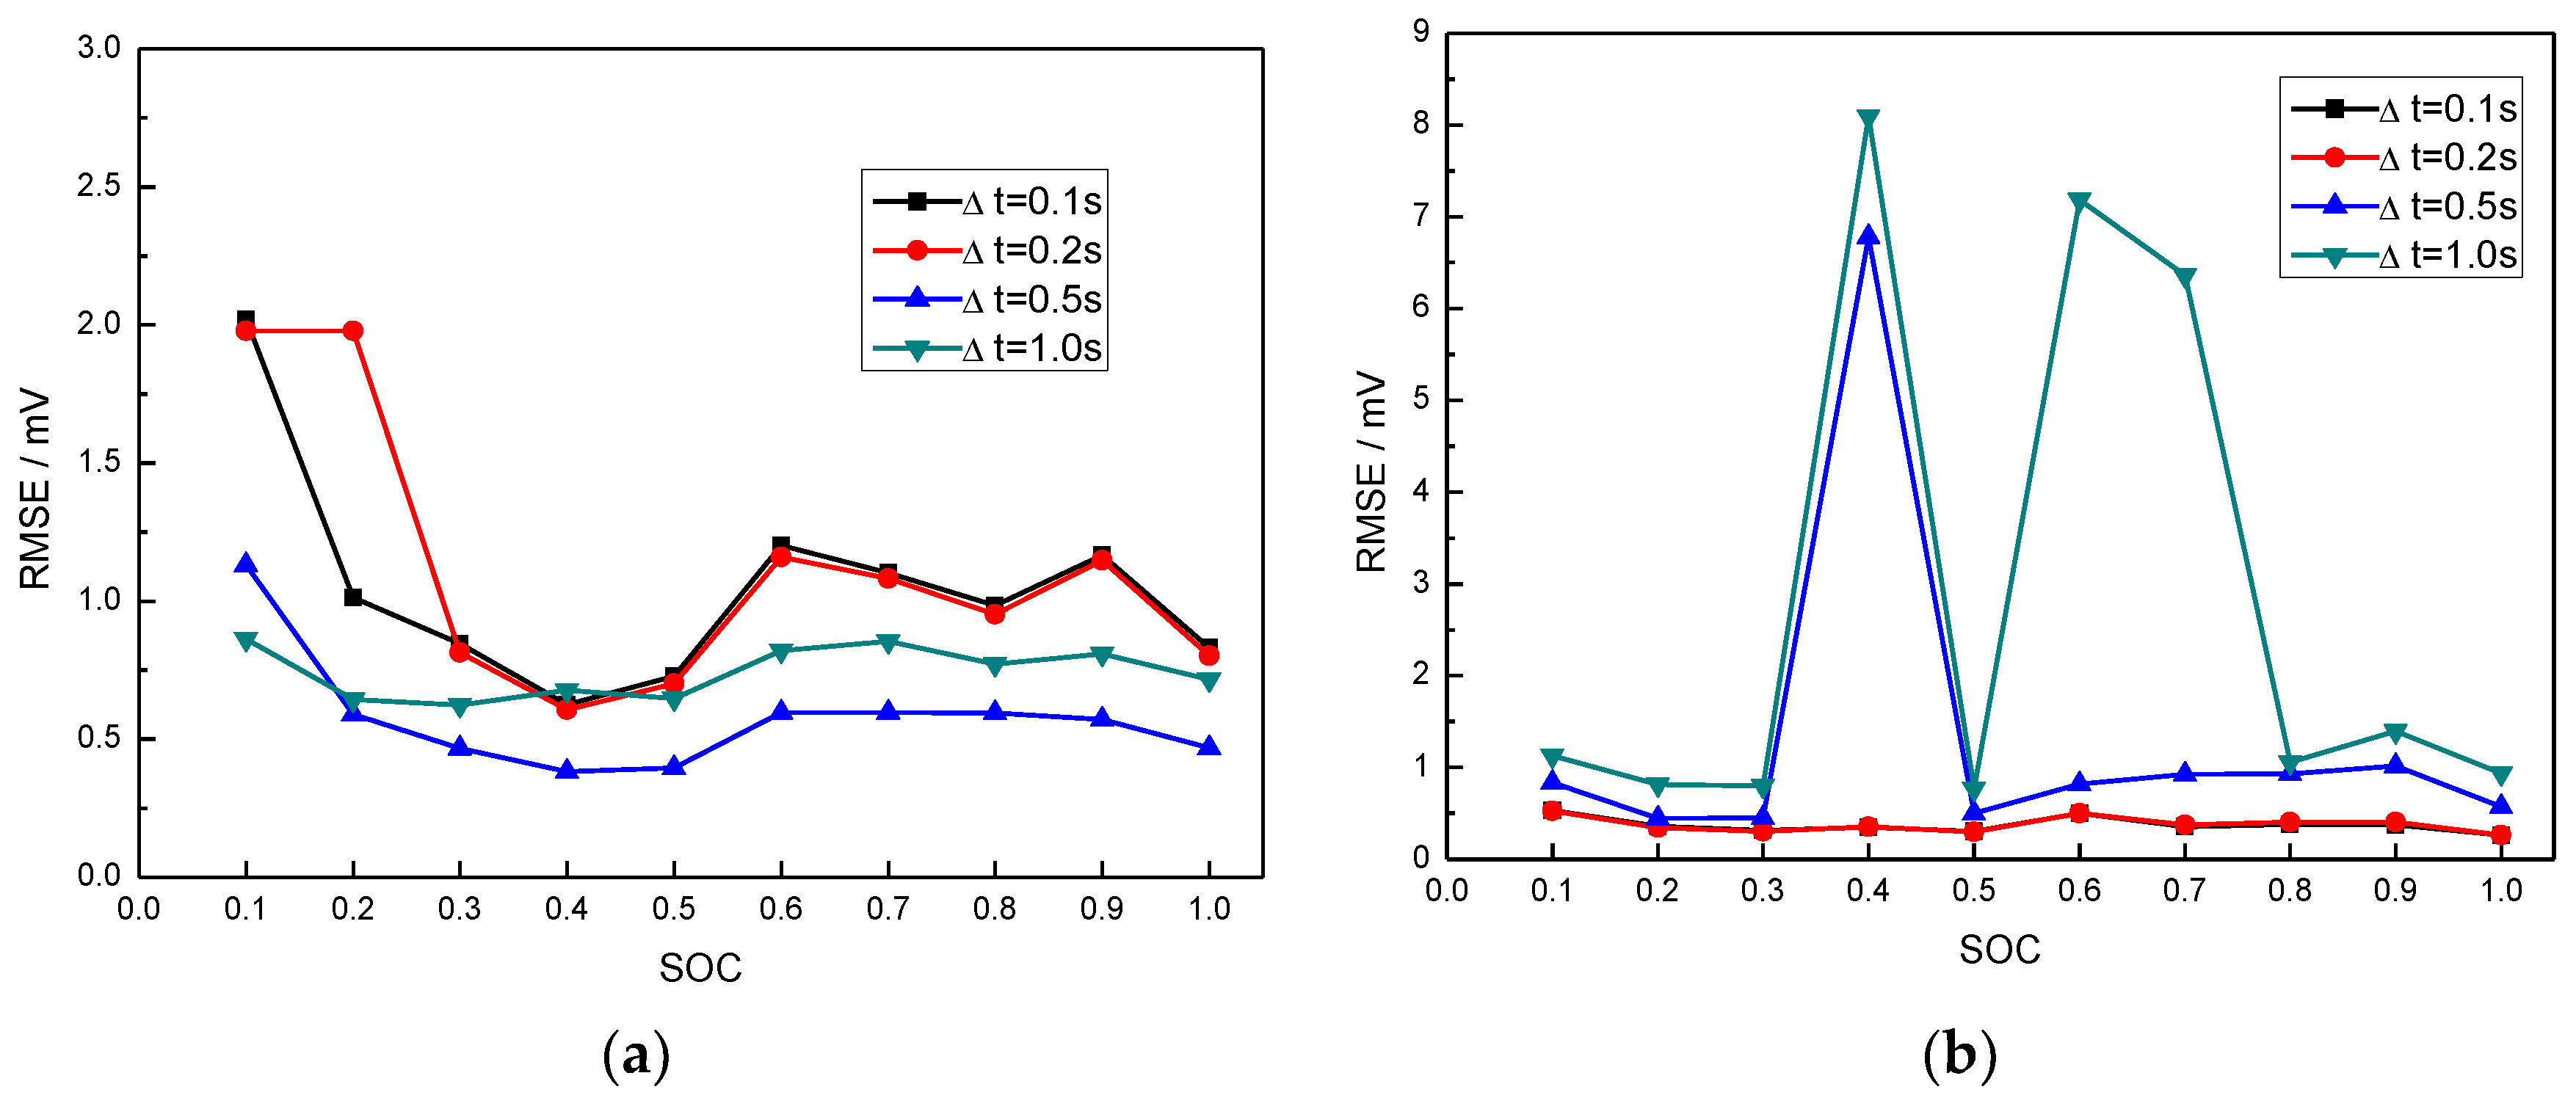
4.1.2. Root Mean Square Error

The root mean square error (RMSE) between the tested terminal voltage and fitted terminal voltage of the LIB of each HPPC test data case is presented in Figure 6 and can be written as follows to more accurately assess the overall data fitting effect:
R M S E = 1 N k = 1 n ( V k V ^ k ) 2  
where k is the sample order; N is the total number of sample points; and Vk and V ^ k represent the tested terminal voltage and fitted terminal voltage of the LIB, respectively.
Figure 6a illustrates that the 1-RC circuit model’s RMSE values may all be regulated to be below 2.0 mV, further demonstrating the model’s high identification accuracy. Although most of the RMSE values in Figure 6b are less than 2.0 mV, several values for examples with Δt = 0.5 s and Δt = 1.0 s are notably high. For instance, at SOC = 0.4, the RMSE values for Δt = 0.1 s and Δt = 0.2 s are only about 0.35 mV, but they increase to 6.78 mV and 8.09 mV, respectively, for Δt = 0.5 s and Δt = 1.0 s.
The voltage curves for various time intervals at SOC = 0.4 throughout the discharge and relaxation phases are shown in Figure 7 for the 1-RC circuit model and Figure 8 for the 2-RC circuit model to access the fitting effect in greater depth. As observed in Figure 7, curves of the test voltages and the fitted voltages closely match up for each time interval, and their errors can be kept controlled below 2.0 mV the entire time. Figure 8a,b, where the time interval is Δt = 0.1 s and Δt = 0.2 s, respectively, show the similar tendency. However, as shown in Figure 8c,d, the error value between the test voltage and that of the fitted voltage grows considerably as the time interval increases to Δt = 0.5 s and Δt = 1.0 s. Its maximum value reaches as high as 16.55 mV for Δt = 0.5 s and 19.61 mV for Δt = 1.0 s. In contrast to curves in other cases, the difference between the test curve and fitted curve for the above two time intervals of the 2-RC circuit model is extremely clear.
When the time interval Δt exceeds 0.5 s, Table 2 in Section 4.1.1 roughly indicates that the goodness of fit R2 of the 2-RC circuit model declines slightly for some values. The comparison of RMSE in this section further demonstrates that the fitting deviation rises sharply in the aforementioned circumstances. Therefore, the 1-RC circuit model clearly outperforms the 2-RC circuit model in terms of accuracy and resilience when the sampling interval is rather wide.

4.2. Parameters Identification Results

4.2.1. Open-Circuit Voltage Values

The value of open-circuit voltage Voc comes from terminal voltage before the discharge initial time point of the HPPC test. As there is a very long period of time for shelving before discharge, the open-circuit voltage keeps exceeding steady. For instance, the curve of voltage over time of the rest period before the first pulse discharge is shown in Figure 9, and the scope range of the fluctuation of voltage is kept within 1 mV before the pulse discharge. At each SOC value, the open-circuit voltage remains unchanged no matter what the equivalent circuit model is or how much of the sample interval it chooses. Figure 10 shows its change curve with SOC, and it can be observed there is a near linear tendency between the SOC and the Voc, which accords with the typical characteristics of the voltage platform of LIB with the NCM/C material system.
The terminal voltage before the discharge beginning time point of the HPPC test is where the open-circuit voltage, or Voc, gets its value. The open-circuit voltage remains exceedingly constant because there is a very long time for shelving before the discharge. No matter how large the sampling interval is or what the equivalent circuit model is, the open-circuit voltage at each SOC value remains constant. Its change curve with SOC is shown in Figure 10, and it can be seen that there is a nearly linear tendency between SOC and Voc. This is consistent with the usual properties of the voltage platform of LIB with the NCM/C material system.

4.2.2. Resistance and capacitance values of 1-RC circuit model

Figure 11a–c, respectively, show the identified parameter curves with SOC for various time intervals of the 1-RC circuit model, including curves of RI0, RI and CI. Figure 11d shows the curves of product of RI and CI, specifically the time constant τI of the RC branch. With the exception of the time constant τI, curves with varied time intervals exhibit only minor differences in their tendency to vary with SOC. This is because both RI and CI work together to determine τI, their respective curve deviations will add up and cause a minor trend among τI~SOC curves for various time intervals. Additionally, for each parameter, the curves at Δt = 0.1 s and Δt = 0.2 s coincide almost entirely.

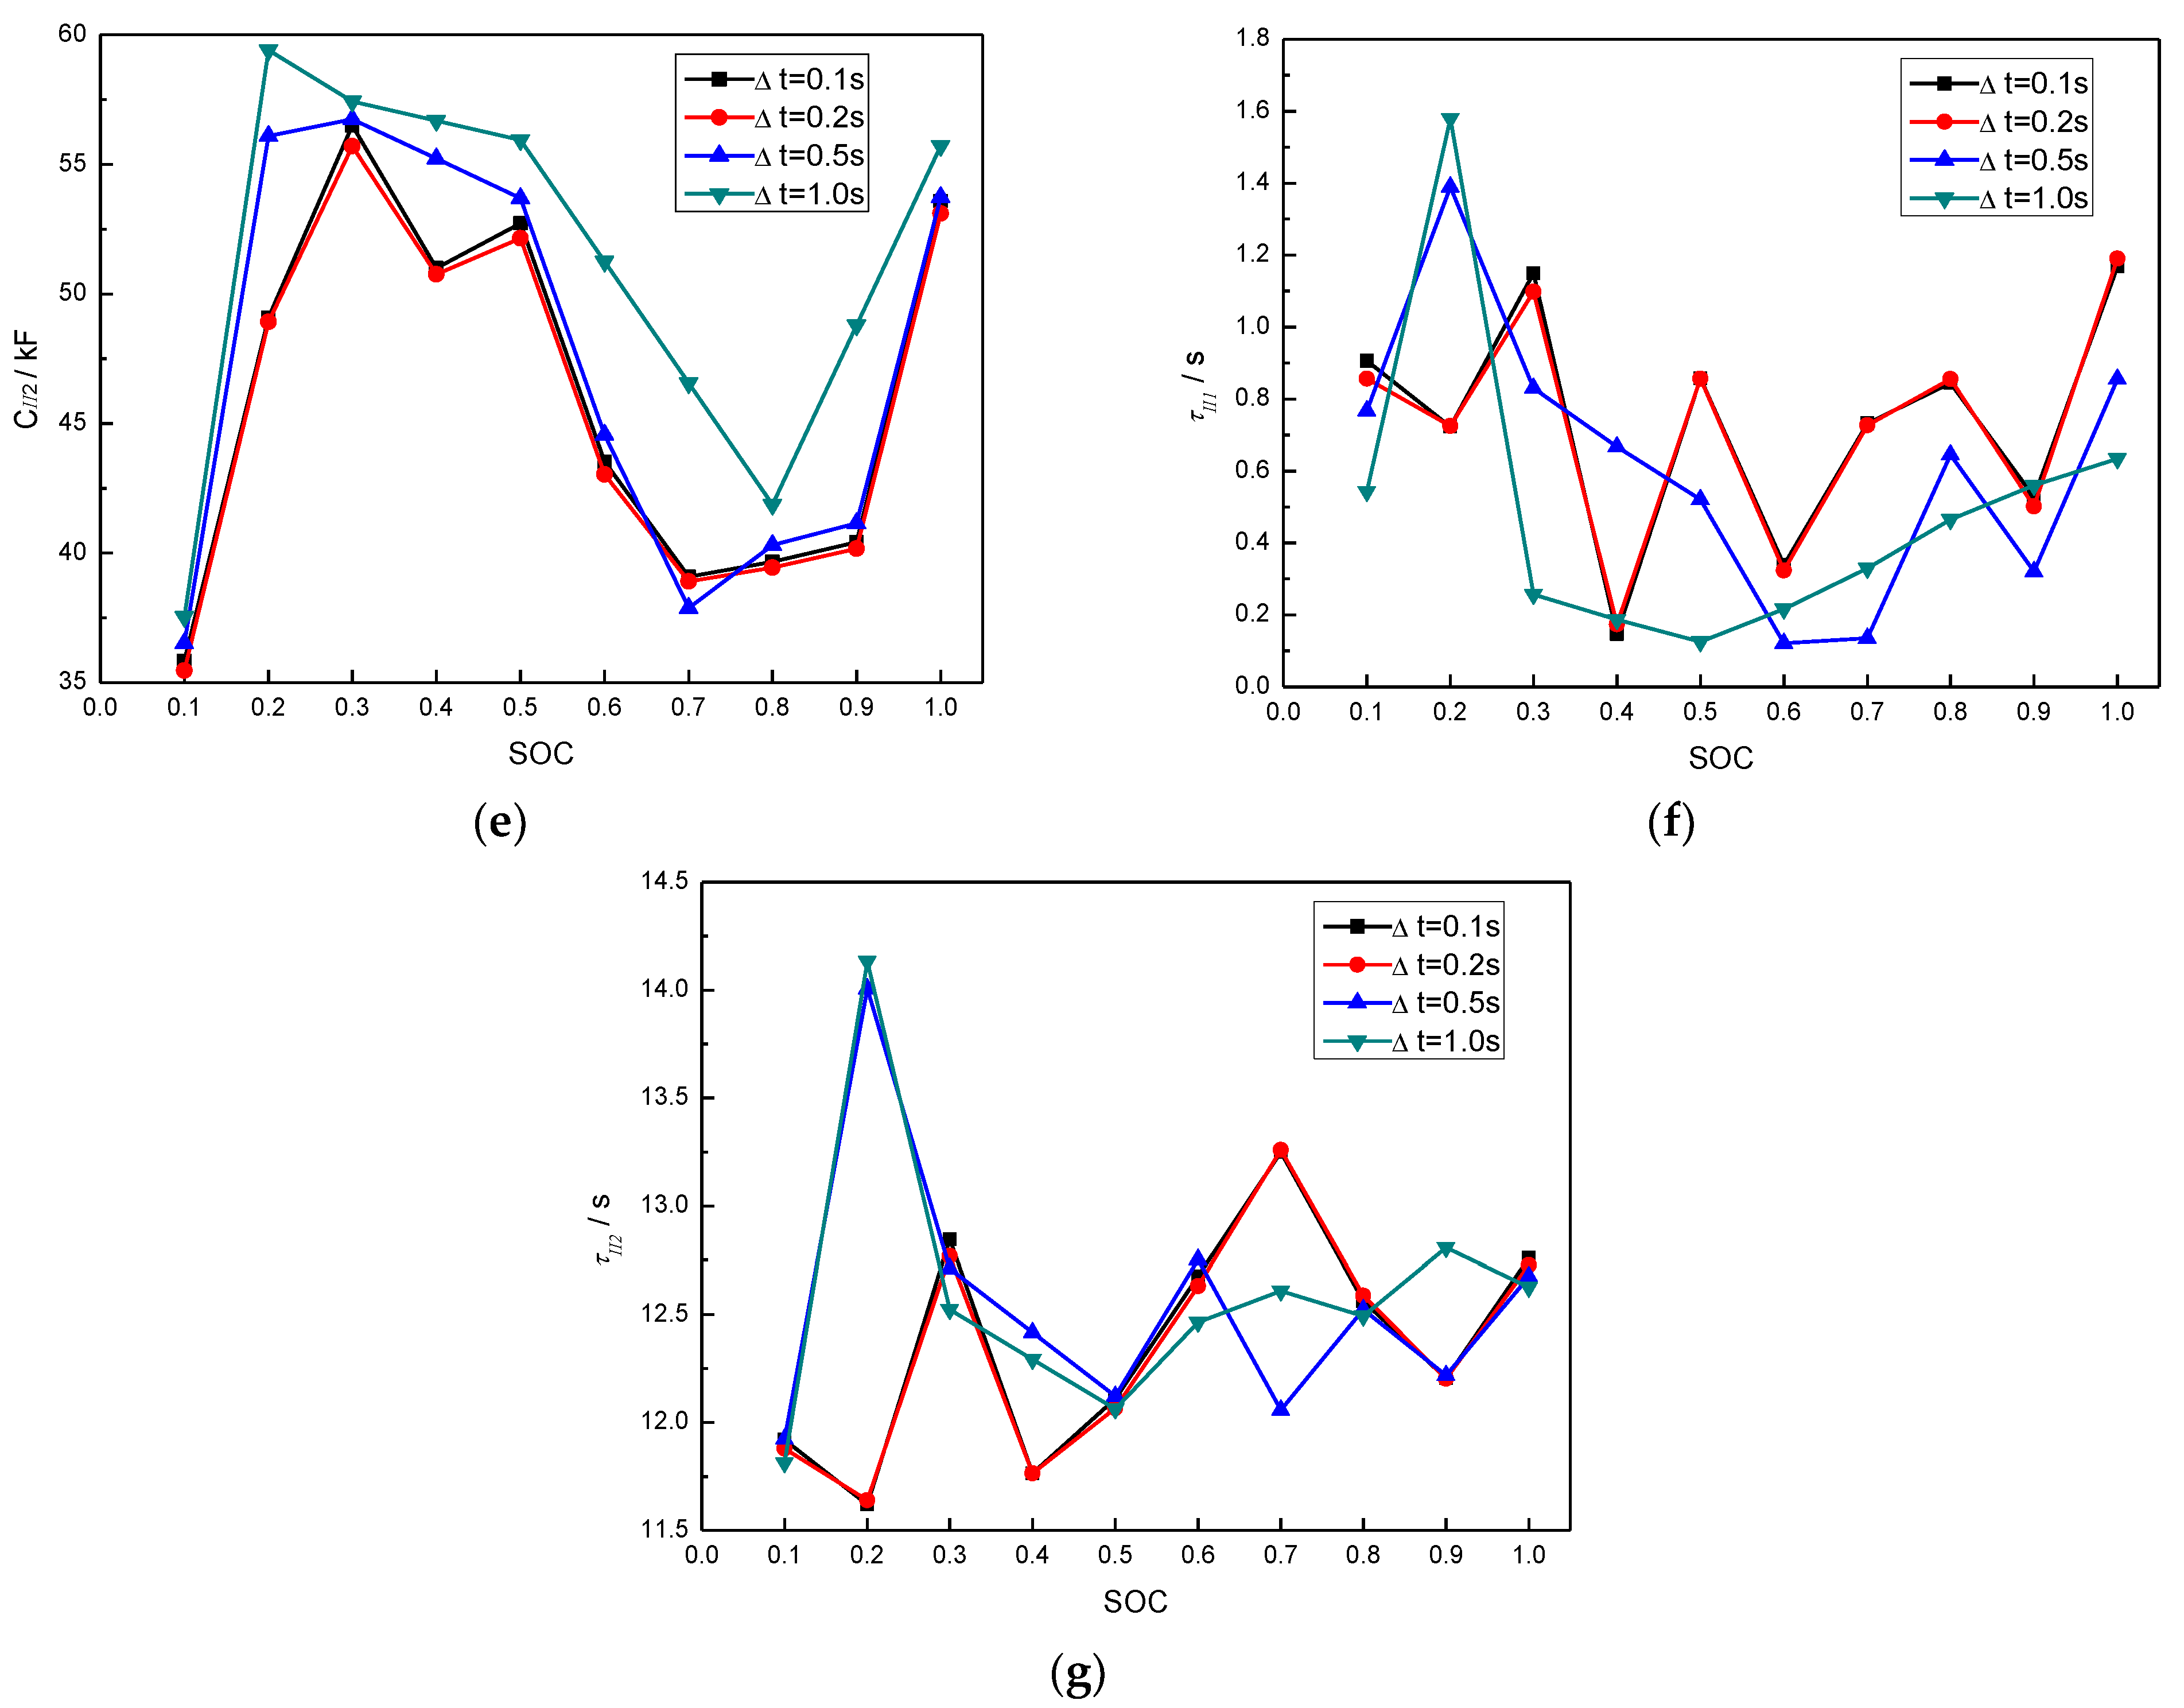
4.2.3. Resistance and Capacitance Values of 2-RC Circuit Model

Figure 12 shows the 2-RC circuit model’s identified parameter curves with SOC for various time intervals. The time constant τII1 is the product of the resistor RII1 and capacitor CII1 in the first RC branch, and the time constant τII2 is the product of the resistor RII2 and capacitor CII2 in the second RC branch. Time constant τII1 represents the electrochemical polarization at the interfaces of electrode material and battery separator, while the time constant RII2 typically refers to the degree of concentration polarization within the LIB [23,24,25]. In order to offer more detailed and accurate information on mass transfer and electrochemical behaviors with the LIB, the 2-RC circuit model uses two independent resistors (RC).
The pattern of the degree of variation tendency differs from the 1-RC circuit model. Resistance curves RII0, RII1, and RII2 show a variation pattern that implies rather high similarity. However, the apparent discrepancy in the variation trend of the capacitance curves CII1 and CII2 leads to a significantly different variation tendency for the time constants τII1 and τII2.

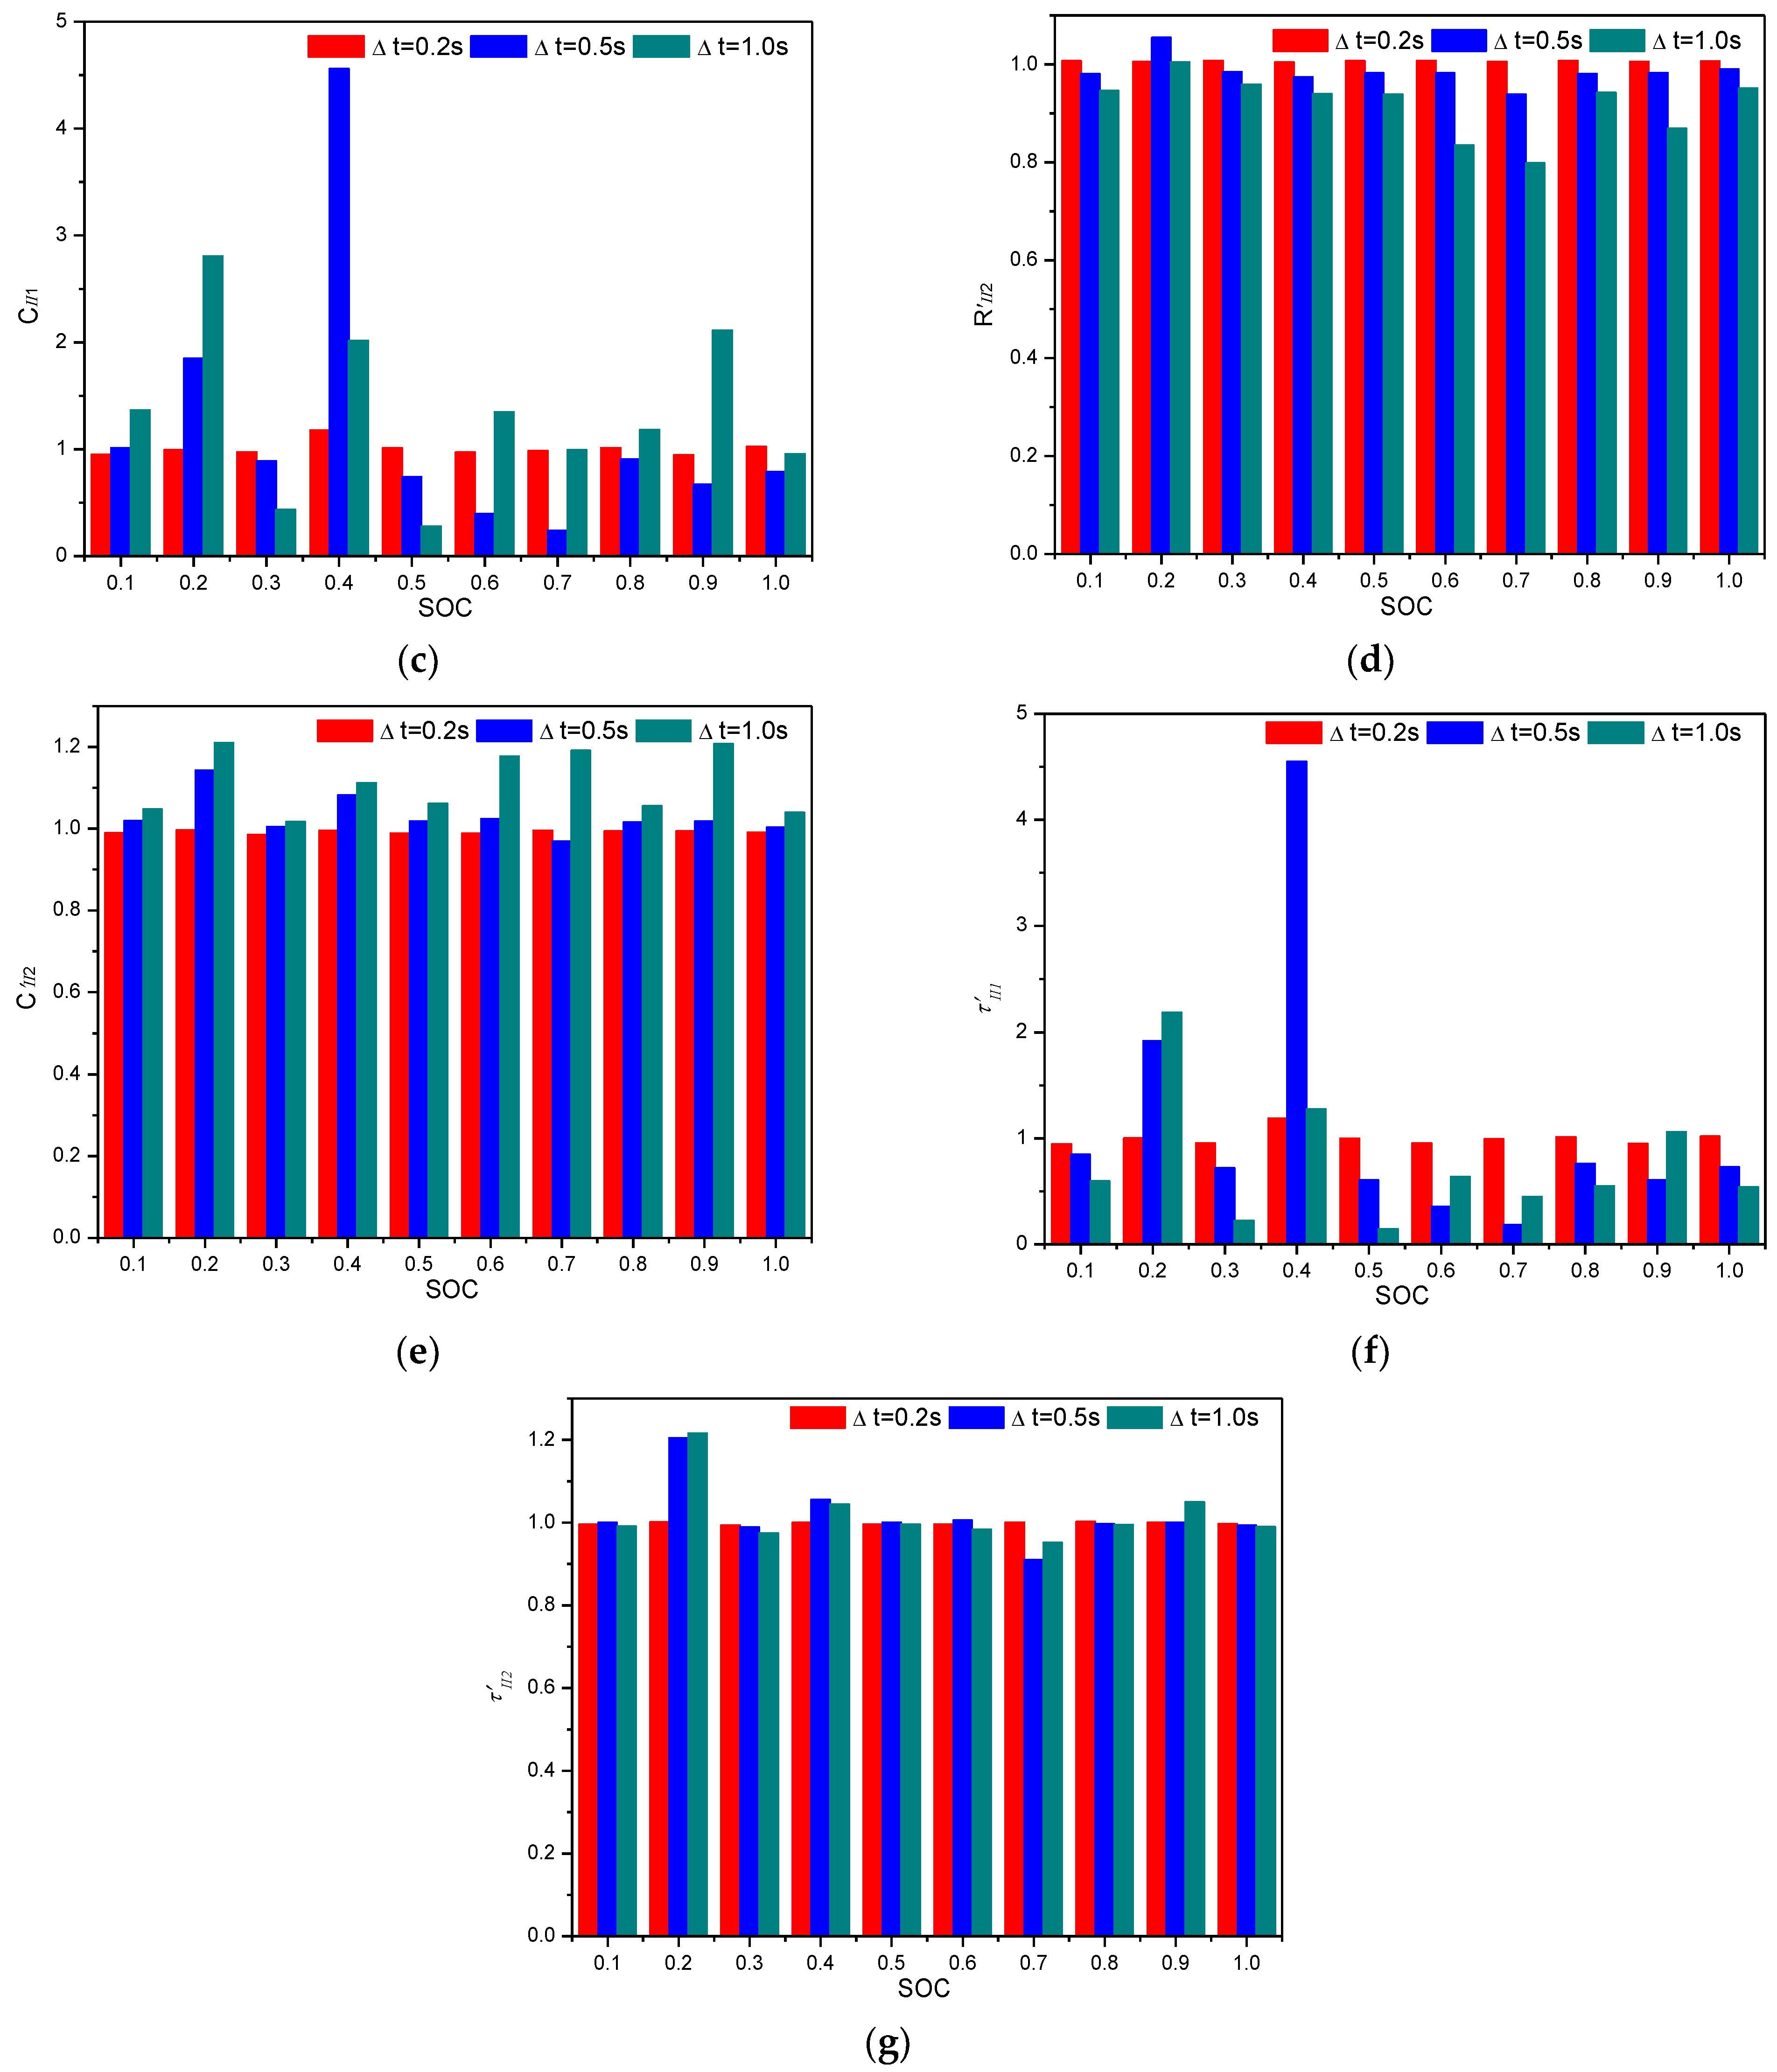
4.3. Non-Dimensional Parameters

The changes of non-dimensional parameters with SOC are represented in Figure 13 for the 1-RC circuit model and Figure 14 for the 2-RC circuit model, to more clearly and directly describe the impact of the time interval on the values of each parameter. The ratio of the parameter P0 to parameter Px is the non-dimensional parameter P′:
P′ = P0/Px
where P0 stands for parameter values with a time interval of 0.1 s, which serves as the analysis’ reference point, and Px stands for parameter values with different time intervals, such as 0.2, 0.5, and 1.0 s. Since P0 and Px both relate to the same type of parameter, their ratio P′ can represent the relative change in that parameter caused by changing the sampling period.
Figure 13 shows that all non-dimenssional values fall within the range of 1.0 ± 0.2, demonstrating that the relative change ratio brought on by changing the sample interval can be kept under 20%. When the sample time Δt surpasses 0.5 s, non-dimensional values for parameters other than R′II0 indicate a significant difference in Figure 14, particularly for non-dimensional parameters R′II1, C′ II1 and τ ′II1.

5. Discussion

The influence law of the sample interval on many parameters is rather complex, as shown in the data discussed above. But overall, whether it is regarded from the fitting accuracy or variation trend perspectives, the influence of the sample interval on parameters of the 1-RC circuit model is quite modest. Contrary to the 1-RC circuit model, the 2-RC circuit model’s fitting accuracy and parameter values are significantly affected by changes to the sample interval. Although it is not the primary focus of this work, the mechanism of influence of the sample interval is fairly complex and might be strongly related to the step of resistance calculation for RI0 and RII0. Equation (6) states that only the sudden voltage changes at the start and end time points, when the slope of the voltage curve is relatively significant, determine the values of RI0 and RII0. The voltage values at the instants of the start and end time points cannot be accurately caught if the sampling period is too long, leading to significant calculation errors in the resistances RI0 and RII0. According to Figure 5, the initial voltage value following the start moment of discharge is 3.9639 V, which is employed in the calculation of RI0 and RII0 if the sampling interval is Δt = 0.1 s or Δt = 0.2 s. That voltage value drops to 3.9614 V when the sample interval is increased to Δt = 0.5 s, and its divergence from the value obtained with Δt = 0.1 s is 2.5 mV. The voltage value ultimately drops to 3.9595 V when the sampling interval is increased to Δt = 1.0 s, and the divergence further rises to 4.4 mV, which ultimately results in a clear calculation error for the resistances RI0 and RII0.
BMS is utilized for the online evaluation and control of the LIBs since they can be used in a variety of working situations and its performance status can change at any moment. Gaining a comprehensive understanding of the internal performance conditions—which is typically based on the equivalent circuit model—is the BMS’s primary goal. The relationship between parameter identification results and their influencing factors, such as ambient temperature, charge–discharge rate, SOC, and SOH, has been the subject of extensive investigation under the proposed idea [26,27,28,29,30]. The results of the investigation in this work, however, show that the choice of the sample interval also has a significant impact on the results of parameter identification, which has been disregarded in recent research. In order to identify an acceptable sampling interval with high fitting accuracy and computational stability, a preceding time independent test is advised. Research on the influencing factors of parameters of similar circuit models must, therefore, consider the effect of sampling interval.
The choice of equivalent circuit model type is a significant implication of this work. In general, a model can provide more information the more sophisticated it is. The 2-RC circuit model, for instance, has an additional RC branch compared to the 1-RC circuit model, allowing it to offer time constants τII1 and τII2 simultaneously and provide greater context for the functioning of LIBs. On the other hand, the high order circuit model’s parameter identification process is more difficult and unreliable. Additionally, the high order circuit model needs significantly shorter sample intervals to keep its parameter identification stability. Therefore, while selecting the kind of identical circuit models for many real-world LIBs applications [31,32], such as electric vehicles and energy storage power plants, it is important to strike a balance between identification precision, robustness, and facility conditions.

6. Conclusions and Future Work

This paper, to the best of the authors’ knowledge, is the first to describe the effect of sample interval on the identification results of equivalent circuit models of LIB through experimental testing and data analysis. To create the dataset for analysis, a series of HPPC tests were first run on a square punch LIB with the NCM/C material system. The validity and particular parameter findings for both the 1-RC circuit model and 2-RC circuit model were compared after the parameter identification results with various sample intervals were computed using the least square method. The effect and cause of sample interval on the outcomes of parameter identification were described based on the comparison between the 1-RC and 2-RC circuit models, and the choice of equivalent circuit model type was also discussed in accordance with application needs and user requirements. The key conclusions are:
  • Both the 1-RC circuit model and the 2-RC circuit model have fitting accuracy that is adequate for sample intervals of small duration, such as Δt = 0.1 s or Δt = 0.2 s. The 1-RC circuit model still exhibits a pleasing imitative effect when the sample interval Δt is greater than 0.5 s, while the fitted validity of the 2-RC circuit model suffers noticeably.
  • The 2-RC circuit model’s resilience decreases as a result of the fitted flaw, which mostly focuses on the parameters of resistances and capacitances of the RC branches.
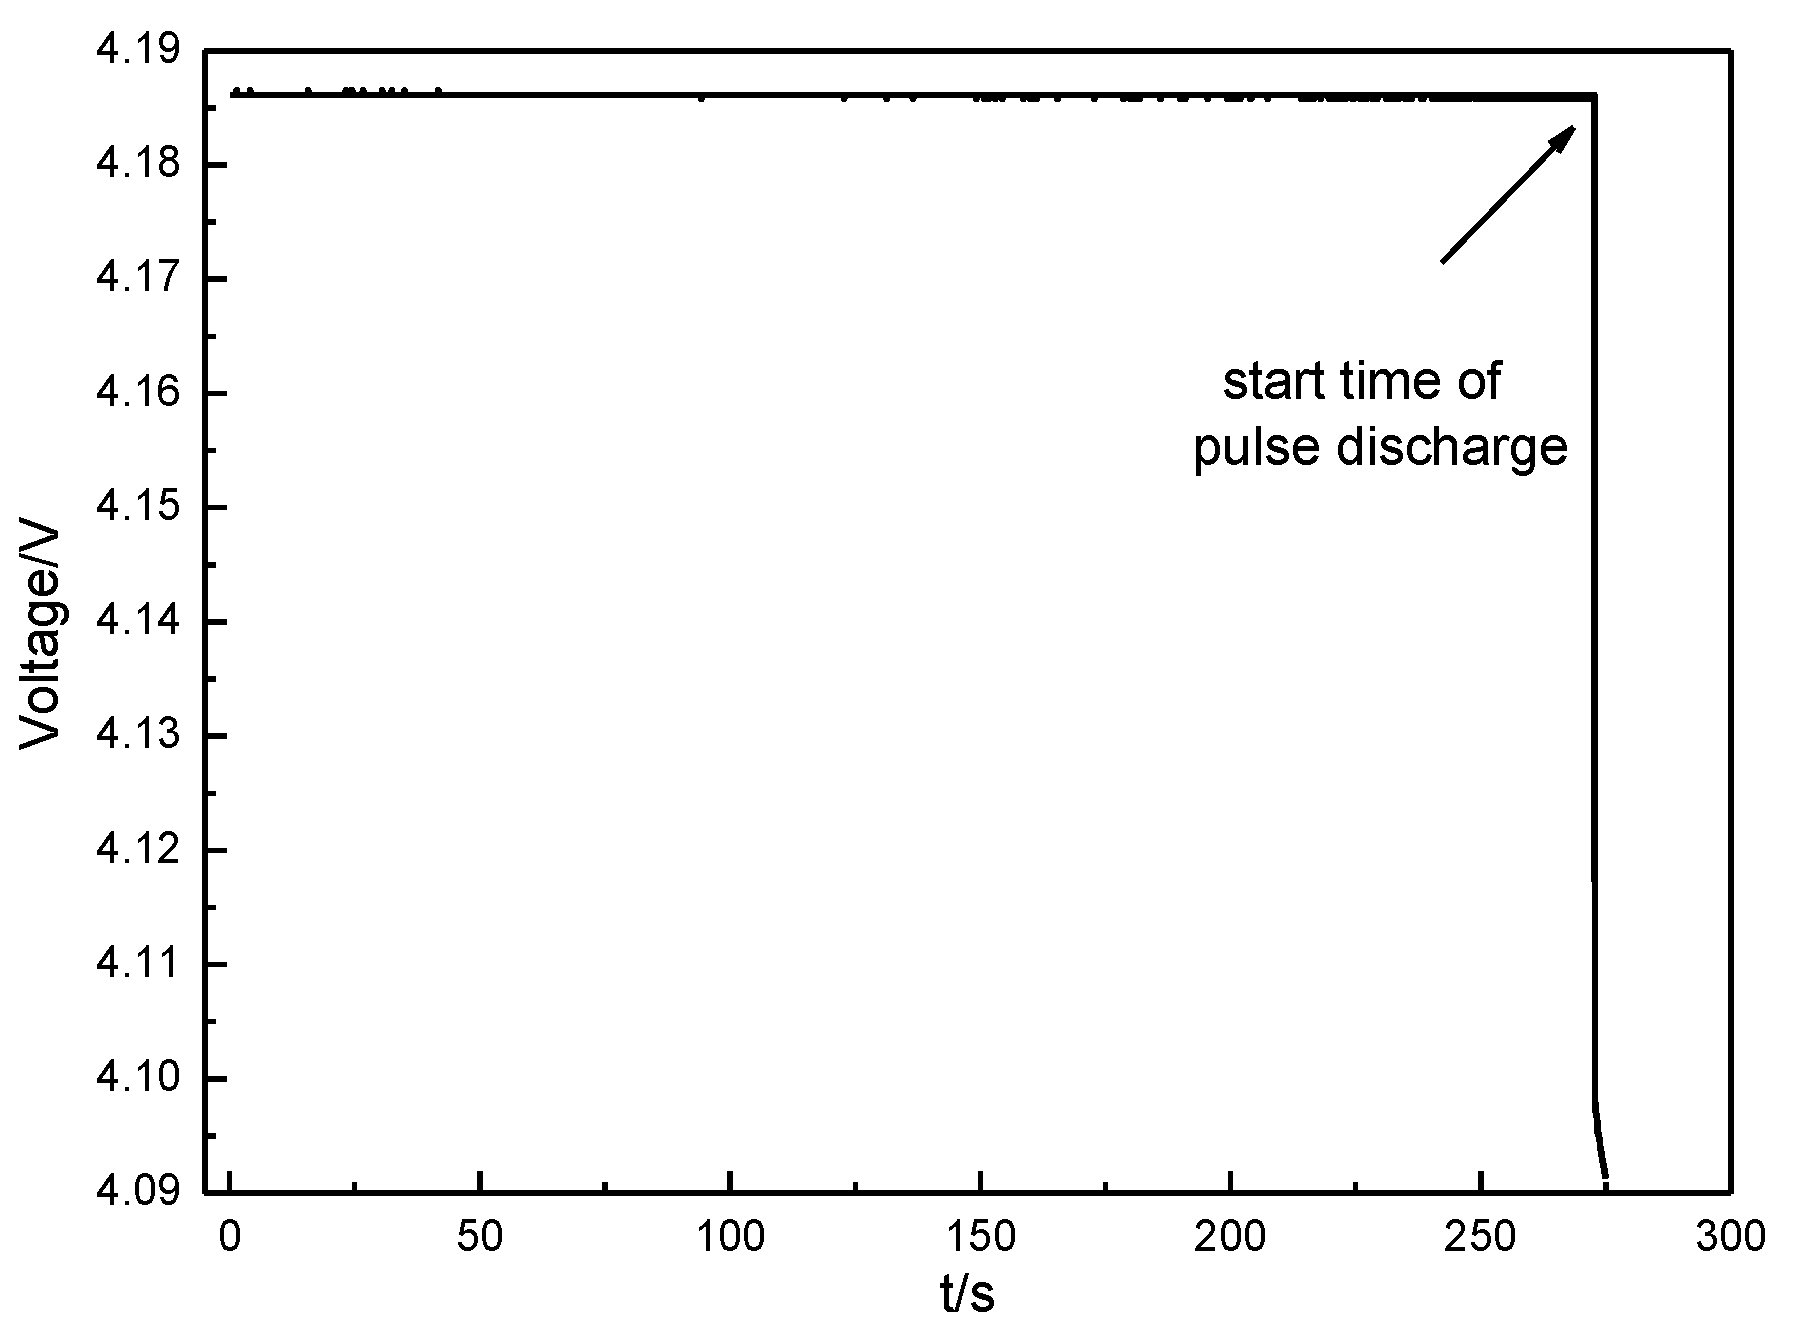
  • A preliminary investigation shows that the calculation of resistance outside the RC branch, which depends on the capture of abrupt voltage changes at the start and end time points of the discharge pulse, is closely related to the effect of sample interval on parameter identification findings.
  • High-order models can offer more reference data about the LIB’s internal performance, but when choosing an equivalent circuit model type for real-world applications, it is important to take into account a variety of factors, such as the facility’s conditions and the precision and robustness of parameter identification.
This study, which focuses on the impact of sample interval on parameter identification outcomes for RC equivalent circuit models, is only based on HPPC test data at room temperature, and its underlying mechanism has not been thoroughly examined. Therefore, additional research will be required in the following areas:
  • Include the impact of ambient temperature, SOH, and LIB discharge time in the expanded range of data samples [33];
  • Examine the impact rule in the context of various data fitting algorithms, particularly those new, improved algorithms that have been put forth recently [34];
  • Characterize the impedance characteristics of the LIB [35] to provide a more thorough explanation of the influence mechanism of the sample interval.

Author Contributions

Conceptualization, H.Z. and C.D.; methodology, H.Z.; software, C.D. and Y.Z.; validation, C.D. and Y.Z.; formal analysis, H.Z.; investigation, H.Z.; resources, H.Z. and Q.Z.; data curation, H.G. and S.S.; writing—original draft preparation, H.Z. and C.D.; writing—review and editing, H.Z.; visualization, C.D.; supervision, H.G. and L.J.; project administration, H.Z. and Q.Z.; funding acquisition, L.J. All authors have read and agreed to the published version of the manuscript.

Funding

This research was funded by the National Key Research and Development Program of China; grant number 2018YFE0203400g.

Data Availability Statement

Not applicable.

Conflicts of Interest

The authors declare no conflict of interest.

References

  1. Arsalis, A.; Papanastasiou, P.; Georghiou, G.E. A comparative review of lithium-ion battery and regenerative hydrogen fuel cell technologies for integration with photovoltaic applications. Renew. Energy 2022, 191, 943–960. [Google Scholar] [CrossRef]
  2. Ghaeminezhad, N.; Monfared, M. Charging control strategies for lithium-ion battery packs: Review and recent developments. IET Power Electron. 2021, 15, 349–367. [Google Scholar] [CrossRef]
  3. Chang, C.; Wu, Y.T.; Jiang, J.C. Prognostics of the state of health for lithium-ion battery packs in energy storage applications. Energy 2022, 239, 122189. [Google Scholar] [CrossRef]
  4. Hou, J.; Li, T.; Zhou, F.; Zhao, D.; Zhong, Y.; Yao, L.; Zeng, L. A Review of Critical State Joint Estimation Methods of Lithium-Ion Batteries in Electric Vehicles. World Electr. Veh. J. 2022, 13, 159. [Google Scholar] [CrossRef]
  5. Newman, J.; Tiedemann, W. Porous-electrode theory with battery applications. Aiche J. 1975, 21, 25–41. [Google Scholar] [CrossRef] [Green Version]
  6. Srinivasan, V.; Newman, J. Discharge model for the lithium iron-phosphate electrode. J. Electrochem. Soc. 2004, 151, 1517–1529. [Google Scholar] [CrossRef] [Green Version]
  7. Kleiner, J. Real-time core temperature prediction of prismatic automotive lithium-ion battery cells based on artificial neural networks. J. Energy Storage 2021, 39, 102588. [Google Scholar] [CrossRef]
  8. Li, Y.D.; Wang, W.W.; Lin, C. Safety modeling and protection for lithium-ion batteries based on artificial neural networks method under mechanical abuse. Sci. China 2021, 64, 2373–2388. [Google Scholar] [CrossRef]
  9. Bampoulas, A.; Pallonetto, F.; Mangina, E. An ensemble learning-based framework for assessing the energy flexibility of esidential buildings with multicomponent energy systems. Appl. Energy 2022, 35, 118947. [Google Scholar] [CrossRef]
  10. Li, Q.; Miao, S.; Liu, S.A. Joint State Estimation Framework for Lithium-ion Batteries based on Hybrid Method. J. Phys. 2022, 2276, 012023. [Google Scholar] [CrossRef]
  11. Surya, S.; Williamson, S. Novel Technique for Estimation of Cell Parameters Using MATLAB/Simulink. Electronics 2021, 11, 117. [Google Scholar] [CrossRef]
  12. Lai, X.; Jin, C.; Yi, W. Mechanism, modeling, detection, and prevention of the internal short circuit in lithium-ion batteries: Recent advances and perspectives. Energy Storage Mater. 2021, 35, 470–499. [Google Scholar] [CrossRef]
  13. Zhao, T.; Zheng, Y.; Liu, J.; Zhou, X. A study on half-cell equivalent circuit model of lithium-ion battery based on reference electrode. nt. J. Energy Res. 2021, 45, 4155–4169. [Google Scholar] [CrossRef]
  14. Elvira, D.G.; Machado, R.; Plett, G.L. Simplified Li Ion Cell Model for BMS Coupling an Equivalent Circuit Dynamic Model with a Zero Dimensional Physics Based SEI Model. J. Electrochem. Soc. 2021, 168, 110526. [Google Scholar] [CrossRef]
  15. Zang, W.; Wang, F.; Li, Z. Battery State Estimation based on Dual Extended Kalman Filtering with Fixed Step. J. Phys. 2022, 2200, 012023. [Google Scholar] [CrossRef]
  16. Rezaei, O.; Habibifar, R.; Wang, Z. A Robust Kalman Filter-Based Approach for SoC Estimation of Lithium-Ion Batteries in Smart Homes. Energies 2022, 15, 3768. [Google Scholar] [CrossRef]
  17. Gandoman, F.H.; Joris, J.; Shovon, G. Concept of reliability and safety assessment of lithium-ion batteries in electric vehicles: Basics, progress, and challenges. Appl. Energy 2019, 251, 113343. [Google Scholar] [CrossRef]
  18. Rahmoun, A.; Biechl, H. Modelling of Li-ion batteries using equivalent circuit diagrams. Przegl. Elektrotech. 2012, 88, 152–156. [Google Scholar]
  19. Yu, Z.; Xiao, L.; Li, H. Model Parameter Identification for Lithium Batteries Using the Coevolutionary Particle Swarm Optimization Method. IRE Trans. Ind. Electron. 2017, 64, 5690–5700. [Google Scholar] [CrossRef]
  20. Mehmood, A.; Chaudhary, N.I.; Zameer, A. Novel computing paradigms for parameter estimation in Hammerstein controlled auto regressive auto regressive moving average systems. Appl. Soft Comput. 2019, 80, 263–284. [Google Scholar] [CrossRef]
  21. Idaho National Engineering&Environmental Laboratory. FreedomCAR Battery Test Manual for Power Assist Hybrid Electric Vehicles; Idaho Operations Office: St Idaho Falls, ID, USA, 2003.
  22. Cheung, G.W.; Rensvold, R.B. Evaluating goodness-of-fit indexes for testing MI. Struct. Equ. Model. 2002, 9, 235–255. [Google Scholar] [CrossRef]
  23. Li, D.; Wang, L.; Duan, C. Temperature prediction of lithium-ion batteries based on electrochemical impedance spectrum: A review. Int. J. Energy Res. 2022, 46, 10372–10388. [Google Scholar] [CrossRef]
  24. Gao, Y.; Liu, C.; Chen, S. Development and parameterization of a control-oriented electrochemical model of lithium-ion batteries for battery-management-systems applications. Appl. Energy 2022, 309, 118521. [Google Scholar] [CrossRef]
  25. Oehler, F.F.; Nürnberger, K.; Sturm, J. Embedded real-time state observer implementation for lithium-ion cells using an electrochemical model and extended Kalman filter. J. Power Sources 2022, 525, 231018. [Google Scholar] [CrossRef]
  26. Wang, S.; Takyi, A.P.; Fan, Y. A novel feedback correction-adaptive Kalman filtering method for the whole-life-cycle state of charge and closed-circuit voltage prediction of lithium-ion batteries based on the second-order electrical equivalent circuit model. Int. J. Electr. Power Energy Syst. 2022, 139, 108020. [Google Scholar] [CrossRef]
  27. Wang, J.; Jia, Y.; Yang, N. Precise equivalent circuit model for Li-ion battery by experimental improvement and parameter optimization. J. Energy Storage 2022, 52, 104980. [Google Scholar] [CrossRef]
  28. Ates, M.; Chebil, A. Supercapacitor and battery performances of multi-component nanocomposites: Real circuit and equivalent circuit model analysis. J. Energy Storage 2022, 53, 105093. [Google Scholar] [CrossRef]
  29. Jiaqiang, E.; Zhang, B.; Zeng, Y. Effects analysis on active equalization control of lithium-ion batteries based on intelligent estimation of the state-of-charge. Energy 2022, 238, 121822. [Google Scholar]
  30. Kesen, F.; Wan, Y.M.; Jiang, B.B. State-of-charge dependent equivalent circuit model identification for batteries using sparse Gaussian process regression. J. Process. Control 2022, 112, 1–11. [Google Scholar]
  31. Braun, L.; Le, M.; Motz, J. Novel Approach to Ensure Safe Power Supply for Safety-Relevant Consumers. Batteries 2022, 8, 47. [Google Scholar] [CrossRef]
  32. Barletta, G.; DiPrima, P.; Papurello, D. Thévenin’s Battery Model Parameter Estimation Based on Simulink. Energies 2022, 15, 6207. [Google Scholar] [CrossRef]
  33. Akkinepally, B.; Reddy, I.; Manjunath, V.; Reddy, M.; Mishra, Y.; Ko, T.; Zaghib, K.; Shim, J. Temperature effect and kinetics, LiZr2(PO4)3 and Li1.2Al0.2Zr1.8(PO4)3 and electrochemical properties for rechargeable ion batteries. Int. J. Energy Res. 2022, 46, 14116–14132. [Google Scholar] [CrossRef]
  34. Ren, B.; Xie, C.; Sun, X.; Zhang, Q.; Yan, D. Parameter identification of a lithium-ion battery based on the improved recursive least square algorithm. IET Power Electron. 2020, 13, 2531–2537. [Google Scholar] [CrossRef]
  35. Jiang, B.; Zhu, J.; Wang, X.; Wei, X.; Shang, W.; Dai, H. A comparative study of different features extracted from electrochemical impedance spectroscopy in state of health estimation for lithium-ion batteries. Appl. Energy 2022, 322, 119502. [Google Scholar] [CrossRef]
Figure 1. Schematic presentation of the test bench.
Batteries 09 00001 g001
Figure 2. Experimental flow chart.
Batteries 09 00001 g002
Figure 3. Circuit constitutions: (a) 1-RC circuit model; (b) 2-RC circuit model.
Batteries 09 00001 g003
Figure 4. HPPC test curves: (a) voltage variation curve; (b) current variation curve.
Batteries 09 00001 g004
Figure 5. Sample points for different time intervals.
Batteries 09 00001 g005
Figure 6. RMSE between the tested terminal voltage and fitted terminal voltage: (a) 1-RC circuit model; (b) 2-RC circuit model.
Batteries 09 00001 g006
Figure 7. Voltage curves of the discharge and relaxation periods of 1-RC circuit model at SOC = 0.4: (a) Δt = 0.1 s; (b) Δt = 0.2 s; (c) Δt = 0.5 s; (d) Δt = 1.0 s.
Batteries 09 00001 g007
Figure 8. Voltage curves of the discharge and relaxation periods of 2-RC circuit model at SOC = 0.4: (a) Δt = 0.1 s; (b) Δt = 0.2 s; (c) Δt = 0.5 s; (d) Δt = 1.0 s.
Batteries 09 00001 g008aBatteries 09 00001 g008b
Figure 9. Voltage over time of the rest period before the first pulse discharge.
Batteries 09 00001 g009
Figure 10. Change curve of Voc with SOC.
Batteries 09 00001 g010
Figure 11. Change curves of parameters with SOC of 1-RC circuit model: (a) RI0; (b) RI; (c) CI; (d) τI.
Batteries 09 00001 g011
Figure 12. Change curves of parameters with SOC of 2-RC circuit model: (a) RII0; (b) RII1; (c) C II1; (d) RII2; (e) C II2; (f) τ II1; (g) τ II2.
Batteries 09 00001 g012aBatteries 09 00001 g012b
Figure 13. Change curves of non-dimensional parameters with SOC of 1-RC circuit model: (a) R′I0; (b) R′I; (c) C′I; (d) τ′I.
Batteries 09 00001 g013
Figure 14. Change curves of non-dimensional parameters with SOC of 2-RC circuit model: (a) R’II0; (b) R’II1; (c) C’II1; (d) R’II2; (e) C’II2; (f) τ’II1; (g) τ’II2.
Batteries 09 00001 g014aBatteries 09 00001 g014b
Table 1. Primary design and performance parameters of the test object.
ItemsParameters
Three-dimensional size240 × 170 × 22 mm
Nominal capacity70 Ah
Nominal voltage3.64 V
Charge cut-off voltage4.2 V
Discharge cut-off voltage3.2 V
Nominal charge current1 C
Nominal discharge current1 C
Operation temperature range for charge0~40 °C
Operation temperature range for discharge−10~50 °C
Table 2. Goodness of fit.
Time Interval1-RC Circuit Model2-RC Circuit Model
SOC 0.1 s0.2 s0.5 s1.0 s0.1 s0.2 s0.5 s1.0 s
0.10.99750.99760.99920.99950.99980.99980.99960.9992
0.20.99930.99930.99980.99970.99990.99990.99990.9995
0.30.99950.99950.99980.99970.99990.99990.99990.9995
0.40.99970.99970.99990.99970.99990.99990.96570.9516
0.50.99960.99960.99990.99970.99990.99990.99980.9996
0.60.99890.99890.99970.99950.99980.99980.99950.9607
0.70.99910.99910.99970.99950.99990.99990.99940.9705
0.80.99930.99930.99970.99960.99990.99990.99940.9992
0.90.99900.99900.99980.99950.99990.99990.99920.9986
10.99950.99950.99980.99960.99990.99990.99980.9993
Disclaimer/Publisher’s Note: The statements, opinions and data contained in all publications are solely those of the individual author(s) and contributor(s) and not of MDPI and/or the editor(s). MDPI and/or the editor(s) disclaim responsibility for any injury to people or property resulting from any ideas, methods, instructions or products referred to in the content.

