Article

Scale-Up of Lithium Iron Phosphate Cathodes with High Active Materials Contents for Lithium Ion Cells

Warwick Manufacturing Group, University of Warwick, Coventry CV4 7AL, UK
*
Author to whom correspondence should be addressed.
Batteries 2023, 9(10), 518; https://doi.org/10.3390/batteries9100518
Submission received: 20 September 2023 / Revised: 17 October 2023 / Accepted: 19 October 2023 / Published: 21 October 2023
(This article belongs to the Section Battery Processing, Manufacturing and Recycling)

Abstract

:
The size of a lithium iron phosphate (LFP) cathode mix was increased by a factor of thirty, and the capacity of the cells produced with it by a factor of three-hundred. As well as rate and cycling tests, the coatings were also characterised for adhesion and resistivity. The adhesion and total through-plane resistance were both dependent on the drying conditions during coating. The discharge capacities at high rates and the pulse resistances showed much less influence from the drying temperature. The mix formulation contained 97 wt% LFP, and was based on an earlier design of experiments (DoE) study, using relatively high active material contents. Overall, the mix exceeded the performance predicted by the modelling study.

1. Introduction

The manufacture of lithium ion cells involves a sequence of processing steps, all of which have to be performed well to achieve a consistent, high-quality product [1,2,3]. When developing a new cell chemistry, it is customary to start small, with low-volume mixes, and testing in coin cells. Subsequently, the mixing and coating process is scaled up, enabling testing in fully engineered cells. Inevitably, there are concerns that scaling up will lead to changes in the properties of the electrodes. Using different equipment for mixing, coating, calendering and cell making can all lead to unexpected variations. This paper discusses some of the issues in this area during the scale-up of a lithium iron phosphate (LFP, LiFePO4) cathode, with a relatively low binder content. Previously, seventeen mixes were prepared and tested at a small scale, leading to an optimum formulation to take forward [4]. Here, this formulation is used at a larger scale, with the mix size increased by a factor of 30, and the cell capacities increased by a factor of 300. Simultaneously, key performance indicators are compared against model values derived from the earlier study.
The aim of the mixing process is to produce a homogeneous mix with sufficient stability to allow it to be coated. The mix contains the active material, a polymeric binder, and one or more conductive carbons. PVDF is still the most common cathode binder, and NMP (N-methyl pyrrolidone) is almost the only option as a coating solvent. There are many possible variations to the mixing sequence. For example, PVDF can be pre-dissolved in NMP, or used as a dry powder. Pre-mixing carbon black (CB) with pre-dissolved PVDF followed by mixing with NMC-111 (LiNi0.33Mn0.33Co0.33O2), produced a different carbon distribution in the electrode, compared with mixing the active material and carbon black first [5]. Small-scale planetary mixers, e.g., from Thinky®, are quick and convenient, but the technology cannot be scaled up. Other mixer types are produced over a much wider operating scale. For example, Eirich mixers, with a rotating tool and a counter rotating mixing pan, and available on 1 L to 12,000 L scales, with transferrable mixing parameters. During the work described in this report, the same LFP mix formulation was mixed using a Thinky® mixer, and 1 L and 10 L Eirich mixers.
Rheology is the main technique used to characterise the properties of mixes. The optimum mix viscosity depends on the coating equipment, with slot die coating heads requiring a higher viscosity than comma bar or doctor blade coaters [6]. Basic viscosity measurements usually plot the viscosity as a function of shear rate and use a single value for comparative purposes, e.g., a shear rate of 10 s−1. More advanced techniques are also available on many rheometers using small perturbation oscillatory techniques analogous to a.c. impedance. The shear stress is resolved into real and imaginary components: the storage modulus (G’), representing the storage of elastic energy; and the loss modulus (G”), representing the viscous dissipation of that energy [7]. As with impedance spectroscopy, the physical interpretation of the data can be open to question, and some of the issues have recently been reviewed [8]. For example, a multi-stage mixing process for a LiCoO2:PVDF:denka black cathode gave a lower viscosity mix than a single-stage process, and, ultimately, better rate performance [9]. This finding led to the conclusion that a lower-viscosity fluid was preferrable to a higher viscosity gel. However, for a NMC-111:PVDF:CB cathode, a higher-intensity mixing process gave a lower-viscosity mix, and ultimately worse rate performance [1]. The intense mixing process produced a dense carbon black network, with poor long-range contacts compared with the porous carbon black network produced by the reference mixing process. The main reduction in viscosity due to the intense mixing process actually occurred at low shear rates, and the viscosities at 10 s−1 were quite similar.
The coating and drying process steps have a significant impact on the morphology of the electrodes, and hence their performance [10]. Small-scale coating typically uses a draw down coater, fitted with a doctor blade, followed by drying at a fixed temperature. Because of the toxicity of NMP, the drying process is performed either on a hot plate inside a fume cupboard, or inside an oven with a ducted exhaust. Full-sized coating normally uses a slot die coating head [6]. Intermediate-scale coating may use a reverse comma bar arrangement, similar to a doctor blade. The coating speed is usually faster on a reel-to-reel coater than a draw-down coater, increasing the shear rate experienced by the mix during coating [8]. More importantly, the drying configuration in a full-sized coater is markedly different from small-scale coating. The coating machine will have multiple drying zones, which can be set to different temperatures. The air flow across the coating, and hence the solvent evaporation rate, will be significantly higher than in a fume cupboard or fan oven. Coatings containing LFP (D50 = 0.5 um):PVDF:CB = 80:10:10 wt% were dried in air, in a conventional oven at 60, 80, 100 and 120 °C [11]. The best rate and cycling performance were obtained at 80–100 °C, and this was attributed to an optimum distribution of the PVDF binder.
In theory, calendering should be scale-independent if the same calender roll temperatures are used and the same final porosity is produced. In practice, there are differences, depending on the operating principle of the calender, and design features like the bearing arrangement, the hydraulic unit, and the use of a roll bending system [12]. Less powerful calenders may require multiple passes to achieve the target porosity. There may also be differences between single-sided and double-sided electrodes during calendering. In tests on graphite:PVDF anodes, calendering with a 400 mm diameter roll produced a pull test adhesion of 346 kPa, compared with 290 kPa for 200 mm rollers [13]. This was explained by increased shear stresses with the smaller roller because the gradient between the just-calendered and about-to-be calendered sections was steeper. For LFP:PVDF:C65 = 90:5:5 wt% electrodes, there were visible indentations in the aluminium foil when the composite coating was removed after calendering [14].
There are various technologies that can be used to characterise coatings, both before and after calendering. Coating adhesion can be measured in either a 90° peel [15] or a 180° pull test [13]. Traditionally, the electronic conduction of the coating is measured using a four-point probe, tested on a special coating on a non-conductive substrate. Recently, a device with a 46-point probe has been introduced, which allows measurements on regular coatings (single- and double-sided) [16]. X-ray tomography can be used to characterise electrode structures, though it can be challenging to identify the carbon–binder domain [17,18]. Mercury porosimetry can be used to obtain a more macroscopic description of coatings [19,20].
The results from coin cells are interesting, but ultimately, test data from fully engineered cells are required. Coin cells have a large thermal mass, and use a large excess of electrolyte. Therefore, degradation reactions that consume electrolyte, or are accelerated at higher temperatures, may be missed. Cells with larger electrode areas can be expected to be more consistent because local fluctuations in composition, morphology and coat weight are averaged out. Safety and abuse tests cannot be performed on coin cells. In a previous study, the same NMC-622 and graphite electrodes were used to make coin cells, single-layer pouch (SLP) cells, and multi-layer stacked pouch (MLP) cells [21]. Double-sided coatings were converted back to single-sided for the smaller cell sizes. The cycling performance was best in the multi-layer pouch cells, and the rate performance of the full cells matched the cathode half cells. The results described in this report use the same three cell formats, but with three different coatings, though all with the same formulation.
LFP is the preferred cathode material in many EV applications, particularly for buses and lorries. The key advantages over NMC are cost and safety, provided that the low electronic conductivity can be circumvented [4]. There continue to be advances in the synthesis of LFP powders, including carbon coating techniques and doping [22,23]. In terms of cathode formulation, the compositions listed in almost 300 published accounts have been analysed [24]. PVDF was by far the most common binder, and the highest active material content was 94 wt%. When the solvent for PVDF was reported, it was always NMP, due to the higher mix viscosity with NMP than other solvents like DMF (dimethyl formamide) [24]. As well as increasing the capacity of the active material (mA h g−1), the energy density of cells can be increased by reducing the binder and conductive carbon contents to their minimum practical values. The conductive carbon content will depend on the required rate performance of the battery. Electrodes in wound cell formats may require greater adhesion than those in flat sheet cells. However, cutting and slitting swarf from insufficient adhesion are unwelcome in all cell types. Recently, the optimum formulation of cathodes has been investigated for three different cathode materials, including LFP [25]. Firstly, the PVDF binder content was adjusted based on the total surface area of the active material and conductive carbon. Then, the carbon additive content was varied to determine a minimum critical value in rate and cycling tests. Apart from the electrochemical tests, the coatings were also characterised in 90° peel tests and through-plane conductivity measurements.
The original design of experiments (DoE) investigation used 17 experimental mixes [4]. By the nature of the DoE approach, all of these were expected to be sub-optimal. However, the compositions of three of the best-performing experimental mixes are shown in Table 1. The DoE analysis used two models, one based on just the formulation of the mixture, and the other also including two process parameters, coat weight and porosity. Ideally, these two parameters would have been kept constant across all the mixes, but wide variations in mix viscosity and coating adhesion made this difficult in practice. The mix formulation was optimised for single output parameters, including capacity and gravimetric capacity. A multi-objective optimisation [26,27] was also performed using four outputs: gravimetric capacity at 5 C, coating adhesion, total through-plane resistance, and area-specific impedance [28]. The relative importance of each was weighted to give an overall desirability rating.
Close inspection of Table 1 reveals that the actual formulation used in the three experimental mixes 18, 19 and 20 is not the same as any of the optimisation formulations. The formulation used for the scale-up mixes was based on a multi-objective optimisation using the first fifteen of the seventeen DoE mixes; data from the final two mixes were not available at the point of formulation selection. The actual formulation used in the scale-up maximised the active material content, with acceptable adhesion (PVDF content), slightly less of the most expensive component (SWCNT), and lower amounts of the less effective carbon content (KS6L).

2. Materials and Methods

Three mixes were prepared with the same formulation, as listed in Table 1. Mix18 was prepared with a Thinky® mixer (Intertronics, Kidlington, UK) and coated with an Erichsen draw down coater, using the same procedure as the seventeen mixes in the original DoE [4]. The materials used were as described previously [4]: LFP (Aleees A19), PVDF (Solvay 5130), KS6L (Imerys), and SWCNT (Tuball). Mix19 was prepared using a 1 L Eirich mixer, and Mix20 with a 10 L Eirich mixer. The quantities of the LFP active material in the three mixes were 120 g, 380 g and 3.8 kg, respectively. The two mixing protocols are set out in Figure S1, in the Supplementary Information. Some of the data recorded during the two Eirich mixes are plotted in Figure S2. Mix19 and Mix20 were both coated using a Megtec coater, with three drying zones. Mix19 was only coated single-sided. Mix20 was coated single-sided and double-sided, with two different drying regimes for sections of the single-sided coating. Key details of the coating conditions are collected in Table 2, and the temperatures of the three drying regimes D1–D3 are defined in Table 3. After further drying, the coatings were calendered to their target porosity. For the draw down and single-sided coatings, an Innovative Machines Corporation sheet calender set to various inter-roller gaps was used. The coatings were calendered between stainless steel shims (500 μm total thickness) to reduce the risk of delamination. The double-sided coatings were calendered on an Innovative Machines Corporation reel-to-reel calender set to “zero gap”. Some properties of both calenders are compared in Table 4.
The coatings were tested in three different cell formats, with wide variations in rated capacity: half-cell and full-cell coin cells (0.004 A h), single-layer pouch cells (0.080 A h), and multi-layer stacked pouch cells (1.4 A h). The full cells used a graphite anode, with the formulation BTR V-H graphite:CMC:SBR:C45 = 95.25:1.5:2.25:1 wt%. It was also prepared using the 10 L Eirich, coated on the Megtec, and calendered on the reel-to-reel calender. The rated areal capacities of the anode and cathodes were 2.75 and 2.44 mA h cm−2, respectively, giving an N:P ratio of 1.125:1.
The coin cells were prepared with 14.8 mm diameter cathode disks, and 15.0 mm diameter disks of either graphite or lithium. The electrolyte was 1 mol dm−3 LiPF6 in EC:EMC = 3:7 vol + 1 wt% VC, and the separator was Celgard® H1609 (EC = ethylene carbonate, EMC = ethyl methyl carbonate, VC = vinylene carbonate). The cells were tested on a BioLogic BCS-805 cycler, with the cells inside an oven set to 25 °C. After a formation cycle at ±C/20, the cells underwent five conditioning cycles at ±C/5, followed by rate tests with discharges at C/5, C/2, C, 2 C, 5 C and 10 C. Area-specific impedances (ASI) were measured at different states of charge (ten-second pulses at nine SoC, two-second pulses at 50% SoC, and thirty-second pulses at 20% SoC). This was followed by a block of fifty cycles at +C/5, −C/2, with impedance measurements and a slow capacity check cycle (±C/10) before and after cycling. Some of the full cells immediately underwent a 400-cycle test, omitting the rate tests.
The single-layer cells contained one single-sided anode and one single-sided cathode, along with a plastic spacer to fill out the pouch. The multi-layer pouch cells contained ten double-sided anodes and nine double-sided cathodes. The multi-layer cells were easier to manufacture because the single-sided coatings had a tendency to curl. All the cells used the same separator and electrolyte as the coin cells. After filling, the SLP and MLP cells were allowed to soak, and then put onto a formation charge at ±C/20. The cells were then allocated to either a long-term cycling test at +C/5, −C/2, or a rate and ASI test similar to that performed on coin cell half cells. The single-layer pouch cells were tested on a 5 A Maccor, with a convenient ±150 mA range for this type of cell. The multi-layer pouch cell cycling tests were also performed on the 5 A Maccor. However, the rate tests used a single range 10A Maccor to cope with the current values on the 5 C and 10 C discharge tests. Two 10 A channels were connected in parallel for the 10 C discharge tests. All the tests were performed with the cells inside ovens set at 25 °C. The multi-layer pouch cells were degassed between the formation cycle and subsequent testing.
After mix preparation with the Erich mixers, measurements of mix viscosity against shear rate were made using an Anton Paar rheometer. Subsequently, a more complete set of measurements were made using a TA Instruments HR20 rheometer. These were mix viscosity vs. shear rate, oscillation strain measurements with increasing amplitude, oscillation frequency measurements at fixed strain, and relaxation tests.
The adhesion of the coatings was measured with a Zwick 0.5 kN device. The samples were mounted on plates using adhesive tape and then tested in a 180° pull configuration. Resistivity measurements were made on the coatings using a Hioki RM2610 device, fitted with a 46-pin probe. The single-sided coatings were measured as such. For the double-sided coating, measurements were made on both the (A) and (B) sides. Since the conductivity of the aluminium foil is significantly higher than the coating, it was assumed that there was no current flow into the lower region of the coating during the test. It was also assumed that the thickness of both coating sides was the same when calculating the thickness of each coating. The device is supplied with nine finite volume models, which calculate two parameters: the volumetric resistivity for the coating, and the interface resistance between the coating and the metal foil. The total through-plane resistance values were calculated from the interface resistance + (volumetric resistivity × coating thickness). During testing, the data were analysed using the lowest resolution (quickest) FVM. Subsequently the data were re-analysed using a higher resolution model, and those fitting values are presented here.
SEM measurements were made using a Hitachi TM3030 instrument, fitted with an Oxford Instruments EDS probe (30 mm2 area). Cross-sectioned samples were prepared using a Bright Instruments micro-tome.

3. Results

3.1. Electrochemical Testing

Four single-sided coatings were produced: one each from Mix18 and Mix19, and two with different drying conditions from Mix20. All four coatings were used to make three half-cell coin cells, which were then tested using the same protocol as used in the original DoE evaluation [4]. This involved a formation cycle at ±C/20, five conditioning cycles, discharge rate tests from C/5 to 10 C, ASI measurements, and fifty cycles, with impedance measurements before and after cycling.
The adhesion of the Mix19 coating was not considered good enough to make single-layer pouch cells. However, the two Mix20 single-sided coatings were used to make SLP cells with a graphite anode. Multi-layer stacked pouch cells were also made using double-sided anodes and cathodes. The SLP and MLP cells were pre-allocated to either rate or extended cycling tests. Both tests were preceded by a single formation cycle at ±C/20, and the MLP cells were degassed after that cycle.
The results from these cell tests are summarised in the Supplementary Information. Figures S3–S5 show the cell voltages during the formation cycle, which show very good consistency. Figure S6 plots the first cycle loss values against the discharge capacity during the formation cycle. Creation of the SEI layer on the graphite anode increased the FCL values from around 1.8% to around 8% and reduced the discharge capacities from 160 to 150 mA h g−1. For the full-cell coin cells, there was more variability, with some higher FCL values corresponding to lower capacities. This was attributed to mis-alignment of the two electrodes, given the relatively small extra diameter of the anodes (15.0 mm vs. 14.8 mm). Five conditioning cycles were used before the rate tests; Figure S7 plots the discharge capacities for the Mix20D2 and Mix20D3 coatings in three different cell configurations.
It can be easier to interpret rate data using a Ragone style plot of discharge capacity against discharge rate. Figure 1 includes results for all the SLP and MLP cells, and the average of three coin cells of each type. The rate capacity of the multi-layer pouch cells was higher than for the single-layer pouch cells, even though the electrode coatings were the same. This was probably due to an increased internal temperature in the MLP cells at high discharge rates, reducing the charge transfer resistance, and increasing the ionic and electronic conductivities. Figure S8 contains similar plots to Figure 1 for the Mix20D2 and Mix20D3 coatings, again in three different cell configurations. The half-cell coin cells had higher capacities than the full cells because of the first cycle loss associated with the graphite anode. However, the graphs confirm that the discharge rate performance in these cells is limited by the cathode. Figure S9 shows the cell voltages at different discharge rates, for all the SLP and MLP cells, all the full-cell coin cells and the best half-cell coin cell of each type.
Most rate plots of this type show a transition between two limiting mechanisms, typically around 2 C. Below this critical rate, the capacity is limited by resistance; the increasing I.R drop means that the minimum voltage limit is reached at slightly lower capacities. Above the critical rate, the capacity is limited by a transport process in the electrode. Most commonly, this is ionic conductivity in the electrode pores, or electronic conductivity in the solid phase, or both. In this region, the discharge capacity decreases very quickly at an increasing rate, and also with increased electrode thickness. Unusually, the data in Figure 1 show a third region, with an intermediate slope spanning the usual transition region.
Unfortunately, many rate tests are combined with cycling tests, which makes it difficult to interpret either part. One exception was a comparison of the rate performance of NMC-111 and LFP cathodes, and indeed, LFP cathodes with five different coating thicknesses [29]. Data values extracted from this paper are replotted as discharge capacity vs. discharge rate in Figure S10, in the Supplementary Information. The LFP cathode showed the same three mechanistic zones as the data presented here, unlike the NMC cathode. The rate capability decreased with increasing coating thickness, as expected, but the three zones were still evident, except for with the thinnest coating.
One possible explanation for the intermediate mechanistic zone is the change in LFP reaction mechanism from sequential to concurrent particle conversion. Combined modelling and experimental studies showed that the transition occurs at around 2 C [30]. The current density at each particle is roughly constant; when required, the current is increased by activating extra particles. If the electrode is forced to use less energetically favourable particles, then the increased resistance could reduce the capacity. Other studies have shown that the particles that convert first are at the top and bottom of the electrode, i.e., near the separator or the current collector [31]. Both these studies used LFP primary particles, with relatively small particles sizes. In studies with larger secondary particles (as used here), measurements have shown a mixture of FePO4 and LiFePO4 primary particles at the same time, in a filamentary morphology [32].
Area-specific impedance measurements use short duration pulses [28] and are not, therefore, subject to mass transport limitations. Figure S11 shows that the minimum ASI values were around 20 Ω cm2 for the half-cell coin cells and SLP cells and around 25 Ω cm2 for the MLP cells, with full-cell coin cells in between. The higher values for the MLP cells are probably due to the contribution of other components to the cell resistance, e.g., the external tabs. The tab thicknesses in the SLP and MLP cells were 0.1 mm and 0.2 mm, respectively, but the test current in the latter was 17 times higher.
The half-cell coin cells were used for a limited cycling test of fifty cycles on a +C/5, −C/2 protocol. A single ±C/10 cycle was used before and after cycling. As before, two parameters were used to characterise the cycling, the D50:D01 ratio on cycling, and the D51:D00 ratio on the slower cycles. Figure S12 shows the discharge capacities and efficiencies during cycling, and Figure S13 the two ratios. Most of the D50:D01 values were slightly above 100%. There were a few weaker cells, but no obvious differences between the Mix18, Mix19 and Mix20 cells. Figure S12 also contains cycling results for the full-cell coin cells, both for fifty cycles after the rate tests, and for the complete four-hundred cycle tests. The results for the latter are discussed below. Comparing the fifty cycle tests, the full cells had a lower capacity, but a higher efficiency. The lower capacity was again caused by the first cycle loss associated with the SEI layer on the anode. Logically, the half cells cannot be losing active lithium, given the massive excess in the lithium electrode. The lower efficiency, therefore, implies some kind of self-discharge or shuttle discharge mechanism, which is not present in the full cells.
Impedance measurements were performed at three states of charge, before and after cycling. Figure S14 is an illustrative plot for one half cell with a Mix20D2 cathode, and one full cell, with a Mix20D3 cathode. As with the earlier DoE half-cell tests, the big change between before and after cycling was in the 10% SoC spectra. At low states of charge, lithium ion impedance spectra are very sensitive to the actual state of charge. Thus, the difference may reflect changes in the actual rather than nominal state of charge. LFP cathodes operate via a phase change process [30], unlike the layered cathode materials, where lithium ions diffuse in and out of the particles. Therefore, the typical low-frequency tail described by the Warburg impedance is only observed in the spectra recorded at 10% SoC.
Cycling tests in half cells with a liquid electrolyte are usually limited by the lithium metal counter electrode. Therefore, it is much better to investigate cycle life in full cells with balanced electrode capacities. Figure 2 shows the discharge capacities and efficiencies for the SLP and MLP cells. The dotted lines are for weaker cells, with lower capacities or efficiencies. In general terms, the capacity retention and coulombic efficiency were very good. There have been several studies of degradation mechanisms in cells with LFP cathodes. In cycling tests on LFP/graphite cells at different rates and temperatures, the main degradation reactions actually occurred on the graphite anodes [33]. Commercial LFP/graphite cells achieved around 600 cycles to 80% capacity, when cycled at ±C and 45 °C [34]. The degradation reactions were a loss of lithium inventory and an increase in internal resistance. The main changes in the dQ/dV plots occurred between 90% and 80% retained capacity. In tests of LFP cathode materials, increased temperature was a greater contributor to LFP degradation than high states of charge [35]. However, the cells here showed minimal loss of capacity.
Figure 3 shows that the capacity retention values depended on the cell format, with a lesser effect from the drying temperature profile. The sequence was coin cell < SLP < MLP, which was also observed previously with NMC-622/graphite cells [21]. Loss of capacity during cycling is usually caused by a loss of active lithium, or increased cell resistance, or both. There can be multiple underlying processes that contribute to these cell level issues, and the processes may have different impacts, depending on the cell format. For example, some expected capacity retention sequences for different processes are:
Electrolyte consumption MLP < SLP < Coin cell
Thermally activated MLP < SLP < Coin cell
Mechanical pressure Coin cell < SLP~MLP
Both pouch cell types can expand and contract as the electrode materials themselves expand and contract. However, coin cells contain a relatively powerful spring, which restricts expansion. LFP particles may contract slightly when delithiated, but this is more than offset by the 10% expansion of fully lithiated graphite particles. Pressure-induced stresses in the active materials and separator seem the most likely explanation for the lower capacity retention in coin cells.

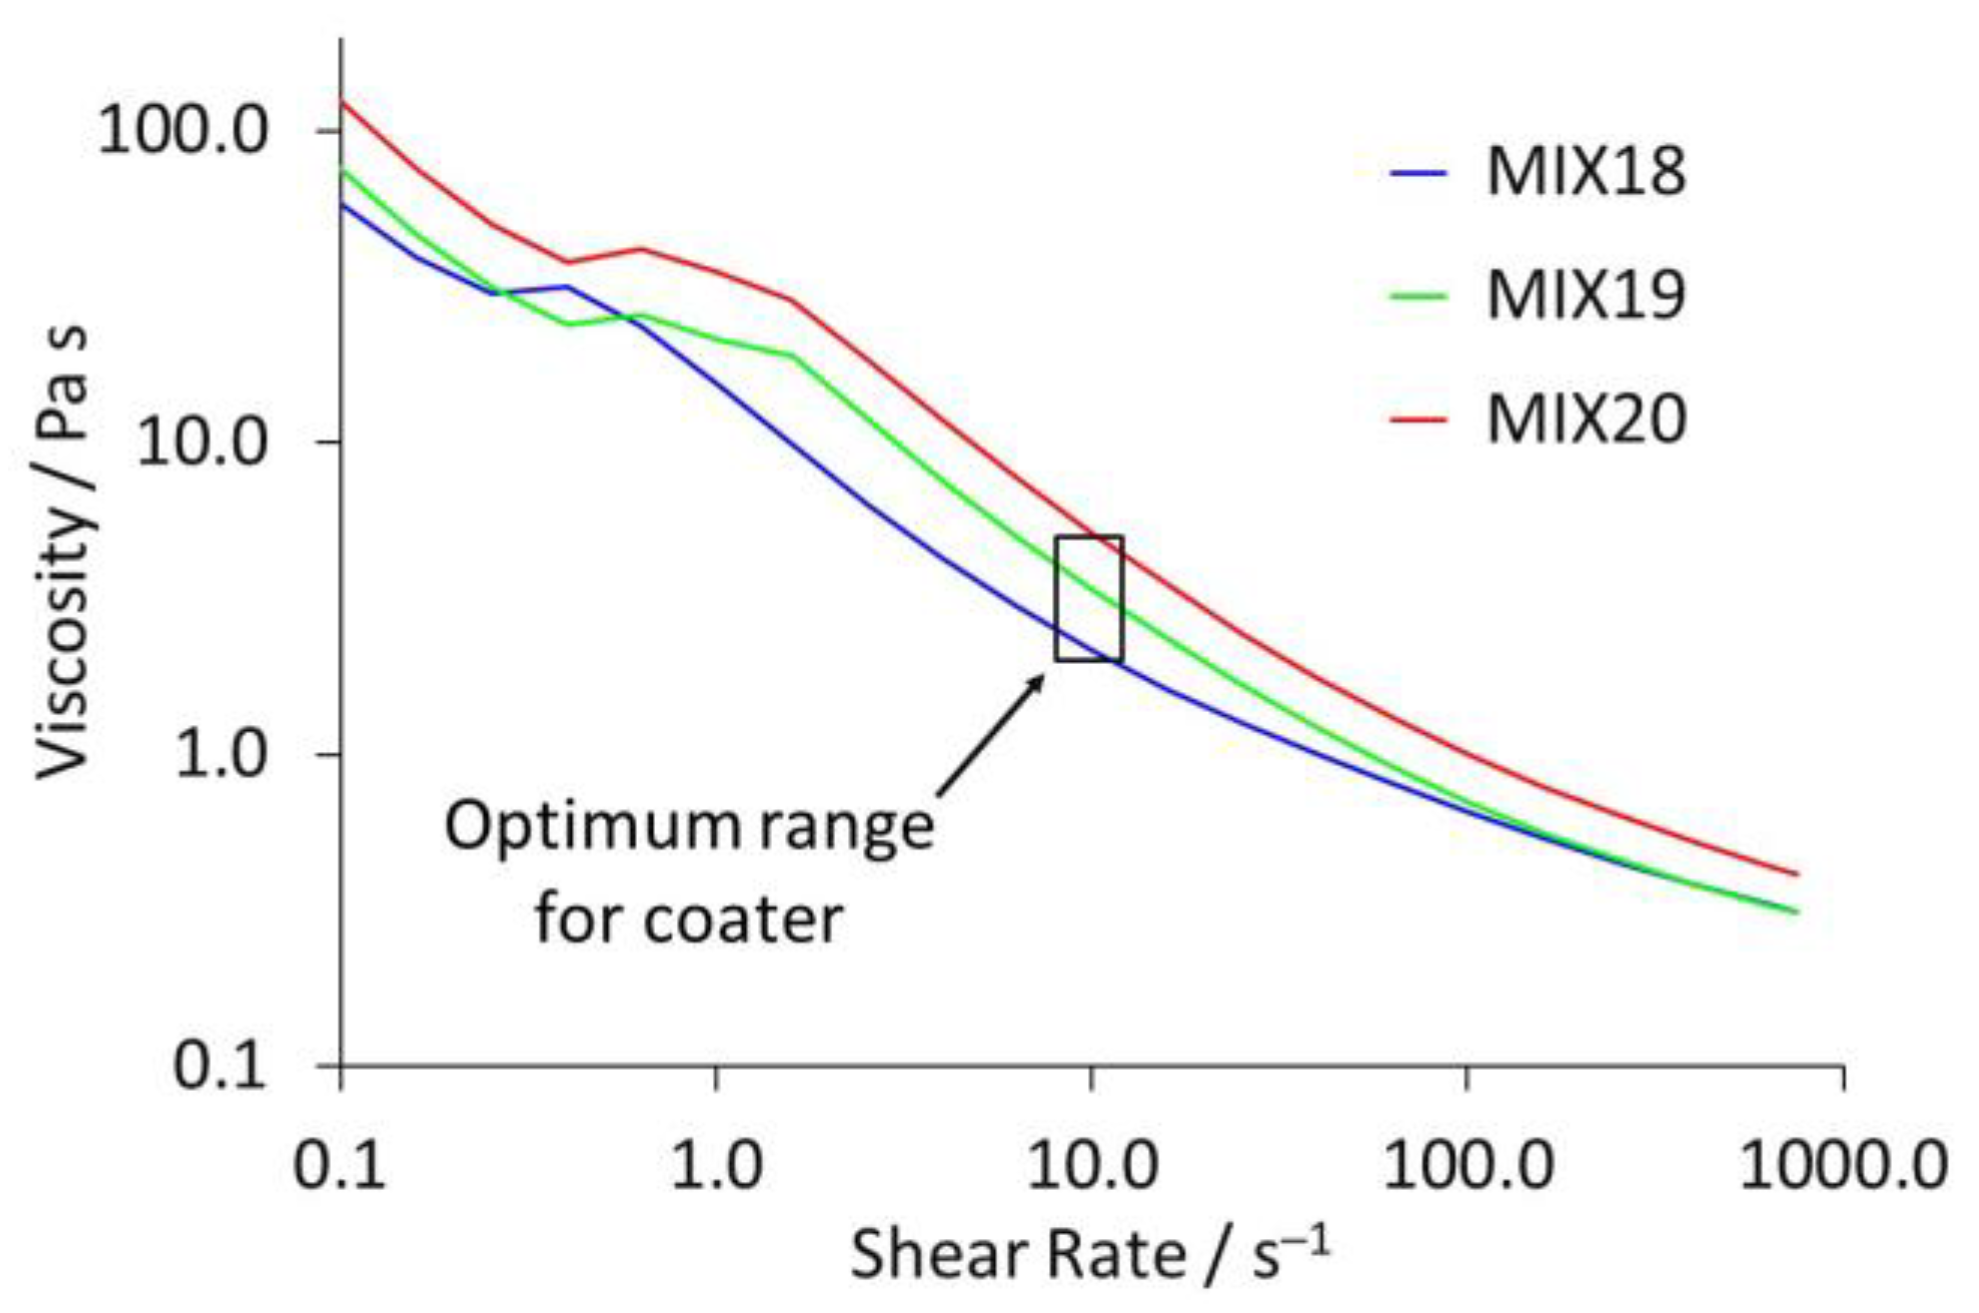
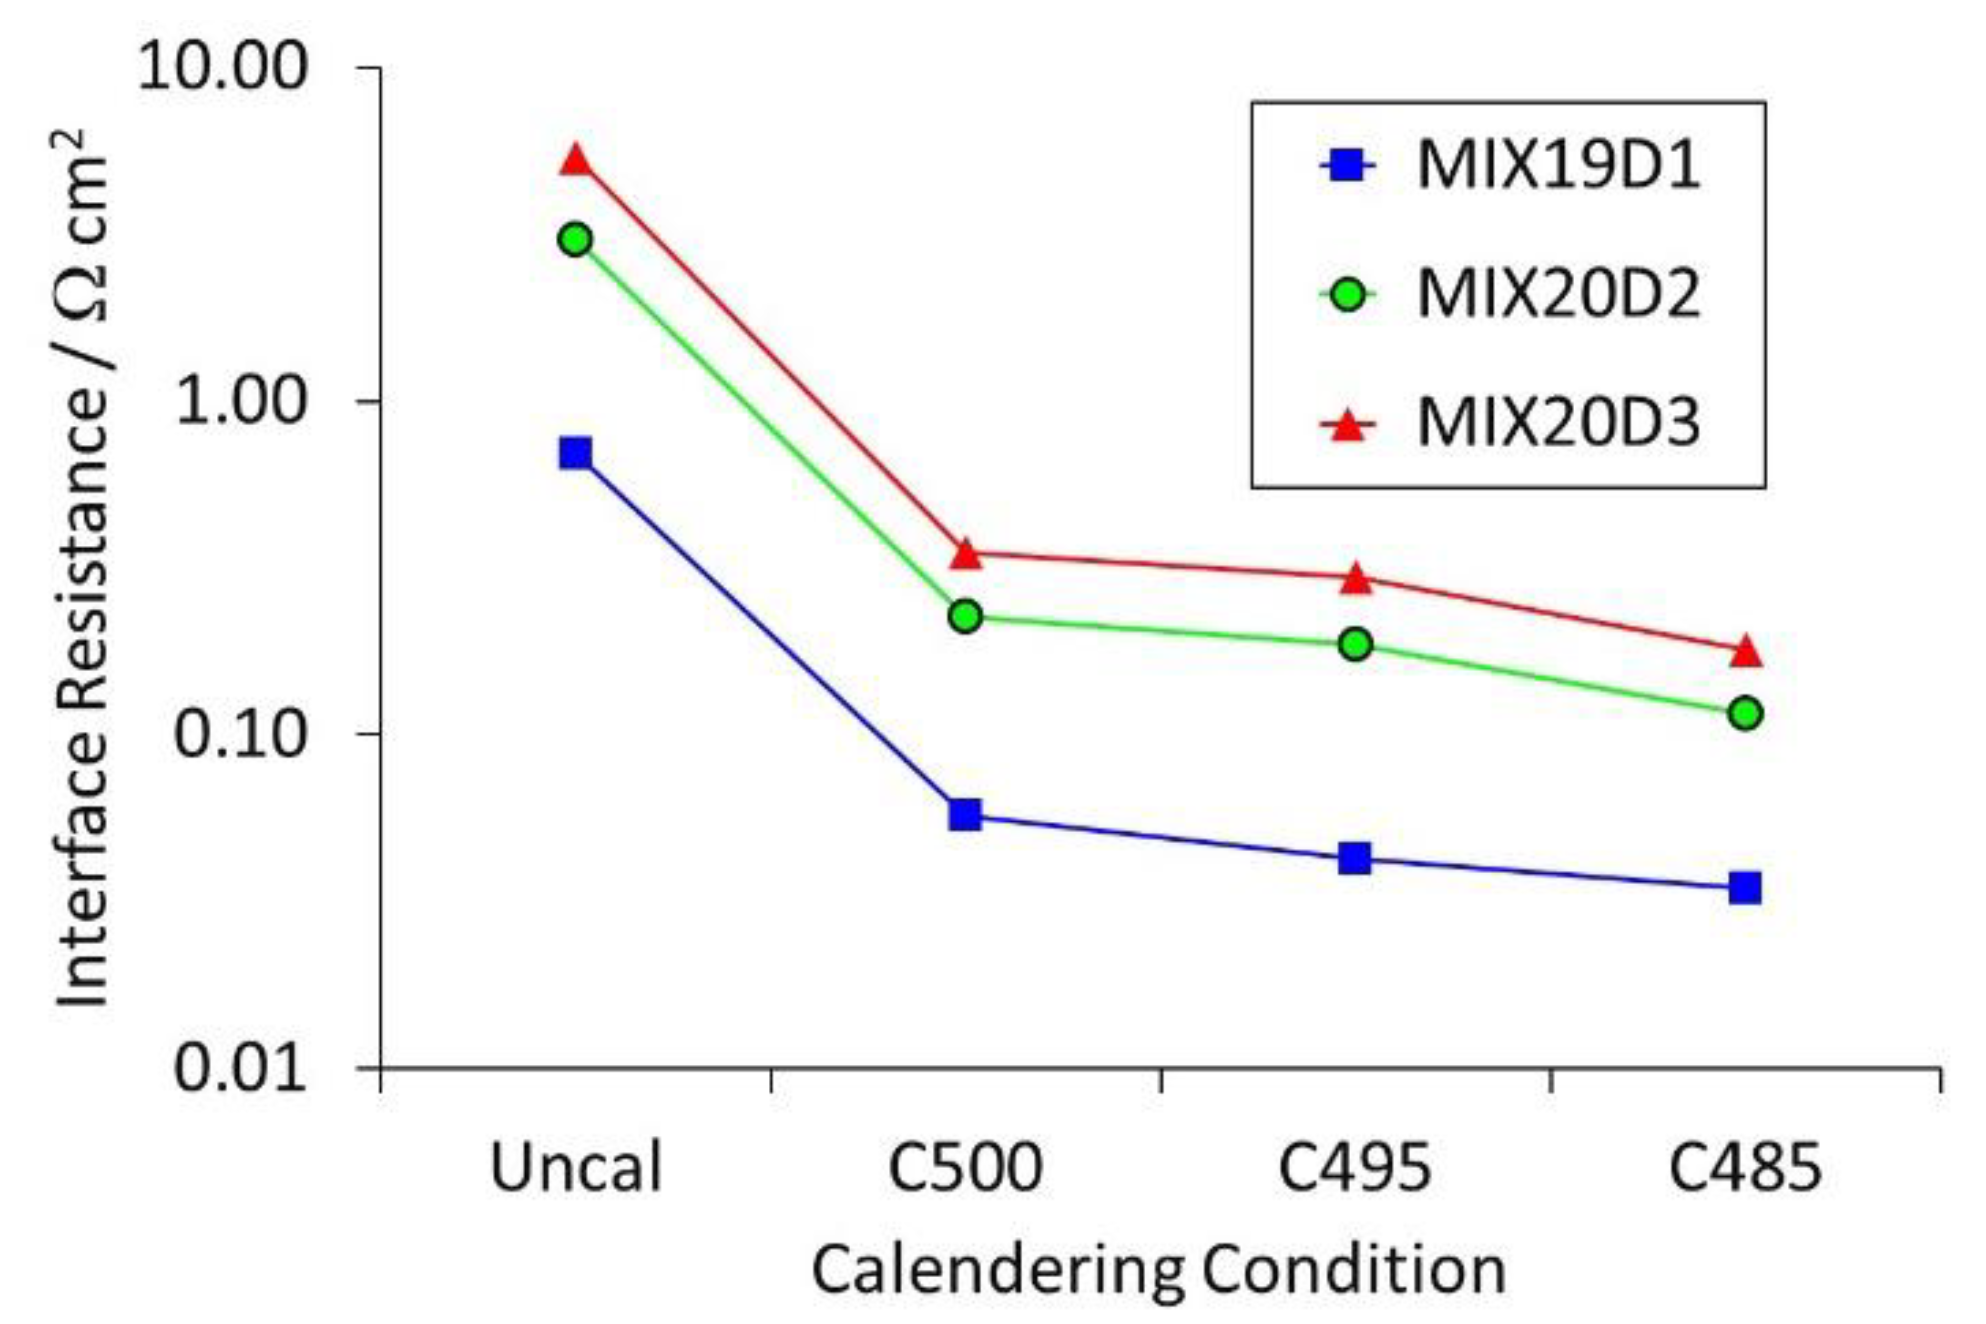
3.2. Mixing and Coating Characterisations

In the initial DoE investigation, the mix viscosities increased with increased PVDF and SWCNT content [4]. The three new mixes had the same formulations but were prepared using different protocols. Figure 4 plots the measured viscosity values vs. the shear rate. The optimum range for reverse comma bar coating is generally considered to be 2–5 Pa s at 10 s−1, and all three coatings were within that range. For consistency with the previous 17 Thinky® mixes, Mix18 was prepared with a solids content of 50.5 wt%. The Eirich mixing protocol used a kneading step at a relatively high solids content, followed by dilution with extra NMP to produce a coatable viscosity. The final solids contents for Mix19 and Mix20 were 50.5 and 52.0 wt%, respectively, leading to a higher viscosity for Mix20. The viscosity difference between Mix18 and Mix19 suggests a slightly different SWCNT and/or PVDF distribution in the mix, arising from the different mixing processes.
As well as basic viscosity measurements, more advanced oscillating measurements were performed on all twenty mixes: the three mixes discussed here, and the 17 mixes in the initial evaluation. The data were analysed to obtain two values: the storage modulus G’, and the loss modulus G”. Values for the amplitude and frequency oscillation tests are plotted against the viscosity at 10 s−1 in Figure S15 in the Supplementary Information. Allowing for a certain amount of noise, all the plots were essentially linear correlations. Figure S16 plots the G’:G” ratios (also known as tan delta) for the amplitude and oscillation tests. The mixes are grouped according to their SWCNT content. Higher ratios were obtained for low SWCNT content (blue), compared with medium (green) and high (red) mixes. The implication is that the more advanced tests do not provide any extra information over and above the basic test. As mentioned in the introduction, there is a continuing debate as to the best viscosity for optimum electrode morphology. In one set of tests, a lower mix viscosity gave better rate performance, but in another, lower mix viscosity gave worse rate performance. Thus, it is difficult to use viscosity data for anything other than assessing compatibility with the coating equipment and monitoring mix stability with time.
In the previous tests on 17 mixes [4], the coating adhesion increased with increased PVDF content, and in 15 out of 17 cases, was higher after calendering. Figure 5 shows the results obtained in 180° pull tests for the single-sided coatings. All had the same PVDF content, so clearly adhesion was also influenced by other factors, e.g., the drying temperature. This is discussed further below.
The electronic conductivity of the coatings was measured using a Hioki RM2610 instrument fitted with a 46-point probe. Measurements were made on both the uncalendered and calendered coatings: where multiple calendering conditions were used, then all of the samples were tested. An example of the results is presented in Figure 6. The Hioki data fitting model produces a value for the interface resistance between the coating and the metal current collector. This often constitutes a significant fraction of the total through-plane resistance. For all three coatings, there was a dramatic decrease in the interface resistance after calendering (note the log scale), followed by smaller decreases with further calendering. Aluminium is known to be coated with a native oxide layer, and the obvious interpretation is that calendering drives the LFP particles through that insulating layer. The interface resistances for Mix19 were lower than those for Mix20.
The complete set of volumetric resistivity and interface resistance values are collated in Tables S3–S7 in the Supplementary Information. Figure S17 plots the average calendered vs. uncalendered values for both parameters. There was a moderate decrease in volumetric resistivity after calendering, and as already noted, a massive decrease in interface resistance.
Mix19D1 was dried at higher temperatures than either of the Mix20 coatings. It seems likely that this increased the amount of PVDF movement away from the aluminium foil during the second part of the drying process [36]. This reduced the interface resistance but it also reduced the adhesion to well below the practical cell making limit (200 kPa minimum). SEM images of the coatings were recorded before and after calendering. Figure S18 shows some typical examples for both surface and cross-sectioned samples. Some NMC-622 secondary particles crack during calendering. In contrast, the LFP secondary particles tend to deform to fill the available volume. Unfortunately, it was not possible to measure the distribution of the PVDF binder using fluorine EDS maps because the fluorine K-α peak was swamped by the iron L-α peak.

3.3. Comparison of Mixes

To enable a simple comparison between the coatings, five parameters were selected for spider plots, as shown in Figure 7. The graph also includes the two best mixes from the original DoE. Each parameter is plotted using a range of 0–100%. The actual ranges for the parameters were as follows: adhesion (calendered, 0–600 kPa), total through-plane resistance (0–15 S cm−2), 5 C:0.2 C ratio (50–63%), ASI resistance (minimum, discharge, 0.03–0.055 S cm−2), and cycling ratio D50:D01 (90–101%). To aid the comparisons, both resistances were plotted as conductances so that 100% is the lowest resistance. The axes had to be rescaled from the previous versions with all seventeen mixes in order to differentiate between the coatings. The low resistance and low adhesion of Mix19D1 is clearly evident in the plot.
As part of the DoE analysis for the original 17 test mixes [4], multi-linear regression models were developed for various output parameters in terms of six input parameters, including the the four compositions, the coat weights, and the coating porosity. Details of the model scaling and regression coefficients are set out in Tables S8–S10 in the Supplementary Information. The model was able to fit four output values with a sufficient level of accuracy: the discharge capacity at 5 C, the adhesion strength after calendering, the total through-plane resistance after calendering, and the minimum area specific impedance. Table 5 collects the measured values for these parameters for mixes 18–20, along with the Mix 06 results and the values predicted by the multi-linear regression model. Mix 06 actually had a very similar composition to Mixes 18–20. The 5 C capacity was based on the weight of the coating rather than the active material, and the resistances were converted to conductances. The 5 C values were consistent and similar to the model values; the other three values were generally higher than the model predictions.
To perform a multi-objective optimisation, each value was converted to a desirability score between zero and one [26]. A score of zero means that the value was less than the minimum required value. A score of one means that the value was at or above the maximum target value. The ranges used were 5 C capacity (0–100 mA h g−1), adhesion (150–600 kPa), through-plane resistance (0–6 S cm−2), and ASI (0.02–0.06 S cm−2). These values were selected to emphasise the differences between the coatings and also to reflect practical requirements, e.g., the minimum adhesion value required for electrode handling. An overall desirability was calculated from the weighted geometric mean of the individual desirability scores. Previously, the weightings allocated to the four parameters were (3) 5 C, (2) adhesion and Rthru, and (1) ASI [4]. The calculated desirability scores are collected in Table 6.
The adhesion values were higher than expected, except for MIX19D1. The through-plane and ASI conductivities were all higher than predicted by the model. Comparing Mix 18 and Mix 20, there were differences in both the mixing and drying steps. Mix 20 had a higher viscosity than Mix 18, partly due to the higher solids content in the mix. As already stated, it is difficult to correlate mix viscosity with electrochemical performance. There are obvious differences between a hot plate set to a single temperature, with moderate air flow, and a three-zone dryer with high air flow. Mix 20 was actually better than Mix 18 on three of the four comparators, but the much greater adhesion of Mix 18 gave it a higher average desirability rating. This would have changed if the model used different ranges or weightings.
The main differences between Mix 19 and Mix 20 were due to the drying conditions after coating. The standard model for lithium ion electrode drying involves two parts: sedimentation of the active material particles, followed by evaporation of the remaining solvent [36,37]. The binder and conductive carbon are both still mobile during the second part. The solvent evaporation rate is known to influence the morphology of the coating [11], and hence the performance of the electrode [10]. Drying at higher temperatures (Mix19D1) produced a low interface resistance but very low adhesion. The best temperature profiles (Mix20D3) had lower temperatures and a more uniform profile through the three drying zones. There were also differences between the 1 L and 10 L Eirich mixers. The 10 L Eirich can impart more energy to the mix; it is not limited by the power of the motor and has a cooling system to cope with the extra energy. Despite the cooling system, slightly higher temperatures were recorded during the preparation of Mix 20, compared with Mix 19.
The reasons why Mix 18 outperformed the model are less easy to explain. Apparently, small differences in experimental technique can make big differences to the coating morphology, and hence the electrode performance. This could be due to changes in laboratory temperature or humidity, or to using a different component, e.g., a new bottle of carbon nano-tubes, or a new roll of aluminium foil.

4. Discussion

A lithium iron phosphate mixing, coating and cell-making process was successfully scaled up. The mixing step was converted from a (non-scalable) planetary mixer to a (scalable) rotating pan mixer at thirty times the scale. The coating and calendering steps used reel-to-reel equipment rather than single-sheet versions. Cell making was moved from coin cells to single-layer pouch cells, and then multi-layer pouch cells, with a three-hundred-fold increase in cell capacity. The main scaling-up challenge was in selecting the optimum temperature profile for the three-zone coater, which was most successful on the third iteration. Scaling up from coin cells to multi-layer pouch cells actually improved the cycle life and consistency of cells on cycling tests.
The mix composition was based on an optimised formulation from a previous design of experiments study. Most of the coatings outperformed the predictions of a model based on the earlier DoE data. The exception was a coating that was dried at too high a temperature, leading to very poor coating adhesion. Unexpected changes are frequently encountered during scaling-up activities and are the reason for adopting a systematic approach.
The rate performance in half-cell coin cells was very consistent for all the coatings. Multi-layer pouch cells outperformed single-layer pouch cells at higher discharge rates, due to the improved reaction kinetics with the higher internal cell temperature. The MLP cells also had slightly better capacity retention on cycling than the SLP cells. Both pouch cell types were better than full-cell coin cells on cycling. The latter also showed more spread in capacity, due to the tight tolerances on anode: cathode alignment in coin cells.

Supplementary Materials

The following supporting information can be downloaded at: https://www.mdpi.com/article/10.3390/batteries9100518/s1. Figure S1. Mixing protocols in Thinky® and Eirich mixers, Figure S2. Data recorded during Eirich mixing processes, Figure S3. Half-cell coin cell voltages during formation cycle, Figure S4. Full-cell coin cell voltages during formation cycle, Figure S5. SLP and MLP cell voltages during formation cycle, Figure S6. Results from formation cycles first cycle loss, Figure S7. Coin capacities during conditioning cycles before rate tests, Figure S8. Comparison of rate test capacities in different cell formats, Figure S9. Cell voltages during rate tests, Figure S10. Published rate test results, Figure S11. ASI measurements during discharge pulses, Figure S12. Discharge capacities and efficiencies during coin cell cycling tests, Figure S13. Capacity retention values for half-cell coin cell cycling tests, Figure S14. Impedance spectra for coin cells, Figure S15. Viscosity measurement results (I), Figure S16. Viscosity measurement results (II), Figure S17. Comparison of resistance values before and after calendering, Figure S18. Selected SEM images of coatings, Table S1. Cell properties comparison, Table S2. Averaged cell results, Table S3. Summary of resistance measurements, Table S4. Averaged resistivity measurements (uncalendered), Table S5. Averaged resistivity measurements (calendered, 500 um), Table S6. Averaged resistivity measurements (calendered, 495 um), Table S7. Averaged resistivity measurements (calendered, 485 um or “zero gap”), Table S8. Model input parameters, Table S9. Output ranges and desirability scores, Table S10. Multi-linear regression coefficients.

Author Contributions

Conceptualization, All; methodology, G.A. and M.H.; software, R.H.; formal analysis, G.A., R.H. and M.L.; investigation, G.A., D.D. and R.H.; resources, M.C. and J.M.; writing—original draft preparation, M.L.; writing—review and editing, All; supervision, M.C. and J.M.; funding acquisition, J.M. All authors have read and agreed to the published version of the manuscript.

Funding

This research was funded by the Faraday Institution, FIRG015, as part of the Nextrode project.

Data Availability Statement

There are no publicly archived datasets associated with this work.

Acknowledgments

The authors would like to thank Sajedeh Haghi, Dan Atkinson, Matthew Capener and members of the WMG Battery Scale-up team, for support and helpful discussions.

Conflicts of Interest

The authors declare no conflict of interest.

References

  1. Bockholt, H.; Indrikova, M.; Netz, A.; Golks, F.; Kwade, A. The interaction of consecutive process steps in the manufacturing of lithium ion battery electrodes with regard to structural and electrochemical properties. J. Power Sources 2016, 325, 140–151. [Google Scholar] [CrossRef]
  2. Li, J.; Fleetwood, J.; Hawley, W.B.; Kays, W. From materials to cell: State of the art and prospective technologies for lithium ion battery electrode processing. Chem. Rev. 2022, 122, 903–956. [Google Scholar] [CrossRef] [PubMed]
  3. Grant, P.S.; Greenwood, D.; Pardikar, K.; Smith, R.; Entwistle, T.; Middlemiss, L.A.; Murray, G.; Cussen, S.A.; Lain, M.J.; Capener, M.J.; et al. Roadmap on lithium ion battery manufacturing research. J. Phys. Energy 2022, 4, 042006. [Google Scholar] [CrossRef]
  4. Apachitei, G.; Hidalgo, M.; Dogaru, D.; Lain, M.J.; Heymer, R.; Marco, J.; Copley, M. Optimisation of industrially relevant electrode formulations for LFP cathodes in lithium ion cells. Batteries 2023, 9, 192. [Google Scholar] [CrossRef]
  5. Wang, M.; Dang, D.; Meyer, A.; Arsenault, R.; Cheng, Y.-T. Effects of the mixing sequence on making lithium ion battery electrodes. J. Electrochem. Soc. 2020, 167, 100518. [Google Scholar] [CrossRef]
  6. Schmitt, M.; Baunach, M.; Wengeler, L.; Peters, K.; Junges, P.; Scharfer, P.; Schabel, W. Slot-die processing of lithium ion battery electrodes—Coating window characterization. Chem. Eng. Proc. 2013, 68, 32–37. [Google Scholar] [CrossRef]
  7. Porcher, W.; Lestriez, R.; Jouanneau, S.; Guyomard, D. Design of aqueous processed thick LFP composite electrodes for high energy lithium battery. J. Electrochem. Soc. 2009, 156, A133–A144. [Google Scholar] [CrossRef]
  8. Reynolds, C.D.; Hare, S.D.; Slater, P.R.; Simmons, M.J.H.; Kendrick, E.E. Rheology and structure of lithium ion battery electrode slurries. Energy Technol. 2022, 10, 2200545. [Google Scholar] [CrossRef]
  9. Lee, G.-W.; Ryu, J.H.; Han, W.; Ahn, K.H.; Oh, S.M. Effect of slurry preparation process on electrochemical performances of LCO composite electrode. J. Power Sources 2010, 195, 6049–6054. [Google Scholar] [CrossRef]
  10. Hein, S.; Danner, T.; Westhoff, D.; Prifling, B.; Scurtu, R.; Kremer, L.; Hoffmann, A.; Hilger, A.; Osenberg, M.; Manke, I.; et al. Influence of conductive additives and binder on the impedance of lithium ion battery electrodes: Effect of morphology. J. Electrochem. Soc. 2020, 167, 013546. [Google Scholar] [CrossRef]
  11. Gören, A.; Cintora-Juarez, D.; Martins, P.; Ferdov, S.; Silva, M.M.; Tirado, J.L.; Costa, C.M.; Lanceros-Méndez, S. Influence of solvent evaporation rate in the preparation of carbon coated LFP cathode films on battery performance. Energy Technol. 2016, 4, 573–582. [Google Scholar] [CrossRef]
  12. Schreiner, D.; Oguntke, M.; Günther, T.; Reinhart, G. Modelling of the calendering process of NMC-622 cathodes in battery production analysing machine materials process structure correlations. Energy Technol. 2019, 7, 1900840. [Google Scholar] [CrossRef]
  13. Billot, N.; Günther, Y.; Schreiner, D.; Stahl, R.; Kranner, J.; Beyer, M.; Reinhart, G. Investigation of the adhesion strength along the electrode manufacturing process for improved lithium ion anodes. Energy Technol. 2020, 8, 1801136. [Google Scholar] [CrossRef]
  14. van Bommel, A.; Divigalpitiya, R. Effect of calendering LFP electrodes. J. Electrochem. Soc. 2012, 159, A1791–A1795. [Google Scholar] [CrossRef]
  15. Baunach, M.; Jaiser, S.; Schmelzle, S.; Nirschl, H.; Scharfer, P.; Schabel, W. Delamination behaviour of lithium ion battery anodes: Influence of drying temperature during the electrode processing. Dry. Technol. 2016, 34, 462–473. [Google Scholar] [CrossRef]
  16. ELECTRODE RESISTANCE MEASUREMENT SYSTEM RM2610. Available online: https://www.hioki.com/global/products/resistance-meters/resistance/id_6740 (accessed on 11 September 2023).
  17. Heenan, T.M.M.; Tan, C.; Hack, J.; Brett, D.J.L.; Shearing, P.R. Developments in X-ray tomography characterisation for electrochemical devices. Mater. Today 2019, 31, 70–85. [Google Scholar] [CrossRef]
  18. Nguyrn, T.-T.; Villanova, J.; Su, Z.; Tucoulou, R.; Fleutot, B.; Delobel, B.; Delacourt, C.; Demortière, A. 3D quantification of microstructural properties of NMC-532 high energy density electrodes by X-ray holographic nano-tomography. Adv. Energy Mater. 2021, 11, 2003529. [Google Scholar] [CrossRef]
  19. Qi, X.; Blizanac, B.; DuPasquier, A.; Oljaca, M.; Li, J.; Winter, M. Understanding the influence of conductive carbon additives surface area on the rate performance of LFP cathodes for lithium ion batteries. Carbon 2013, 64, 334–340. [Google Scholar] [CrossRef]
  20. Meyer, C.; Bockholt, H.; Haselrieder, W.; Kwade, A. Characterisation of the calendering process for compaction of electrodes for lithium ion batteries. J. Mater. Process. Technol. 2017, 249, 172–178. [Google Scholar] [CrossRef]
  21. Bridgewater, G.; Capener, M.J.; Brandon, J.; Lain, M.J.; Copley, M.; Kendrick, E. A comparison of lithium ion cell performance across three different cell formats. Batteries 2021, 7, 38. [Google Scholar] [CrossRef]
  22. Ahsan, Z.; Ding, B.; Cai, Z.; Wen, C.; Yandg, W.; Ma, Y.; Zhang, S. Recent progress in capacity enhancement of LFP cathodes for lithium ion batteries. J. Electrochem. Energy Convers. Storage 2021, 18, 01080101–01080118. [Google Scholar] [CrossRef]
  23. Balakrishnan, N.T.M.; Paul, A.; Krishnan, M.A.; Das, A.; Raphaez, L.R.; Ahn, J.-H.; Fatima, J.J.; Prasanth, R. LFP as high performance cathode material for lithium ion batteries. Environ. Chem. A Sustain. World 2021, 62, 35–73. [Google Scholar] [CrossRef]
  24. Gören, A.; Costa, C.M.; Silva, M.M.; Lanceros-Méndez, S. State of the art and open questions on cathode preparation based on carbon coated LF. Compos. Part B Eng. 2015, 83, 333–345. [Google Scholar] [CrossRef]
  25. Weichert, A.; Göken, V.; Fromm, O.; Beuse, T.; Winter, M.; Börner, M. Strategies for formulation optimisation of composite positive electrodes for lithium ion batteries based on layered oxide, spinel and olivine type active materials. J. Power Sources 2022, 551, 232179. [Google Scholar] [CrossRef]
  26. Derringer, G.; Suich, R. Simultaneous optimisation of several response variables. J. Qual. Technol. 1980, 12, 214–219. [Google Scholar] [CrossRef]
  27. Kornas, T.; Wittmann, D.; Daub, R.; Meyer, O.; Weihs, C.; Thiede, S.; Hermann, C. Multi-criteria optimisation in the production of lithium ion batteries. Procedia Manuf. 2020, 43, 720–727. [Google Scholar] [CrossRef]
  28. Gallagher, K.G.; Nelson, P.A.; Dees, D.W. Simplified calculation of the area specific impedance for battery design. J. Power Sources 2011, 196, 2289–2297. [Google Scholar] [CrossRef]
  29. Zheng, H.; Li, J.; Song, X.; Liu, G.; Battaglia, V.S. A comprehensive understanding of electrode thickness effects on the electrochemical performance of lithium ion battery cathodes. Electrochim. Acta 2012, 71, 258–265. [Google Scholar] [CrossRef]
  30. Li, Y.; El Gabaly, F.; Ferguson, T.D.; Smith, R.B.; Bartelt, N.C.; Sugar, J.D.; Fenton, K.R.; Cogswell, D.A.; Kilcoyne, A.L.D.; Tyliszczak, T.; et al. Current induced transition from particle-by-particle to concurrent intercalation in phase separating battery electrodes. Nat. Mater. 2014, 13, 1149–1156. [Google Scholar] [CrossRef]
  31. Liu, H.; Kazemiabnavi, S.; Grenier, A.; Vaughan, G.; Di Michiel, M.; Polzin, B.J.; Thornton, K.; Chapman, K.W.; Chupas, P.J. Quantifying reaction and rate heterogeneity in battery electrodes in 3D through operando X-ray diffraction computed tomography. Appl. Mater. Interfaces 2019, 11, 18386–18394. [Google Scholar] [CrossRef]
  32. Wang, F.; Yang, K.; Ge, M.; Wang, J.; Wang, J.; Xiao, X.; Lee, W.-H.; Li, L.; Tang, M. Reaction heterogeneity in LFP agglomerates and the tole of intercalation induced stress. ACS Energy Lett. 2022, 7, 1648–1656. [Google Scholar] [CrossRef]
  33. Liu, P.; Wang, J.; Hicks-Garner, J.; Sherman, E.; Soukiazian, S.; Verbrugge, M.; Tataria, H.; Musser, J.; Finamore, P. Aging mechanisms of LFP batteries deduced by electrochemical and structural analyses. J. Electrochem. Soc. 2010, 157, A499–A507. [Google Scholar] [CrossRef]
  34. Yang, F.; Wang, D.; Zhao, Y.; Tsui, K.-L.; Bae, S.J. A study of the relationship between coulombic efficiency and capacity degradation of commercial lithium ion batteries. Energy 2018, 145, 486–495. [Google Scholar] [CrossRef]
  35. Wang, L.; Qiu, J.; Wang, X.; Chen, L.; Cao, G.; Wang, J.; Zhang, H.; He, X. Insights for understanding multiscale degradation of LFP cathodes. eScience 2022, 2, 125–137. [Google Scholar] [CrossRef]
  36. Jaiser, S.; Funk, L.; Baunach, M.; Scharfer, P.; Schabel, W. Experimental investigation into battery electrode surfaces: The distribution of liquid at the surface and the emptying of pores during drying. J. Colloid Interface Sci. 2017, 494, 22–31. [Google Scholar] [CrossRef] [PubMed]
  37. Stein, M.; Mistry, A.; Mukherjee, P.P. Mechanistic understanding of the role of evaporation in electrode processing. J. Electrochem. Soc. 2017, 164, A1616–A1627. [Google Scholar] [CrossRef]
Figure 1. Rate test results for (A) half-cell coin cells and (B) SLP and MLP full cells.
Batteries 09 00518 g001
Figure 2. Cycling results for SLP And MLP Cells, with (A) discharge capacities and (B) coulombic efficiencies.
Batteries 09 00518 g002
Figure 3. Capacity retention at four-hundred cycles.
Batteries 09 00518 g003
Figure 4. Viscosity measurements for three mixes with the same formulation.
Batteries 09 00518 g004
Figure 5. Adhesion test measurements.
Batteries 09 00518 g005
Figure 6. Variation in interface resistance with calendering conditions.
Batteries 09 00518 g006
Figure 7. Spider plot for coin cell test results.
Batteries 09 00518 g007
Table 1. LFP Cathode formulations (wt%).
ModelParameterLFPPVDFKS6LSWCNT
Mix04Experimental94.72.32.80.20
Mix06Experimental97.12.00.70.20
Mix11Experimental94.93.01.90.16
Mixture2 C, mA h g−195.81.22.80.20
Mixture + Process5 C, mA h g−196.71.12.00.20
Mixture + Process5 C, mA h94.92.12.80.20
Multi-objectiveFour parameters95.342.851.630.18
Mixes 18–20Experimental97.031.940.870.16
Table 2. LFP Coating and calendering conditions.
Mix I. D. TypeDryingCalendering Gap/μm
Mix 18 SingleHot plate496
Mix 19 SingleD1485–500
Mix 20Batteries 09 00518 i001SingleD2485–500
SingleD3485–500
DoubleD3“zero gap”
Table 3. Megtec coater drying conditions (°C).
ZoneD1D2D3
Z1 (upper)956575
Z1 (lower)1158595
Z2 (upper)1108080
Z2 (lower)130100100
Z3 (upper)1209085
Z3 (lower)150120105
Table 4. Calendering equipment.
ParameterSheetReel-to-Reel
Roll diameter/mm203305
Roll width/mm203310
Roll temperature/°C8585
Feed rate/m min−10.81.2
Table 5. Coating comparisons.
Mix5 C Discharge
/mA h g−1
Adhesion
/kPa
Rthru
/S cm−2
ASI
/S cm−2
Mix0680.24461.30.042
Mix1890.64737.90.051
Mix19D192.110014.60.052
Mix20D288.33798.20.048
Mix20D391.54019.70.052
MLR94.43631.70.039
Table 6. Desirability comparison.
Mix5 CAdhesionRthruASIAverage
Mix060.800.660.220.550.53
Mix180.910.721.000.780.86
Mix19D10.920.001.000.810.00
Mix20D20.880.511.000.710.77
Mix20D30.910.561.000.800.81
MLR0.940.470.290.480.54
Disclaimer/Publisher’s Note: The statements, opinions and data contained in all publications are solely those of the individual author(s) and contributor(s) and not of MDPI and/or the editor(s). MDPI and/or the editor(s) disclaim responsibility for any injury to people or property resulting from any ideas, methods, instructions or products referred to in the content.

